using connected vehicle technology to deliver timely warnings...
TRANSCRIPT

Using Connected Vehicle Technology to Deliver Timely Warnings to Pedestrians
Jodie M. Plumert, PhD Professor and Chair
Psychological & Brain Sciences University of Iowa
Joseph K. Kearney, PhD Professor and Associate Dean
Computer Science University of Iowa

Using Connected Vehicle Technology to Deliver Timely Warnings to Pedestrians
Joseph K. Kearney Associate Dean of Research & Infrastructure, Professor College of Liberal Arts & Sciences, Computer Science University of Iowa
Jodie M. Plumert Professor & Chair Psychological & Brain Sciences University of Iowa
A Report on Research Sponsored by the
SAFER-SIM University Transportation Center
U.S. Department of Transportation, Research and Innovative Technology Division
July 2016
DISCLAIMER
The contents of this report reflect the views of the authors, who are responsible for the facts and the
accuracy of the information presented herein. This document is disseminated under the sponsorship of
the U.S. Department of Transportation’s University Transportation Centers Program, in the interest of
information exchange. The U.S. Government assumes no liability for the contents or use thereof.

ii
Table of Contents
Table of Contents ....................................................................................................................................... ii
List of Figures ............................................................................................................................................ iv
List of Tables .............................................................................................................................................. v
Abstract ..................................................................................................................................................... vi
1 Introduction ......................................................................................................................................... 1
1.1 Problem Statement.................................................................................................................... 1
2 Background Literature ......................................................................................................................... 3
2.1 The Road-Crossing Task ............................................................................................................. 3
2.2 Approaches to Studying Road Crossing ..................................................................................... 3
2.2.1 Influence of Mobile Device Use on Risky Pedestrian Behavior .................................... 8
2.3 Dedicated Short-Range Communication ................................................................................... 9
3 The Current Investigation .................................................................................................................. 10
3.1 Objectives ................................................................................................................................ 10
3.2 Methods ................................................................................................................................... 11
3.2.1 Task ............................................................................................................................. 11
3.2.2 Experiment Design ...................................................................................................... 12
3.2.3 Apparatus ................................................................................................................... 12
3.2.4 Traffic Generation ....................................................................................................... 13
3.2.5 Texting ........................................................................................................................ 15
3.2.6 Cell Phone Alerts......................................................................................................... 16
3.2.7 Data Recording and Performance Variables............................................................... 17
3.2.8 Gaze Direction Estimation .......................................................................................... 19
3.2.9 Participants ................................................................................................................. 19
3.2.10 Procedure ................................................................................................................... 19
3.3 Results...................................................................................................................................... 20
3.3.1 Data Analysis Strategy and Performance Means ....................................................... 20
3.3.2 Gap Selection .............................................................................................................. 21

iii
3.3.3 Movement Timing ...................................................................................................... 23
3.3.4 Gaze Direction ............................................................................................................ 24
3.4 Discussion ................................................................................................................................ 26
References ............................................................................................................................................... 29

iv
List of Figures
Figure 2.1 – A bicyclist in the Hank Virtual Environments Laboratory ...................................................... 6
Figure 2.2 – The Hank Virtual Environments Laboratory Pedestrian Simulator ........................................ 8
Figure 3.1 – Photograph of person crossing a street in the pedestrian virtual environment
(the visual angles are correct from the viewpoint of the pedestrian) ..................................................... 11
Figure 3.2 – Perspective view of the roadway environment ................................................................... 13
Figure 3.3 – Distribution of gap sizes ....................................................................................................... 15
Figure 3.4 – Screenshot of a texting conversation with alert (Panel A shows a countdown
clock inside the cursor, and Panel B shows that it is safe to cross when the countdown
box changes from red to green upon the arrival of a safe gap) .............................................................. 17
Figure 3.5 – Logistic regression curves illustrating the likelihood of selecting a given gap ..................... 23
Figure 3.6 – Estimation of gaze direction for 2 s before and 2 s after initiation of road
crossing for control (top), texting (middle), and alert (bottom) conditions ............................................ 25

v
List of Tables
Table 3.1 – A summary of means and standard deviations for all performance variables for
the control, texting, and alert groups ...................................................................................................... 21

vi
Abstract
Pedestrian injuries and deaths caused by collisions with motor vehicles are on the rise in the U.S.
One factor that may increase the risk of such collisions is pedestrian mobile device use. Both
field observations and controlled experiments indicate that pedestrian road-crossing behavior is
impaired by texting or talking on a mobile device. Despite the importance of the problem,
relatively little is known about effective interventions to reduce the harmful effects of mobile
device use on pedestrian road-crossing behavior. The goal of this project was to use connected
vehicles technology to deliver warnings to pedestrians via their mobile devices. To safely and
systematically study this problem, we conducted an experiment in a large-screen immersive
virtual environment to evaluate how texting pedestrians respond to permissive traffic alerts
delivered via their cell phone. We developed a cell phone app that delivered information to
texting pedestrians about when traffic conditions permit safe crossing. We compared gap
selection and movement timing in three groups of pedestrians: texting, texting with alerts, and
no texting (control). Participants in the control and alert groups chose larger gaps and were
more discriminating in their gap choices than participants in the texting group. Both the control
and alert groups had more time to spare than the texting group when they exited the roadway
even though the alert group timed their entry relative to the lead car less tightly than the
control and texting groups. By choosing larger gaps, participants in the alert group were able to
compensate for their poorer timing of entry, resulting in a margin of safety that did not differ
from those who were not texting. However, they also relied heavily on the alert system and paid
less attention to the roadway. The project demonstrates both the potential and the potential
pitfalls of assistive technologies based on Vehicle-to-Pedestrian (V2P) communications
technology for mitigating pedestrian–motor vehicle crashes.

1
Using Connected Vehicle Technology to Deliver Timely Warnings to Pedestrians
1 Introduction
1.1 Problem Statement
Pedestrian injuries and deaths caused by motor vehicle collisions are a major public health concern
worldwide. In the U.S., pedestrians were among the few categories of road users in which deaths rose in
the most recently released traffic safety data from the National Highway Traffic Safety Administration
[1]. In 2014 alone, 65,000 pedestrians were injured, and 4,884 pedestrians were killed in traffic crashes.
Along with children, adolescents and young adults are a particularly vulnerable segment of pedestrians.
Teenagers between the ages of 15-19 account for 27% of the U.S. population under the age of 19, but
represent 51% of the pedestrian deaths under the age of 19 [2].
The role of distraction as a contributing factor to vehicle crashes has gained heightened attention in
recent years. Numerous studies have shown that driver attention is impaired by the use of mobile
devices such as cell phones [3, 4]. While the deleterious influence of texting and phone conversation on
driving is well documented, there is relatively little research on the dangers of using a mobile device as a
pedestrian. Recent studies have shown that pedestrians exhibit riskier road-crossing behaviors when
texting or talking on a cell phone [5, 6, 7, 8, 9]. The combination of drivers and pedestrians being
distracted by mobile devices creates a particularly lethal mix.
The source of the distraction (mobile technology) also offers a potential means of remediation to
improve pedestrian road-crossing safety through integrating pedestrians into the roadway
communication loop. Advances in connected vehicles technology allow cars to “communicate” with
each other through Dedicated Short-Range Communication (DSRC). This technology can also allow
smartphones and vehicles to exchange information about their locations and movements, referred to as
vehicle-to-pedestrian (V2P) communication. While progress is being made on the development of the
technology to support V2P communication, implementation of this technology is far from simple. A
major problem is incorporating human users into the roadway communication loop. In particular, little is
known about how information about traffic can be most effectively presented to pedestrians through
mobile devices, and whether pedestrians will trust and attend to this information. The goal of this
project was to develop and test technologies for delivering traffic warnings to pedestrians’ mobile
devices to increase their road-crossing safety.
2
Using Connected Vehicle Technology to Deliver Timely Warnings to Pedestrians
2 Background Literature
2.1 The Road-Crossing Task
Road crossing is a complex perceptual-motor task, even when an individual is crossing alone and faces
no distractions. The first problem is to select a gap in traffic that affords crossing, and the second is to
coordinate movement through the gap. Gap selection and movement timing are particularly important
in more challenging situations, such as when the cross traffic is relatively dense and does not stop [10,
11]. A gap theoretically affords crossing if the individual’s crossing time is less than the temporal size of
the gap [12]. To successfully act on a gap affordance, individuals must begin moving so that they cut in
relatively closely behind the lead vehicle in the gap, while crossing as quickly as necessary. The task
requirements and complexities accumulate when other factors such as social influences, complicated
intersections, limited visibility, turning vehicles, and distracting tasks (e.g., texting) are also in play.
2.2 Approaches to Studying Road Crossing
There are three basic approaches to studying the factors that put pedestrians at risk for collisions with
motor vehicles – epidemiological, observational, and controlled experimental research. Epidemiological
research has provided a great deal of information about the factors associated with pedestrian injuries
and deaths caused by vehicle crashes [13, 2]. This includes the characteristics of the individuals involved
in the crash (e.g., age, gender, ethnicity) and the properties of the places where crashes most commonly
happen (e.g., intersection vs. mid-block crossings, urban vs. rural roads), along with the time of day and
whether alcohol was involved. Studies reveal that pedestrian behaviors are often a contributing factor
to collisions. For example, an analysis of contributory factors for pedestrian collisions in Great Britain
concludes that in 78% of the incidents pedestrian behavior played a key role [14]. The most common
factor was failure to look before crossing (60%). While epidemiological studies are important for
identifying individual characteristics and behaviors that may contribute to injury risk, these studies do
not actually study the processes that give rise to risky behavior nor do they allow investigation of
possible interventions to make pedestrian road crossing safer.
Observational research examines the typical behaviors of pedestrians in real environments by
unobtrusively observing them in everyday traffic situations. Observational studies have been used to
examine how both individuals and groups cross roads with traffic. For example, one recent study
recorded over 34,000 observations of teens and pre-teens crossing streets in front of schools [2]. While
observational studies capture natural behavior, it is difficult to infer the underlying causes of collisions
from naturalistic observation. In order to devise interventions to improve pedestrian safety, it is
important to conduct controlled experiments testing hypotheses about the root causes of collisions.
Controlled experiments have been used to systematically investigate the factors that may lead to risky
road-crossing behavior. However, it is impossible to conduct controlled experiments of pedestrians
crossing real roads with traffic without putting the participants at risk. Consequently, researchers have
devised a number of methods to create safe proxies for real road crossing that can be used as a basis for
experimental studies. Much of this work has focused on children because they are at high risk for
pedestrian injuries [13]. In a classic early study, Lee et al. [12] devised a road-crossing task in which 5- to
9-year-old children crossed a “pretend road” set up parallel to an actual road. Children watched the cars
on the actual road and crossed the pretend road when they felt that they could safely reach the other
side of the pretend road (i.e., before the oncoming vehicle crossed their line of travel on the real road).

3
Using Connected Vehicle Technology to Deliver Timely Warnings to Pedestrians
Although the children were generally cautious, they sometimes accepted gaps that were too short. Had
children been crossing the actual road, they would have been hit on approximately 6% of their crossings.
Researchers have also begun to use virtual environment technology to study pedestrian road-crossing
behavior [15]. Seven- to 9-year-old children and adults stood on a pretend curb and watched two-way
moving traffic displayed on three large monitors. When they thought it was safe to cross, participants
stepped down off the curb onto a pressure plate that initiated the movement of an avatar in the virtual
environment. The avatar crossed the road at a constant speed (based on each participant’s own walking
speed) while participants watched. Children experienced significantly more hits and close calls than
adults, and also exhibited significantly longer movement initiation delays than did adults.
This work has yielded valuable information about road-crossing skills in children and adults. However,
these road-crossing tasks do not accurately replicate the experiences of pedestrians when they cross
real roads. The “pretend road” task developed by Lee et al. [12] involves having participants watch
traffic on a real road but cross a pretend road set up parallel to the real road. As a result, participants
are viewing the traffic from much farther away than they would if they were crossing the real road,
making it difficult to precisely time initiation of movement. The virtual road-crossing task developed by
Schwebel et al. [15] has participants cross roads from a third-person perspective. Although behavior in
this virtual road-crossing task is related to behavior in the “pretend road” task, participants cannot
adjust the speed of the avatar while it’s crossing the road, and they view the consequences of their
actions in the third person.
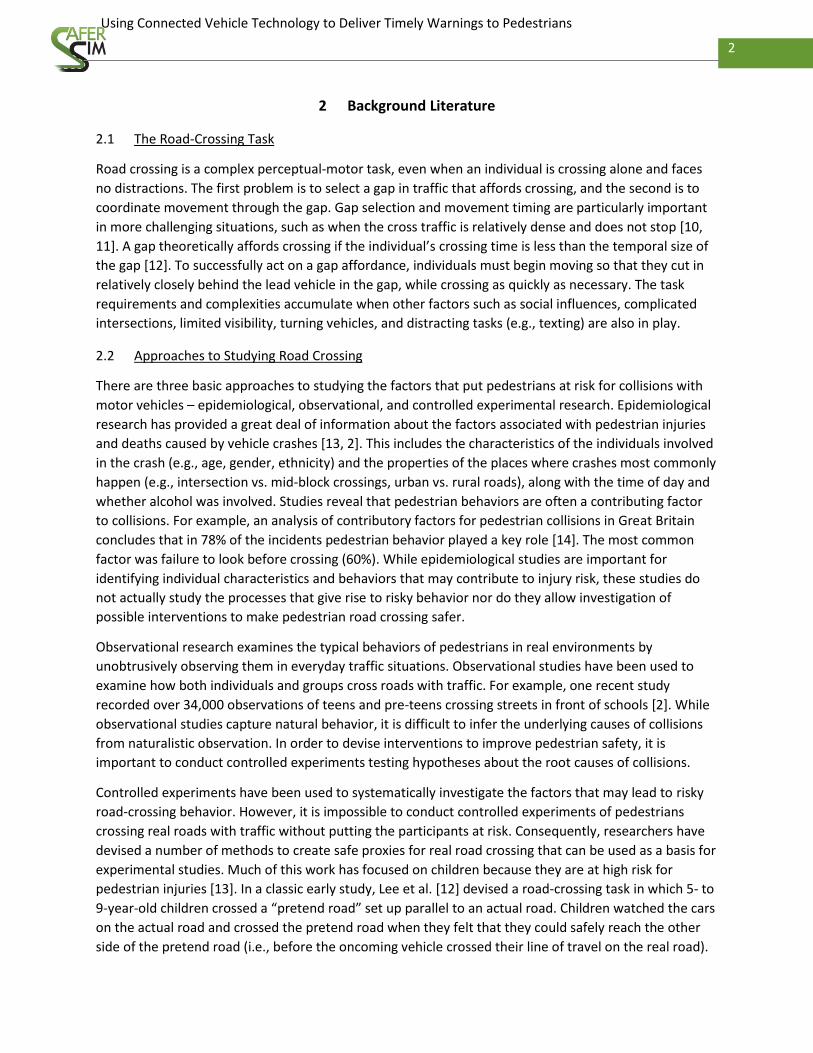
Our work eliminates these problems by using an immersive, interactive simulator to provide children
and adults with a first-person perspective of crossing roads [10, 11, 16, 17]. We’ve conducted an
extensive body of research on cyclist road crossing using a simulator that consists of an actual bike on a
stationary frame positioned in the middle of three large display screens (Figure 2.1).
4
Using Connected Vehicle Technology to Deliver Timely Warnings to Pedestrians
Figure 2.1 – A bicyclist in the Hank Virtual Environments Laboratory.
High-resolution, textured graphics are projected onto the front and side screens from behind and onto
the floor surface from above, resulting in full-surround visual imagery. The bicycle is instrumented to
record the steering angle of the front wheel and the speed of the rear wheel. Steering angle and wheel
speed measures are combined with virtual terrain information to render, in real-time, graphics
corresponding to the rider’s trajectory through the virtual environment. The rear wheel is also mated to
a friction-drive flywheel. The flywheel is connected to a torque motor, which generates an appropriate
dynamic force taking into account rider and bicycle mass and inertia, virtual terrain slope, ground
friction, and air resistance.
In our initial work, 10- and 12-year-olds and adults rode the bicycle through a virtual environment
consisting of a straight, residential street with six intersections [17]. At each intersection, a single stream
of cross-traffic approached from the left-hand side. Their task was to cross the intersections without
getting “hit” by a car. The results clearly showed that relative to adults, children’s gap choices and road-
crossing behavior were less finely matched. Children and adults chose the same size gaps, and yet
children delayed initiation of crossing relative to adults. This resulted in children having less time to
spare as they cleared the path of the approaching car. These differences suggest that immature
perceptual-motor skills may play a role in putting children at greater risk for car-bicycle collisions. We
have also examined how children and adults respond to more complex road-crossing situations, such as
high-density traffic [11]. As in other work [18, 19], we found that both children and adults took much
smaller gaps when faced with higher density traffic than lower density traffic. Moreover, after
experience with higher density traffic, participants continued to take tighter gaps at later intersections
with lower density traffic. These results show that high-density traffic presents substantial risks to both
child and adult riders, and that risky behavior in higher density traffic situations carries over to lower
density traffic situations. Overall, our program of research on child and adult cyclists’ road crossing have
revealed a number of important findings and illustrate the potential of using virtual reality as a
laboratory for conducting controlled experiments on road crossing without putting participants at risk
for injury.
With funding from the National Science Foundation Computing Research Infrastructure program, we
have recently built an immersive, large-screen pedestrian simulator to study how children and adults
cross roads with traffic. The simulator consists of three large screens placed at right angles relative to
one another, forming a three-walled room (Figure 2.2). Three high-resolution stereo projectors are used
to rear-project images onto each of the screens, providing the participant with over 270 degrees of
immersive visual imagery. A fourth projector is used to front-project an image onto the floor. The side
screens are 14.2 feet long, allowing a participant to physically walk across a one-lane virtual road.
Participant motions are tracked with an Optitrack optical tracking system. The viewpoint of the scene is
rendered for the participant’s viewpoint, giving a compelling sense of immersion in the environment.
This simulator provides participants with a highly realistic, first-person experience of physically crossing
roads.

5
Using Connected Vehicle Technology to Deliver Timely Warnings to Pedestrians
Figure 2.2 – The Hank Virtual Environments Laboratory Pedestrian Simulator.
2.2.1 Influence of Mobile Device Use on Risky Pedestrian Behavior
Both field observations and controlled experiments indicate that pedestrian road-crossing behavior is
impaired by mobile device use [5, 6, 7, 8, 9, 20]. The prevalence of mobile device usage while walking
appears to be on the rise, particularly in teens. An observational study of more than 34,000 students
crossing roads in front of schools found that one in five high school students and one in eight middle
school students were crossing the street distracted by a mobile device (most often texting on a phone,
39%) [2]. Other observational work by Thompson et al. [9] has shown that nearly one-third of 1,102
pedestrians observed crossing a road were performing some kind of distracting activity (e.g., listening to
music, sending text messages, talking on the phone). Hatfield and Murphy [5] also observed that
pedestrians using a mobile phone walked more slowly across the roadway, thereby increasing their
exposure to the traffic.
Recent controlled experiments by Schwebel and colleagues conducted in their virtual environment have
shown that using a mobile device impairs pedestrian road-crossing performance in a variety of ways [7,
8, 21, 20]. Young adults who were distracted by using a mobile device were more likely to be hit or have
close calls in a road-crossing task in the virtual environment. They also looked left and right less often
and looked away from the roadway more often. Together, these studies on pedestrians clearly show
that mobile device use impairs road-crossing performance.

6
Using Connected Vehicle Technology to Deliver Timely Warnings to Pedestrians
2.3 Dedicated Short-Range Communication
The source of the distraction (mobile technology) also offers a potential means of remediation to improve
safety and reduce the dangerous consequences of pedestrians crossing roads while texting by integrating
pedestrians into the roadway communication loop. Recent advances in connected vehicles technology
allow cars to “communicate” with each other through Dedicated Short-Range Communications (DSRC)
[22]. This vehicle-to-vehicle (V2V) communications technology holds great promise for improving traffic
safety by alerting drivers to road hazards and potential collisions with other vehicles, so much so that the
National Highway Transportation Safety Administration (NHTSA) announced plans to mandate DSRC for
all new light vehicles in the near future [23]. A number of recent efforts directed at bringing pedestrians
and bicyclists into the roadway communication network by incorporating DSRC into smartphones [24-26]
allows phones and vehicles to exchange information about their locations and movements—so-called
vehicle-to-pedestrian (V2P) communication. For example, pedestrians would be “visible” to drivers even
when they were out of sight behind an obstacle or in the dark. Qualcomm and Honda researchers
collaborated on the development of a mobile phone app that exchanges information with surrounding
vehicles and sends warnings to both the driver and the pedestrian/cyclist when a collision is imminent
[27].

7
Using Connected Vehicle Technology to Deliver Timely Warnings to Pedestrians
3 The Current Investigation
3.1 Objectives
While progress is being made on the development of the technology to support V2P communications,
little is known about how such information can be most effectively presented to pedestrians and whether
pedestrians will trust and attend to the information delivered through a mobile device. The primary goal
of this study was to examine how such information systems influence pedestrian road crossing. We
studied this question using our large-screen, immersive virtual environment, Hank, in which participants
physically walk across a lane of simulated traffic while texting on a cell phone (Figure 3.1). Most of the
research on V2P communications has focused on generating collision warnings—alerting both the driver
and the pedestrian to imminent collisions [28]. However, prediction of likely collisions between vehicles
and pedestrians is a challenging problem [27]. Pedestrians frequently stand at the edge of a road waiting
for a safe gap to cross. Cars driving by, even at high speeds, do not present a threat as long as pedestrians
remain off the road. However, a single step can put the pedestrian in harm’s way. Predicting such conflicts
in time for the driver, pedestrian, or both to react and avoid a collision is an enormously challenging
problem. If warnings are sent whenever a pedestrian is near the road, there is a danger that the frequency
of such alerts will be so high that they will be ignored. If warnings are sent only when the pedestrian steps
into traffic, there is the risk that it will come too late for evasive action.
An alternative to collision warning is to provide information to pedestrians about traffic conditions to
guide their decisions. Such systems have been examined to assist drivers on minor roads in choosing gaps
to cross major roads [26]. Using a driving simulator, they compared four different Intersection Decision
Support (IDS) systems that informed drivers when oncoming traffic made it unsafe to enter the major
road, including dynamic warnings and countdown clocks that showed the time to arrival of the next
vehicle. Results showed that all forms of the prohibitive information led to improved gap acceptance by
drivers as compared to a baseline condition in which there was simply a stop sign.
8
Using Connected Vehicle Technology to Deliver Timely Warnings to Pedestrians
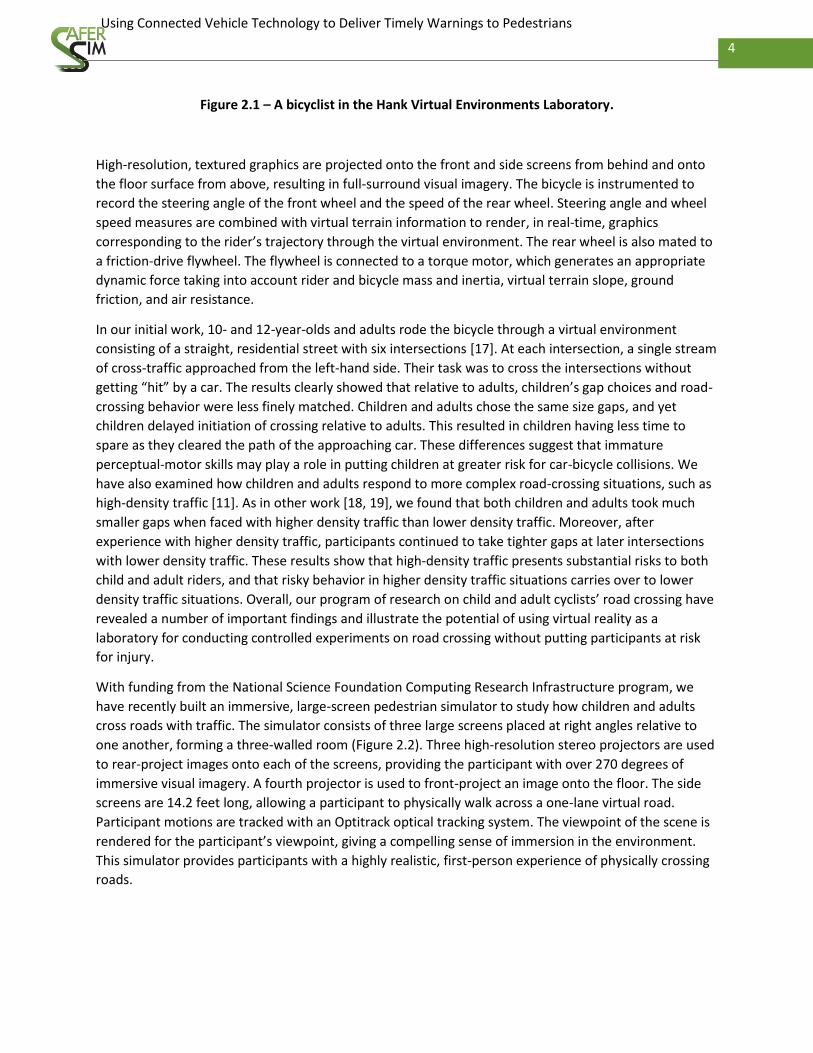
Figure 3.1 – Photograph of person crossing a street in the pedestrian virtual environment (the visual
angles are correct from the viewpoint of the pedestrian).
Here, we examine how permissive information influences pedestrian gap choices and crossing behavior.
A permissive information system provides information about when it is safe to cross as opposed to
information about when it is unsafe to cross. We present this information in two forms: a countdown
clock that indicates when the next opportunity to safely cross the road will occur and an audible alert
indicating that a safe gap is about to arrive at the intersection.
3.2 Methods
3.2.1 Task
We used a pedestrian road-crossing task to examine the effects of texting with and without alerts to
inform pedestrians about when it was safe to cross the road. Participants stood at the edge of a one-lane
road and watched a continuous stream of traffic coming from the left. Their goal was to safely cross the
road. Once they had selected a gap to cross, participants physically walked to the other side of the virtual
road. The traffic ceased to be generated after participants reached the other side of the road. Participants
then walked back to the starting place, and a new trial commenced.
3.2.2 Experiment Design
The experiment used a between-subjects design with three conditions: texting, alert, and control. In the
texting condition, participants continually received and responded to automated text messages
throughout the road-crossing session. The alert condition was identical to the texting condition except
that participants also received alerts on their cell phones informing them that a safe gap was
approaching. In the control condition, participants held a cell phone throughout the road-crossing
session but did not text or receive alerts.
3.2.3 Apparatus
The study was conducted using our large-screen virtual environment, Hank, which consists of three
screens placed at right angles relative to one another, forming a three-walled room (Figure 2.2). Three
DPI MVision 400 Cine 3D projectors rear-project high-resolution, textured graphics in stereo onto the
screens. An identical projector front-projects high-resolution stereo images onto the floor. Participants
wore Volfoni ActiveEyes stereo shutter glasses that were synchronized with the displays so that images
were alternately visible in the left and right eyes. This permitted us to show stereo images with the
correct perspective for each participant. The side screens are 14.2 feet long, which allowed participants
to physically walk across a one-lane virtual road. Reflective markers were mounted on the cell phone
and on a helmet worn by the participant. An OptiTrack motion capture system was used to determine
the position and orientation of the cell phone and the participant’s head based on the marker locations
viewed from 17 Flex 13 cameras surrounding the volume. The participant’s eye point was estimated
from the head data and used to render the scene for the participant’s viewpoint. The virtual
environment software is based on the Unity3D gaming platform. In-house code generated traffic and
recorded the positions and orientations of vehicles, the pedestrian, and the cell phone during the
experiment for later analysis.

9
Using Connected Vehicle Technology to Deliver Timely Warnings to Pedestrians
3.2.4 Traffic Generation
A top-down view of the roadway environment is shown in Figure 3.2. A stream of traffic traveled from left
to right on a one-lane road. Vehicles were generated from behind a building on the left-hand side of the
road, passed through the screen volume, and then disappeared behind a building to the right. The road
initially curved and then approached the participant along a straight section of roadway that was
perpendicular to the left screen. The length of the visible portion of the road was selected so that the tail
vehicle in the next gap always appeared before the lead vehicle passed the participant. Thus, participants
could always see the entire gap before they began to cross the road. Vehicles drove at a constant speed
of either 25 or 35 mph.
Figure 3.2 – Perspective view of the roadway environment.
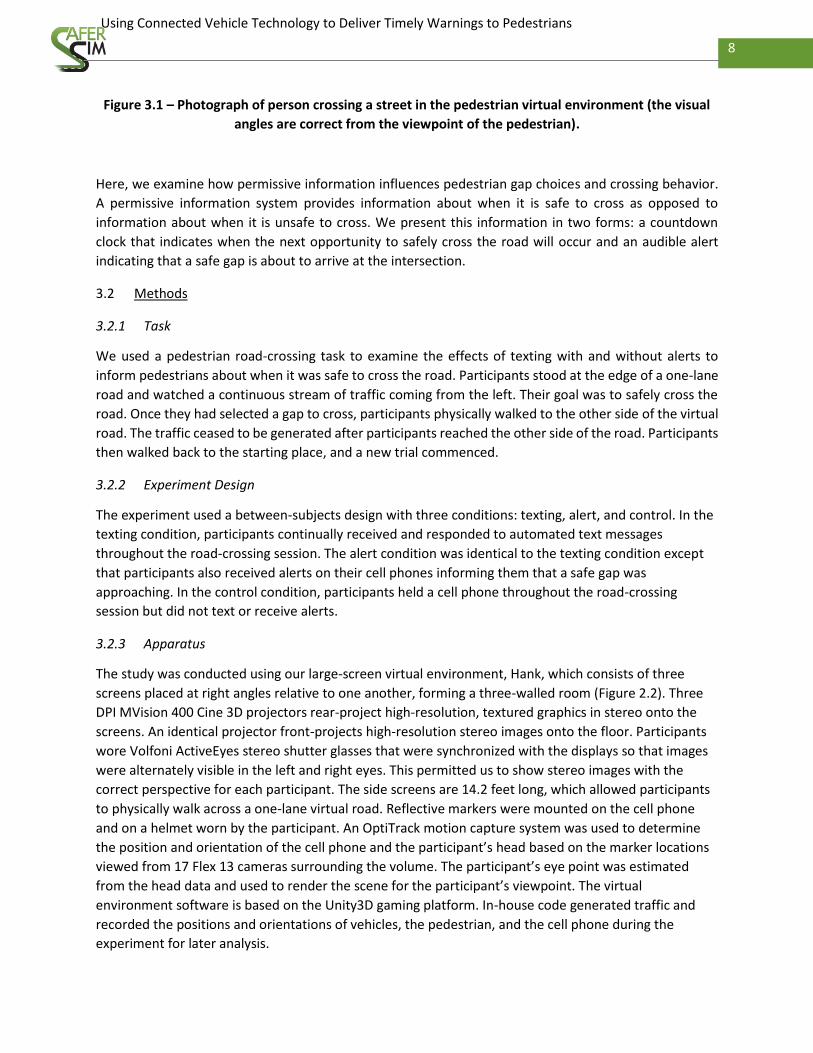
Vehicles were timed so that the temporal gap at the point of crossing (i.e., the time between the
moment the tail of the lead vehicle crossed the path of the participant and the moment the front of the
tail vehicle crossed the path of the participant) was one of five pre-selected gap sizes (2.5 s, 3.0 s, 3.5 s,
4.0 s, or 4.5 s). Note that the temporal and spatial gap between two vehicles with different speeds
changed continuously as the vehicles approached the intersection. To create moderately dense traffic,
10
Using Connected Vehicle Technology to Deliver Timely Warnings to Pedestrians
small gaps occurred more frequently than large gaps according to the distribution shown in
Figure 3.3.

11
Using Connected Vehicle Technology to Deliver Timely Warnings to Pedestrians
Figure 3.3 – Distribution of gap sizes.
3.2.5 Texting
An Android messenger application was developed in-house and installed on a cell phone. To minimize
the message exchange latency, the cell phone communicated with the master computer through a
wireless network using TCP/IP. To give the appearance of a natural conversation, messages sent to the
participant’s cell phone were shown as coming from our virtual environment, Hank. The conversation
began with a message from Hank introducing himself. Hank then asked a sequence of pre-recorded
questions, one at a time, waiting for the response to one question before sending the next message.
Participants were asked to respond to each question with a single reply. Participants were free to use
the swipe and auto-correction features. Participants were notified of the arrival of a new message by a
half-second vibration of the cell phone. Questions were grouped by topic and could be answered by a
short message. The following is an excerpt from a conversation between Hank and a participant:
…
Hank: What classes are you taking this semester?
Pedestrian: chemistry
Hank: What do you want to do when you get out of school?
Pedestrian: physical therapy
Hank: What is your least favorite class?

12
Using Connected Vehicle Technology to Deliver Timely Warnings to Pedestrians
Pedestrian: history
Hank: Why is that?
Pedestrian: its difficult for me to learn
Hank: What are some of your hobbies?
Pedestrian: i like to run and workout at the gym
Hank: What do you do in your free time?
Pedestrian: watch netflix
3.2.6 Cell Phone Alerts
In the alerting condition, participants were informed when a crossable gap (a gap of size 4.0 s or 4.5 s)
was approaching the crosswalk. Whenever a crossable gap was 10 seconds from the crosswalk, the
cellphone displayed a countdown clock in a red block that showed the time to arrival of the gap in half
seconds (Figure 3.4). Every half second, the countdown clock was decremented. The countdown clock
appeared inside the cursor to keep the timer in the pedestrian’s field of view. The cellphone notified the
pedestrian one second before the arrival of the gap with a “ding.” Once the gap reached the crosswalk,
the red box turned green and the counter disappeared.

13
Using Connected Vehicle Technology to Deliver Timely Warnings to Pedestrians
(A) (B)
Figure 3.4 – Screenshot of a texting conversation with alert (Panel A shows a countdown clock inside
the cursor, and Panel B shows that it is safe to cross when the countdown box changes from red to
green upon the arrival of a
safe gap).
3.2.7 Data Recording and Performance Variables
The master computer recorded the position and orientation of all movable entities in the virtual
environment, including the pedestrian’s head, the cell phone, and all vehicles on every time step. In
addition, it recorded the text messages sent to and received from participant along with the time step
that the message was sent or received. This method of data recording allowed us to reconstruct key
aspects of the experiment off-line. A 3D visualizer was developed in-house in Unity 3D to graphically
replay trials. This application enabled researchers to visualize the pedestrian motion and traffic from
different viewpoints (e.g., top-down, first-person, or third-person views) and navigate through the
entire recorded experiment using the play, pause, stop, fast-forward, and rewind buttons. In addition,
the visualizer automatically produced a record of the following performance variables:
1. Number of gaps seen: the number of gaps seen before crossing the roadway, including the gap
crossed (a measure of waiting).

14
Using Connected Vehicle Technology to Deliver Timely Warnings to Pedestrians
2. Gap taken: the size (in seconds) of the gap crossed.
3. Timing of entry: the time between the moment the rear end of the lead vehicle in the gap
passed the participant and the moment the participant entered the roadway.
4. Road-crossing time: the time it took the participant to cross the road (from the moment they
entered to road to the moment they exited the road).
5. Time to spare: the time between the moment the participant exited the road and the moment
the front of the tail car in the gap passed the participant.
6. Close call: a road crossing was classified as a close call if the time to spare was less than or equal
to 0.5 s.
7. Collisions: a road crossing was classified as a collision if an oncoming car hit the participant.
8. Attention to traffic: percentage of time the participant was looking at the traffic over a trial.
All measures were averaged across the 20 road-crossing trials to arrive at aggregate scores. We also
computed a variability of timing of entry score by calculating the standard deviation of each participant’s
timing of entry across all 20 test trials.
3.2.8 Gaze Direction Estimation
A learning algorithm was used to develop a method to estimate participant gaze from head position and
orientation, in order to determine participants’ attention to the traffic, the cell phone, and elsewhere.
Gaze classification is based on the position and orientation of the participant’s head relative to the cell
phone and the vehicles on the road. Training and test data sets were collected in which the viewer’s gaze
was known. The training data set served as the input to a support vector machine (SVM), which computed
parameters for classification of gaze direction from data recorded during the experiment trials. At each
moment of the simulation, the participant’s gaze is classified as either Looking at Traffic, Looking at the
Cell Phone, or Looking Elsewhere. The classification is based on a spherical coordinate system centered
on the participant’s eyepoint. Bounding boxes that surround the vehicles currently approaching the
participant and the cell phone are projected onto a sphere centered on the participant’s head along with
the participant’s facing direction. The model returned by the SVM achieved 93% correct classification with
the test data set.
3.2.9 Participants
A total of 48 undergraduate students participated in this study. Participants were recruited through the
Elementary Psychology course at the University of Iowa and earned course credit for their participation.
There were 16 participants (8 females and 8 males) in each of the three groups: control, texting, and alert.
3.2.10 Procedure
Participants were first fitted with a tracking helmet, shutter glasses, and a harness that was connected
to a post at the back of the VE to prevent them from walking into the front screen. Participants were
then given a brief introduction to the virtual neighborhood and instructed to cross the roadway as they
would in the real world. Each trial began with the road clear of traffic. A continuous stream of vehicles
approached from the left-hand side. The first vehicle in the stream was always purple. Participants were
asked to wait until the purple car passed in order to prevent them from crossing the empty space in
front of the stream of traffic. They were told that they could wait as long as they wished before
attempting to cross the road. Once participants reached the sidewalk on the other side of the road,
15
Using Connected Vehicle Technology to Deliver Timely Warnings to Pedestrians
traffic generation ceased, allowing the participant to return to the starting position. Once the participant
had returned to the starting position, traffic was again generated in the same fashion as described
above. Each participant performed three practice crossings followed by 20 test trials. After finishing the
test trials, participants filled out a demographics questionnaire and were debriefed about road-crossing
safety. The study took approximately 30 minutes to complete.
Participants in the control group were asked to hold the cell phone in their hand. However, the cell
phone was turned off throughout the experiment. Participants in the texting group were asked to
respond to the texts they received as quickly as they could. On the first practice trial, they crossed
without texting; on the remaining two practice trials they received texts and responded to them.
Participants in the alert group performed one practice trial without texts or alerts. On the second
practice trial, they received texts and responded to them without alerts. Prior to the third practice trial,
they were given a brief description of how the alert system worked. They were instructed to wait for
three safe gaps (4.0 s and 4.5 s) to pass by to give them experience with the alerting system. They then
performed a single practice trial with the alert system activated. They were given no explicit instructions
about how to use the alerts or whether or not to cross the road based on the alerts. All participants
performed 20 test crossings.
3.3 Results
3.3.1 Data Analysis Strategy and Performance Means
All dependent measures were analyzed in one-way analyses of variance (ANOVAs) with condition (control,
texting, alert) as the between-subjects factor. Post-hoc tests were conducted using Fischer’s Least Square
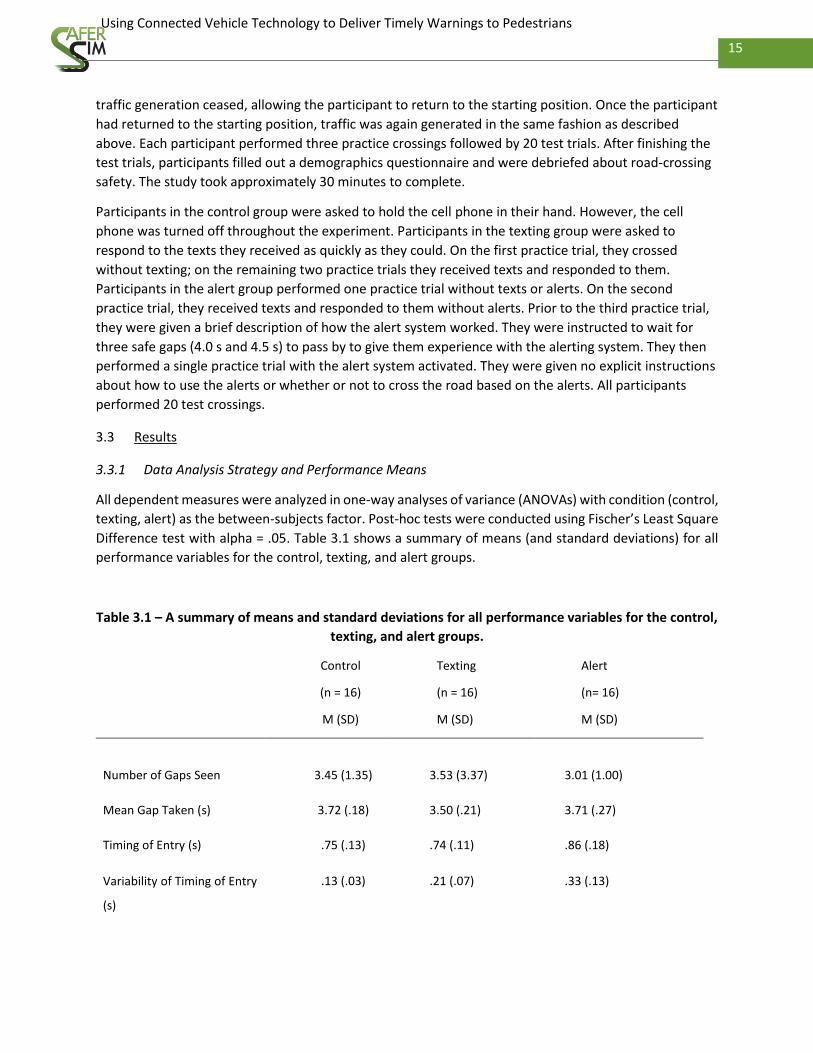
Difference test with alpha = .05. Table 3.1 shows a summary of means (and standard deviations) for all
performance variables for the control, texting, and alert groups.
Table 3.1 – A summary of means and standard deviations for all performance variables for the control,
texting, and alert groups.
Control
(n = 16)
M (SD)
Texting
(n = 16)
M (SD)
Alert
(n= 16)
M (SD)
Number of Gaps Seen 3.45 (1.35) 3.53 (3.37) 3.01 (1.00)
Mean Gap Taken (s) 3.72 (.18) 3.50 (.21) 3.71 (.27)
Timing of Entry (s) .75 (.13) .74 (.11) .86 (.18)
Variability of Timing of Entry
(s)
.13 (.03) .21 (.07) .33 (.13)

16
Using Connected Vehicle Technology to Deliver Timely Warnings to Pedestrians
Road Crossing Time (s) 2.11 (.18) 2.11 (.29) 2.03 (.17)
Time to Spare (s) .88 (.28) .66 (.32) .84 (.26)
Collisions (%) 5 (.09) 14 (.18) 6 (.07)
Close Calls (%) 18 (.15) 25 (.12) 19 (.13)
Attention to Traffic (%) 96.7 (3.12) 45.5 (25.47) 23.5 (15.42)
3.3.2 Gap Selection
Gaps seen: Analysis of the number of gaps seen did not reveal an effect of condition, F (2,45) = .45,
ns, indicating that participants in the three groups waited a similar amount of time before crossing.
Mean gap size taken: Analysis of the average gap size taken revealed a significant effect of condition, F
(2,45) = 5.13, p = .01. Compared to those in the texting condition, participants in the control and alerting
conditions took significantly larger gaps for crossing. However, participants in the alert and control
conditions did not differ significantly from one another.
Likelihood of taking a gap: Mixed-effects regression analyses were used to determine whether the
likelihood of choosing a given gap differed significantly between the control, texting, and alert
conditions. Participants in all conditions were more likely to choose larger gaps than smaller gaps, z =
10.79, p < .001, with the average odds of choosing a gap increasing by 12.55 with each half-second
increase in gap size. Participants in the texting group had a significantly lower gap-acceptance threshold
than those in than the control group; they were 3.03 times more likely to choose a given gap than the
control group, z = 2.44, p = .01. However, gap-acceptance thresholds in the alert group did not differ
significantly from the control group. Additionally, participants in the texting group had a significantly
lower gap-acceptance threshold than those in than the alert group; they were 4.38 times more likely to
choose a given gap, z = -3.32, p = .001.
In addition to threshold differences, condition moderated gap size slope differences among the three
groups. There was a significant difference between the control and texting conditions, z = -2.55, p = .01,
with those in the texting condition, z = 8.74, p < .001, being less discriminating in their gap selection,
crossing a larger proportion of small gaps and a smaller proportion of large gaps than those in the
control group, z = 13.89, p < .001. The control and alert groups were not significantly different in this
respect, z = 1.21, ns. There was also a significant difference in gap selection sensitivity between the
texting and alert conditions, z = 3.65, p < .001, such that those in the texting condition, z = 8.74, p < .001,
were likely to take more of the small gaps and fewer of the large gaps than those in the alert condition, z
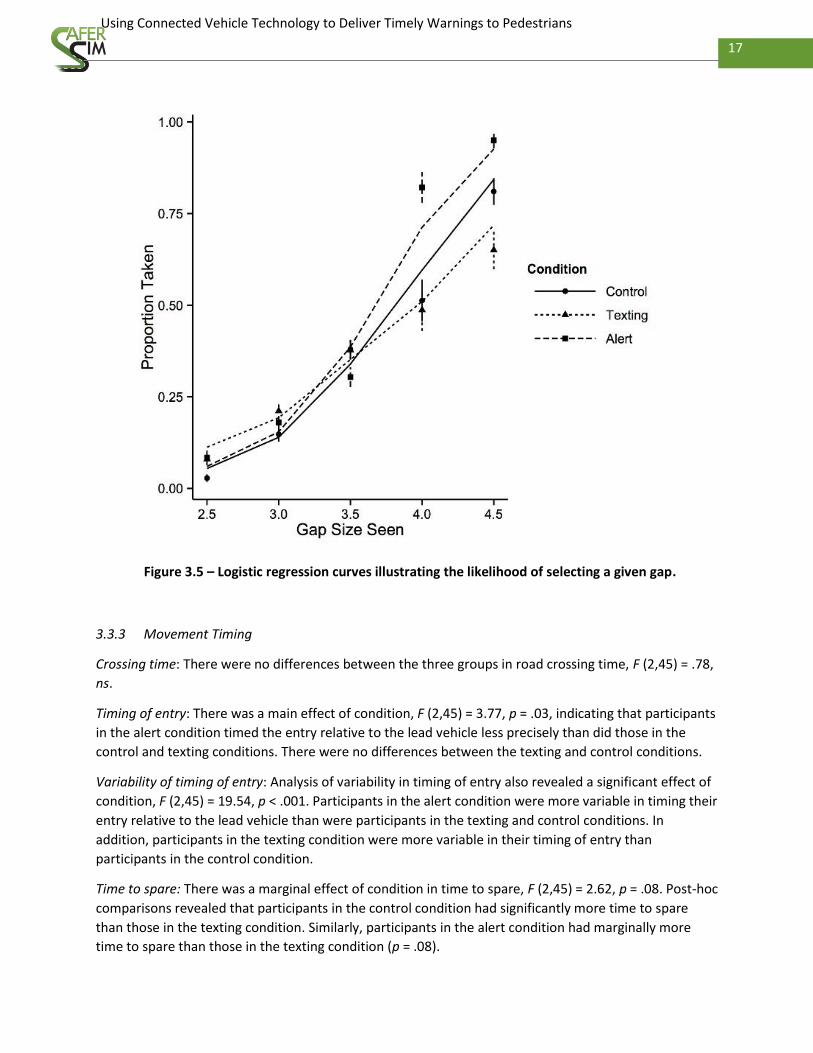
= 7.44, p < .001 (Figure 3.5).
17
Using Connected Vehicle Technology to Deliver Timely Warnings to Pedestrians
Figure 3.5 – Logistic regression curves illustrating the likelihood of selecting a given gap.
3.3.3 Movement Timing
Crossing time: There were no differences between the three groups in road crossing time, F (2,45) = .78,
ns.
Timing of entry: There was a main effect of condition, F (2,45) = 3.77, p = .03, indicating that participants
in the alert condition timed the entry relative to the lead vehicle less precisely than did those in the
control and texting conditions. There were no differences between the texting and control conditions.
Variability of timing of entry: Analysis of variability in timing of entry also revealed a significant effect of
condition, F (2,45) = 19.54, p < .001. Participants in the alert condition were more variable in timing their
entry relative to the lead vehicle than were participants in the texting and control conditions. In
addition, participants in the texting condition were more variable in their timing of entry than
participants in the control condition.
Time to spare: There was a marginal effect of condition in time to spare, F (2,45) = 2.62, p = .08. Post-hoc
comparisons revealed that participants in the control condition had significantly more time to spare
than those in the texting condition. Similarly, participants in the alert condition had marginally more
time to spare than those in the texting condition (p = .08).
18
Using Connected Vehicle Technology to Deliver Timely Warnings to Pedestrians
Collisions: Analysis of collisions did not reveal a significant effect of condition, F (2,45) = 2.50, p = .09.
However, pairwise comparisons showed that participants in the texting condition experienced
significantly more collisions with traffic than did participants in the control condition.
Close Calls: Analysis of close calls did not reveal an effect of condition, F (2,45) = 1.13, ns.
3.3.4 Gaze Direction
Analysis of overall attention to traffic revealed a main effect of condition, F (2,45) = 75.48, p < .001. Each
group differed significantly from the others, with those in the control condition spending the most time
attending to traffic and those in the alerting condition spending the least amount of time attending to
traffic.
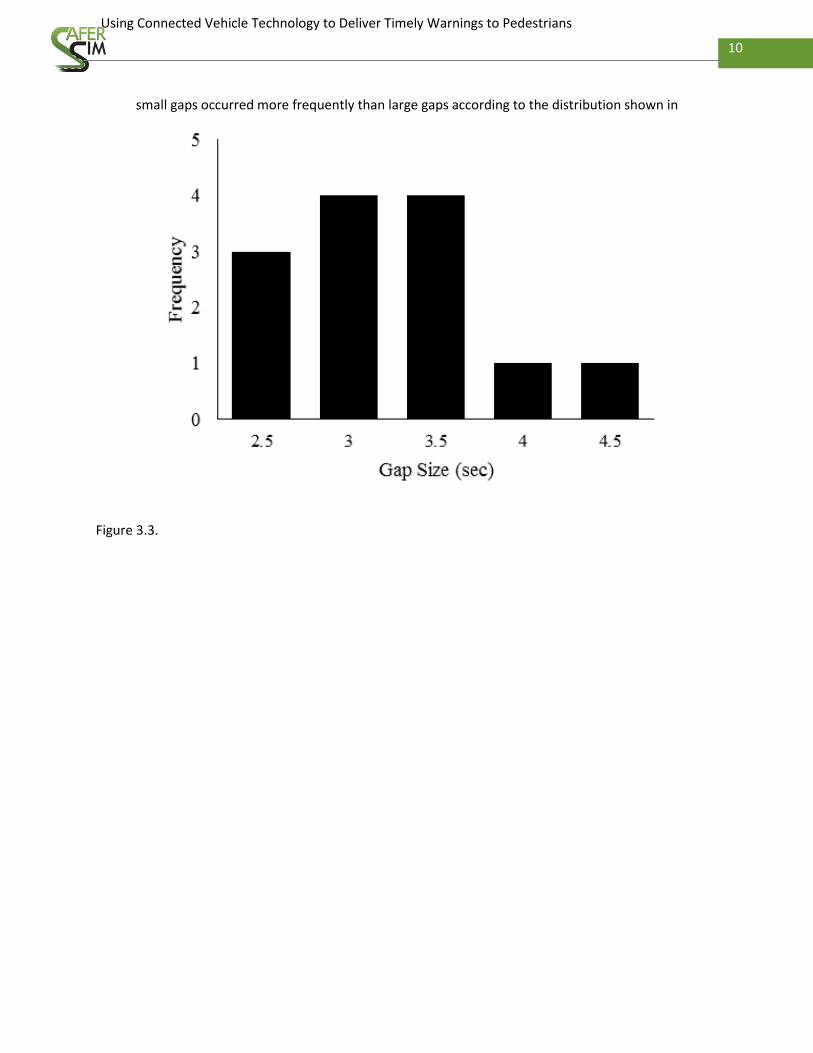
To provide a more fine-grained look at gaze direction, the gaze direction was estimated at 0.1 s intervals
for the 2 s window before and after entry into the road. Figure 3.6 shows the percentage of gaze in each
of the three directions (phone, traffic, other) for each time interval.

19
Using Connected Vehicle Technology to Deliver Timely Warnings to Pedestrians
Figure 3.6 – Estimation of gaze direction for 2 s before and 2 s after initiation of road crossing for
control (top), texting (middle), and alert (bottom) conditions.
The zero point on the horizontal axis represents the time of entry into the road, and the negative and
positive values account for waiting before entry into the roadway and crossing time, respectively.
Additionally, the time of the audio notification of the alert system is illustrated by a green bar on the
corresponding traffic time for the alert condition (bottom panel). For both the texting and alert groups,
the highest proportion of attention to the oncoming traffic was about a half second before crossing. The
highest values for the “other” category occurred as participants crossed the road (predominantly
looking forward). Notably, participants in the alert condition paid less attention to the traffic than those
in either the control group or the texting group.
0%10%20%30%40%50%60%70%80%90%
100%
-2
-1.8
-1.6
-1.4
-1.2 -1
-0.8
-0.6
-0.4
-0.2 0
0.2
0.4
0.6
0.8 1
1.2
1.4
1.6
1.8
Gaz
e D
irec
tion
(%
)
Time (sec)
Phone
Other
Traffic
0%10%20%30%40%50%60%70%80%90%
100%
-2
-1.8
-1.6
-1.4
-1.2 -1
-0.8
-0.6
-0.4
-0.2 0
0.2
0.4
0.6
0.8 1
1.2
1.4
1.6
1.8
Gaz
e D
irec
tion
(%
)
Time (sec)
Phone
Other
Traffic
0%
10%
20%
30%
40%
50%
60%
70%
80%
90%
100%
-2
-1.8
-1.6
-1.4
-1.2 -1
-0.8
-0.6
-0.4
-0.2 0
0.2
0.4
0.6
0.8 1
1.2
1.4
1.6
1.8
Gaz
e D
irec
tion
(%
)
Time (sec)
Phone
Other
Traffic

20
Using Connected Vehicle Technology to Deliver Timely Warnings to Pedestrians
3.4 Discussion
The goal of this study was to evaluate how texting pedestrians responded to permissive traffic alerts
delivered via their cell phone. To safely and systematically study this problem, we examined gap
selection, movement timing, and gaze direction in an immersive virtual environment. We found that
participants in the control and alert groups chose larger gaps and were more discriminating in their gap
choices than participants in the texting group. Both the control and alert groups had more time to spare
than the texting group when they exited the roadway even though the alert group timed their entry
relative to the lead car less tightly than the control and texting groups. By choosing larger gaps,
participants in the alert group were able to compensate for their poorer timing of entry, resulting in a
margin of safety that did not differ from those who were not texting.
In many ways, our results are consistent with observational studies of real pedestrian behavior. The
most notable difference between our results and the reports of observational studies is that texting
participants in our study did not walk more slowly than non-texting participants. We also did not find
any lateral deviation on the path they took across the intersection. Both of these differences may be
because of the relatively short distance of our crossing (roughly 12 feet) and the repeated practice from
making many crossings.
We were struck by the ease with which participants adapted to the alert system, the speed with which
they came to trust it, and the effectiveness with which they used it. The primary positive impact was on
the decisions they made—participants in the alert condition selected larger gaps and, as a consequence,
had more time to spare when they exited the roadway. However, those using the alerts also had deficits
in their road-crossing performance—notably, they timed their entry into the road less tightly and were
more variable in timing their road entry. What is most striking in the results is the impact that texting
and alerts had on where participants looked. Texting participants spent much less time looking at traffic
than did non-texting participants, and those with alerts looked the least at traffic. The alert group most
often looked at traffic during a period of about one second before they crossed the road. Thus, it
appears that the alert group relied on their phones to select the gap and then glanced at traffic to time
their crossing. This outsourcing of cognitive processing may create serious problems, including reduced
situational awareness, and as a result, a reduction in the ability to respond to unexpected events and
technical failures. Extensive testing of such assistive technologies is critical before taking steps to deploy
them on real roads.
As awareness of the dangers of distracted walking grows, communities are examining ways to reduce
risky pedestrian behaviors, including public information campaigns and fines for distracted walking on
sidewalks. Several cities have experimented with street markings aimed at encouraging pedestrians to
pay attention as they cross intersections. New York City launched the “Look” campaign in 2012, which
involved both safety ads and road markings [29]. The City of New Haven, Connecticut, stenciled, “DON’T
READ THIS. LOOK UP!” on sidewalks at intersections. An observational study of pedestrian behaviors at
two interactions in New Haven (one with warnings stenciled on the sidewalk and one without such
warnings) showed no differences in the proportion of pedestrians who were distracted at the two
intersections [30]. Others are exploring creative approaches to bring attention to distracted walking,
including express lanes marked with “No Cellphones” painted on sidewalks in Washington, D.C., by
workers at National Geographic, and a prank done by the New York City performance art collective
Improve Everywhere, which involved a team posing as “Seeing Eye People” who wore orange vests and

21
Using Connected Vehicle Technology to Deliver Timely Warnings to Pedestrians
guided texting pedestrians with a leash along public sidewalks [31]. Likely all of these measures are
needed to increase awareness of the risks of distracted walking.
This work underscores the utility of virtual environments for studying the impact of mobile technology
on distracted walking, particularly in high-risk situations like road crossing. Our pedestrian virtual
environment provides a safe platform for conducting controlled experiments on cell phone use that
would be too dangerous to do on a real roadway. Because of the flexibility of the virtual environment,
we can rapidly develop scenarios and try out variations in traffic patterns, road layout, and user
interface design. During the early stages of this work, we implemented several prototypes of the
interface for our alert system. We were able to test variations of the interface in pilot studies and
quickly refine the design. Most importantly, the virtual environment allows us to do fine-grained analysis
of participant behavior that would be difficult or impossible to do in observational studies. We record
the locations of all vehicles, the position and orientation of the participant’s head, and the position and
orientation of the cell phone. This allows us to replay individual road-crossing trials, to estimate gaze
behavior, and to analyze decisions and actions with high fidelity.
In our future studies, we plan to explore how changes in the settings of the permissive information
system influence crossing behavior. For example, will participants continue to rely so heavily on the
permissive system if the selected gaps are smaller than those used in this experiment? Likewise, how
will participants respond if the permissive system only selects very large (and possibly infrequent) gaps?
In addition, we plan to investigate the influence of prohibitive information systems on road-crossing
behavior. This includes “don’t walk” icons on the phone to indicate when it is unsafe to enter the road
and warning signals when a pedestrian begins to cross a dangerous gap. An important question is
whether information can be sent in time for participants to react to alerts, and how participants respond
to such prohibitive alerts (e.g., by aborting a crossing or by crossing more quickly). Mobile devices and
short range communication technologies offer enormous potential to assist road users inside and
outside of vehicles. Further study is needed to better understand how to provide useful information in a
timely manner.

22
Using Connected Vehicle Technology to Deliver Timely Warnings to Pedestrians
References
1. National Highway Traffic Safety Administration (2014). Traffic Safety Facts 2014. DOT HS 812 261,
U.S. Department of Transportation, Washington, DC.
2. Safe Kids WorldWide (2013). Teens and distraction: An in-depth look a teens’ walking behaviors.
Retrieved on September 16, 2016, from http://www.safekids.org/research-report/research-report-
teens-and-distraction-august-2013.
3. Strayer, D. L., Drews, F. A., & Crouch, D. J. (2006). A comparison of the cell phone driver and the
drunk driver. Human Factors: The Journal of the Human Factors and Ergonomics Society, 48(2), 381-
391.
4. Caird, J. K., Johnston, K. A., Willness, C. R., Asbridge, M., & Steel, P. (2014). A meta-analysis of the
effects of texting on driving. Accident Analysis & Prevention, 71, 311-318.
5. Hatfield, J., & Murphy, S. (2007). The effects of mobile phone use on pedestrian crossing behaviour
at signalised and unsignalised intersections. Accident Analysis & Prevention, 39(1), 197-205.
6. Nasar, J. L., & Troyer, D. (2013). Pedestrian injuries due to mobile phone use in public places.
Accident Analysis & Prevention, 57, 91-95.
7. Schwebel, D. C., Stavrinos, D., Byington, K. W., Davis, T., O’Neal, E. E., & de Jong, D. (2012).
Distraction and pedestrian safety: How talking on the phone, texting, and listening to music impact
crossing the street. Accident Analysis & Prevention, 45, 266-271.
8. Stavrinos, D., Byington, K. W., & Schwebel, D. C. (2011). Distracted walking: Cell phones increase
injury risk for college pedestrians. Journal of Safety Research, 42(2), 101-107.
9. Thompson, L. L., Rivara, F. P., Ayyagari, R. C., & Ebel, B. E. (2013). Impact of social and technological
distraction on pedestrian crossing behaviour: an observational study. Injury Prevention, 19, 232-237.
10. Grechkin, T.Y., Chihak, B.J., Cremer, J.F., Kearney, J.K., & Plumert, J.M. (2013). Perceiving and acting
on complex affordances: How children and adults bicycle across two lanes of opposing traffic.
Journal of Experimental Psychology: Human Perception & Performance, 38, 23-36.
11. Plumert, J. M., Kearney, J. K., Cremer, J. F., Recker, K. M., & Strutt, J. (2011). Changes in children’s
perception-action tuning over short time scales: Bicycling across traffic-filled intersections in a
virtual environment. Journal of Experimental Child Psychology, 108, 322-337, PMID: 20728090
12. Lee, D. N., Young, D. S., & McLaughlin, C. M. (1984). A roadside simulation of road crossing for
children. Ergonomics, 12, 1271-1281.
13. National Highway Traffic Safety Administration (2013). Traffic safety facts: Pedestrians, Volume DOT
HS 811 74B. Washington, D.C.: Department of Transportation.
14. Owen, R., & Fosdick, T. (2013). Pedestrian casualties: An analysis of the people and circumstances.
Road Safety Analysis. Retrieved September 23, 2016, from http://www.roadsafetyanalysis.org/wp-
content/uploads/sites/13/2013/12/Stepping-Out-Small.pdf.
15. Schwebel, D. C., Gaines, J., & Severson, J. (2008). Validation of virtual reality as a tool to understand
and prevent child pedestrian injury. Accident Analysis & Prevention, 40(4), 1394-1400.
16. Chihak, B. J., Plumert, J. M., Ziemer, C. J., Babu, S., Grechkin, T., Cremer, J. F., & Kearney, J. K. (2010).
Synchronizing self and object movement: How child and adult cyclists intercept moving gaps in a
virtual environment. Journal of Experimental Psychology: Human Perception & Performance, 36,
1535-1552.
17. Plumert, J. M., Kearney, J. K., & Cremer, J. F. (2004). Children’s perception of gap affordances:
Bicycling across traffic filled intersections in an immersive virtual environment. Child Development,
75, 1243–1253. PMID: 15260875

23
Using Connected Vehicle Technology to Deliver Timely Warnings to Pedestrians
18. Guth, D., Ashmead, D., Long, R., Wall, R., & Ponchillia, P. (2005). Blind and sighted pedestrians’
judgments of gaps in traffic at roundabouts. Human Factors, 47, 314-331.
19. Kittleson, W. K., & Vandehey, M. A. (1991). Delay effects on driver gap acceptance characteristics at
two-way stop-controlled intersections. Transportation Research Record, 1320, 154-159.
20. Stravinos, D., Byington, K. W., & Schwebel, D. C. (2009). Effect of cell phone distraction of pediatric
pedestrian injury risk. Pediatrics, 123(2), e179-e185.
21. Byington, K. W., & Schwebel, D. C. (2013). Effects of mobile Internet use on college student
pedestrian injury risk. Accident Analysis & Prevention, 51, 78-83.
22. Kenney, J. B. (2011). Dedicated short-range communications (DSRC) standards in the United States.
Proceedings of the IEEE, 99(7), 1162-1182.
23. Schagrin, M. (2011). Connected vehicle safety pilot program. Washington, D.C.: Intelligent
Transportation System - Joint Program Office, U.S. DOT.
24. Wang, T., Cardone, G., Corradi, A.,Torresani, L., and Campbell, A. T. (2012). WalkSafe: a pedestrian
safety app for mobile phone users who walk and talk while crossing roads. Proceedings of the
Twelfth Workshop on Mobile Computing Systems & Applications, ACM, 1-6.
25. Anaya, J. J., Merdrignac, P., Shagdar, O., Nashashibi, F., & Naranjo, J. E. (2014). Vehicle to pedestrian
communications for protection of vulnerable road users. Intelligent Vehicles Symposium
Proceedings, IEEE, 1037-1042.
26. Creaser, J. I., Rakauskas, M. E., Ward, N. J., Laberge, J.C., & Donath, M. (2007). Concept evaluation of
intersection decision support (IDS) system interfaces to support drivers gap acceptance decisions at
rural stop-controlled intersections. In Transportation Research Part F: traffic Psychology and
Behaviour, 10(3), 208-228.
27. Xinzhou, W., Miucic, R., Sichao, Y., Al-Stouhi, S., Misener, J., Sue, B., & Wai-hoi, C. (2014). Cars talk to
phones: A DSRC based vehicle-pedestrian safety system. 2014 IEEE 8th Vehicular Technology
Conference (VTC2014-Fall), 1-7.
28. Lewandowski, A., Bocker, S., Koster, V., & Wietfeld, C. (2013). Design and performance analysis of an
IEEE 802.15.4 V2P pedestrian protection system. Wireless Vehicular Communications (WiVeC), IEEE
5th International Symposium, 1-6.
29. Solomonow, S., & Garcia, N. (2012). “LOOK” Safety Campaign, Bringing Innovative Pedestrian Street
Markings, Distracted Driving Ads Alerting New Yorkers to Walk Safe and Drive Smart. New York City
DOT, press release no. 12-46.
30. Violano, P., Roney, L., & Bechtel, K. (2015). The incidence of pedestrian distraction at urban
intersections after implementation of a Streets Smarts campaign. Injury Epidemiology, 2(1), 1-7.
31. Mwakalonge, J., Siuhi, S., & White, J. (2015). Distracted walking: examining the extent to pedestrian
safety problems. Journal of Traffic and Transportation Engineering, 2(5), 327-337.