using circuit structural analysis techniques for networks
TRANSCRIPT

Using Circuit Structural Analysis Techniquesfor Networks in Systems Biology
Sherief RedaDivision of Engineering
Brown UniversityProvidence, RI 02912
Email: [email protected]
ABSTRACTThe cell contains numerous networks for information processing.These networks are responsible for carrying out all cell functionsincluding gene transcription, signal transconduction, and metabolicactivities. Many of these networks process information similar todigital logic circuits and classical logic methods have been success-fully used to analyze their behavior. The objective of this paper is toinvestigate the potential of circuit structural analysis techniques inanalyzing the topologies of cellular networks arising in systems bi-ology context. Rent’s rule has been in particular a classical methodthat is used in analyzing the topologies of digital circuits. We in-vestigate the applicability of Rent’s rule to systems biology net-works, and we outline the structural similarities and differences be-tween circuit networks and systems biology networks. We computeRent’s rule parameters and classify systems biology networks ac-cording to their Rent’s exponent. Interestingly, networks that pro-cess information in a logical fashion have Rent exponents that aresimilar to that of logic circuits. To provide a basis for our results weutilize recent advancements in graph theory to create random artifi-cial networks with the same degree sequences as real networks andextend our experiments to those circuits as well. Our results openthe door for other researchers to further investigate topological cir-cuit analysis techniques for networks in systems biology.
ACM Categories & Subject DescriptorsB.7.1 [Integrated Circuits]: Types and Design StylesGeneral Terms: Design, Algorithms.Keywords: Rent’s rule, networks, systems biology.
1. INTRODUCTIONThe main purpose of digital circuits is information processing
which is carried out using logic gates and intercommunication wires.The cell is an integrated device made of thousands/millions of in-teracting proteins. The cell monitors its internal and external envi-ronment and accordingly responds using different proteins that ex-ercise various cell functionalities. The interactions among genes,proteins and various signal molecules form complex information
Permission to make digital or hard copies of all or part of this work forpersonal or classroom use is granted without fee provided that copies arenot made or distributed for profit or commercial advantage and that copiesbear this notice and the full citation on the first page. To copy otherwise, torepublish, to post on servers or to redistribute to lists, requires prior specificpermission and/or a fee.SLIP’09, July 26–27, 2009, San Francisco, California, USA.Copyright 2009 ACM 978-1-60558-576-5/09/07 ...$10.00.
processing networks that map the cell’s signals and molecules intofunctions. Cellular networks are at the center of the study of thefield of systems biology [1].
Networks arising from electronic circuits and systems biologycontexts share many similarities. At their core they both processinformation. Much of this information processing is carried outin systems biology in a logical manner (e.g., using conjunction,disjunction and negation operators) similar to digital circuits. Inboth networks computation occurs distributively at the nodes of thenetwork and communication is carried out between the nodes ofthe network to realize the network’s function. In electronic cir-cuits, metal wires transfer electrons in the circuit for communica-tion purposes. In systems biology, proteins and various biochemi-cal molecules floating in the water-based medium of the cell carryout the required communication. Just as nodes in circuit networkscan be grouped into modules (e.g., flip-flops, adders) based on theirfunctionalities, nodes in systems biology can be also grouped intomotifs that are used to carry out specific recurring functionalities(e.g., feed-forward loops and autoregulation).
The recent years have seen a flurry of research into analyzingthe structure of systems biology networks [19, 20, 1]. Previous re-search focused on many structural aspects of such networks includ-ing: motif finding, identification of motif functionality, determiningthe statistical properties of node degree distribution, and investigat-ing the applicability of scale-free laws. Given the similarities be-tween systems biology networks and electronic circuits, this paperseeks to investigate the applicability of circuit topology and struc-ture analysis techniques to systems biology networks. In particular,electronic circuits have shown unique properties as displayed by thefamed Rent’s rule [9, 17]. Does Rent’s rule also extend to systemsbiology networks? What are the structural similarities and differ-ences between systems biology networks and electronic circuits?These questions and their answers are the focus of this paper. Themain contributions of this paper can be summarized as follows.
• This paper is the first to investigate the applicability of circuittopological analysis techniques for networks arising in sys-tems biology. We study the applicability of Rent’s rule forsystems biology networks. We explain the structural similar-ities and differences between electronic circuits and cellularnetworks in systems biology.
• To provide a basis for comparing different networks, we uti-lize some of the latest results in graph theory to constructrandom networks with the same number of edges, nodes andnode degree sequences as the experimented real networks.We also investigate the applicability of Rent’s rule to theserandom networks.
37

• We provide comprehensive experimental results on large se-lection of representative networks from systems biology. Weclassify these networks based on their functionality, and weshow that the Rent’s exponent range depends on the func-tionality of the network. Networks that process informationin a logical fashion have Rent exponents that are in the samerange as in electronic circuits.
The organization of this paper is as follows. Section 2 reviewsRent’s rule as a classical method for structural circuit analysis. Sec-tion 3 overviews new techniques that synthesize random networkswith the same characteristics as real networks. Section 4 reviewsvarious network types arising in systems biology contexts. Section5 provides all experimental results and conclusions. Finally Section6 summarizes the main results of this paper.
2. NETWORKS IN INTEGRATED CIRCUITSRent’s rule is a classical relationship that is observed when ana-
lyzing the structure or topology of computing circuitry [9, 17, 7].The rule relates the number of external wires emanating from ablock of computational cells to the number of cells within the blockas illustrated in Figure 1. The rule has been observed and validatedon many real circuit designs. It has many applications in circuitdesign and implementation including wirelength estimation, con-gestion estimation and interconnect power estimation [14, 21, 3,18, 8]. Rent’s rule is a power-law relationship that exists for logiccircuits [9, 17, 10]. Rent’s rule is given by
P = T Br, (1)
where
• P is the average number of external nets per block, where ablock is a cluster or partition of cells.
• B is the average number of cells per block.
• 0≤ r ≤ 1 is the Rent exponent.
• T is the average number of pins per cell.
The Rent exponent reflects that there is intra-communication amongthe cells of a block and thus fewer than T B terminals are availablefor communication with the external world outside the block. Thehigher the Rent exponent, the more complex is the wiring of thecircuitry. Memory structures with local interconnects have low rvalues while logic circuits for microprocessors have a r that is usu-ally in the range of 0.4−0.7. Generally circuits with mainly localwires lead to lower r, while circuits with larger shares of globalwires lead to higher r [6, 15].
There are two general approaches to calculate Rent exponent [13,23]. One method is based on recursive-based partitioners and theother method is based on placers.
• Partitioning-based Calculators. In this method a min-cutpartitioning algorithm is used to recursively partition the net-work of cells. At each partitioning level, the average numberof cells per partition and the average number of nets externalto a partition are computed. These pair of numbers constitutea point on the log-log graph of Rent’s rule. After all pointsare plotted, linear regression is used to estimate, r, the rentexponent.
Cell1 Cell2
Cell3Cell5
Cell6Cell4
Cell1
Cell6
external net
internal net
partition (block)
Figure 1: Example illustrating the blocks (or partitions), cellsand external nets of a circuit network.
• Placement-based Calculators. In this method a circuit isplaced using some “good" placement algorithm. Then theplacement area is divided into several regions. The averagenumber of cells per region and the average number of ex-ternal nets per region are then computed. These two num-bers constitute a point on the log-log graph of Rent’s rule.The process of dividing the placement area into regions is at-tempted with various sizes for the regions to give more pointson the log-log graph. Then the Rent exponent, r, is computedthrough a linear regression using the computed points
In this paper we use partitioning-based calculators based on multi-level partitioners. We build our own Rent calculator based on themulti-level partitioning tool hMETIS (version 1.5) [16]. For exam-ple, Figure 2 gives the partitioning results of the s838 circuit fromthe ISCAS ’89 benchmark suite [5]. We apply the hMETIS in arecursive fashion to obtain the average values of P when the av-erage values of B = 256,128,64,32,16,8,4,2,1 corresponding tothe various levels of recursive partitioner. The plot is in semilogscale for both axes. The plot can be generally partitioned into tworegions where the first region (Region I) is the one that exhibits thelinear relationship between B and P [7]. As the number of cells
1
10
1 10 100 1000
P(Averagenum
berof
externalnets/block)
B(averagenumberofcells/block)
RegionI
RegionII
Figure 2: Rent’s rule plot for the s838 circuit of the ISCAS ’89circuits.
38

per block approaches the total number of cells in the circuit, thenumber of external nets becomes constrained by the limited num-ber of I/O terminals at the circuit periphery. This restriction leadsto a rapid reduction in the value of P which defines Region II of theRent’s rule plot. The Rent exponent can be calculated using linearregression from the points in Region I. From our results the Rentexponent of this circuit is equal to 0.367. As previously discussedin the literature [13, 23], the numerical value of the Rent exponentof a circuit can slightly vary depending on the optimality of thepartitioner or placer used.
3. RANDOM NETWORKSTo provide a basis for comparison, our objective in the section is
construct random networks. Motivated by recent developments ingraph theory, our objective is to generate random graphs with thesame node degree sequences as real circuits in addition to the typ-ical requirement of having the same number of nodes and edges.A node here could be either a cell or an I/O terminal. The degreesequence of a graph is defined as the non-increasing sequence (rep-etitions allowed) of its node degrees. The outline of the randomgraph generation algorithm is as follows [12, 22]:
1. Generate a graph with the given sequence. This step is itera-tive in nature. The residual degrees of nodes, where residual degreeis the difference between the current degree and the final degreeof a node, is maintained. In each iteration, an arbitrary node u ispicked and edges are added from u to ru nodes of highest residualdegree, where ru is the residual degree of u. The residual degrees ofu and all affected ru nodes are updated accordingly. The iterationsare repeated until the residual degrees of all nodes are equal to zero.
Before explaining Step 2, a handy lemma is first proven.
Lemma 1. If the graph constructed from the Step 1 is unconnected,then at least one of the connected subgraphs must contain a cycle.Proof: Assume the original connected circuit had n nodes. Sincethe circuit is connected by definition then it must have at least atotal of n− 1 edges or 2(n− 1) degrees. Assume Step 1 leads toto an unconnected graph with m connected subgraphs or compo-nents where each component has ni nodes for i = 1 . . .m. If noneof the components has a cycle then the the total number of edgesin all components is equal to ∑
mi=1(ni− 1) = n−m. This leads to
a contradiction as n−m is less than n− 1 since there are m ≥ 2components.
2. Connect the graph while keeping all the degrees of its nodesthe same. If Step 1 leads to an unconnected graph then this stepconverts the graph to connected one. If the graph constructed fromthe previous step is unconnected, then at least one of the connectedsubgraphs must contain a cycle as proven in Lemma 1. Let (u,v)be an edge in that cycle and let (s, t) be an edge in a different con-nected subgraph. Deleting the edges (u,v) and (s, t) and insertingthe edges (u,s) and (v, t) will merge the two subgraphs into a con-nected graph. This step is illustrated in Figure 3. Note that theresulting graph still satisfies the given degree sequence. This stepcan be repeated until the entire graph is connected.
3. Switch the edges to make the graph random while still be-ing connected. The graph can be randomized as follows. Pick twoedges at random, say (a,b) and (x,y) with distinct endpoints. If(a,x) and (b,y) are not edges then produce a new graph by deletingthe edges (a,b) and (x,y) and inserting the edges (a,x) and (b,y)as long as this switching operation leaves the new graph connected.
u
v s
t
u
v s
t
Figure 3: An illustration of Step 2.
a x
b y
a x
b y
Figure 4: An illustration of Step 3.
This step is illustrated in Figure 4. Using the switching operation,any connected graph can be transformed to any another connectedgraph satisfying the same degree sequence.
Note that the outlined method can be to generate random syn-thetic circuits for other purpose like benchmarking or driving phys-ical synthesis tool chains.
4. NETWORKS IN SYSTEMS BIOLOGYThe cell function is based on complex networks of interacting
biochemical reactions that respond to events inside and outside thecell environment and produce observable cellular function. Thesenetworks occur at multiple levels including gene-protein interac-tions, protein-protein interactions, signals-protein interactions andbiochemical interactions for metabolism. In the upcoming subsec-tions we briefly overview the structure of the major networks insidethe cell.
4.1 Transcriptional NetworksA cell can sense many signals within its internal and external
living environment, and it can respond to these signals by produc-ing the appropriate proteins. These proteins are produced from ex-pressed genes within the cell. Transcription factors regulate therates of production of proteins by controlling the expression lev-els of the individual genes that produce the proteins. A transcrip-tion factor itself is a protein that binds to specific DNA sequencesand thereby regulates the transcription of genetic information fromDNA to RNA (RNA eventually gets translated to protein). For ex-ample E. coli has about 300 transcription factors that regulate therates of production of about 4000 proteins. Transcriptional factorstransit between active and inactive states as determined by the inputsignals from the environment.
Figure 5 illustrates the process of gene regulation through tran-scription factors. In general, genes are transcribed to mRNA whenRNA polymerase binds to the promoter region of a gene. RNA getstranslated to proteins by ribosomes. Transcription factors of a genecontrol the binding of RNA polymerase to the promoter region.There are two possible modes of regulation:
• Activation X → Y . In this case when the transcription factor
39

X Y
Gene Y
mRNA
X
promoter
RNA polymerase
X Y
Gene Y
X
promoter
RNA polymerase
Figure 5: Illustration of gene transcription regulation.
X binds to the promoter region of gene Y , it enables RNApolymerase to bind to the promoter region. Once the RNApolymerase is bound, gene Y is expressed and its transcribedinto mRNA. If the transcription factor is not present thenRNA polymerase will not bind to the promoter region andthus gene Y will be inactive.
• Repression X a Y . In this case when the transcription factorX binds to the promoter region of gene Y , it disables RNApolymerase from binding to the promoter region. Once theRNA polymerase is unable to bind, gene Y becomes inactiveand no transcription to mRNA occurs. If the transcriptionfactor is not present then RNA polymerase will bind to thepromoter region and thus gene Y will be activated and thetranscription process to mRNA occurs.
Transcription factors themselves are expressed by genes whichare regulated by other transcription factors, which are in turn reg-ulated by some transcription factors and so forth. These set of in-teractions between transcription factors and their target genes forma transcriptional network. In such network nodes represent genesand directed edges represent transcriptional regulation of one geneby another gene. A gene can be regulated by multiple of transcrip-tion factors. The primary inputs (using circuit terminology) are thesignals that carry information from the external or internal environ-ment of the cell, and the primary outputs are proteins that act uponthe environment. Transcriptional networks are largely composedof a small set of network motifs; motifs are patterns of interactionsthat significantly recur in these networks than in randomized net-works [19]. Each motif performs a specific information-processingrole in the network just as logic gate modules perform particularinformation processing functions in digital circuits.
Consider the example network of Figure 6 which is part of thedevelopmental transcription network1 of the B. subtilis spore. Inthis network:
• Gene Z1 is expressed if both the transcription factor expressedfrom gene X1 is active and the transcription factor expressedfrom gene Y1 is repressed or inactive. The transcription fac-tor expressed from Y1 is active (repressed) when the tran-scription factor expressed from X is active (repressed). Thefeed-forward motif consisting of Z1, X1 and Y1 behaves asa pulse generator where Z1 is expressed for a short durationonly when X1 is expressed.
1Developmental transcriptional networks govern the fate of cells asan egg develops into a multi-cellular organism. These networks arerequired to create the required differentiation between cells as theydevelop into different types within an organism.
• Genes Z2, Y2 and X2 form a feed-forward motif that behavesas a pulse generator when X2 is expressed. X2 is expressedin turn when the transcription factors expressed from both X1and Y1 are activated.
• Gene Z3 is expressed when the transcription factors expressedfrom both X2 and Y2 are active.
4.2 Protein-Protein interaction NetworksProtein-protein interactions are one of the most abundant inside
the cell and they are used to carry out many of the essential cellfunctions. Examples of protein interactions include a protein inter-acting with another protein to form part of a larger protein complex,or a protein interacting with another protein (say by phosphoryla-tion) to modify it. In protein-protein interaction networks nodescorrespond to relevant proteins and edges correspond to protein -protein interactions among the nodes.
Similar to transcription networks, as protein interaction networksbecome increasingly large and complex, it becomes more importantto break them down into manageable structural modules or motifs.These motifs represent clusters of proteins that together contributeto the same cellular function, where the clustering is derived from
X1
Y1
X2
Y2
Z1
Z2 Z3
Figure 6: A simplified transcription network that guide the de-velopment of the B. subtilis spore (adapted from [11, 1]).
40

the topology of the network [4]. Protein interaction networks func-tion together with other cell networks (e.g., signal transduction net-works and transcription networks) and thus these interacting net-works can be described using one integrated network. For exam-ple, one protein can modify another protein which allows the latterto regulate the transcription of a gene, or a transcription factor canregulate two genes whose protein products interact.
4.3 Signal Transduction NetworksThese networks involve the transduction of a signal from the out-
side of a cell to the inside. Signaling networks transmit signalsfrom the external environment of the cells to the inside of cell, tothe nucleus, or to other cellular organelles and functions [20]. Sig-nal transduction involves the binding of an extracellular signalingmolecules (ligands) to cell-surface receptors. This binding triggersintracellular signaling cascades within the cell. The main steps thatoccur with signal transduction include: (1) the binding of the signalmolecule (ligand) to an extracellular receptor; (2) the subsequentphosphorylation of an intracellular enzyme; (3) the amplificationand passage of the signal; and (4) an eventual change in the cellularfunction. In signal transduction networks, nodes represent proteinsand molecules and edges represent reactions and processes (e.g.,ligand binding).
4.4 Metabolic NetworksCell metabolism is the mechanism that converts raw materials
into energy as well as the elementary blocks needed to producebiological structures, to maintain cells and to conduct various cel-lular functions [20]. Metabolic imbalance is associated with majorhuman disease, such as diabetes and obesity. Metabolism is usu-ally divided into phases. The first phase is catabolism where inputsubstrates to cells are broken down into common metabolities, andthe second phase is anabolism that converts the metabolites intoamino acids, nucleic acids and other needed elementary blocks.A metabolic network shows the interactions between enzymes andmetabolites in a cell. In these networks enzymes and metabolitesform the nodes of the network and interactions between them formthe edges.
4.5 Neural NetworksNeural networks generally do not belong to the category of sys-
tems biology networks; however, we include one such network inour experimental results. A neural network describes a collectionof physically interconnected neurons whose inputs and output sig-naling targets define a circuit. Communication between neurons of-ten involves an electrochemical process. Each neuron interact withother neurons through several input collections called dendrites,which are connected via synapses to other neurons, and one outputconnection called axon. If the sum of the input signals surpassesa certain threshold, the neuron sends an action potential that prop-agates along the axon. Neural networks are used for informationprocessing in the brain and the nervous system. Our experimentalneural network comes from the c. elegans worm.
5. EXPERIMENTAL RESULTSIn this section we study the applicability of circuit structural
analysis techniques to systems biology networks and to randomnetwork with degree sequences as real networks. We carry out twosets of experiments. In the first set of experiments we investigate anumber of representative systems biology networks and then graphthe Rent plot (i.e., average of nodes per block versus the number ofexternal nets per block on a log-log scale). We also calculate theRent exponent and provide observations on the similarities and dif-
Figure 7: Visualization of the dros network.
ferences between electronic circuits and systems biology networks.In the second set of experiments we construct random graphs withthe same degree sequences as the real networks and then graph theRent plot and compute the rent exponent. We also discuss the dif-ferences between such networks and the real networks. First wedescribe the tools used in the experiments of this study.
• We construct a tool that calculates P and B of the Rent rulebased on the hypergraph partitioning tool hMETIS (version1.5) [16].
• We use the tool gengraph [22] to generate random graphswith the same number of edges and nodes and with the samedegree sequence as the experimental networks.
• We use the tool mDraw for network visualization [2].
The names of the networks used in our experiments together withtheir characteristics are given in Table 1, where we provide thenumber of edges, nodes and the average node degree of each net-work. We use the mDraw tool to draw the dros network in Figure7. The average node degree of electronic logic circuits is usuallyaround 3−4 due to technology limitations on the number of fan-inand fan-outs of nodes. The average node degree for most systemsbiology networks (especially the ones that are similar to logic cir-cuits) are within the range of logic circuits. However, some othernetworks like neural networks require high connectivity which in-creases the average node degree.
In addition to average node degrees, we consider the node degreesequence. Figure 8 shows the degree sequence of a number of net-works. We first notice that except for nodes with degree one, sys-tems biology networks exhibit the general trend that as the degreeincreases, the number of nodes with the degree decreases. How-ever, circuits typically have few nodes (basically I/O terminals)with degree one which is due to the limitedness of the perimeterof the circuit. Networks from systems biology do not have neces-sarily such limitation. The difference in the number of nodes withdegree one will impact the shape of Region II in the Rent plot. Wewill shortly study the implications of the number of nodes with de-gree one as part of the first experiment.
Exp 1: Experiments with Systems Biology Networks. In the firstset of experiments we asses the validity of Rent’s rule to networksfrom systems biology. We use the recursive-partitioned based de-veloped flow for calculating B (the average number of nodes perblock) and P (the average number of external nets per block) atvarious partition levels. We plot our results for four networks in
41

Network Description nodes nets av. degrees838 an electronic circuit network 512 819 3.20
sea_urchin a developmental transcription network from sea urchin 45 83 3.69coli1 a transcription interactions between regulatory proteins and genes in the bacterium E. coli 418 519 2.45
human a human signal transduction network 181 312 2.75yeast an integrated transcription and protein interaction network in the yeast S. cerevisiae 685 1052 3.07s9234 an electronic circuit network 5844 8197 2.81dros a drosophila developmental transcription network in Drosophila fly 110 306 5.14tong a transcription genetic interaction network of yeast 685 1052 3.07
c_elegans a neuronal synaptic circuitry network in the C. elegans worm 280 2170 15.50ccsb a protein-protein interaction network 687 2608 7.59dip a protein-protein interaction network for S. cerevisiae 4716 15114 6.41
Table 1: Characteristics of networks in experimental results.
Figure 9; other networks display similar trend. Our plots show thatsystems biology network display a clear linear Region I trend asthe case for electronic circuits. Thus, we conclude that Rent’s ruleis generally applicable to networks from systems biology.
While Region I of the Rent graph is the region of interest in cal-culating the Rent exponent, Region II is characteristic of computa-tional circuits as it shows the impact of the limited number of I/Os.One of the differences between Rent graphs for electronic circuitsand biological systems lies in Region II. In many of the plots ofFigure 9, Region II does not clearly exist. There are a number ofreasons for such behavior.
• Some of the experimented networks are actually subnetworksthat are extracted from larger cell networks. In many casescell networks are gigantic and researchers focus on only map-ping subnetworks of an original network, and thus it is rea-sonable to expect a large number of “I/O" terminals and con-sequently the lack of Region II.
• The number of I/O signals for the cell are limited by thesurface area of its volume, and thus it has more capacity tohandle I/O than circuits that are constrained either by theirperimeter or their surface area (in case of flip-chip packag-ing).
Figure 8: Degree distribution (sequence) for four networks.
network Rent Rent diffrandom
s838 0.367 0.671 0.304sea_urchin 0.448 0.588 0.140
coli1 0.463 0.568 0.105human 0.431 0.665 0.234yeast 0.489 0.708 0.219s9234 0.500 0.777 0.277dros 0.601 0.721 0.120tong 0.621 0.775 0.154
c_elegans 0.781 0.878 0.097ccsb 0.827 0.858 0.031dip 0.827 0.896 0.069
Table 2: Rent exponent for the studied networks and the ran-dom networks with the same degree sequence as their realcounterparts.
• For signal transconduction networks, the cell has the capa-bility to transport multiple ion types through the same ionchannels effectively multiplexing its I/O and increasing itscommunication capabilities.
To calculate the Rent exponents of all networks, we perform lin-ear regression on our partitioning results. We tabulate the resultsfor various circuits in column 2 of Table 2. The results show thatthe Rent exponent varies between 0.4− 0.8 depending on the cir-cuit’s type. Circuits with larger wiring complexity and higher aver-age node degree (e.g., c_elegans, ccsb and dip) display higher Rentexponents. Interestingly, transcription networks that function in amanner similar to logic circuits have Rent exponents that are in the0.4−0.6 range, which is similar to electronic logic circuits.
In electronic circuits, the correctness of Rent’s rule is a resultof the fact that designers build their designs in a hierarchical fash-ion, imposing the same complexity at each level of the hierarchy[21]. Such hierarchy leads to self-similarity of the designs [21, 7].Given the presented results, one might wonder whether evolutionhas eventually led to biological networks with such hierarchical or-ganization.
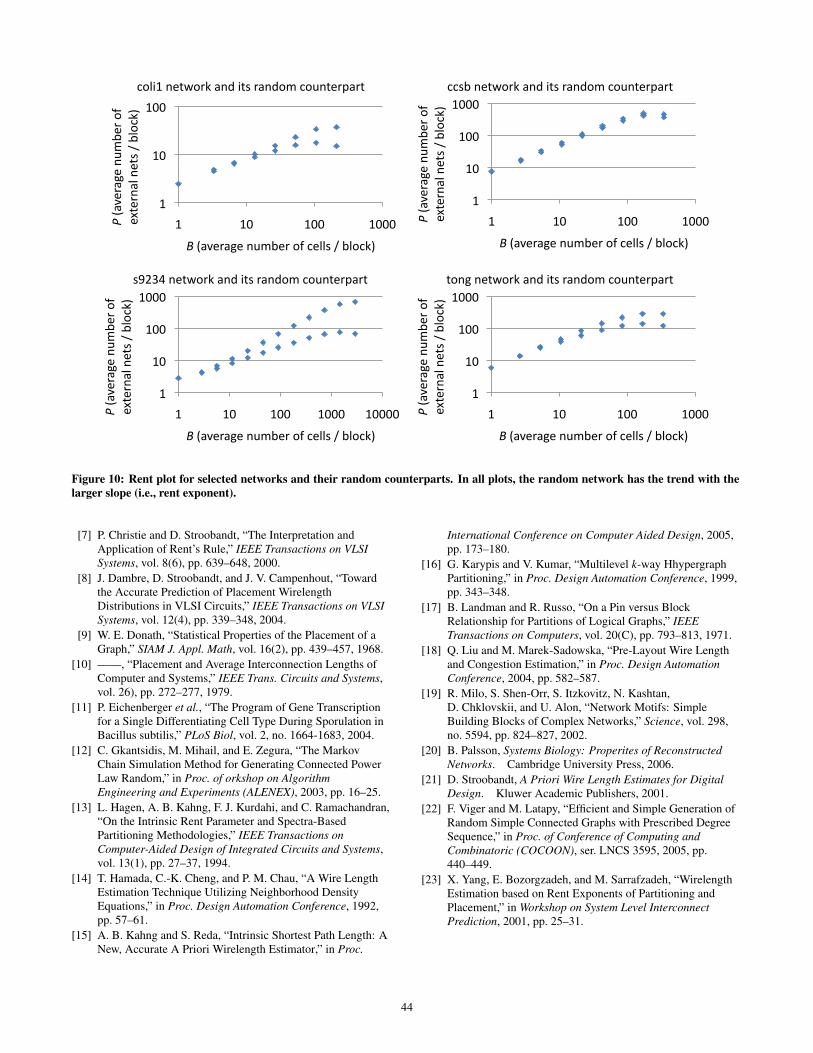
Exp 2: Real Networks vs. Random Networks. In the secondset of experiments we study the applicability of Rent rule to ran-dom networks that have the same degree sequence as real networks.For each network in Table 1, we use the tool gengraph [22] togenerate a random network with the same (1) nodes, (2) edges,and (3) degree sequence as its real counterpart. Then we use ourpartitioning-based flow to calculate B and P at various partitioninglevels. We plot in Figure 10 the partitioning results for both the realnetwork and the random counterpart. In all cases the random net-work has the upper plot (i.e., the one with larger Rent exponent).
42

1
10
100
1000
1 10 100 1000P(averagenum
berof
externalnets/block)
B(averagenumberofnodes/block)
c_elegansnetwork
1
10
100
1000
10000
1 10 100 1000 10000P(averagenum
berof
externalnets/block)
B(averagenumberofnodes/block)
dipnetwork
1
10
100
1 10 100 1000P(averagenum
berof
externalnets/block)
B(averagenumberofnodes/block)
yeastnetwork
1
10
100
1 10 100P(averagenum
berof
externalnets/block)
B(averagenumberofnodes/block)
drosnetwork
Figure 9: Rent plot for selected networks.
For space limitations, only a sample of networks are plotted; othernetworks exhibit similar behavior. The plots show that Rent ruleis well applicable into random networks with the same degree se-quence as the real networks. We also calculate the Rent exponentfor all networks and tabulate the results in the third column of Ta-ble 2. From our results we observe that random networks displayRent exponents with higher values than their real counterpart net-works with the same degree distribution. In general the differencebetween the Rent exponent of a real network and that of its randomnetwork decreases in magnitude as the Rent exponent increases inmagnitude.
6. CONCLUSIONSIn this paper we have discussed the applicability of the structural
circuit analysis techniques to network arising in other contexts likesystems biology. Information processing networks in system biol-ogy bear striking resemblance to their physically-engineered ones,and thus it is natural to investigate whether circuit topological prop-erties are also valid for them. We have investigated Rent rule as akey property of electronic circuits. We have examined its applica-bility to systems biology network and to also random graphs withthe same properties as their circuit counterparts (nodes, edges anddegree sequences). We have discovered that Rent’s rule is also wellapplicable to systems biology network, and furthermore the Rentexponent of biology networks that carry out logic-based informa-tion processing fall within the same range as engineered electroniccircuits. Random networks with the same degree sequence as realnetworks also obey Rent’s rule but consistently have higher Rentexponent than their real counterparts.
Acknowledgments
The author would like to thank Benjamin Raphael from the com-puter science department of Brown University for the early helpfuldiscussions on the material of this work and for the pointers to theexperimental networks and the gengraph tool.
7. REFERENCES[1] U. Alon, An Introduction to Systems Biology: Design
Priniciples of Biological Circuits. Chapman & Hall/CRC,2007.
[2] ——, “mDraw: Network visualization Tool,”http://www.weizmann.ac.il/mcb/UriAlon/.
[3] S. Balachandran and D. Bhatia, “A Priori Wirelength andInterconnect Estimation Based on Circuit Characteristics,” inWorkshop on System Level Interconnect Prediction, 2003,pp. 77–84.
[4] P. Bork, L. Jensen, C. von Mering, A. Ramani, and I. Lee,“Protein Interaction Networks from Yeast to Human,”Current Opinion in Structural Biology, vol. 19, pp. 292–299,2004.
[5] F. Brglez, D. Bryan, and K. Kozminski, “CombinationalProfiles of Sequential Benchmark Circuits,” in Proc.International Symposium on Circuits and Signals, 1989, pp.1929–1934.
[6] C. Chang, J. Cong, M. Romesis, and M. Xie, “Optimalityand Scalability Study of Existing Placement Algorithms,”IEEE Transactions on Computer-Aided Design of IntegratedCircuits and Systems, vol. 23(4), pp. 537–549, 2004.
43
1
10
100
1 10 100 1000P(averagenum
berof
externalnets/block)
B(averagenumberofcells/block)
coli1networkanditsrandomcounterpart
1
10
100
1000
1 10 100 1000P(averagenum
berof
externalnets/block)
B(averagenumberofcells/block)
ccsbnetworkanditsrandomcounterpart
1
10
100
1000
1 10 100 1000 10000P(averagenum
berof
externalnets/block)
B(averagenumberofcells/block)
s9234networkanditsrandomcounterpart
1
10
100
1000
1 10 100 1000P(averagenum
berof
externalnets/block)
B(averagenumberofcells/block)
tongnetworkanditsrandomcounterpart
Figure 10: Rent plot for selected networks and their random counterparts. In all plots, the random network has the trend with thelarger slope (i.e., rent exponent).
[7] P. Christie and D. Stroobandt, “The Interpretation andApplication of Rent’s Rule,” IEEE Transactions on VLSISystems, vol. 8(6), pp. 639–648, 2000.
[8] J. Dambre, D. Stroobandt, and J. V. Campenhout, “Towardthe Accurate Prediction of Placement WirelengthDistributions in VLSI Circuits,” IEEE Transactions on VLSISystems, vol. 12(4), pp. 339–348, 2004.
[9] W. E. Donath, “Statistical Properties of the Placement of aGraph,” SIAM J. Appl. Math, vol. 16(2), pp. 439–457, 1968.
[10] ——, “Placement and Average Interconnection Lengths ofComputer and Systems,” IEEE Trans. Circuits and Systems,vol. 26), pp. 272–277, 1979.
[11] P. Eichenberger et al., “The Program of Gene Transcriptionfor a Single Differentiating Cell Type During Sporulation inBacillus subtilis,” PLoS Biol, vol. 2, no. 1664-1683, 2004.
[12] C. Gkantsidis, M. Mihail, and E. Zegura, “The MarkovChain Simulation Method for Generating Connected PowerLaw Random,” in Proc. of orkshop on AlgorithmEngineering and Experiments (ALENEX), 2003, pp. 16–25.
[13] L. Hagen, A. B. Kahng, F. J. Kurdahi, and C. Ramachandran,“On the Intrinsic Rent Parameter and Spectra-BasedPartitioning Methodologies,” IEEE Transactions onComputer-Aided Design of Integrated Circuits and Systems,vol. 13(1), pp. 27–37, 1994.
[14] T. Hamada, C.-K. Cheng, and P. M. Chau, “A Wire LengthEstimation Technique Utilizing Neighborhood DensityEquations,” in Proc. Design Automation Conference, 1992,pp. 57–61.
[15] A. B. Kahng and S. Reda, “Intrinsic Shortest Path Length: ANew, Accurate A Priori Wirelength Estimator,” in Proc.
International Conference on Computer Aided Design, 2005,pp. 173–180.
[16] G. Karypis and V. Kumar, “Multilevel k-way HhypergraphPartitioning,” in Proc. Design Automation Conference, 1999,pp. 343–348.
[17] B. Landman and R. Russo, “On a Pin versus BlockRelationship for Partitions of Logical Graphs,” IEEETransactions on Computers, vol. 20(C), pp. 793–813, 1971.
[18] Q. Liu and M. Marek-Sadowska, “Pre-Layout Wire Lengthand Congestion Estimation,” in Proc. Design AutomationConference, 2004, pp. 582–587.
[19] R. Milo, S. Shen-Orr, S. Itzkovitz, N. Kashtan,D. Chklovskii, and U. Alon, “Network Motifs: SimpleBuilding Blocks of Complex Networks,” Science, vol. 298,no. 5594, pp. 824–827, 2002.
[20] B. Palsson, Systems Biology: Properites of ReconstructedNetworks. Cambridge University Press, 2006.
[21] D. Stroobandt, A Priori Wire Length Estimates for DigitalDesign. Kluwer Academic Publishers, 2001.
[22] F. Viger and M. Latapy, “Efficient and Simple Generation ofRandom Simple Connected Graphs with Prescribed DegreeSequence,” in Proc. of Conference of Computing andCombinatoric (COCOON), ser. LNCS 3595, 2005, pp.440–449.
[23] X. Yang, E. Bozorgzadeh, and M. Sarrafzadeh, “WirelengthEstimation based on Rent Exponents of Partitioning andPlacement,” in Workshop on System Level InterconnectPrediction, 2001, pp. 25–31.
44