using “ success storyboards” to facilitate development of ... · 4/13/0 65/3 /23/ 6/12/ 06 7/...
TRANSCRIPT

Using Using ““
Success StoryboardsSuccess Storyboards””
to to facilitate development of Dynamic facilitate development of Dynamic
Management Tools and Improved Water Management Tools and Improved Water Quality Management OutcomesQuality Management Outcomes
3 RA Water Quality Workshop3 RA Water Quality Workshop
January 2010January 2010
Bob TudorBob Tudor
Delaware River Basin CommissionDelaware River Basin Commission

Connecting the DotsConnecting the Dots
Science/MonitoringScience/Monitoring--Observations/Management or Observations/Management or ““Science to SolutionsScience to Solutions””
NWQMC/IOOS or NWQMC/IOOS or ““Watersheds to OceansWatersheds to Oceans””
MACOORA/SECOORA/NERACOOS to MACOORA/SECOORA/NERACOOS to ““explore explore integrated scienceintegrated science--based solutions to address based solutions to address management of major east coast watermanagement of major east coast water--quality issuesquality issues””
Issues: Hypoxia/Issues: Hypoxia/HABsHABs/Nutrient Enrichment/Nutrient Enrichment
Advocate for Action on National Scale at Denver mtg.Advocate for Action on National Scale at Denver mtg.

Monitoring/ObservationMonitoring/ObservationData ProductsData ProductsDynamic Management ToolsDynamic Management Tools Improved Management Outcomes (Improved Management Outcomes (““SolutionsSolutions””))
Conceptual Management Framework

Entire Delaware BasinEntire Delaware Basin
4 states4 states——NY, PA, NJ, DENY, PA, NJ, DE
Several Physiographic Provinces and Several Physiographic Provinces and EcohabitatsEcohabitats
Major inflowsMajor inflows——Lehigh, Schuylkill, Lehigh, Schuylkill, Maurice, C&D CanalMaurice, C&D Canal
Plans for enhanced Coastal endurance Plans for enhanced Coastal endurance lineline
National Water Quality Network: National Water Quality Network: DRB Pilot Study Area BoundaryDRB Pilot Study Area Boundary
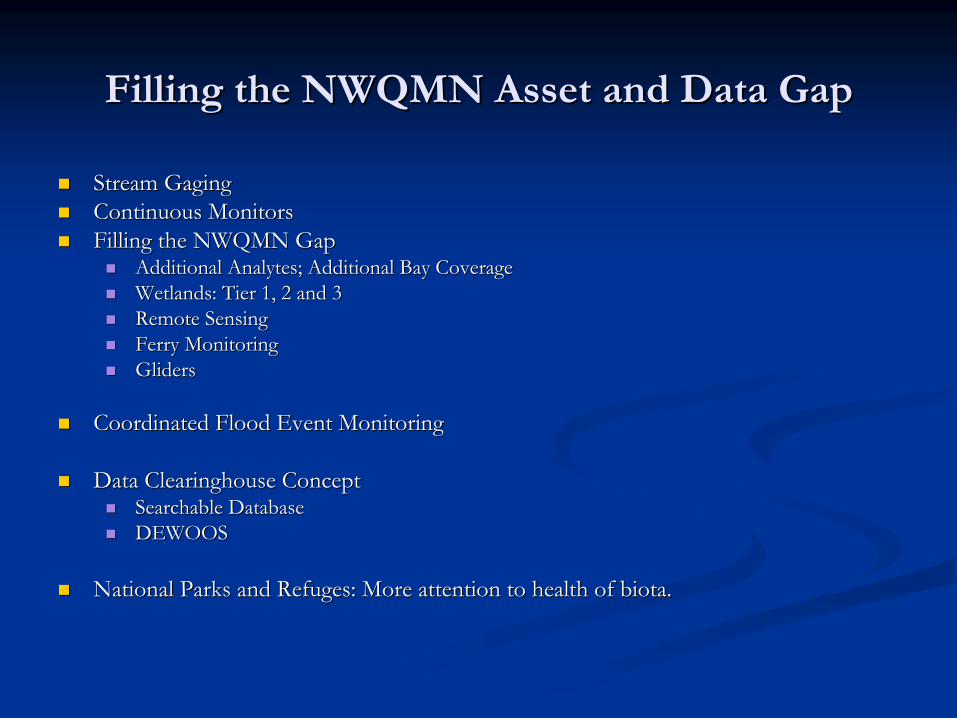
Filling the NWQMN Asset and Data GapFilling the NWQMN Asset and Data Gap
Stream Stream GagingGaging
Continuous MonitorsContinuous Monitors
Filling the NWQMN GapFilling the NWQMN Gap
Additional Additional AnalytesAnalytes; Additional Bay Coverage; Additional Bay Coverage
Wetlands: Tier 1, 2 and 3Wetlands: Tier 1, 2 and 3
Remote SensingRemote Sensing
Ferry MonitoringFerry Monitoring
GlidersGliders
Coordinated Flood Event MonitoringCoordinated Flood Event Monitoring
Data Clearinghouse ConceptData Clearinghouse Concept
Searchable DatabaseSearchable Database
DEWOOSDEWOOS
National Parks and Refuges: More attention to health of biota.National Parks and Refuges: More attention to health of biota.

DEWOOS Regional IOOS DEWOOS Regional IOOS ProposalProposal

MACOORA Workshop
MACOORA Themes – MARCOOS Products Cross-cut

Using Real Time Data in an Emergency Flow and Transport ModelNamsoo S. Suk, Ph.D., and John Yagecic, P.E.
P.O. Box 7360, 25 State Police Dr.,, West Trenton, NJ 08628-0360, Phone: 609-883-9500 Fax: 609-883-9522www.drbc.net
The Delaware River Basin Commission (DRBC) is coupling observations in the Delaware River and Bay with existing quality models to enhance response to spills in the estuary. the movement of chemicals in the estuary is accomplished different models; these are (1) a hydrodynamic model, which how water is moving in the estuary, and (2) a water quality describes how a chemical is reacting a diluting in the water. After the Athos I oil spill, DRBC realized that by the time a spill occurs, it is too late to begin assembling the input data sets for the models. The input data sets tell the models how much water is flowing into the estuary and how the tidal boundaries are rising and falling. To provide timely input to response actions, the hydrodynamic (water flow) portions of need to be run before spills occur. To address this problem, developed a series of computer programs that harvest real the internet, process the data into input files, and run the models.
DRBC's programs obtain via the internet real time flows at the Delaware River at Schuylkill River at Philadelphia from US Geological Survey's National Water (NWIS), forecasted flows at Trenton and Philadelphia from the National Weather Hydrologic Prediction Service (AHPS), and current and forecasted tidal elevations Ocean Services gages at the mouth of Delaware Bay and the canal the connects Delaware Bays, near New Castle, DE. DRBC's programs knit the observed and together into a continuous time series, and develop the model input files. The is run overnight. All of this work is automated, and occurs 365 days per year and holidays, with no human labor necessary.
Most the time, when no spill occurs, the model output file is simply overwritten the when a new hydrodynamic model is run. However, when there is a spill, DRBC the hydrodynamic output into a water quality model, and use information about the location, and duration, to predict where the plume will go, when peak when the plume will dissipate. In addition, the real time hydrodynamic domain are frequently used to validate the modeling results. Since the automated developed in 2006, DRBC have used the model several times, coordinating results intakes and response officials.
Recently, DRBC has provided its algorithms to the Philadelphia Water Department exploring incorporating the automated modeling into its Early Warning System water intakes when a spill has occurred. This would allow the spill data to be the water quality model from the EWS web page, as soon as the spill is reported, more rapid information on the likely movement of the plume.
FreshwaterBoundary
Discharge Dataand Predictions
SpillData
Predicted Location,Duration, and
Concentration ofImpacted W ater Intakes
Prescriptive Measures toMitigate Impact
Tidal BoundaryW ater Surface
Data andPredictions
Pre-Processordevelops model
input fileDYNHYD5 W ASP
Automated Daily ProcessesNo User Input Required
Water Quality Simulationin Response to Spill Event
Measured, Forecasted, and Extrapolated Forecasted Flowsat the Delaware River at Trenton (USGS Station 01463500)
0
5,000
10,000
15,000
20,000
25,000
30,000
35,000
4/13/06 5/3/06 5/23/06 6/12/06 7/2/06 7/22/06Date and Time
Flow
(CFS
)
Flow (CFS) Forecasted Flow (CFS) Extrapolated Forecasted Flow (CFS)
Observed and Predicted Water Surface Elevation, C&D Canal atChesapeake City, MD
NOAA Station 8573927
0.0
0.5
1.0
1.5
2.0
2.5
6/2/06 6/7/06 6/12/06 6/17/06 6/22/06 6/27/06 7/2/06 7/7/06 7/12/06Date
Wat
er S
urfa
ce E
leva
tion
(Met
ers
NG
VD
29)
Observed WSE (NGVD29) Predicted WSE (NGVD29)

NWQMC/IOOS Water Quality Story TemplateNWQMC/IOOS Water Quality Story Template September 15, 2009 Initial Draft (v.1)September 15, 2009 Initial Draft (v.1)
Water Quality Issue: D.O, Water Quality Issue: D.O, HABsHABs, Floatables, Toxics, Sediment, Freshwater , Floatables, Toxics, Sediment, Freshwater Inflow etc.Inflow etc.
User Community: Who cares and benefits from products?User Community: Who cares and benefits from products?
Process (coupling monitoring, models and other tools for enhancProcess (coupling monitoring, models and other tools for enhanced ed assessment that benefits management decisions from the watershedassessment that benefits management decisions from the watersheds to s to nearshorenearshore
to coasts)to coasts)
Networks: Integration across multiple networks and programsNetworks: Integration across multiple networks and programs
Integration of Models and other assessment tools with monitoringIntegration of Models and other assessment tools with monitoring
Integrated WaterIntegrated Water--Quality Assessment Quality Assessment
OutcomesOutcomes
Management outcome/decision that results from the assessment andManagement outcome/decision that results from the assessment and
(or)(or)
Development of dynamic management tools: Applications to supportDevelopment of dynamic management tools: Applications to support
or inform or inform decisiondecision--making (preferably in realmaking (preferably in real--time and in predictive mode)time and in predictive mode)
Metrics for tracking success and measuring performance (Return oMetrics for tracking success and measuring performance (Return on n Investment)Investment)
Value added from advances in technology (i.e. sensors), assessmeValue added from advances in technology (i.e. sensors), assessment tools, or nt tools, or processprocess
Gaps and needs for improved outcomesGaps and needs for improved outcomes

An Automated Water Quality eAn Automated Water Quality e--mail mail Notification SystemNotification System
DRBC developed an automated DRBC developed an automated application that performs the application that performs the following following dailydaily tasks:tasks:
Retrieves real time water quality Retrieves real time water quality observations from 8 USGS observations from 8 USGS monitoring stations (VBA program);monitoring stations (VBA program);
Compares observations to WQ Compares observations to WQ criteria;criteria;
Generates and sends eGenerates and sends e--mail to a list mail to a list server if observations are outside server if observations are outside criteria;criteria;
Operational since August Operational since August 20062006
Delaware Riverat Delran

Automated Water Quality Watch NotificationAutomated Water Quality Watch Notification
DRBC developed an automated application that performs the DRBC developed an automated application that performs the following following dailydaily tasks:tasks:
Retrieves real time water quality observations from 8 USGS Retrieves real time water quality observations from 8 USGS monitoring stations;monitoring stations;
Compares observations to WQ criteria;Compares observations to WQ criteria;
Generates and sends eGenerates and sends e--mail to a list server if observations are outside mail to a list server if observations are outside criteria;criteria;
StationDO
InstantaneousDO
24-hr average TemperaturepH
(min and max) TurbidityConductance
(surrogate for TDS)
Delaware River at Trenton, NJ01463500
Delaware River at Pt. Pleasant, PA01460200
Delaware River at Delran, NJ01467029
Delaware River at Ben Franklin Bridge01467200
Delaware River at Chester, PA01477050
Delaware River at Reedy Island Jetty01482800
Lehigh River at Easton, PA01454720
Brandywine at Chadds Ford, PA01481000

Benefits of this systemBenefits of this system
Fast notification of apparent WQ standard violations;Fast notification of apparent WQ standard violations;
Adaptive Monitoring;Adaptive Monitoring;
Faster recognition & repair of monitor malfunctions;Faster recognition & repair of monitor malfunctions;
Seeing in real time the linkages in parameters (i.e. pH Seeing in real time the linkages in parameters (i.e. pH violations upstream one week violations upstream one week –– DO violations DO violations downstream the following week);downstream the following week);
Fewer surprises at Integrated Assessment time;Fewer surprises at Integrated Assessment time;
Increase visibility and value of continuous monitors to Increase visibility and value of continuous monitors to management and funders;management and funders;
Better communication among states and other Better communication among states and other agencies in interstate waters.agencies in interstate waters.

Sample eSample e--mailmail
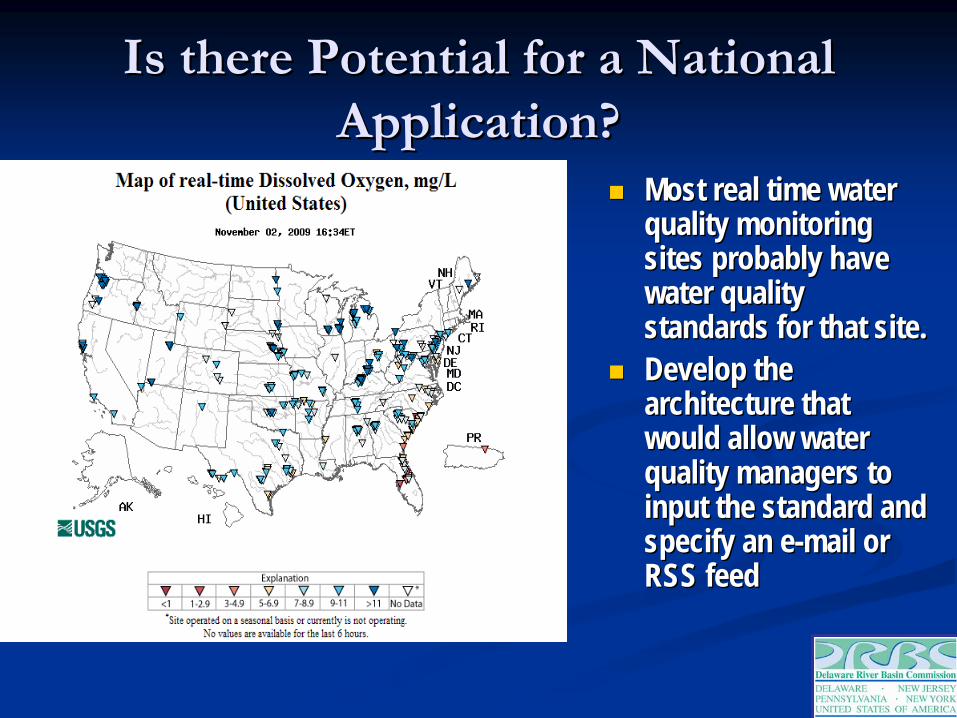
Is there Potential for a National Is there Potential for a National Application?Application?
Most real time water Most real time water quality monitoring quality monitoring sites probably have sites probably have water quality water quality standards for that site.standards for that site.
Develop the Develop the architecture that architecture that would allow water would allow water quality managers to quality managers to input the standard and input the standard and specify an especify an e--mail or mail or RSS feedRSS feed

A Brief Case Study in going from a A Brief Case Study in going from a Regional to National ScaleRegional to National Scale
DRBC developed automated app DRBC developed automated app for for dailydaily tasks:tasks:
Retrieves river forecast from Retrieves river forecast from 8 stations from National 8 stations from National Weather ServiceWeather Service’’s Advanced s Advanced Hydrologic Prediction Service Hydrologic Prediction Service (AHPS);(AHPS);
Generates and sends eGenerates and sends e--mail mail to a list server if stage to a list server if stage exceeds Flood Action criteria.exceeds Flood Action criteria.
NOAA modified the code to NOAA modified the code to develop a nationwide product develop a nationwide product released December 2006.released December 2006.

NOAA Incorporated the same algorithms NOAA Incorporated the same algorithms to develop a National Productto develop a National Product

Possibilities for future workPossibilities for future work
Could develop automated applications to combine Could develop automated applications to combine information from unrelated data sets to watch for resourceinformation from unrelated data sets to watch for resource-- specific set of conditions. For example: Ifspecific set of conditions. For example: If……
Salinity > x; andSalinity > x; and
Water temp. > y; andWater temp. > y; and
DO < z; andDO < z; and
No rain forecasted for the next 36No rain forecasted for the next 36--hours:hours:
For example For example -- VibrioVibrio
Then, send a warning to [email protected], send a warning to [email protected]

Nov 13, 2009 Cavallo & Silldorff (DRBC)Nov 13, 2009 Cavallo & Silldorff (DRBC) 18
StreamStatsStreamStats Investment as Cornerstone for Investment as Cornerstone for Ecological Flows Conflict ResolutionEcological Flows Conflict Resolution
• A nationwide need exists for state-level policies and tools to establish suitable in-stream ecological flows while maintaining human water use
• Crises in certain states (like CT, MI, ME) has already precipitated policy overhauls
• Two key tools can be used to balance water supply against ecological riski. Hydrologic flow statistics for any position in a stream network (e.g., Q90)ii. Daily flow time series for any position in a stream network (e.g., QPPQ)
• StreamStats (USGS) currently has the ability to estimate one or both of the key tools, but most implementations fail to achieve this potential

Nov 13, 2009 Cavallo & Silldorff (DRBC)Nov 13, 2009 Cavallo & Silldorff (DRBC) 19
Ecological Flows ConflictEcological Flows Conflict
• Historical use of Q7-10 pass-by has failed to protect aquatic resources
• State-level water regulation requires implementing state-wide policy at reasonable cost
• Scientific uncertainty remains in the appropriate balance between human abstraction and in-stream ecological needs
• Interim policies being developed under best professional judgment for balance between human and ecological needs
• New policies have pegged key hydrologic flow statistics– Maine: monthly median flows (Q50)– Connecticut: seasonal exceedance flows (Q99 to Q50)– Michigan: lowest monthly median flow (Q50)

Nov 13, 2009 Cavallo & Silldorff (DRBC)Nov 13, 2009 Cavallo & Silldorff (DRBC) 20
Hydrologic ChallengeHydrologic Challengejan feb mar apr may june july aug sept oct nov dec
050
100
150
• Most streams are ungaged, providing no basic information on their hydrology
• Traditional solution involved manual estimation methods by specialists
• StreamStats: A recently-developed USGS web-based GIS tool to delineate watershed areas and estimate selected flow statistics for any point within a domain (typically a state boundary)
• Roll-out of StreamStats has been state-by-state, with most states only implementing flood hydrology (omitting the full flow duration curve)
• Hydrologic foundation needed in some states to develop flow duration curve transfer equations

Nov 13, 2009 Cavallo & Silldorff (DRBC)Nov 13, 2009 Cavallo & Silldorff (DRBC) 21
Current Status of Current Status of StreamStatsStreamStats (Nov 2009)(Nov 2009)

Nov 13, 2009 Cavallo & Silldorff (DRBC)Nov 13, 2009 Cavallo & Silldorff (DRBC) 22
StreamStatsStreamStats for Bridging Needsfor Bridging Needs
Benefits• Transparent yet accurate scientific tool available to all stakeholders• Tool yields key hydrologic benchmark for decision-making
Users• Government regulators effectuating in-stream flow policies• Municipal, industrial/power, and agricultural water suppliers needing to
understand water availability relative to in-stream flow protections
Roll-Out• Group selection of hydrologic benchmarks for nationwide use• Phased implementation through coverage expansion, hydrologic
foundation, then content development