using and analysing data for economic transformation · pdf filethis includes moving between...
TRANSCRIPT

1
Participants attended the workshop from DFID, ODI, the World Bank, IMF, University of Groningen, Harvard Kennedy School and other institutions. The SET programme broadly defines a process moving labour and other resources from lower to higher productive activities. This includes moving between sectors towards higher value activities (e.g. from agriculture to manufacturing) and within sectors (e.g. from subsistence farming to high-value crops), and usually involves diversification and increased value addition in export activities.
ECONOMIC STRUCTURES DATA
REBASING GDP: COUNTRY-LEVEL EXAMPLES FROM AFRICA
Dirk Willem te Velde (SET programme director) presented the impact of GDP rebasing in terms of the percentage change in the level of GDP (new vs old estimates, using the examples of various African countries, using data from national statistical data sources). See Figures 1 and 2 below. In particular, Nigeria’s GDP was revised by 59.5% increase in 2010, with evidence of faster structural change with a strong increase in the share of the services sector, but with a decline in the share of agriculture and industry. The strongest increases in value added were in the Communication, Trade, Manufacturing and Real Estate sectors. Tanzania’s revision experienced an increase in GDP of 27.8% in 2007, with evidence of faster structural change with increases for the tertiary sector and decreases for the primary and secondary sector. The strongest increases in value added were in Crops, Hunting and Forestry, Real Estate and Business services, and Transport Services sectors. Participants noted the plausibility of GDP rebasing in Nigeria given growth in the Nigeria communications sector.
USING AND ANALYSING DATA FOR ECONOMIC TRANSFORMATION
SET Workshop Report
Leah Worrall
ODI | 30 January 2015

2
Figure 1. GDP rebasing for African countries (% change in base year)
Figure 2. Rebasing in Kenya, Nigeria and Uganda (% change in GDP, new vs old estimates)
Source: te Velde (2015)
MEASURING TRANSFORMATION AS PRODUCTIVITY GAINS FOR AFRICAN AGRICULTURE
Steve Wiggins (ODI) summarised a recent Gates Foundation workshop which focused on measuring in-country agricultural transformation through 1 or 2 key indicators, such as total factor productivity (see Figure 3). However when looking at the data, this aim becomes more difficult, as data for total factor productivity in agriculture includes production, labour, land and capital are of generally low quality. For example, labour (or employment) data suffer from seasonal variations, with highly variable daily hours, whilst methodologies employed for data gathering can be sub-optimal. One positive contribution from the LSMS-ISA database compiles plot, household and community level data for agriculture in 8 sub-Saharan African countries. Other options include innovative forms of data gathering including proxies, remote sensing and sentinel sites (e.g. on the ground respondents texting key stats on a monthly basis, rewarded with airtime). A key challenge is that the agricultural sector has a predominance of microanalyst/agronomist specialists that operate at a very small scale.
Figure 3. Growth in total factor productivity in agriculture
Source: Wiggins (2015)
Discussion centred on regional differences in the data due to differences in data quality, however noting that best guesses can still provide useful data. As well as the dynamism in output yields, with potential impacts on migration (though the link is not clear).
-0.5
0
0.5
1
1.5
2
2.5
3
61-69 70-79 80-89 90-99 00-07
% a
ye
ar
SS Africa
Lat America
Asia [-West Asia]
OECD industrial

3
THE LIBERIAN PERSPECTIVE ON ECONOMIC TRANSFORMATIO
Sehr Syed (Liberia Institute of Statistics and Geoinformation Services) outlined that Liberia aims to become a middle-income economy by 2020 and has put in place an agenda for transformation (5-year plan) to 2017. The Liberian Development Alliance put in place a number of indicators to track, originally 220 reduced to 50 with input from various stakeholders. However low capacity and few and far between surveys has meant a large disconnect between policy makers and data producers. One data series is the household income and expenditure survey – a nationally representative survey of 4,000 households (or 18,000 individuals), obtaining quarterly data by region, which is trying to include an integrated agricultural module on the same sample, an important consideration given the fertile land in Liberia and the need to increase exports. However the data gathering exercise has suffered under the recent Ebola health shock, with the most recent data gathered in the lean season but not again the harvest season, where poverty is likely to be higher than reflected in the lean season. Other methodological issues include field enumerators often measuring yields from areas of the field where the crop looked the best, problems with farmer recall, GPS systems not working in overcast weather and forests, whilst data collection is not proportionally representative for farms with different types of crops. Participants noted the potential trade-off in the frequency of data (to show learning by doing) and reliability of the data.
THE GGDC 10-SECTOR DATABASE
Gaaitzen de Vries (University of Groningen) presented an overview of the GGDC 10-Sector database and the pros and cons when compared with other databases. The GGDC 10-Sector database includes 10 broad sectors of the total economy, measures of value added, employment (split by gender for African countries) covering the period 1960 to 2010. The methodological approach adopted estimates the value added by sector and back casts this data using sector growth rates from historical statistics, where international consistency of cross-country sector data is ensured by the application of the SNA framework for the measurement of GDP, and using a consistent concept of employment including informal sector workers. The database relies heavily on population censuses. The aim is to ensure maximum transparency in the construction of the database and stimulate further research. He presented some pros and cons of various databases, see Table 1.
Table 1. Pros and cons of select databases
Data Source Pros Cons Users Groningen 10 sector database
10 sectors; employment includes informal sector, split by gender (for Africa); Much attention to consistency (internal, intertemporal and international)
Few LDCs included; Not on regular update schedule
Sector shares in value added and employment; labour productivity by sector
WB World Development Indicators
Many countries included; wide variable coverage
Limited background documentation, limited checks on consistency Three broad sectors
Sector shares in value added and employment; labour productivity by sector etc. etc.
UN National account statistics
7 sectors; GDP by economic activity and expenditure; Many countries included
No employment data; Includes imputed household rents
Sector shares in value added
ILO laborsta (/KILM)
Many countries included; wide coverage of employment variables
Mix of surveys and census information
Sector shares in employment
UNIDO Manufacturing database
Level of detail for manufacturing sub-sectors; wide country coverage
Manufacturing only; formal sector only; limited data points
Sector shares in value added and employment; labour productivity by sector

4
Demographic and Health surveys
Micro data; wide variable coverage
Nationally representative? Purpose of surveys; Limited years
Employment / occupation by sector, gender, age
Household surveys – LSMS
Micro data; wide variable coverage
Nationally representative? Limited years and country coverage
Employment / occupation by sector, gender, age
ADB Key Indicators
Broad sectors; GDP and employment by economic activity and expenditure;
Asian countries only; Some unresolved breaks, and incomplete coverage of employment
Sector shares in value added and employment; labour productivity by sector
Source: de Vries, 2015
USING MICRO DATA TO ANALYSE STRUCTURAL TRANSFORMATION
Maggie McMillan (IFPRI, CGIAR) outlined the use of Demographic and Health Survey (DHS) for data on health, environmental health, education, occupation and gender indicators; with significant differences across countries in the frequency of surveys. The occupational data can be used to document levels and changes in agriculture, alongside levels for other occupational categories, as well as measures of wellbeing where occupational shifts can occur. The advantages include the wide coverage of very poor countries, the detailed measures of wellbeing, and gender, age and geographic location, whilst the disadvantages include the lack of a measure on productivity and the lack of data capture on manufacturing (not included as an occupational category). However disadvantages include that there is no panel structure at individual level, no information on income and/or expenditure and no information on the informal sector. Tanzania has demonstrated significant positive structural changes. Using a myriad of data sources the ‘in between sector’ (defined as micro-, small- and medium-sized enterprises (MSMEs) with 1-99 workers) employment and productivity trends were analysed by sector, firm size, formality status, drivers of growth and the potential for small firms to contribute to productivity growth and structural change. The 5-49 employee firm size group grew from 45.26% employment in 2005 to 60.28% of employment in 2012. Firms with 1-49 employees accounted for 97.29% of employment in 2012. Figure 4 shows productivity heterogeneity of the Tanzanian in between sector. The key questions to focus on are how do these in between sectors contribute to productivity growth? (Directly and indirectly.) What kinds of policies are most effective for job creation and productivity in the in between sector? And, do certain in between sector firms have the potential to become large productive firms?
Figure 4. Productive Heterogeneity: In Between Sector Tanzania (WBES Survey, 2013)
Source: McMillan, 2015

5
Discussion focused on the important role of the ‘in between’ sector, particularly in producing goods for the domestic rather than international market. A distinction was noted between Brazil whose economy is becoming increasingly formalised (due to easier firm registration processes), and India whose informal sector is currently expanding. The reliability of DHS data was also questioned, with the potential for using UNIDO and GGDC 10-Sector data in order to develop a proxy data series.
DISCUSSION
Participants discussed the importance of understanding the quality of different data series in order to use data appropriately. Comparing different data series on the same indicators is a useful exercise to ascertain similarities and similarities. On firm-level analysis, analysing the dispersion of the residuals of firm total factor productivity reveals higher dispersions within developing than developed countries, where there is greater pressure to move towards the technological frontier. The example of de Vries et al. (2014) was also highlighted, addressing inter-sectoral shifts in employment from sectors with higher average productivity per worker to lower average productivity per worker, demonstrating dynamic losses through decreasing labour productivity.
TRADE DATA
EXPORT QUALITY IN ADVANCED AND DEVELOPING COUNTRIES: EVIDENCE FROM A NEW DATASET
Chris Papageorgiou (IMF). The IMF has developed an export quality database based on COMTRADE data, to also include developing countries, given quality upgrading is a crucial component of development (alongside diversification). The methodological approach involved estimating a quality-augmented gravity equation, calculating quality estimates through the coefficients of the gravity equation, and normalising them to aggregate across sectors. The quality indicators are available for different product classifications and sectoral levels, and varying levels of disaggregation. Figure 5 presents quality by region, and figure 6 cross-country heterogeneity in quality upgrading in Asia. The results demonstrate that, for example, quality demanded in destination markets is not a constraint for low-income countries, therefore policy should aim to focus on domestic quality upgrading itself rather than helping domestic firms enter higher quality export markets. Ke Wang (IMF) provided further background on the IMF Export Diversification and Quality Databases and the IMF Data Mapper.
Figure 5. Quality by region over time (quality index, 1965-2010, developing countries, av. by region)
Source: Papageorgiou & Wang, 2015
0.5 0.6 0.7 0.8 0.9
Latin America & Caribbean
Eastern Europe & Central Asia
East Asia & Pacific
South Asia
Middle East & North Africa
Sub-Saharan Africa
Quality Index, 1965-2010Developing Countries, Average by Region

6
Figure 6. Quality upgrading in Asia: cross-country heterogeneity
Source: Papageorgiou & Wang, 2015
Discussion focused on the advantages of focusing on quality-upgrading rather than diversification. The granularity of the databases means these are a gold mine for various levels of data analysis and disaggregation, including policy impacts at macro level. On a conceptual level there is a challenge in connecting quality upgrading, export diversification and structural transformation – where export diversification has to do with labour migration to higher productivity sectors; with quality upgrading related to agricultural and manufacturing goods. The importance of identifying transition points is also important, as trade may be less relevant for countries at lower levels of income. Discussants also noted problems of data availability for trade in value added data, despite its importance in within sector and cross sector analysis. The importance is noted by its often contrasting findings when compared with other trade data analysis. Given increasing global fragmentation of goods, the average share in value added is likely decreasing.
MEASURING ECONOMIC UPGRADING IN GLOBAL VALUE CHAINS
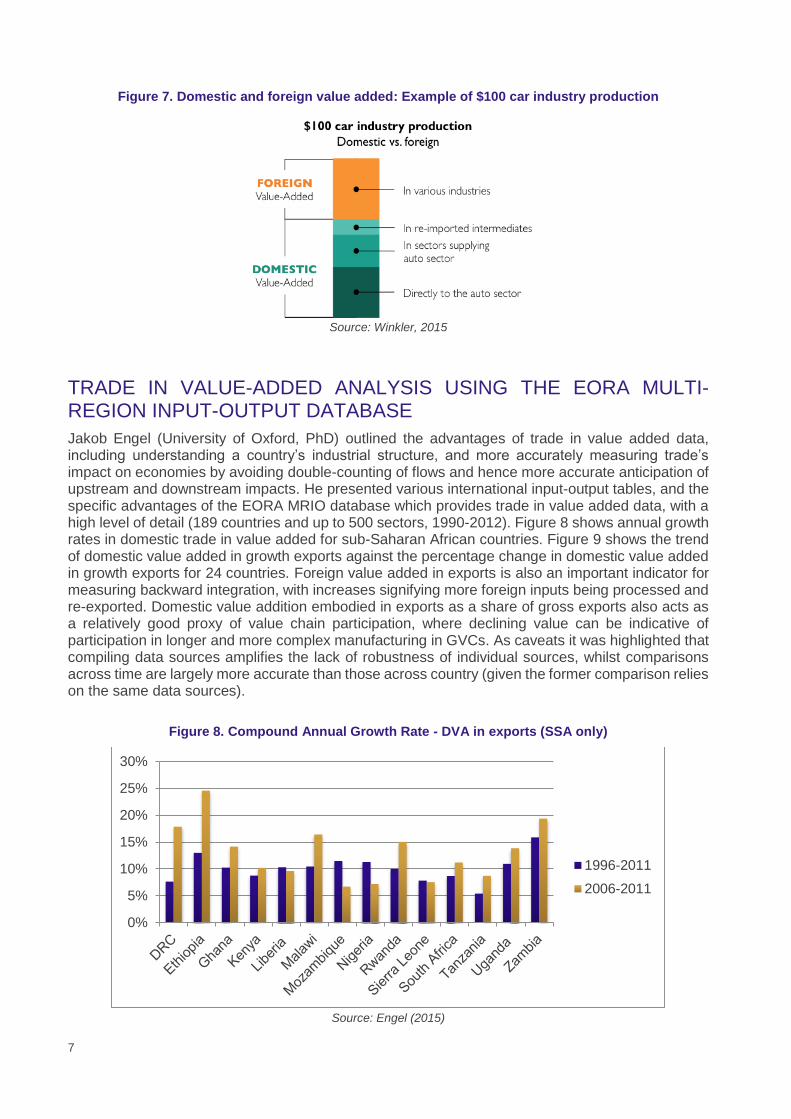
Deborah Winkler (World Bank) outlined the global value chain (GVC) agenda at the World Bank Group, and measuring economic upgrading in GVCs using (1) trade in value added data and (2) firm-level data. Four types of economic upgrading include process upgrading, product upgrading, functional upgrading (e.g. tasks) and intersectoral upgrading. (1) Trade in value added data are based on international input-output tables which allows differentiation between domestic and foreign value added (see Figure 7), however country coverage of international input-output tables is limited (with the exception of EORA). The focus should be increasing the growth of domestic value added in gross exports, and analysing which channels can be used to increase domestic value added. (2) Enterprise survey data represents a comprehensive source of firm-level data in emerging markets and developing economies, using a stratified (according to sector, firm size and subnational region) and random sample of firms, and also covering a wide range of indicators (business environment, innovation and technology, and workforce and skills). The types of questions that can be answered include, what is the nature of a country’s GVC linkages? And, what is the impact of GVC integration on firm-level productivity, and how do firm and country characteristics mediate this relationship? Discussion identified issues with classifying goods as intermediate, final, capital or consumption goods. With economic upgrading it is important to not only look at domestic value added, but also whether the added value is derived from high-skilled or low-skilled workers – as low-skilled value addition might not involve economic upgrading. The definition used for upgrading is important, as this can also have an impact on workers and jobs (social upgrading). But there is a need to differentiate between upgrading and densification. If more firms are carrying out value addition, it will be important for the economy, and in the medium-term linking firms to GVCs is important, regardless of the skill of labour.
7
Figure 7. Domestic and foreign value added: Example of $100 car industry production
Source: Winkler, 2015
TRADE IN VALUE-ADDED ANALYSIS USING THE EORA MULTI-REGION INPUT-OUTPUT DATABASE
Jakob Engel (University of Oxford, PhD) outlined the advantages of trade in value added data, including understanding a country’s industrial structure, and more accurately measuring trade’s impact on economies by avoiding double-counting of flows and hence more accurate anticipation of upstream and downstream impacts. He presented various international input-output tables, and the specific advantages of the EORA MRIO database which provides trade in value added data, with a high level of detail (189 countries and up to 500 sectors, 1990-2012). Figure 8 shows annual growth rates in domestic trade in value added for sub-Saharan African countries. Figure 9 shows the trend of domestic value added in growth exports against the percentage change in domestic value added in growth exports for 24 countries. Foreign value added in exports is also an important indicator for measuring backward integration, with increases signifying more foreign inputs being processed and re-exported. Domestic value addition embodied in exports as a share of gross exports also acts as a relatively good proxy of value chain participation, where declining value can be indicative of participation in longer and more complex manufacturing in GVCs. As caveats it was highlighted that compiling data sources amplifies the lack of robustness of individual sources, whilst comparisons across time are largely more accurate than those across country (given the former comparison relies on the same data sources).
Figure 8. Compound Annual Growth Rate - DVA in exports (SSA only)
Source: Engel (2015)
0%
5%
10%
15%
20%
25%
30%
1996-2011
2006-2011

8
Figure 9. Domestic value added in exports as a share of exports
Source: Engel (2015)
Participants outlined difficulties in using EORA data for regression analysis, given the EORA database is already based on assumptions, interpolations and estimates. Alternatives to consider would be: using the OECD TiVA database; complementing EORA data with on-the-ground data (as the World Bank is doing); use UNIDO’s gross output data, subtracting the value of intermediate consumption. Discussion also noted the need to be careful with growth in domestic trade in value added, as this could increase simply due to growth in exports. There is also a trade-off in the volume of products and the value addition (or price increase) for products, as lowering domestic value addition (hence prices) could increase the volume of exports.
CAPABILITIES, THE PRODUCT SPACE AND BEYOND
Frank Neffke (Harvard Kennedy School) presented the Hausmann approach to product space analysis. The product theory is based on the following assumptions:
1. The diversification of a country is the number of different products the country exports 2. The ubiquity of a product is the number of different countries that export the product 3. Countries are complex if they make many products 4. Products are complex if only few countries can make them 5. Countries are complex if they make sophisticated products 6. Products are sophisticated if they are made by complex countries
When these assumptions are put together they result in a level of country complexity in traded goods (see Figure 10). This converges with the level of income of a country (see Figure 11), with product space analysis being very good at predicting growth of countries (better than, for example, the Human Development Index). If two products are often made by the same country, they are likely to use similar capabilities, whilst co-occurrence of products in export baskets of different countries should be an indication of proximity in capabilities. One can map the product space for countries (see Figure 12). In general, countries diversify into products that proximate products they already make, whilst regional portfolios develop in ways similar to the export basket of countries. You can measure skill relatedness, using 3 assumptions:
1. When changing jobs, workers make those skills redundant that were used in the old job, but not in the new
2. To limit human capital redundancies, workers will switch among industries with similar skills 3. Therefore, labor flows are an indication of the skill relations among industries
These assumptions are used to produce a mapping of labour markets. Given the amount of diversification depends on the relatedness of the new activity to the old ones, skill relatedness can be used to assess structural change.
0.0%
20.0%
40.0%
60.0%
80.0%
100.0%
120.0%
-20% -15% -10% -5% 0% 5% 10%
Change in DVA as a share of gross exports, 1996-2011
DVA as a share of gross exports, 2011

9
Figure 10. Level of complexity of traded goods according to country
Source: Neffke, 2015
Figure 11. Country level income against economic capability
Source: Neffke, 2015
Figure 12. Country-level product space mapping
Source: Neffke, 2015
GD
P p
er
cap
ita
Economic capability

10
Discussion noted the complexity of export outputs may be reduced by importing complex inputs, hence reducing the level of expertise required (e.g. simple assembly), and changing the product space. Given trade reflects latent capabilities, it would be important to then determine what these capabilities (or determinants) are, including for example skills, diversification and proximity to suppliers. Innovation is often not the constraint to economic development (but rather determining why countries aren’t employing new innovations or why there is slow diffusion to development countries) and many manufacturing or services innovations are not patented. But there do remain some important questions on the role of innovation.
CONCLUDING REMARKS
Participants noted the importance of different sources of data for measuring the quality of growth, including economic transformation and diversification processes. It is important in triangulating data for specific purposes to juxtapose macro-, micro-scale, economic structures and trade data, in order to understand economic transformation processes. They also noted the importance of providing guidance on the quality of data series and hence what the data should be used for. Dirk Willem te Velde (SET programme director) thanked the participants and speakers for joining the workshop.

Website
REFERENCES de Vries, G. (2015) The GGDC 10-Sector Database. Presented at the SET data workshop ‘Using and analysing
data for economic transformation’ at Overseas Development Institute, London, January 30, 2015.
de Vries, G., Timmer, M. and de Vries, K. (2014) Structural Transformation in Africa: Static Gains, Dynamic Losses. Paper Prepared for the IARIW 33rd General Conference Rotterdam, the Netherlands, August 24-30, 2014. Engel, J. (2015) Trade in value-added analysis using the EORA Multi-Region Input-Output database. Presented
at the SET data workshop ‘Using and analysing data for economic transformation’ at Overseas Development
Institute, London, January 30, 2015.
McMillan, M. (2015) Using Micro Data to Measure Structural Change. Presented at the SET data workshop
‘Using and analysing data for economic transformation’ at Overseas Development Institute, London, January
30, 2015.
Neffke, F. (2015) Capabilities, the product space and beyond. Presented at the SET data workshop ‘Using and
analysing data for economic transformation’ at Overseas Development Institute, London, January 30, 2015.
Papageorgiou, C. and Wang, K. (2015) Export quality in advanced and developing countries: Evidence from
new datasets. Presented at the SET data workshop ‘Using and analysing data for economic transformation’ at
Overseas Development Institute, London, January 30, 2015.
SET. (2015) Nigeria: Data on economic transformation. Supporting document to the SET data workshop ‘Using
and analysing data for economic transformation’. Overseas Development Institute, London, January 30, 2015.
SET. (2015) Sources and methods of data on economic transformation. Supporting document to the SET data
workshop ‘Using and analysing data for economic transformation’ at Overseas Development Institute, London,
January 30, 2015.
te Velde, D.W. (2015) SET Introduction – aims of the day. Presented at the SET data workshop ‘Using and
analysing data for economic transformation’. Overseas Development Institute, London, January 30, 2015.
te Velde, D.W. (2015) GDP rebasing and economic transformation in Africa. Presented at the SET data
workshop ‘Using and analysing data for economic transformation’ at Overseas Development Institute, London,
January 30, 2015.
Wiggins, S. (2015) Measuring transformation as productivity gains for African agriculture. Presented at the SET
data workshop ‘Using and analysing data for economic transformation’ at Overseas Development Institute,
London, January 30, 2015.
Winkler, D. (2015) Measuring economic upgrading in global value chains. Presented at the SET data workshop
‘Using and analysing data for economic transformation’ at Overseas Development Institute, London, January
30, 2015.