usfos buoyancy and mass (1)
DESCRIPTION
Usfos Buoyancy and Mass (1)TRANSCRIPT

________________________________________________________________________________________
USFOS BUOYANCY AND MASS 2010-08-01
1
U S F O S
B u o y a n c y And
Hydrodynamic M a s s

________________________________________________________________________________________
USFOS BUOYANCY AND MASS 2010-08-01
2
CONTENTS:
1 INTRODUCTION .................................................................................................................................... 3
2 ACCURACY LEVELS ............................................................................................................................ 3 2.1 LEVEL-0 .............................................................................................................................................. 3 2.2 LEVEL-1 .............................................................................................................................................. 3 2.3 “PANEL MODEL”.................................................................................................................................. 3
3 EX 1. SINGLE PIPE. NON FLOODED................................................................................................. 4 3.1 ACCURACY LEVEL 0............................................................................................................................ 5 3.2 ACCURACY LEVEL 1 (DEFAULT) ......................................................................................................... 5 3.3 PANEL MODEL (SURFACE PRESSURE INTEGRATION) ............................................................................ 5
4 EX 2. SINGLE PIPE. 100% FLOODED................................................................................................ 6 4.1 ACCURACY LEVEL 0............................................................................................................................ 7 4.2 ACCURACY LEVEL 1 (DEFAULT) ......................................................................................................... 7 4.3 PANEL MODEL (SURFACE PRESSURE INTEGRATION) ............................................................................ 7
5 EX 3. SINGLE PIPE. NON-FLOODED + EXTERNAL BUOYANCY. ............................................. 8 5.1 ACCURACY LEVEL 0............................................................................................................................ 9 5.2 ACCURACY LEVEL 1 (DEFAULT) ......................................................................................................... 9 5.3 PANEL MODEL (SURFACE PRESSURE INTEGRATION) ............................................................................ 9
6 EX 4. SINGLE PIPE. FLOODED. IN/OUT OF WATER. ................................................................. 10 6.1 ACCURACY LEVEL 0.......................................................................................................................... 11 6.2 ACCURACY LEVEL 1 (DEFAULT) ....................................................................................................... 12 6.3 PANEL MODEL (SURFACE PRESSURE INTEGRATION) .......................................................................... 12
7 EX 5. EIGENVALUES. IN/OUT OF WATER. LEVEL 1.................................................................. 13 7.1 COMPLETELY SUBMERGED................................................................................................................ 15 7.2 COMPLETELY DRY ............................................................................................................................ 15
8 EX 6. HORIZONTAL PIPE. IN/OUT OF WATER ........................................................................... 16 8.1 EMPTY. ACCURACY LEVEL 0 ............................................................................................................ 17 8.2 EMPTY. ACCURACY LEVEL 1 (DEFAULT) .......................................................................................... 17 8.3 EMPTY. PANEL MODEL (SURFACE PRESSURE INTEGRATION)............................................................. 17 8.4 FLOODED. ACCURACY LEVEL 0 ........................................................................................................ 18 8.5 FLOODED. ACCURACY LEVEL 1 (DEFAULT) ...................................................................................... 18 8.6 FLOODED. PANEL MODEL (SURFACE PRESSURE INTEGRATION)......................................................... 18 8.7 EMPTY. NORMAL CD AND CM........................................................................................................... 19 8.8 FLOODED. NORMAL CD AND CM....................................................................................................... 20 8.9 NORMAL PIPE. FLOODED. NORMAL CD AND CM............................................................................... 21 8.10 NORMAL PIPE. BUOYANT. NORMAL CD AND CM. WITH/WITHOUT MARINE GROWTH..................... 22
9 EX 7. NORTH SEA JACKET ............................................................................................................... 23 9.1 ACCURACY LEVEL 0.......................................................................................................................... 24 9.2 ACCURACY LEVEL 1 (DEFAULT)....................................................................................................... 25
10 SUMMARY AND CONCLUSIONS ................................................................................................. 26

________________________________________________________________________________________
___________________________________________________________________________________ USFOS BUOYANCY AND MASS 2010-08-01
3
1 Introduction USFOS has different models for computing the hydrodynamic parameters in and the more accurate models, the longer computation time. This document will describe the different alternatives.
2 Accuracy Levels
2.1 Level-0 The simplest model for hydrodynamic forces and masse is based on the following:
Added mass is computed once and is not updated during simulation The weight of the marine growth is assumed neutral in water. Weight of marine
growth above mean water level is not accounted for. Buoyancy of the steel wall thickness is disregarded for flooded members. The buoyancy is computed based on the instantaneous wave surface, and is set
equal to the weight of water for the submerged volume of the pipe. Morrison forces are based on the instantaneous wave surface A gradual transition between completely wet, (submerged), and dry, (completely
out of water), is ensured by using higher density of integration points for elements in the splash zone.
2.2 Level-1 “Level 1 “ is the default model for hydrodynamic forces and masse from USFOS version 855 and is based on the following:
Added mass is computed every time step based on the instantaneous wet surface. Partly submerged elements are accounted for with a gradual transition between completely submerged and completely out of water.
The actual weight of the marine growth, (could be user defined), is included. It is assumed that the density of marine growth remains constant when the element moves in and out of water.
Buoyancy of the steel wall thickness is included. The buoyancy is computed based on the instantaneous wave surface, and is set
equal to the weight of water for the submerged volume of the pipe. “Morrison forces” are based on the instantaneous wave surface. A gradual transition between completely wet, (submerged), and dry, (completely
out of water), is ensured by using higher density of integration points for elements in the splash zone.
2.3 “Panel model” The “panel model” is based on integration of the hydrodynamic pressure acting on the submerged part of the pipe. Internal fluid level and position are continuously computed. The other effects are the same as for “Level –1”.
________________________________________________________________________________________
___________________________________________________________________________________ USFOS BUOYANCY AND MASS 2010-08-01
4
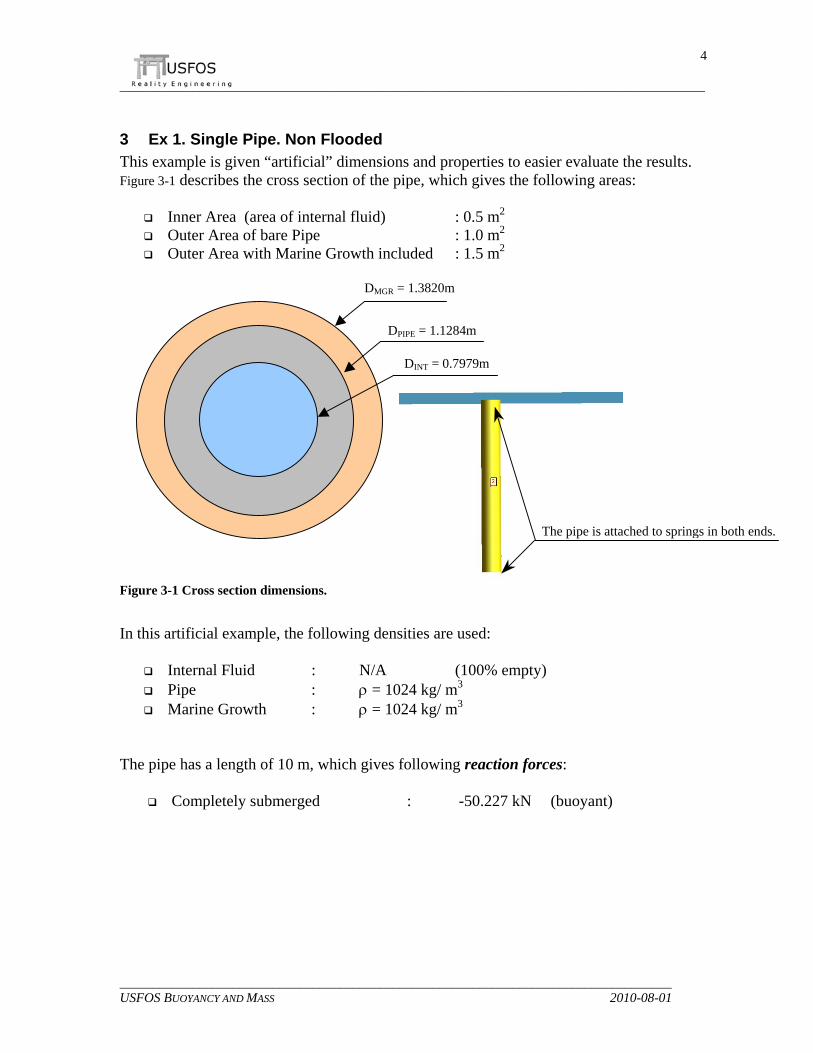
3 Ex 1. Single Pipe. Non Flooded This example is given “artificial” dimensions and properties to easier evaluate the results. Figure 3-1 describes the cross section of the pipe, which gives the following areas:
Inner Area (area of internal fluid) : 0.5 m2 Outer Area of bare Pipe : 1.0 m2 Outer Area with Marine Growth included : 1.5 m2
Figure 3-1 Cross section dimensions. In this artificial example, the following densities are used:
Internal Fluid : N/A (100% empty) Pipe : ρ = 1024 kg/ m3 Marine Growth : ρ = 1024 kg/ m3
The pipe has a length of 10 m, which gives following reaction forces:
Completely submerged : -50.227 kN (buoyant)
DMGR = 1.3820m
DPIPE = 1.1284m
DINT = 0.7979m
The pipe is attached to springs in both ends.

________________________________________________________________________________________
___________________________________________________________________________________ USFOS BUOYANCY AND MASS 2010-08-01
5
3.1 Accuracy Level 0 “Level-0” gives correct reaction (50 kN) for the empty, submerged pipe.
Figure 3-2 Z-reaction for 100% submerged cylinder. Non-Flooded.
3.2 Accuracy Level 1 (default) “Level-1” gives correct reaction (50 kN) for the empty, submerged pipe.
Figure 3-3 Z-reaction for 100% submerged cylinder. Non-Flooded.
3.3 Panel Model (surface pressure integration) “Panel model” gives correct reaction (50 kN) for the empty, submerged pipe.
Figure 3-4 Z-reaction for 100% submerged cylinder. Non-Flooded.

________________________________________________________________________________________
___________________________________________________________________________________ USFOS BUOYANCY AND MASS 2010-08-01
6
4 Ex 2. Single Pipe. 100% Flooded This example is designed to give a completely weight neutral pipe and “artificial” dimensions and properties are used to easier evaluate the results. Figure 4-1 describes the cross section of the pipe, which gives the following areas:
Inner Area (area of internal fluid) : 0.5 m2 Outer Area of bare Pipe : 1.0 m2 Outer Area with Marine Growth included : 1.5 m2
Figure 4-1 Cross section dimensions. In this artificial example, the following densities are used:
Internal Fluid : ρ = 1024 kg/ m3 Pipe : ρ = 1024 kg/ m3 Marine Growth : ρ = 1024 kg/ m3
The pipe has a length of 10 m, which gives following reaction force:
Completely submerged : 0.000 kN
DMGR = 1.3820m
DPIPE = 1.1284m
DINT = 0.7979m
The pipe is attached to springs in both ends.

________________________________________________________________________________________
___________________________________________________________________________________ USFOS BUOYANCY AND MASS 2010-08-01
7
4.1 Accuracy Level 0 This example demonstrates the lack of buoyancy of the pipe wall thickness, and incorrect reaction is obtained. (However, the inaccuracy if this model is relatively less for normal thin wall steel pipes, see example for a real jacket).
Figure 4-2 Z-reaction for 100% submerged cylinder. Non-Flooded.
4.2 Accuracy Level 1 (default) “Level-1” gives correct reaction (0 kN) for the flooded, submerged pipe.
Figure 4-3 Z-reaction for 100% submerged cylinder. Non-Flooded.
4.3 Panel Model (surface pressure integration) “Panel model” gives correct reaction (0 kN) for the flooded, submerged pipe.
Figure 4-4 Z-reaction for 100% submerged cylinder. Non-Flooded.

________________________________________________________________________________________
___________________________________________________________________________________ USFOS BUOYANCY AND MASS 2010-08-01
8
5 Ex 3. Single Pipe. Non-Flooded + External Buoyancy. This demonstrates the effect of using external buoyancy elements (in this example assumed weightless). Figure 5-1 describes the cross section of the pipe, which gives the following areas:
Inner Area (area of internal fluid) : 0.5 m2 Outer Area of bare Pipe : 1.0 m2 Outer Area with Marine Growth included : 1.5 m2
Figure 5-1 Cross section dimensions. In this artificial example, the following densities are used:
Internal Fluid : N/A (100% empty) Pipe : ρ = 1024 kg/ m3 “Marine Growth” : ρ = 0 kg/ m3 (Weightless buoyancy)
The pipe has a length of 10 m, which gives following reaction force:
Completely submerged : -100.454 kN (buoyant)
DMGR = 1.3820m
DPIPE = 1.1284m
DINT = 0.7979m
The pipe is attached to springs in both ends.

________________________________________________________________________________________
___________________________________________________________________________________ USFOS BUOYANCY AND MASS 2010-08-01
9
5.1 Accuracy Level 0 This example demonstrates the lack of buoyancy of the pipe wall thickness, (50 kN), and incorrect reaction (-50 kN) is obtained.
Figure 5-2 Z-reaction for 100% submerged cylinder. Non-Flooded. External Buoyancy
5.2 Accuracy Level 1 (default) “Level-1” gives correct reaction of -100 kN.
Figure 5-3 Z-reaction for 100% submerged cylinder. Non-Flooded. External Buoyancy
5.3 Panel Model (surface pressure integration) “Panel model” gives correct reaction of -100 kN.
Figure 5-4 Z-reaction for 100% submerged cylinder. Non-Flooded. External Buoyancy

________________________________________________________________________________________
___________________________________________________________________________________ USFOS BUOYANCY AND MASS 2010-08-01
1
6 Ex 4. Single Pipe. Flooded. In/Out of water. This example has the same “artificial” dimensions and properties as used in example 1. The mean water level is set to the centre of the vertical pipe, see Figure 6-1. A wave with height 12 m results in both completely submerged and completely dry element, see Figure 6-2.
Inner Area (area of internal fluid) : 0.5 m2 Outer Area of bare Pipe : 1.0 m2 Outer Area with Marine Growth included : 1.5 m2
Figure 6-1 Cross section dimensions and pipe model. In this artificial example, the following densities are used:
Internal Fluid : ρ = 1024 kg/ m3 Pipe : ρ = 1024 kg/ m3 Marine Growth : ρ = 1024 kg/ m3
The pipe has a length of 10 m, which gives following reaction forces assuming that the marine growth density is constant when the pipe goes in and out of water:
Completely submerged : 0.000 kN (“Hydro Static”) Completely out of water (dry) : 150.682 kN
DMGR = 1.3820m
DPIPE = 1.1284m
DINT = 0.7979m
The pipe is attached to springs in both ends.
MWL

________________________________________________________________________________________
___________________________________________________________________________________ USFOS BUOYANCY AND MASS 2010-08-01
1
Figure 6-2 The Pipe is fully submerged (left) and completely dry (right) as the wave moves.
6.1 Accuracy Level 0 Since “level-0” skips the buoyancy calculation for flooded members, the reaction reflects the weight of the pipe (wall) only causing incorrect result. This means that level-0 accuracy cannot be used for structures, where flooded members go in and out of the water, and where these members have significant impact on the total buoyancy (and stability). Not recommended for floating structures.
Figure 6-3 Z-reaction for cylinder. Flooded.

________________________________________________________________________________________
___________________________________________________________________________________ USFOS BUOYANCY AND MASS 2010-08-01
1
6.2 Accuracy Level 1 (default) “Level-1” model gives correct reaction (within the limitation of the buoyancy theory, see “panel model” below). At times 0, 10 and 20, the cylinder is completely submerged, and this gives no reaction since the cylinder is weight neutral. When the cylinder is completely dry, the reaction is 150 kN, which is correct, (weight of pipe wall + internal fluid + marine growth = 50kN + 50kN + 50kN).
Figure 6-4 Z-reaction for cylinder. Flooded.
6.3 Panel Model (surface pressure integration) Most correct reaction is obtained for a vertical cylinder when the “panel model” is used. The “Archimedes” theory of buoyancy is valid for hydrostatic conditions only (“flat sea”). Since the cylinder is 100% vertical, the pressure on the cylinder bottom conducts the buoyancy. The dynamic pressure is reduced for increasing depth, and therefore, the “neutral” cylinder does not give zero reaction. This model is time consuming, but is recommended for relatively long and vertical floating columns.
Figure 6-5 Z-reaction for cylinder. Flooded.

________________________________________________________________________________________
___________________________________________________________________________________ USFOS BUOYANCY AND MASS 2010-08-01
1
7 Ex 5. EigenValues. In/Out of water. Level 1. In order to document how the system mass matrix is changing as the pipe goes in and out of water, an eigenvalues analysis is performed for different wave positions. The same cross section parameters are used, but the spring stiffness adjusted to give a period of 1.0 sec for the fully submerged pipe (horizontal modes). This example is done with “level-1” accuracy only.
Inner Area (area of internal fluid) : 0.5 m2 Outer Area of bare Pipe : 1.0 m2 Outer Area with Marine Growth included : 1.5 m2
Figure 7-1 Cross section dimensions. In this artificial example, the following densities are used:
Internal Fluid : ρ = 1024 kg/ m3 Pipe : ρ = 1024 kg/ m3 Marine Growth : ρ = 1024 kg/ m3
Total Mass dry : 15,360 kg Added mass for Cm=2 : 15,360 kg Total Mass wet : 30,720 kg
The natural frequency, ω = Sqrt (K/M), where ω = 2π/T. This gives a stiffness: K=4π2 M to get T=1s, and each of the two springs gets k=2π2 M. The same stiffness is defined in X-Y and Z-directions.
DMGR = 1.3820m
DPIPE = 1.1284m
DINT = 0.7979m
The pipe is attached to springs in both ends.
MWL

________________________________________________________________________________________
___________________________________________________________________________________ USFOS BUOYANCY AND MASS 2010-08-01
1
Figure 7-2 describes the wave elevation history for the regular wave with H=12m and T=10s. Figure 7-3, Figure 7-4 and Figure 7-5 present the total mass as function of time for X- Y and Z direction respectively. The added mass of 15,000 kg is gradually reduced as the cylinder becomes dry for the lateral directions. The vertical mass, however, is constant since no added mass in the longitudinal direction is accounted for.
Figure 7-2 Wave Elevation History
Figure 7-3 Total Mass (stru+hydrodynamic) as function of time. X-direction
Figure 7-4 Total Mass (stru+hydrodynamic) as function of time. Y-direction

________________________________________________________________________________________
___________________________________________________________________________________ USFOS BUOYANCY AND MASS 2010-08-01
1
Figure 7-5 Total Mass (stru+hydrodynamic) as function of time. Z-direction
7.1 Completely Submerged The eigenvalue analysis is performed at time=0.1 when the cylinder is fully submerged. The two horizontal modes has a period of 1.00 sec. Mode no 3, vertical motion has a period of 0.71s since the mass is the half. Figure 7-6 Eigen Periods for completely submerged cylinder
7.2 Completely Dry The eigenvalue analysis is performed at time=5s when the cylinder is completely dry. All 3 modes have period = 0.71s since the mass is the same for all three direction (=15,000kg). Figure 7-7 Eigen Periods for completely dry cylinder
Mode no. 1 : 1.00 [s] Mode no. 2 : 1.00 [s] Mode no. 3 : 0.71 [s]
Mode no. 1 : 0.71 [s] Mode no. 2 : 0.71 [s] Mode no. 3 : 0.71 [s]

________________________________________________________________________________________
___________________________________________________________________________________ USFOS BUOYANCY AND MASS 2010-08-01
1
8 Ex 6. Horizontal Pipe. In/Out of water This example describes the vertical reaction for a horizontal pipe going in and out of water, both empty and buoyant. Figure 8-1describes the cross section and orientation of the pipe. Cd = 0.0 and Cm=0.0 in this example, (no wave forces will be included in z-reaction).
Inner Area (area of internal fluid) : 0.5 m2 Outer Area of bare Pipe : 1.0 m2 Outer Area with Marine Growth included : 1.5 m2
Figure 8-1 Cross section dimensions. The following densities are used: Empty Flooded
Internal Fluid : N/A ρ = 1024 kg/ m3 Pipe : ρ = 1024 kg/ m3 ρ = 1024 kg/ m3 Marine Growth : ρ = 1024 kg/ m3 ρ = 1024 kg/ m3
The pipe has a length of 10 m, which gives following reaction forces: Empty Flooded
Completely wet : -50.227 kN, (buoyant) 0.000 kN Completely dry : 100.454 kN 150.682 kN
Figure 8-2 The pipe is completely submerged and completely dry
DMGR = 1.3820m
DPIPE = 1.1284m
DINT = 0.7979m
The pipe is attached to springs in both ends.

________________________________________________________________________________________
___________________________________________________________________________________ USFOS BUOYANCY AND MASS 2010-08-01
1
8.1 Empty. Accuracy Level 0 “Level-0” gives correct reaction fully submerged (50 kN ), but the weight of the Marine Growth (50 kN) is missing when the pipe is completely dry. =>Incorrect reaction for dry.
Figure 8-3 Z-reaction for 100% wet/dry cylinder. Non-Flooded.
8.2 Empty. Accuracy Level 1 (default) “Level-1” gives correct reaction (-50 kN / 100kN) for the empty, wet/dry pipe.
Figure 8-4 Z-reaction for 100% wet/dry cylinder. Non-Flooded.
8.3 Empty. Panel Model (surface pressure integration) “Panel model” gives correct reaction (-50 kN / 100kN) for the empty, wet/dry pipe. The pressure integration gives some small differences for the fully submerged.
Figure 8-5 Z-reaction for 100% wet/dry cylinder. Non-Flooded.

________________________________________________________________________________________
___________________________________________________________________________________ USFOS BUOYANCY AND MASS 2010-08-01
1
8.4 Flooded. Accuracy Level 0 “Level-0” gives incorrect reaction for the empty, wet/dry pipe. All buoyancy checks are skipped, and only the weight of the pipe (50 kN) is included. Not recommended for floating structures.
Figure 8-6 Z-reaction for 100% wet/dry cylinder. Flooded.
8.5 Flooded. Accuracy Level 1 (default) “Level-” gives correct reaction (0 kN / 150kN) for the flooded, wet/dry pipe.
Figure 8-7 Z-reaction for 100% wet/dry cylinder. Flooded.
8.6 Flooded. Panel Model (surface pressure integration) “Panel model” gives correct reaction (~0 kN / 150kN) for the flooded, wet/dry pipe.
Figure 8-8 Z-reaction for 100% wet/dry cylinder. Flooded.
________________________________________________________________________________________
___________________________________________________________________________________ USFOS BUOYANCY AND MASS 2010-08-01
1
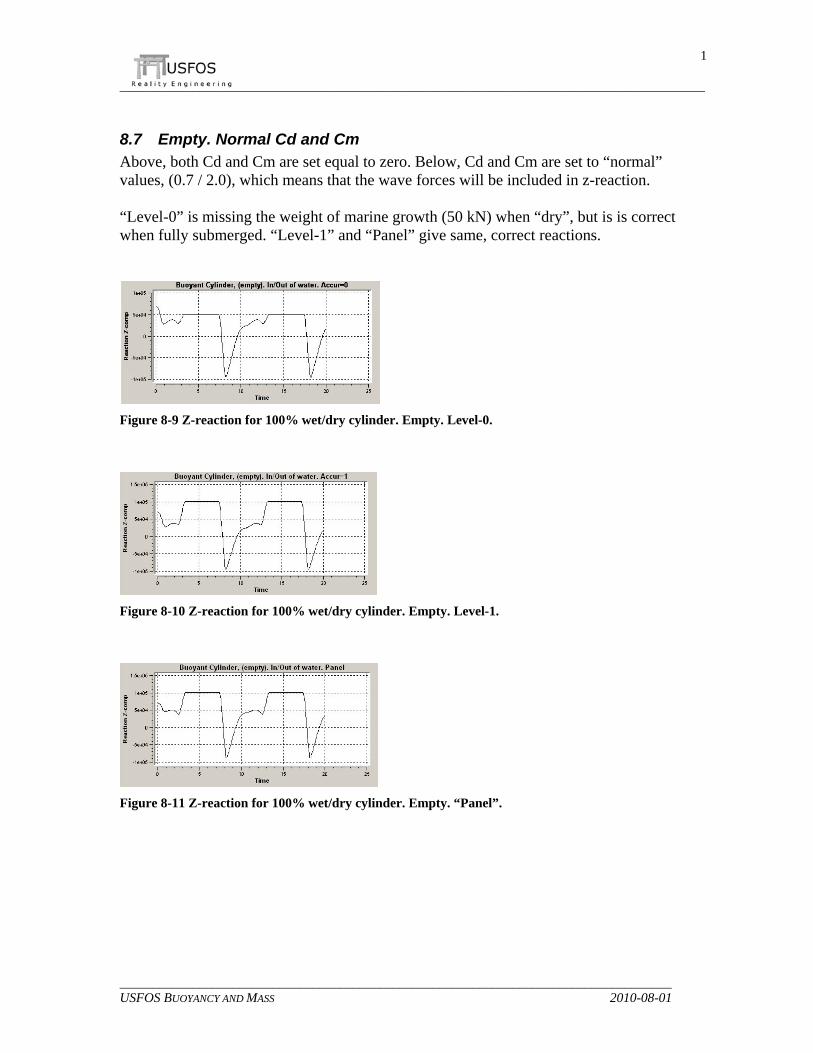
8.7 Empty. Normal Cd and Cm Above, both Cd and Cm are set equal to zero. Below, Cd and Cm are set to “normal” values, (0.7 / 2.0), which means that the wave forces will be included in z-reaction. “Level-0” is missing the weight of marine growth (50 kN) when “dry”, but is is correct when fully submerged. “Level-1” and “Panel” give same, correct reactions.
Figure 8-9 Z-reaction for 100% wet/dry cylinder. Empty. Level-0.
Figure 8-10 Z-reaction for 100% wet/dry cylinder. Empty. Level-1.
Figure 8-11 Z-reaction for 100% wet/dry cylinder. Empty. “Panel”.

________________________________________________________________________________________
___________________________________________________________________________________ USFOS BUOYANCY AND MASS 2010-08-01
2
8.8 Flooded. Normal Cd and Cm The same pipe as described in the previous section is checked for 100% flooded. “Level-0” reaction varies between 0 and 140kN, while the assumed correct response means that the reaction varies between –50 kN and 150 kN. Figure 8-12 described the Z-component of the wave forces, and Level 0 peak reaction is a sum of the wave force (90 kN) and the pipe weight (50 kN). The buoyancy of the pipe wall (50 kN) is the reason why “Level-1” and “Panel” do not show the wave load peak (at 2 sec and 12sec)
Figure 8-12 Total Z-Force from Wave.(upper right) and Total Reaction for the 3 buoyancy options.

________________________________________________________________________________________
___________________________________________________________________________________ USFOS BUOYANCY AND MASS 2010-08-01
2
8.9 Normal Pipe. Flooded. Normal Cd and Cm. Above, the pipe has been given “artificial” properties, and in the following example, more “normal” pipe. In addition, the marine growth is given a density of 1300 kg/m3, (same thickness as before: 0.1268m).
Diameter : 1.1284 m (same as before) Thickness : 0.030 m Density : 7850 kg/m3 Outer Area : 1.000 m2 Inner Area : 0.8965 m2
This gives the following weights for the 10 m pipe:
Steel pipe : 79.7 kN Internal fluid : 90.0 kN (ρ = 1024 kg/ m3) Marine Growth : 63.8 kN (ρ = 1300 kg/ m3)
Total Weight dry : 233.5 kN (83 kN for completely submerged)
Figure 8-13 Total Reaction for the 3 buoyancy options. Flooded pipe. Marine growth Again, “Level-0” includes only the steel weight, while the two other options compute the total dry weight correctly. When the pipe is completely submerged, the reaction is 50kN for these two cases (sum of wet weight and wave force).

________________________________________________________________________________________
___________________________________________________________________________________ USFOS BUOYANCY AND MASS 2010-08-01
2
8.10 Normal Pipe. Buoyant. Normal Cd and Cm. With/Without Marine Growth Finally, the same pipe as above is checked without flooding, and with/without marine growth. “Level-1” and “Panel” give correct dry reaction (143.5 kN), while “Level-0” lacks the weight of the marine growth (63.8 kN).
Figure 8-14 Total Reaction for the 3 buoyancy options. Empty pipe. Marine growth Figure 8-15 describes the Z-reaction history for the same case, but without marine growth. Here, also “Level-0” computes the correct response. All three options compute the dry weight correctly (79.8 kN).
Figure 8-15 Total Reaction for the 3 buoyancy options. Empty pipe, No marine growth

________________________________________________________________________________________
___________________________________________________________________________________ USFOS BUOYANCY AND MASS 2010-08-01
2
9 Ex 7. North Sea Jacket In order to demonstrate the different parameters on a “real” structure, a typical North Sea jacket is used. The water depth is 190m, and a 10m wave is used in the example. The marine growth is given a density of 1300 kg/ m3, and the thickness is 100mm in the upper levels. The legs are flooded while all braces are empty, (see Figure 9-1). The density of the steel is 7850 kg/m3, and only the weight of the steel jacket is included in the reaction forces below, (no topside weight included). Figure 9-1 North Sea Jacket. Marine Growth thickness (mid), and flooded members (right)

________________________________________________________________________________________
___________________________________________________________________________________ USFOS BUOYANCY AND MASS 2010-08-01
2
9.1 Accuracy Level 0 Level-0 accuracy disregards the weigh of the marine growth as well as in/out of water for the flooded members (the legs). The reaction force history during the 10m-wave is shown in Figure 9-2. Figure 9-3 presents the total mass in X-direction. The vertical reaction varies between 127MN and 128MN, and the total mass is constant = 30 106 kg.
Figure 9-2 Z-reaction History. Accuracy level 0
Figure 9-3 Total X-mass History. Accuracy level 0

________________________________________________________________________________________
___________________________________________________________________________________ USFOS BUOYANCY AND MASS 2010-08-01
2
9.2 Accuracy Level 1 (default) Level-1 accuracy includes the weigh of the marine growth as well as in/out of water for the flooded members (the legs). The reaction force history during the 10m-wave is shown in Figure 9-4. The total mass in X-direction is presented in Figure 9-5. The vertical reaction is slightly less compared with “level-0” (buoyancy of wall thickness), and varies between 125MN and 127MN. The total mass is slightly higher than for level 0, but is almost constant (varies between 30.8 106 and 31.1 106 kg).
Figure 9-4 Z-reaction History. Accuracy level 1
Figure 9-5 Total X-mass History. Accuracy level 1
________________________________________________________________________________________
___________________________________________________________________________________ USFOS BUOYANCY AND MASS 2010-08-01
2
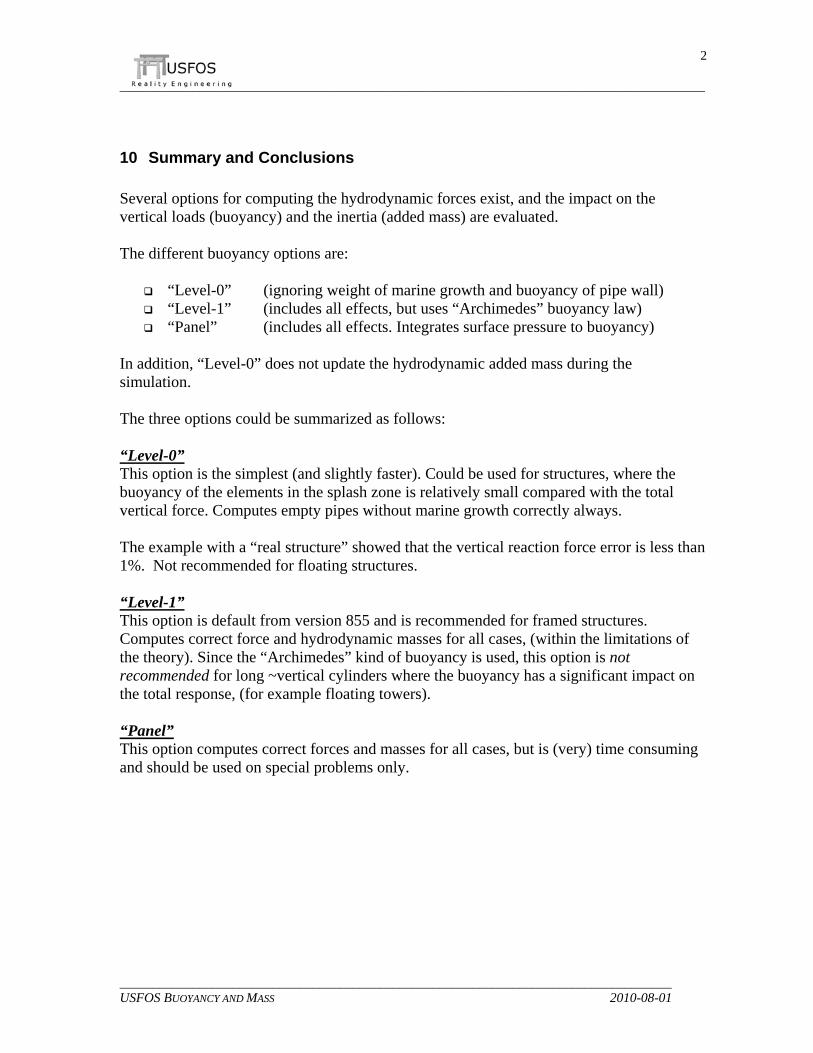
10 Summary and Conclusions Several options for computing the hydrodynamic forces exist, and the impact on the vertical loads (buoyancy) and the inertia (added mass) are evaluated. The different buoyancy options are:
“Level-0” (ignoring weight of marine growth and buoyancy of pipe wall) “Level-1” (includes all effects, but uses “Archimedes” buoyancy law) “Panel” (includes all effects. Integrates surface pressure to buoyancy)
In addition, “Level-0” does not update the hydrodynamic added mass during the simulation. The three options could be summarized as follows: “Level-0” This option is the simplest (and slightly faster). Could be used for structures, where the buoyancy of the elements in the splash zone is relatively small compared with the total vertical force. Computes empty pipes without marine growth correctly always. The example with a “real structure” showed that the vertical reaction force error is less than 1%. Not recommended for floating structures. “Level-1” This option is default from version 855 and is recommended for framed structures. Computes correct force and hydrodynamic masses for all cases, (within the limitations of the theory). Since the “Archimedes” kind of buoyancy is used, this option is not recommended for long ~vertical cylinders where the buoyancy has a significant impact on the total response, (for example floating towers). “Panel” This option computes correct forces and masses for all cases, but is (very) time consuming and should be used on special problems only.