user’s guide ct-expo v 2.3 ct-expo v 2 · user’s guide ct-expo v 2.3 i ct-expo v 2.3 a tool for...
TRANSCRIPT

User’s Guide CT-Expo V 2.3
i
CT-Expo V 2.3A Tool
forDose Evaluation
inComputed Tomography
User’s GuideApril 2014
User’s Guide CT-Expo V 2.3
ii
Insofar as this publication mentions any dosage or application, readers may rest assured that the authors, editors and publishers have made every effort to ensurethat such references are strictly in accordance with the state of knowledge at the time or production of this publication. Nevertheless, every user is requested tocarefully examine the manufacturer’s leaflets accompanying each drug or piece of equipment on its own responsibility whether the dosage schedules or protocolsettings recommended therein or the contraindications stated by the manufacturers differ from the statements made in the present publication. Such examinationis particularly important with drugs, pieces of equipment or protocol settings that are either rarely used or have been newly released on the market.
Trade-mark protection will not always be marked. The absence of a reference does not indicate an unprotected trade-mark.
All rights reserved. No part of this publication may be reproduced, stored in a retrieval system, or transmitted in any form or by any means (electronic, mechanical,photocopying, recording, or otherwise) without the prior written permission of the copyright holder of this work.
© G. Stamm, Hannover and H.D. Nagel, Buchholz1st edition: August 2001, translated by H.D. Nagel
and l’Angelo Mysterioso2nd edition: April 2003, translated by H.D. Nagel
and l’Angelo Mysterioso3rd edition: November 2004, translated by H.D. Nagel4th edition: November 2005, translated by H.D. Nagel5th edition November 2007, translated by H.D. Nagel6th edition January 2010, translated by H.D. Nagel
Authors’ adresses
Dr. rer. nat. H.D. Nagelc/o SASCRADFritz-Reuter-Weg 5fD-21244 Buchholze-mail: [email protected]
Dr. rer. nat. G. Stammc/o Medizinische Hochschule HannoverAbt. Experimentelle RadiologieD-30623 Hannovere-mail: [email protected]
Impressum
7th edition January 2011, translated by H.D. Nagel8th edition May 2012, translated by H.D. Nagel9th edition June 2013, translated by H.D. Nagel10th edition April 2014, translated by H.D. Nagel
Layout: H.D. Nagel, Hamburg, on Apple Macintosh withAdobe PageMaker

User’s Guide CT-Expo V 2.3
iii
License Conditions
This program used by you (mentioned in the following as ‘soft-ware’) is shareware. Use of this software requires the paymentof the shareware fee to the company G. Stamm (in the follow-ing mentioned as ‘manufacturer’). For those users who havereceived the software from an authorised distributor free ofcharge, the shareware fee is already paid.
All rights and conditions described in this license only apply tousers registered by the manufacturer. Registration requires thedeclaration of the serial number and the origin of the softwareon the registration form which is attached to the software. Mult-iple registration of the software under the same serial numberleads to the loss of the license, its guarantees and privileges.
The software acquired with this license remains the property ofthe manufacturer and is protected by national laws, internationalcontracts and intellectual property rights. In accepting these li-cense conditions you have been given the right to use this soft-ware.
Unless additional regulations accompanying this license havebeen agreed upon, the use of this software is bound to the fol-lowing conditions:
You are authorised
a) to use a copy of this software only on a single computer;b) to produce a copy of this software for archiving purposes orto copy the software to the hard disk of your computer and toarchive the original floppy disk;c) to use the software in a network environment, provided thatyou have purchased a license for each computer which has ac-cess to the software via the network;d) to permanently transfer the rights on this software to a thirdparty, provided that all copies of this software and the accom-panying documents are handed over and that the receiver of thesoftware also accepts all parts of this license conditions;e) to use this software also on a mobile computer or on a singlehome computer, provided that the computer on which the soft-ware has initially been installed is used by you personally for atleast 80% of the time.
You are not authorised
a) to use the software as a part of an other commercial productwithout having the written permission of the manufacturer;b) to copy the documents accompanying the software;
License Conditions

User’s Guide CT-Expo V 2.3
iv
c) to loan or to rent the software or to assign sub-licenses.d) to re-develop (reverse engineering), to decompose, to disas-semble the software or to attempt in other ways to gain accessto the source code of the software, to alter the software, to trans-late it or to generate products which have been deduced fromthis software;
Limited guarantee
The manufacturer of this software guarantees for a period ofsixty (60) days after delivery data that the medium on whichthe software has been distributed is free from faults. If the prod-uct purchased by you should not meet this guarantee, the manu-facturer is free either to replace the copy of this software or torefund the fee paid for the software. In both cases, a proof ofthe purchase of the software must be sent to the manufacturer.
Updates
The manufacturer of the software makes every endeavor to pro-vide regular updates of the scanner database contained in thesoftware that can be ordered by interested license holders for amoderate fee. Updates are exclusively announced via e-mailand require personal registration of the license holder.
Disclaimer of liability
In no condition will the manufacturer of the software be liableto you for any consequential, incidental or indirect damages(including damages for loss of business profit, business inter-ruption, loss of business information, and the like) arising outof the use or inability to use the software even if the manufac-turer has been advised of the possibility of such damages.
License Conditions

User’s Guide CT-Expo V 2.3
v
Preface
After more than10 years, CT-Expo has meanwhilebecome the world-wide only software that allows fordose calculation for practically all CT scanners andis regularly updated. Besides the addition of newscanner models, a number of improvements have beenintroduced over the years that have increased the ac-curacy of dose assessment and have extended thefunctionality of this tool.
The 12th version with the new update V 2.3 nowcomes with another significant innovation: assess-ment of the dose contribution resulting from the scanprojection radiograph. This is rarely known and of-ten grossly over-estimated. Now it is possible to quan-tify that its contribution is almost negligible in themajority of cases. In addition, a number of othermodifications have been introduced in V2.3. Theseare documented in the file ‘Release_Notesv2.3(E).pdf’ and can be found in the CT-Expo V 2.3folder.
As before, CT-Expo will be availabe as sharewareat a price, which we anticipate will make it easilyaffordable for all potential users. Please support theshareware idea by paying the nominal fee requested.This enables us to continually improve this program.
We will also make every endeavor to provide regu-lar updates of the scanner database contained in thesoftware. Due to the increased efforts that are neces-sary for the preparation of the dose relevant data ofnew scanners, it was no longer possible to distributeupdates for free. They can, however, be ordered byinterested license holders for a moderate fee. Updatesare exclusively announced via e-mail and require per-sonal registration of the license holder.
Hannover - Buchholz, April 2014
Dr. Georg Stamm, Dr. Hans Dieter Nagel
Preface

User’s Guide CT-Expo V 2.3
vi
Preface
Preface (First Edition)
In the past few years, increasing efforts have beeninitiated to significantly reduce the radiation expo-sure of CT examinations. In Germany, a nation widesurvey of CT exposure practice was conducted in1999 as a joint effort of the German Roentgen Soci-ety (DRG) and the manufacturer’s association ofelectromedical equipment (ZVEI) with a participa-tion rate of 50% of all CT users.
This broad interest has encouraged us to develop CT-Expo V 1.0, a tool for CT dose evaluation. We hopethat every person involved in the production, appli-cation and inspection of CT scanners who has a rolein dose evaluation wants to use it. It also provides apowerful tool for users in their daily work which iseasy to use.
Our experience gained during the evaluation of theGerman CT survey has led to a tool which has been
restricted to only a few, essential dose quantities andwhich focuses on the practicability of the results. Forus, one of the most important goals was to includefor the first time the prospect for dose assessment inpaediatric CT examinations also.
This software product is now commercially availableat a price which we estimate will be easily afford-able for all potential users. Please support theshareware idea by paying the nominal fee requested.This enables us to continually improve this programand to supply you with regular updates free of charge.
Hannover - Hamburg, summer 2001
Dr. Georg StammDr. Hans Dieter Nagel

User’s Guide CT-Expo V 2.3
vii
1. Introduction ....................................................................... 12. Start Sheet .......................................................................... 33. Navigation Toolbar ............................................................ 54. Application Module ‘Calculate’ ........................................ 6
Application Areas ....................................................................... 6Input Steps .................................................................................. 6
Step 1: Selection of Patient Type ...................................................... 6Step 2: Selection of Scan Range ...................................................... 7Step 3: Selection of Scanner Model ................................................. 9Step 4: Adaptation of Scanning Mode ............................................ 11Step 5: Input of Scan Parameters ................................................... 12Step 6: Results ................................................................................ 17Step 7: Effective Dose Calculation Mode ...................................... 18
Reset ......................................................................................... 195. Application Module ‘Standard’ ....................................... 20
Application Areas ..................................................................... 20Input Steps ................................................................................ 20
Step 1: Selection of Examination Type .......................................... 21Step 2: Selection of Scanner Model ............................................... 21Step 3: Input of SPR Parameters .................................................... 22Step 4: Input of Scan Parameters ................................................... 22Step 5: Results ................................................................................ 23Step 6: Effective Dose Calculation Mode ...................................... 25
Comparison with Survey Results ............................................. 25Reset ......................................................................................... 26
6. Application Module ‘Light’ ............................................. 27Application Areas ..................................................................... 27Input Steps ................................................................................ 27
Step 1: Selection of Examination Type .......................................... 27Step2: Input of CTDIvol and DLP ................................................. 28
Table of ContentsStep 3: Correction for dose modulation effects .............................. 29Step 4: Results ................................................................................ 29
Reset ......................................................................................... 307. Application Module ‘Benchmarking’ .............................. 31
Application Areas ..................................................................... 31Selection of the Appropriate Worksheet ................................... 31Benchmarking of SSCT Scanners ............................................ 32
Step 1: Selection of Scanner Model ............................................... 32Step 2: Effective Dose Calculation Mode ...................................... 33Step 3: Selection of Examination Type .......................................... 33Step 4: Input of Scan Parameters ................................................... 33Results ............................................................................................ 35Aids for Interpretation and Optimisation ....................................... 35
Benchmarking of MSCT Scanners........................................... 41Step 1: Selection of Scanner Model ............................................... 41Step 2: Effective Dose Calculation Mode ...................................... 41Step 3: Selection of Examination Type .......................................... 41Step 4: Input of Scan Parameters ................................................... 42Results ............................................................................................ 42
Printing the Results .................................................................. 45Reset ......................................................................................... 45
Appendices .......................................................................... 46Appendix A: MSCT Scan Parameter Translator ...................... 46Appendix B: Calculation Formulas .......................................... 49Appendix C: Types of Standard Examinations ........................ 50Appendix D: Accuracy of Dose Calculations .......................... 51
Literature ............................................................................. 58
Table of Contents

User’s Guide CT-Expo V 2.3
1
1. Introduction
CT-Expo V 2.3 is an MS Excel application written inVisual Basic for the calculation of patient dose in CTexaminations. It is based on computational methodswhich were used to evaluate the data collected in bothGerman surveys on CT exposure practice in 1999and 2002. A comprehensive description of thesemethods is documented in the book ‘Radiation Ex-posure in Computed Tomography’ (Nagel, 2002).
CT-Expo V 2.3 allows the calculation of the follow-ing dose quantities:
• Weighted CTDI• Volume CTDI (Effective CTDI)• Dose-length product• Organ doses• Effective dose (according to ICRP 60 and 103)
In contrast to similar programs for dose calculationsin CT, CT-Expo V 2.3 offers the user a number of
unique features, such as
• dose calculations for all age groups (adults, chil-dren, neonates)
• dose calculations for each gender• dose calculations for all existing scanner models• correction of scanner-specific influences• correction of overbeaming effects• correction of overranging effects in spiral mode• free and standardised dose assessment from scan
parameters as well as from dose data provided bythe scanner
• assessment of the dose contribution resulting fromscan projection radiographs
• comparisons with results from the German CTsurvey
• a comprehensive benchmark function includingguidance on dose optimisation
Introduction

User’s Guide CT-Expo V 2.3
2
CT-Expo V 2.3 consists of four application modules:
• Calculation: Allows to calculate age- and sex-spe-cific patient dose values with individual selectionof the scan range; this can be made in a separatesheet (‘Scan Range’) with graphical input facili-ties.
• Standard: Offers dose calculations for pre-definedstandard CT examinations (adults only); the se-lection of the scan range is made automaticallyand for both sexes simultaneously. For complextypes of examinations, separate dose calculationsmay be made for each scan series with differentsets of scan parameters. Calculated values can becompared with the corresponding average valuesof the German CT survey using a separate sheet(’Compare’). In addition, the dose contribution re-sulting from scan projection radiographs can beassessed.
• ‘Light’: Allows to assess effective and organ dosesfor pre-defined standard CT examinations (adultsonly) independent from the type of scanner. Onlythe CTDIvol and DLP values that are meanwhile
provided on most scanners are required.• Benchmarking: Provides dose calculations for the
complete spectrum of standard CT examinations(adults only) and allows comparison with the re-sults of the German CT survey in a single sheet.The graphical display is useful in allowing analy-sis of any significant difference. The results maybe used for subsequent optimisation of scan pro-tocols.
CT-Expo V 2.3 has an intuitive and clearly structureduser interface. In this manual, a comprehensive de-scription is given of each sheet and the applicationsteps involved. Basic knowledge how to work withMS Excel is required, but not advanced skills, be-cause all operations below the user interface workautomatically. Also required is knowledge of CT-spe-cific dose descriptors, terms and abbreviations. In-formation on these - and the underlying computa-tional formulas - may be obtained from the bookmentioned in the beginning of this introduction(Nagel, 2002).
Introduction

User’s Guide CT-Expo V 2.3
3
Fig. 2.1: Start sheet with selection of application modules.
2. Start Sheet
When opening the CT-Expo V 2.3 file, first a boxappears in which the user is requested to activate mac-ros. Please click the button ‘Activate Macros’ to startthe application. In Excel version 2007 and later, mac-ros must be enabled is the security centre settings
Note:
Program versions obtained from originaldiskettes / CDs (with serial number) or fromupdates distributed by the manufacturer via e-mail attachments have been checked for virusesbefore shipment. These versions can be openedand activated without hesitation. No guaranteecan be given, however, for program versionsthat have been obtained by other, non-author-ised channels.
After having given your OK to another box, whichcontains important information, the start sheet (fig.2.1) is accessible. From this, the different applica-tion modules (‘Calculation’, ‘Standard’, ‘Light’, and‘Benchmarking’) and a help sheet (‘Help’) can beselected. The application may also be terminated ina conventional way (‘End’).
Start Sheet

User’s Guide CT-Expo V 2.3
4
As all input operations performed by the user are in-terpreted by MS Excel as a change, you will be askedwhen terminating CT-Expo V 2.3 whether you wishto store the changes made or not. Normally your de-
cision should be NO. In particular situations, how-ever, it may be desirable to store the latest inputsmade. If you decide to do this, the previous versionof CT-Expo will disappear.
Start Sheet
Note:
The authors recommend that users make a backup copy before using CT-Expo for the firsttime, and that this is made on a separate storage device. This will guard against the conse-quences of accidental loss or damage, or breakdown of the computer system.
If you should have obtained your CT-Expo application on a standard floppy disk or CD,copy all files on this device to your hard disk and work only with this copy. Carefully storethe original storage device in a separate location for emergency situations.

User’s Guide CT-Expo V 2.3
5Fig. 3.1: Navigation toolbar.
3. Navigation Toolbar
An additional means to switch from one sheet to an-other is provided by the navigation toolbar shown infig. 3.1. This toolbar is normally located at the upperboarder of the Excel sheet. The functions of the dif-ferent buttons are:
• Zoom In: Enlarged display• Zoom Out: Reduced display• Goto Start: Back to start sheet• Calculate: Selection of application module ‘Cal-
culate’• Scan Range: Selection of sheet ‘Scan Range’ in
order to make graphical input of the scan range• Standard: Selection of application module ‘Stand-
ard’• Comparison: Switch to sheet ‘Comparison’ in or-
der to compare the dose values calculated in
‘Standard’ to those of the German CT survey• Light: Selection of application module ‘Light’• Benchmark: Selection of application module
‘Benchmarking’• Save/Print: Storing or printing the content of a
sheet• Reset: Resetting all input cells• Help: Selection of short instruction in sheet ‘Help’
Touching the left edge can change the location of thenavigation toolbar. By clicking on the ‘Close’ buttonthe bar can completely be removed from the sheet.To re-install the toolbar when it is not available, clickon VIEW / TOOLBARS / NAVIGATION from thestandard Excel menu. In Excel version 2007simplyclick on “Add-Ins”
Navigation Toolbar

User’s Guide CT-Expo V 2.3
6
4. Application Module ‘Calculate’
Fig. 4.1Selection of patient type (age group and sex).
Application Module ‘Calculate’
Application Areas
The ‘Calculate’ module allows dedicated dose cal-culations for all groups of age and sex. This moduleshould be used whenever
• dose calculations are required for those types ofexaminations which differ significantly from thepre-defined standard CT examinations covered inmodule ‘Standard’;
• an individual selection of the scan range is made;• the calculation of uterine dose is necessary;• paediatric CT examinations are carried out.
Although it may be an advantage to more accuratelydetermine dose using a free selection of scan range,it requires an extra effort to do so.
Input Steps
In this section, the procedure to enter the data re-quired for dose calculations is described step-by-step.All cells into which data input has to be made are inwhite. Those cells in grey contain other data whichare also used for dose calculations and which onlyserve for information purposes. Cells in which theresults of dose calculations are displayed are in yel-low. All but the white cells are protected in order toavoid unintended changes.
Step 1: Selection of Patient Type

User’s Guide CT-Expo V 2.3
7
Fig. 4.2 Selection of scan range by directly entering thenumerical values of the lower and the upper limit of the scanrange in the cells ‘from z-’ and ‘to z+’. By clicking on thearea ‘Get Values’, the content of these cells is replaced by theactual values which have been set up in the ‘Scan Range’sheets.
Application Module ‘Calculate’
The type of patient for which dose calculations shallbe made is defined (fig. 4.1) by selecting
• the age group (adults, children, babies) from thecorresponding drop-down menu and
• the sex (male, female) by clicking on the corre-sponding button.
Step 2: Selection of Scan Range
The scan range can directly be defined by enteringthe numerical values of the lower and the upper limit
of the scan range in the cells ‘from z-’ and ‘to z+’(fig. 4.2). The corresponding values are defined bythe first and the last slice position (as indicated onthe images and on most scanner consoles).This inputmethod should only be applied by experienced userswho are familiar with the design of the mathematicalphantoms ‘ADAM’, ‘EVA’, ‘CHILD’ and ‘BABY’ andthe location of the individual organs inside thesephantoms (Zankl, 1991; Zankl, 1993).
For less experienced users, a graphical input facilityis provided. This facility is accessible by clicking onthe area ‘Scan Range’ in the navigation toolbar. De-pending on the age group selected in step 1, you willenter either the sheet ‘Adult’ or ‘Child-Baby’.
The limits of the scan range are selected by using thearrow symbols located at the upper border of thissheet and are displayed by the semi-transparent redarea located over the phantom of choice. The fol-lowing rules apply:
• By using the left group of arrow symbols, the en-

User’s Guide CT-Expo V 2.3
8
Fig. 4.3Selection of the scan range limits by using the arrow symbols(‘up’ and ‘down’). The left group is used to define the lowerlimit, the right group to define the upper limit. The resultingscan range is indicated by the semi-transparent red area.
Application Module ‘Calculate’
tire scan range is displaced up- or downwards bythe corresponding distance in cm;
• by using the right group of arrow symbols, theentire scan range is lengthened or shortened bythe corresponding value in cm.
When selecting the scan range you should proceedin such a way that initially the lower limit of the scanrange (‘Start’ = ‘z-’) is defined by using the left groupof arrow symbols. Subsequently, the upper border ofthe semi-transparent area is shifted to the desiredposition by using the right group of arrow symbols,thus defining the upper limit of the scan range (‘End’= ‘z+’). All changes can be made either in large orsmall steps of 5 and 1 cm, respectively.
When setting the scan range limits, the following aidsfor orientation are available:
• The location of the principal organs inside thephantoms (fig. 4.4),
• the z co-ordinates displayed in the cells ‘Start’ and‘End’ and

User’s Guide CT-Expo V 2.3
9
Fig. 4.4 Symbols which represent the principal organs insidethe phantoms.
Application Module ‘Calculate’
• the anatomical landmarks given below these cells.
After having defined the scan range, you have to re-turn to the module ‘Calculate’ by clicking on thecorresponding field in the navigation bar. In the scanrange input area shown in fig. 4.2, both z co-ordi-nates (‘from z-’ and ‘to z+’) which have been graphi-cally selected earlier are now displayed. From thegrey cells, information on the corresponding values
of scan length L and conversion factors (which de-pend on the choice of patient type and scan range)may be obtained. The conversion factors are neededin order to calculate effective dose and uterine dose.
Overriding the content of both input cells (‘from z-’and ‘to z+’) is possible at any time. By clicking onthe area ‘Get Values’, however, the actual valueswhich have been set up in the ‘Scan Range’ sheetsare restored.
Step 3: Selection of Scanner Model
The scanner model for which dose calculations shallbe performed is defined (fig. 4.5) by selecting
• the scanner manufacturer and• the type of scanner
from the corresponding drop-down menus.
When selecting the type of scanner, please note care-fully that sometimes different versions of a particu-

User’s Guide CT-Expo V 2.3
10
Fig. 4.5 Selection of scanner model (manufacturer and typeof scanner).
Fig. 4.6 Scanner data used for dedicated dose calculationsfor the selected scanner.
Application Module ‘Calculate’
lar scanner exist which differ in the dose relevantscanner data. In order to distinguish between theseversions, a special name or the year from which themodification became effective or the characteristicin which this version differs from other scanners ofthe same type is attributed (e.g. ‘old BS’ (BS = beamshaper)).
Information used to perform dedicated dose calcula-tions for the selected scanner model can be obtainedfrom the grey cells in the box ‘Scanner Data’ (fig.4.6). Initially, the correct choice of the normalisedCTDI (head or body) is made automatically, depend-ent of the scan range selected. A scan range which ispredominantly located above the landmark cervical
vertebra 7 / thoracic vertebra 1, represents the head /neck range. If the scan range is predominantly lo-cated below this landmark, the body CTDI valuesare used.
The numbers displayed in the fields ‘kOB’ and ‘6L’are of particular importance for multi-slice scanners.‘kOB’ is a factor used to correct for the exposed areasoutside the detector array (‘overbeaming’), while 6Laccounts for the additional scan length in spiral mode(‘overranging’). Both values are dependent on theselected scan parameters and may change unless theexposure settings have been entered into the corre-sponding cells.

User’s Guide CT-Expo V 2.3
11
Application Module ‘Calculate’
Step 4: Adaptation of Scanning Mode
CT examinations of the neck region are often carriedout in body mode if the shoulder region is includedin the scan range. The automatic assignment of basicscanner data (head/neck or body) made by CT-Expocan be overruled by activating the button ‘Body modefor head/neck region’ (fig. 4.7). In this case, bodyCTDI data are used regardless of the location of thescan range.
Furthermore, the check box ’Spiral mode’ must beactivated for examinations performed in spiralscanning mode. This allows to take the extra rotationsneeded for data interpolation at start and end of thescan into account when calculating dose-lengthproduct and effective dose. The extent of this ‘over-ranging’ is displayed in the cell ‘6L’.
For examinations performed with longitudinal or 3Ddose modulation the resulting effects on local dosedistribution can be taken into accountby activatingthe corresponding check box. The relative mAscharacteristic shown in the appendix (fig. D.1) is usedin the assessment of organ and effective doses. Thisfunction is applicable for adult patients only.
Note:In order to calculate DLP and effective dosefor routine brain examinations, overranging istaken into account according to the exposedpart of the body. If, for example, the imagedregion starts at the vertex, only half of theoverranging is dose-relevant.
Fig. 4.7 Selection of the basic scanner data applicable to the body mode for examinations in the head/neck region carried outin body scanning mode, of spiral scanning mode and of correction for the effects of longitudinal dose modulation.

User’s Guide CT-Expo V 2.3
12
Application Module ‘Calculate’
Step 5: Input of Scan Parameters
The input of the actual scan parameters is made inthe cells kept in white (fig. 4.8). The following set ofparameters is required:
• tube voltage U [kV]• electrical tube current I [mA] and• acquisition time (per slice or rotation) t [s]• alternatively: current-time product Q [mAs]• total collimation N·hcol [mm]• table feed TF [mm]• reconstructed slice thickness hrec [mm]• number of scan series (Ser.)
Note:Any input made in cell ‘Q’ is automaticallycopied into the adjacent cell ‘Qel’, thereby over-riding the product of I and t. Enter zero intothe cell ‘Q’ to restore the initial state.
The accuracy of the dose calculations greatly dependson the quality of the data input. Please carefully en-ter the scan parameters that are displayed at the op-erator’s console or the outcome from the way thatthe CT examination is carried out (e.g. during CTfluoroscopy).
Fig. 4.8 Input cells (in white) for entering the actual scan parameters. To avoid input errors, a number of important hintsshould be observed (see text).

User’s Guide CT-Expo V 2.3
13
Application Module ‘Calculate’
Note:Prior to the introduction of multi-slice CT, therewas a standard way of presenting scan param-eters. This was particularly true for tube load(mAs), slice thickness, table feed and pitch.With MSCT, this is no longer the case. CT-Expo, however, is designed as a universal toolindependent of a particular type of scanner.Therefore we have introduced a section named‘MSCT Scan Parameter Translator’ to assist inthe evaluation of MSCT scan protocols. Bymaking use of this aid, the parameters displayedaccording to the scanner manufacturer’s phi-losophy can be converted into the uniform setof input parameters required in CT-Expo.
From our earlier experience, significant errors mayoccur with the input of the following parameters:
• Tube current I: Must not be mixed up with thecurrent-time product Q; if your scanner only dis-plays the mAs product, please enter this value intothe corresponding cell.
• Acquisition time t: Please enter the scan timeper slice (in sequential ‘slice-by-slice’ mode) orthe rotation time (in spiral mode). For some olderscanners which operate in pulsed mode (e.g.Tomoscan CX/S), the scan time must be correctedby the duty cycle (i.e. pulse length divided by thesum of pulse and interval length). If your scanneronly displays the total scan time T in spiral mode,you have to divide this by the number of rotationsmade.
• Current-time product Q: If you have not enteredmA and s separately, please enter the mAs prod-uct per slice (in sequential mode) or per rotation(in spiral mode). If your scanner only displays thetotal mAs product in spiral mode, you should di-vide this by the number of rotations made. How-ever, this will not be feasable if the total mAs prod-uct also includes the contribution of the scan pro-jection radiograph!
Note:For tube current I or current-time product Q,enter the values as displayed at the operator’s

User’s Guide CT-Expo V 2.3
14
Application Module ‘Calculate’
console or on the film. For scanners whichemploy pitch-corrected values (‘effectivemAs’, ‘mAs per slice’), these values are auto-matically converted into electrical mAs as dis-played in the cell ‘Qel’.
Note:Many scanners now provide a modulation ofthe tube current along the z-axis according tothe local attenuation properties of the patient(longitudinal dose modulation). Use the aver-age mAs value for the scanned range and cor-rect for local variations by activationg the cor-responding check box in step 4. If the averagemAs value is not available, you may use thedose-length product displayed at the operator’sconsole by trial-and error: vary the mAs prod-uct until the DLP value calculated with CT-Expo is the same as at the console.
Note:For cardiac CT applications performed withretrospective gating, many scanners now offer
the possibility for temporal modulation of thetube current controlled by the patient’s ECGsignal (ECG gating). Please contact the manu-facturer to identify whether the indicated valueof tube current (or mAs product) refers to thetime-averaged value or to the unmodulatednominal value. If the latter should apply, thetube current must be corrected according to theduty cycle. This depends on the design proper-ties of this feature and the patient’s heart rate.
• Total collimation N*hcol: On single slice scanners(i.e. the number, N, of slices per rotation = 1), thisis the same value as the (nominal) slice thicknessh (in mm). On some scanners, an ‘effective’ slicethickness is displayed in spiral mode; this is al-ways greater than the slice thickness that resultsfrom the selected collimation and leads to incor-rect values of dose-length product and effectivedose when these quantities are calculated. There-fore only the correct geometrical slice collimationmust be used which results from the collimatorsettings if the same scan would be performed in

User’s Guide CT-Expo V 2.3
15
Application Module ‘Calculate’
sequential mode (see also scan parameter transla-tor given in the appendix). For multi-slice scan-ners (N > 1), always enter the total collimation,i.e. the product N·hcol of slice collimation hcol andthe number N of slices acquired simultaneously.
Note:‘Slice collimation’ denotes the setting used fordata acquisition, not that used for retrospec-tive reconstruction. On some scanners (e.g. GELightSpeed QX/i), the user primarily selectsthe slice thickness hrec of the reconstructed im-age; the collimation which is used for data ac-quisition is then applied automatically. For dosecalculations with CT-Expo, only the actual ac-quisition slice collimation must be used. Infor-mation on the rules that apply for automaticcollimator settings may be obtained from theuser’s manual or from the scan parameter trans-lator given in the appendix. Otherwise the doseadjustment for overbeaming effects (very im-portant for the narrow collimations preferredin MSCT) will not work correctly.
• Table feed TF: Please enter the distance whichthe table travels from slice position to slice posi-tion (in sequential mode) or per rotation (in spiralmode). Please do not mix up table feed with tablespeed (in mm/s). These two values are only iden-tical for rotation times of 1 s. If the rotation timediffers from 1 s, you should multiply the tablespeed by the rotation time to obtain the correspond-ing table feed. Please enter zero if stationary pro-cedures are performed (e.g. CT fluoroscopy).
Note:On multi-slice scanners (also on dual slice scan-ners such as Elscint TWIN) please always usethe actual table feed (e.g. TF = 10 mm for N =2, hcol = 5 mm and pitch p = 1 (contiguous scan-ning)). Please make use of the scan parametertranslator given in the appendix if the table feedis not displayed explicitly.
• Series: Please enter the number of scan series (e.g.unenhanced + contrast agent = 2 series), not thenumber of slices. A series is defined here as the

User’s Guide CT-Expo V 2.3
16
number of times which the same body section (ora part of it) is scanned. Scanning a section in mul-tiple steps (e.g. chest + upper abdomen + pelvis ormultiple segments of the lumbar spine) is countedas 1 series. If the body section is only partiallyscanned in one of the series (e.g. unenhanced scanof the upper abdomen only, contrast scan of theentire abdomen), please enter a value between 1and 2 which takes into account the different lengthsof both scans. In case of standard CT examina-tions, the user is referred to the application mod-ule ‘Standard’ which allows the user to performcalculations for up to three scan series with differ-ent parameter settings simultaneously.
Note:Please enter here the number of rotations if sta-tionary procedures are performed (e.g. CTfluoroscopy or CT perfusion).
Application Module ‘Calculate’

User’s Guide CT-Expo V 2.3
17
Application Module ‘Calculate’
Step 6: Results
Results for the following dose quantities are displayedin the yellow shaded cells (fig. 4.9):
• CTDIw [mGy]: Weighted CTDI per scan (= sliceor rotation)
• CTDIvol [mGy]: Volume CTDI (also: effectiveCTDI (CTDIw,eff)) per scan
• DLPw [mGy·cm]: Dose-length product (based onCTDIw) per scan series
• E [mSv]: Effective dose per scan series• Duterus [mSv]: Uterine dose per scan series• HT [mSv]: Organ dose per scan series.
In addition, the values of dose-length product, effec-tive dose and uterine dose for complete examinations,eventually comprising more than one scan series, arestated, too. These are the dose estimates for the en-tire examination and therefore are the only relevantvalues when considering radiation risk.
Note:In CT-Expo, the calculation of weighted andvolume CTDI for paediatric CT examinationsis always based, in agreement with other au-thors, such as (Shrimpton, 2000), on the smallerhead phantom, which is 16 cm in diameter. Theresulting dose values (CTDIw, CTDIvol and
Fig. 4.9 Presentation of the calculated dose values per scan or per scan series (DLPw, E, Duterus). In addition, dose values forthe complete examination (which may comprise more than one scan series) are stated for DLP, E and Duterus, too.

User’s Guide CT-Expo V 2.3
18
Application Module ‘Calculate’
DLPw) are usually higher than the values dis-played at the console of newer scanners, whichrefer to CTDIw,B if the examination has beencarried out in body mode, regardless of actualpatient size.
Note:All organ doses HT are based on conversionfactors for standard patients (ADAM, EVA,CHILD, BABY)and serve for information pur-poses only (in particular for organs outside thescan range).
Step 7: Effective Dose Calculation Mode
The calculation of effective dose can be performedeither according to the previous method (ICRP 60(ICRP, 1991)) or the new method (ICRP 103 (ICRP,2008)) by activating the corresponding button.
Fig. 4.10Organ doses HT per scan series (left: principal organs, right:remainder organs).
Fig. 4.11 Selection of calculation mode for effective dose.

User’s Guide CT-Expo V 2.3
19
Reset
By clicking on the area ‘Reset’ in the navigation tool-bar, all data entered in the white cells are erased im-mediately. The dose values in the yellow cells alsodisappear. However, as these cells are protected, thealgorithms programmed in these cells simply becomeinvisible. If you need to erase only a small amountof data, first highlight the corresponding cells; thenpush the ‘Erase’ key on the keyboard of your com-puter.
By clicking on the corresponding areas in the navi-gation toolbar, you can return to the start sheet or toother application modules of your choice.
Application Module ‘Calculate’

User’s Guide CT-Expo V 2.3
20
Application Module ‘Standard’
5. Application Module ‘Standard’
Application Areas
The ‘Standard’ module offers dose calculations forpre-defined standard CT examinations of adults. Asthe limits of the body section to be scanned are al-ready defined, the selection of the lower and the up-per limits of the scan range (as in ‘Calculate’ mod-ule) is not required. Assessment of the dose contri-bution resulting from scan projection radiographs(Topogram, Scout, Surview, Pilot Scan etc.) is an-other feature offered in this module.
This module should be used
• in daily practice to calculate (and document) thedose of each CT examination performed;
• for those examinations where the same body sec-tion (or parts of it) is scanned more than once andwith different scan parameter settings;
• if a direct comparison with the corresponding val-
ues of the German survey on CT exposure prac-tice in 1999 is desired.
With the advantage of a faster data input comes acompromise of accuracy whenever the actual lengthof the scan range differs from the pre-defined length.Although the pre-defined length can be corrected bymanually entering the actual length, the mean con-version coefficient is not changed accordingly. How-ever, this is of importance only for the calculation ofeffective dose. The error resulting from this simpli-fication is normally small and can be tolerated in mostcases.
Input Steps
In this section, the procedure to enter the data re-quired for dose calculations is described step-by-step.As many details are identical with the procedure inthe ‘Calculate’ module, only those items are men-

User’s Guide CT-Expo V 2.3
21Fig. 5.1 Selection of examination type with the corresponding scan length, scan range limits and mean conversion coefficients.
Fig. 5.2 Selection of scanner model (manufacturer and typeof scanner).
Application Module ‘Standard’
tioned here which are specific to this module.
Step 1: Selection of Examination Type
Selecting the examination type from the drop-downmenu shown in fig. 5.1 gives the definition of thescan range. The values of scan length, scan rangelimits (co-ordinates and anatomical landmarks) andmean conversion coefficients (fmean) are displayed forinformation purposes in the corresponding cells. Asfor the subsequent dose calculation, this is made forboth sexes simultaneously.
Step 2: Selection of Scanner Model
The selection of the scanner model is made in thesame way as in the ‘Calculate’ module (fig. 5.2). In-
stead of the overbeaming correction factor kOB and6L, the extent of overranging, the following param-eters are displayed in the ‘Scanner Data’ box (fig.5.3):
• dz1 and dz2, the effective width of the overbeam-ing range for regular and very small beam widthsettings, respectively;
• N · href, the total collimation applicable to the valueof normalised CTDI;
• mOR and bOR, the parameters required to perform

User’s Guide CT-Expo V 2.3
22
Application Module ‘Standard’
the overranging correction.
These values are used to calculate the kOB factors forthe selected collimation and tube load and 6L for theselected collimation and pitch factor.
Step 3: Input of SPR Parameters
The following parameters are required to calculatethe dose contribution resulting from the scan projec-
tion radiograph (SPR, fig. 5.4): tube voltage U (inkV), tube current I (in mA), table speed TS (in mm/s !), beam width N · hcol (in mm), and SPR length L(in cm !). Alternatively to tube current and table speed,the SPR’s total mAs (Qtot) can be used. If table speedand beam width are not known, 100 mm/s and 3 mmcan be applied as typical values instead. Enter theparameters separately if two SPRs are acquired forthe pertaining examination.
Step 4: Input of Scan Parameters
The input of both the scan and examination param-eters is made in a similar way to the ‘Calculate’ mod-ule. The only differences (fig. 5.5) are:Fig. 5.3 Scanner data with the corresponding parameters
used for dose calculations and corrections.
Fig. 5.4 Input cells (in white) used for entering the actual scan projection radiograph parameters. Alternatively to tube currentI and table speed TS, the SPR’s total mAs can be typed into dell ‘Qtot’.

User’s Guide CT-Expo V 2.3
23
Application Module ‘Standard’
• Data input: for each scan series separately;• the input of the number of scan series is no longer
required;• the input of a scan length which differs from the
pre-defined values is possible.
Once the scan length cells that have been altered arereset to zero, the default scan length applies again.
The corresponding check boxes must be activated ifa series is scanned in spiral mode and/or with longi-tudinal or 3D dose modulation. Calculation of effec-tive dose is than performed according to the mAscharacteristic shown in fig. D1 in the appendix.
In the cells ‘kOB’ the overbeaming correction factorsfor each series are displayed following the data inputmade in the cells ‘N·hcol’ and ‘I’, ‘t’ or ‘Q’. In thecells 6L, the extent of overbeaming is shown, de-pending on data input in ‘N·hcol’ and ‘TF’
Note:In order to calculate DLP and effective dosefor routine brain examinations, only half of theoverranging is taken into account.
Step 5: Results
The results of the dose calculations made in the
Fig. 5.5 Input cells (in white) used for entering the actual scan and examination parameters. Different sets of parameters canbe entered for up to three scan series. If necessary, the pre-defined scan length values can be replaced by actual values; enter-ing zero restores the initial settings.

User’s Guide CT-Expo V 2.3
24
Application Module ‘Standard’
‘Standard’ module (fig. 5.6) are presented in similarform as in the ‘Calculate’ module; differences are asfollows:
• The dose values resulting from the scan projec-tion radiographs ae listed in addition;
• the results for each scan series are given separately;• the values of the integral dose quantities DLPw and
E are given both for males and females;• uterine dose is not given.
Note:The uterine dose exceeds the first stage (20
mSv) following the German 3-stage model(DGMP, 2002) only in those examinationswhere the uterus is directly exposed. The uterusis anatomically located at the level of thesacrum and lies within the scan range only forthe total abdomen, pelvis and osseous pelvisexaminations. If, in those cases, the calcula-tion of uterine dose is required, this can easilybe made in application module ‘Calculate’ byusing the same scan parameters.
The integral dose values of the complete examina-tion are the sum of the values of each scan series and
Fig. 5.6 Results of the dose calculations for each particular SPR and scan series and the complete examination. Integral dosevalues (dose-length product DLPw and effective dose E) are listed for both male (m.) and female (f.) standard patients (‘ADAM’and ‘EVA’, respectively). Activate the corresponding button to select the organ weighting scheme for effective dose calculation.

User’s Guide CT-Expo V 2.3
25
Application Module ‘Standard’
SPR and are presented separately for both sexes.
Step 6: Effective Dose Calculation Mode
The calculation of effective dose can be performedeither according to the previous method (ICRP 60(ICRP, 1991)) or the new method (ICRP 103 (ICRP,2008)) by activating the corresponding button.
Comparison with Survey Results
By clicking on the area ‘Comparison’ in the naviga-tion toolbar you will arrive on a sheet of the samename. Here you will find once again the dose values
for each scan series (as in fig. 5.6). In the cells belowthe average values are listed, taken from the Germansurvey on CT exposure practice in 1999 (Galanski,2001) for the corresponding type of examination (fig.5.7). These values apply per scan series.
In the outmost right cell of this line the user will findthe average number of scan series according to thesurvey. By multiplying the values in this line by thisnumber, reference values per examination can be gen-erated which may be used for comparison. The re-sults of this comparison are given as relative values(in %) below the dose values per examination (fig.5.8). Relative values exceeding 100% are marked red
Fig. 5.7 Results of the dose calculations for each particular scan series from the actual examination (as in fig. 5.6) andaverage values (per scan series) from the German CT survey in 1999 (Galanski, 2001).

User’s Guide CT-Expo V 2.3
26
Application Module ‘Standard’
and indicate that the calculated dose value for thisexamination was higher than the corresponding av-erage value from the German survey.
Comparisons of this kind can be made for the entireset of standard examinations in the ‘Benchmarking’module. There you will find detailed informationwhich may be helpful in identifying those param-eters which differ significantly from usual practiceand which are responsible for increased dose values.
Fig. 5.8Dose values for the complete examination given in absolute terms (as in fig. 5.6) and in relative terms using as a com-paritor the average values (per examination!) of the German CT survey. Values exceeding 100% are marked red and indicateactual dose values greater than the average of the survey values.
Reset
By clicking on the area ‘Reset’ in the navigation tool-bar, all data entered in the white cells are erased im-mediately. The dose values in the yellow cells alsodisappear. If you need to erase only a small amountof data, first highlight the corresponding cells; thenpush the ‘Erase’ key on the keyboard of your com-puter.
By clicking on the corresponding areas in the navi-gation toolbar, you can return to the start sheet or toother application modules of your choice.

User’s Guide CT-Expo V 2.3
27
6. Application Module ‘Light’
Application Areas
The ‘Light’ module offers a simplified calculationmethod with pre-defined standard CT examinationsof standard-sized adults. The calculation can be per-formed independent from the type of scanner in useand only requires the corresponding CTDIvol- andDLP values. These are meanwhile provided by mostscanners. Hence only effective and organ doses re-main to be assessed.
This module should be used
• if the complete set of scan protocol data requiredfor CT-Expo is not fully available;
• if a quick assessment of effective and organ doseswith a satisfactory accuracy is acceptable.
Input Steps
Step 1: Selection of Examination Type
The definition of the scan range is performed - as inmodule ‘Standard’ - by selecting the examination typefrom the drop-down menu shown in fig. 5.1. Exami-nations that are restricted to the neck region (facialbones + neck, carotide CTA, cervical spine) can bemade either in head or body scanning mode, depend-ing on the scanner and the protocoll settings. As thedisplayed dose values are based on the correspond-ing standard phantom diameter (16 and 32 cm, re-spectively), the adequate type of examination hasto be selected. Otherwise the calculated dose valueswill be too high or too low by a factor of 2.
Location and length of the selected scan range areindicated on the phantoms ADAM and EVA for in-formation as shown in fig. 6.1, but cannot be modi-
Application Module ‘Light’

User’s Guide CT-Expo V 2.3
28
Application Module ‘Light’
fied. Equally, the corresponding values of scan lengthand scan range limits (co-ordinates and anatomicallandmarks) are displayed, but for information pur-poses only.
Step2: Input of CTDIvol and DLP
For this purpose the corresponding values referringto a single scan series (not to the entire examination)must be typed in. They can be obtained either fromthe scan console or from the dose report of the pertain-ing examination. The input (fig. 6.1) is made in termsof the customary units mGy and mGy·cm.
Fig. 6.2 Input of the CTDIvol and DLP values provided by thescanner.
Fig. 6.1 Indication of the selected scan range (here: abdomenwith pelvis).

User’s Guide CT-Expo V 2.3
29
Application Module ‘Light’
Step 3: Correction for dose modulation effects
A correction of the calculated organ and effective dosevalues can be applied by activating the check box(fig. 6.3) if the examiation has been carried out withlongitudinal or 3D dose modulation. The correctionis based on the modulation characteristic shown inthe appendix (fig. D1).
Step 4: Results
The results of the calculation are displayed in termsof effective dose according to both ICRP 60 and 103as well as doses to all relevant organs and tissue listedin ICRP. The agreement between the calculationsmade in application modules ‚Light‘ and ‚Calculate‘is usually within ±10%, provided that identical scanranges (size and location) are used and overrangingamounts to approximately 4 cm (2 cm for head scans).
Fig. 6.4 Effective and organ doses for the dose values fromfig. 6.2 (examination: abdomen with pelvis).Fig. 6.3 Activation of the dose modulation correction.

User’s Guide CT-Expo V 2.3
30
Application Module ‘Light’
If the gross scan length derived from CTDIvol andDLP turns out significantly longer or shorter (by +or - 3 cm) than the corresponding standard length forthe selected examination (plus 4 cm overranging), awarning message appears. In this case the accuracyof the calculated doses, in particular for organs at theborder or outsicde the standard scan range, willsignificantly be affected. If the required scan protocoldata are available, the dose assessment shouldpreferentially be performed in application module‚Calculate‘.
The calculated dose values are given for each genderseparately. The underlying conversion factors (‚kfactors‘) are in accordance with the conversion factorsfor the mathematical phantoms ADAM and EVA usedin CT-Expo. Compared to the currently used k factorsfrom AAPM report 96, larger differences may beobserved for the following reasons:
• differences in the modelling of the underlyingmathematical phantoms;
• body regions only coarsely defined;
• k factors for neck scans apply to head mode only;• missing differentiation between males and females;• valid for effective dose according to ICRP 60 only.
Own comparisons with published alderson phantombased studies and other CT dose calculation programshave revealed that the k factors used in CT-Expo giverealistic doses for standard-sized patients. Henceeffective doses using the AAPM k factors tend to betoo low.
Reset
By clicking on the area ‘Reset’ in the navigation tool-bar, all data entered in the white cells are erased im-mediately. The dose values in the yellow cells alsodisappear.
By clicking on the corresponding areas in the navi-gation toolbar, you can return to the start sheet or toother application modules of your choice.

User’s Guide CT-Expo V 2.3
31
Application Module ‘Benchmarking’
7. Application Module ‘Benchmarking’
Application Areas
The ‘Benchmarking’ module enables you to bench-mark the scan protocols for the entire set of 14 stand-ard CT examinations which were analysed in theGerman surveys on CT exposure practice (Galanski,2001, and Brix, 2002). You will be able to assess thedose values resulting from the exposure practice atthis particular hospital or medical practice and to re-ceive an indication how these values compare withthe survey outcomes. Although this survey was re-stricted to German CT users, it is likely that CT prac-tice is quite similar in other countries, too.
With the aid of additional diagrams you will be ableto easily identify those parameter settings which sig-nificantly differ from common practice and whichmay give rise to increased dose values.
This module should be used
• to evaluate the pre-programmed scan protocolswhen a new scanner is installed;
• after each modification of scan protocols;• to document the exposure practice at this particu-
lar installation when required by internal and ex-ternal audits.
The design of this module is identical with that usedin the feedback actions at the beginning of 2001 (sin-gle-slice CT survey) and in the middle of 2002 (multi-slice CT survey) which provided feedback to all par-ticipants of the German CT surveys about their per-sonal results.
Selection of the Appropriate Worksheet
From experience gained in the German MSCT sur-vey at the beginning of 2002 it was felt to be more

User’s Guide CT-Expo V 2.3
32
appropriate to use separate worksheets for SSCT andMSCT scanners. The selection of the appropriateworksheet is made automatically according to thetype of scanner selected. If another type of scanneris chosen later, a prompt is given, if necessary, re-quiring the user to switch to the correspondingbenchmarking sheet (fig. 7.1). This is achieved byconfirming the prompt.
Benchmarking of SSCT Scanners
In this section, the procedure to enter the data re-quired for dose calculations is described step-by-step.As many details are identical with the procedure in
the ‘Calculate’ module, only those items are men-tioned here which are specific to this module.
Step 1: Selection of Scanner Model
The selection of the scanner model is made in thesame way as in the ’Calculate’ module (fig. 7.2). Thepresentation of scanner data (fig. 7.3) comprises alldose relevant specifications, divided into the regions‘Head / Neck’ and ‘Body’.
Fig. 7.2 Selection of scanner model (manufacturer and typeof scanner).
Application Module ‘Benchmarking’
Fig. 7.1 A prompt which shows up if the worksheet is not ap-propriate for the scanner selected.
Fig. 7.3 Scanner data for the selected scanner, divided intodata for the head / neck and body region.

User’s Guide CT-Expo V 2.3
33
Step 2: Effective Dose Calculation Mode
The calculation of effective dose can be performedeither according to the previous method (ICRP 60(ICRP, 1991)) or the new method (ICRP 103 (ICRP,2008)) by activating the corresponding button (fig.7.4).
Application Module ‘Benchmarking’
Fig. 7.4 Selection of calculation mode for effective dose.
Step 4: Input of Scan Parameters
The input of the scan and examination parameters ismade in a similar way to that in the ‘Calculate’ mod-ule. Please review the explanations against each pa-rameter given in section 4. The only differences (fig.7.5) are:
• separate lines for head and body scanning modeare provided for CT examinations located in theneck region. They should be used according to thescanning mode applied;
• the length of the scan region (‘Scan Length’) whichis typical at the particular institution should beentered into column ‘L’ (‘Scan Length’ = from firstto last slice position; input in cm!);
Please take care not to mix up the scan length withthe length of the scan projection radiograph (SPR),also known as ‘Scanogram’, ‘Scout View’, ‘Topo-gram’ etc. This is normally taken for localisationpurposes before carrying out the scan procedure. Thedose contribution of the SPR is normally negligible.
Step 3: Selection of Examination Type
A selection of the scan range is not necessary as thisis made implicitly by entering the required data intothe corresponding line (fig. 7.5). The 14 examina-tion types are identical to those already known fromthe ‘Standard’ module. Only the input of the actualscan length is requested. The scanner data and con-version coefficients required to perform the dose cal-culations in the pre-programmed cells are retrievedautomatically.

User’s Guide CT-Expo V 2.3
34
Application Module ‘Benchmarking’
Fig. 7.5 Worksheet‚Benchmarking SSCT’: Standard examinations for which comparative dose calculations (‚Benchmarking’)can be made (area ’Standard Examination’), input cells for scan parameters (area’Scan Parameters’) and the resulting absoluteand relative dose values (area ’Dose Values’ and ’Relative Values’). Relative values refer to the average values of the German CTsurvey in 1999. Values above average are highlighted in red. The scan parameters of a participant of the survey have been usedfor this example. Note that these are not representative for the participant‘s type of scanner.

User’s Guide CT-Expo V 2.3
35
Results
The results of the dose calculations are listed in ab-solute terms for the most important dose quantitiesweighted CTDI (CTDIw), volume CTDI (CTDIvol),dose-length product (DLPw) and effective dose (E)in the area ‘Dose Values’ (fig. 7.5). For the local dosequantities (CTDIw, CTDIvol) these values are per scan(slice or rotation); both the integral dose quantities(DLPw, E) are values for complete examinations, av-eraged over both sexes.
In the area ‘Relative Values’ right of this, the valuegiven is the ratio of the dose value for that particularinstitution relative to that of the German CT surveyand given in terms of a %. The meaning of these val-ues is identical to that in the ‘Comparison’ sheet, i.e.values greater than the average of the German sur-vey are indicated red.
In the lower line of this table, the (unweighted) meanvalues of all input parameters and results are listed,averaged over all types of examinations. The relative
Application Module ‘Benchmarking’
values given here can be used as a first indication ofthe dose levels resulting from the exposure practiceat the corresponding scanner.
Aids for Interpretation and Optimisation
In fig. 7.6 the relative dose values from all types ofstandard examinations are presented in a graphicalform. The presentation is restricted to weighted CTDI(CTDIw) and dose-length product (DLPw) which serveas the main descriptors of local and integral dose andin which diagnostic reference levels for CT have beenestablished.
Four additional figures allow for identification ofthose scan parameters which significantly differ fromcommon practice and which may give rise for doselevels above average. These figures give comparisonsof the actual values (‘act.’) and the correspondingaverage values from the CT survey (‘ref.’) for thefollowing scan parameters: Scan length L (fig. 7.7a),pitch factor p (fig. 7.7b), number of scan series (fig.7.7c) and slice thickness h (fig. 7.7d).

User’s Guide CT-Expo V 2.3
36
Application Module ‘Benchmarking’
Fig. 7.6 Relative dose values for each type of examination in terms of weighted CTDI (CTDIw) and dose-length product(DLPw). Bars exceeding the 100% line represent dose values above the average of the ’99 German CT survey.

User’s Guide CT-Expo V 2.3
37
Fig. 7.7 Comparison of actual values of scan length (top, left), pitch factor (top, right), number of scan series (bottom, left),and slice thickness (bottom, right) with average values of the ’99 German CT survey (‘ref.’).
Application Module ‘Benchmarking’

User’s Guide CT-Expo V 2.3
38
Application Module ‘Benchmarking’
By using the example it is easy to see how to inter-pret these values and how to make use of them forthe optimisation of scan protocols. These values re-fer to a realistic example of a hospital which partici-pated in the CT survey. Please note that the scan pa-rameters applied at this hospital are not representa-tive for the scanner model concerned.
The (unweighted) mean values in the lower line offig. 7.5 show that the overall exposure practice at thisparticular institution is slightly higher than the aver-age. For users of modern spiral scanners such as aSomatom Plus 4 this finding indicates a poor result,however, because the average values of the surveyalso include contributions from older scanners whichare much less dose efficient. A closer look at the dose-length products shows values significantly higher thanthe average for the examination types chest (CHE,141%), pulmonary vessels (PV, 163%), cervical spine(CSP, 144%) and lumbar spine (LSP, 158%). Con-trary to this, the DLP for the examination type ‘Fa-cial Bone + Neck’ (FB+N, 16%) is considerably be-low average.
The values of the local dose quantity CTDIw are de-termined by the settings of tube voltage U (kV) andcurrent-time product Q (mAs). From fig.7.6 it can beseen that the CTDIw for these four types of examina-tions is already above average. The reason for this isidentified as the choice of an increased tube voltage(140 kV) which has not been compensated by a re-duction of mAs product.
A comparison of scan length (fig. 7.7a) shows mar-ginally higher values for chest and lumbar spine ex-aminations (by 10 to 20%) compared to the corre-sponding survey values. Scan length therefore doesnot contribute significantly to the above-average dosevalues.
When pitch factors are compared (fig. 7.7b), it be-comes clear that - with the exception of ‘Facial Bone+ Neck’ - the protocols adopted have not beenoptimised. On a spiral scanner, while examinationsof the brain, the cervical spine and the lumbar spineare usually performed in sequential mode with pitch1, all other types of examinations are normally
User’s Guide CT-Expo V 2.3
39
Application Module ‘Benchmarking’
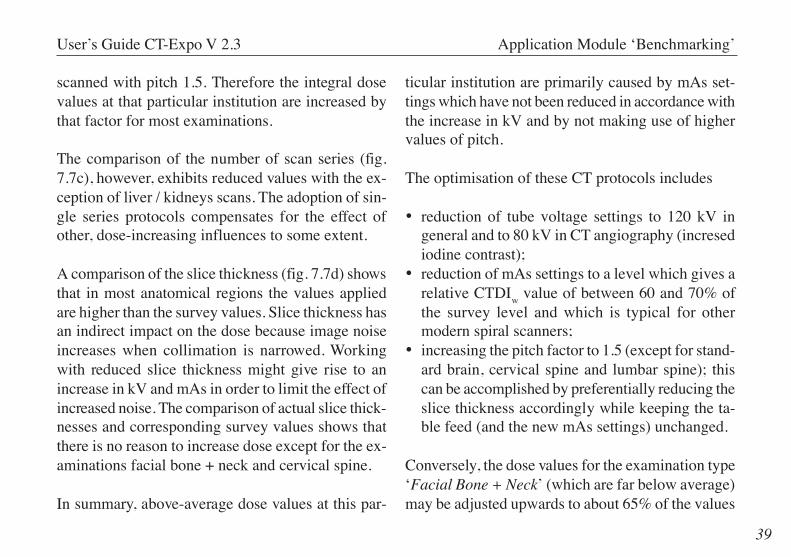
scanned with pitch 1.5. Therefore the integral dosevalues at that particular institution are increased bythat factor for most examinations.
The comparison of the number of scan series (fig.7.7c), however, exhibits reduced values with the ex-ception of liver / kidneys scans. The adoption of sin-gle series protocols compensates for the effect ofother, dose-increasing influences to some extent.
A comparison of the slice thickness (fig. 7.7d) showsthat in most anatomical regions the values appliedare higher than the survey values. Slice thickness hasan indirect impact on the dose because image noiseincreases when collimation is narrowed. Workingwith reduced slice thickness might give rise to anincrease in kV and mAs in order to limit the effect ofincreased noise. The comparison of actual slice thick-nesses and corresponding survey values shows thatthere is no reason to increase dose except for the ex-aminations facial bone + neck and cervical spine.
In summary, above-average dose values at this par-
ticular institution are primarily caused by mAs set-tings which have not been reduced in accordance withthe increase in kV and by not making use of highervalues of pitch.
The optimisation of these CT protocols includes
• reduction of tube voltage settings to 120 kV ingeneral and to 80 kV in CT angiography (incresediodine contrast);
• reduction of mAs settings to a level which gives arelative CTDIw value of between 60 and 70% ofthe survey level and which is typical for othermodern spiral scanners;
• increasing the pitch factor to 1.5 (except for stand-ard brain, cervical spine and lumbar spine); thiscan be accomplished by preferentially reducing theslice thickness accordingly while keeping the ta-ble feed (and the new mAs settings) unchanged.
Conversely, the dose values for the examination type‘Facial Bone + Neck’ (which are far below average)may be adjusted upwards to about 65% of the values

User’s Guide CT-Expo V 2.3
40
Application Module ‘Benchmarking’
Fig. 7.8Results of protocol optimisation for the example given in fig. 7.1 - 7.7. Adjustments have been made for the parameters tubevoltage (U), tube current (I) and slice collimation (hcol) only.
User’s Guide CT-Expo V 2.3
41
Application Module ‘Benchmarking’
of the survey average by increasing the mAs prod-uct.
For some types of examination with good inherentcontrast (e.g. facial bone / sinuses, chest, pelvis, os-seous pelvis, thoracic and abdominal aorta), a fur-ther dose reduction is possible. This arises from theobservation that the average values of the CT surveyfor these anatomical regions are still in need ofoptimisation in accordance with the ALARA princi-ple. Consequently, the mAs settings have further beenreduced for these examinations.
The result of this optimisation procedure is shown infig. 7.8. All other scan parameters (tube voltage, ac-quisition time, table feed, scan length, number ofseries) have been kept unchanged. Optimisation canlead to a reduction in average dose levels to 46% ofthe survey CTDIw and to 38% of the survey DLPw.
Benchmarking of MSCT Scanners
The benchmarking of MSCT scanners closely resem-
bles the procedure described for SSCT scanners. Inorder to account for the particularities of MSCT scan-ners, one additional column has been introduced. Fur-thermore, the graphical presentation of the results hasbeen modified in two essential aspects.
Step 1: Selection of Scanner Model
The selection of the scanner model is made in thesame way as for SSCT scanners.
Step 2: Effective Dose Calculation Mode
The calculation of effective dose can be performedeither according to the previous method (ICRP 60(ICRP, 1991)) or the new method (ICRP 103 (ICRP,2008)) by activating the corresponding button.
Step 3: Selection of Examination Type
A selection of the type of examination is made auto-matically – as for SSCT scanners - by entering therequired data into the corresponding line.

User’s Guide CT-Expo V 2.3
42
Step 4: Input of Scan Parameters
The input of the scan and examination parameters ismostly made in a similar way to that used for SSCTscanners. However, some important modificationsshould be observed (fig. 7.9):
• the number N of slices acquired simultaneouslyhas to be entered in a separate column;
• the corresponding check box has to be activated inorder to enable the correction of the effective dosevalues if the examination has been performed withlongitudinal or 3D dose modulation;
• the presentation of scan parameters (tube current,slice collimation, reconstructed slice thickness,pitch) largely differs between the scanner manu-facturers. Please make use of the scan parametertranslator given in the appendix.
Results
Relative and absolute dose values are presented inthe same way to that used for SSCT scanners. Please
Application Module ‘Benchmarking’
Fig 7.9 Input of MSCT scan parameters for each type of ex-amination; column ‘N’ has been added, and correction fordose modulations effects can be applied by activating the cor-responding check box. Take care of the pitfalls resulting fromnon-uniform presentation of scan parameters at the scannerconsoles of different manufacturers, Make use of the scan pa-rameter translator in the appendix.

User’s Guide CT-Expo V 2.3
43
Application Module ‘Benchmarking’
note that reference is made to the average dose val-ues of the ’99 survey on SSCT practice. Bench-marking with respect to the results of the MSCT sur-vey in 2002 is not appropriate, as current MSCT prac-tice still requires major optimisation effort (Brix,2003).
Contrary to the graphical presentation of relative dosevalues used for SSCT scanners, the pitch-correctedvolume CTDI (CTDIvol) is used instead of theweighted CTDI (fig. 7.10) for the following reasons:the majority of MSCT scanners makes use of a spe-cial kind of z-interpolation (z-filtering) which ensuresthat effective slice thickness, image noise and aver-age local dose inside the scan range are independentfrom the pitch selected (Nagel, 2002). Therefore thevolume CTDI is the relevant descriptor of local dosefor MSCT scanners. Volume CTDI is identical to theCTDI value displayed at the scanner’s console.
The additional figures provided for the comparisonof scan parameter settings are also identical to thoseused for SSCT scanner with the exception of slice
Fig. 7.11 Comparison of actual slice thicknesses (recon-structed slice thickness, hrec) with average values of the ’99German CT survey (‘ref.’).
thickness. With MSCT scanners, the slice thicknessused for data acquisition usually differs from the slicethickness used for image presentation. The noiseimpression, however, depends only on the latter. Po-tential consequences for the selection of mAs set-tings therefore result from hrec, not from hcol. There-fore the comparison of slice thickness is made forhrec (fig. 7.11).

User’s Guide CT-Expo V 2.3
44
Application Module ‘Benchmarking’
Fig. 7.10 Relative dose values for each type of examination in terms of volume CTDI (CTDIvol) and dose-length product perexamination (DLPw). Bars exceeding the 100% line represent dose values above the average of the ’99 German CT survey.Contrary to the benchmarking of SSCT scanners, the pitch-corrected CTDIvol is used instead of CTDIw.

User’s Guide CT-Expo V 2.3
45
Application Module ‘Benchmarking’
Printing the Results
In order to send the benchmark results to your lineprinter, please click on the area ‘Print’ in the naviga-tion toolbar and select either ‘Print Sheet’ or ‘PrintDiagram’ depending on whether you wish to hard-copy the table or the figures.
In the same way other sheets like ‘Calculate’, ‘Stand-ard’ and ‘Comparison’ can also be printed.
Reset
By clicking on the area ‘Reset’ in the navigation tool-bar, all data entered in the white cells are erased im-mediately. The dose values in the yellow cells alsodisappear. However, as these cells are protected, thealgorithms programmed in these cells simply becomeinvisible. If you need to erase only a small amount ofdata, first highlight the corresponding cells; then pushthe ‘Erase’ key on the keyboard of your computer.
By clicking on the corresponding areas in the navi-gation toolbar, you can return to the start sheet or toother application modules of your choice.

User’s Guide CT-Expo V 2.3
46
Scan parameter NX/i QX/i, Plus Ultra LightSpeed 16, -Pro, 32, VCT
Helical Axial Helical Axial Helical Axial Helical Axial
QCurrent-timeproduct (electrical)
via I and tR:
Q = I · tR
NNumber of slicesscannedsimultaneously
no explicit info;normally max. possiblenumber of slices (N=2)
implicitly:1i: N=12i: N=2
no explicit info;normally max. possiblenumber of slices (N=4)
implicitly:1i: N=12i: N=24i: N=4
no explicit info;normally max. possiblenumber of slices (N=8)
implicitly:1i: N=12i: N=24i: N=48i: N=8
In submenu of "Thick Speed":Detector Configuration
hcol
Slice thickness(data acquisition)
via TV, N, p h
col = TV / (N · p)
In submenu of "Thick Speed":Detector Configuration
TV Table feed (perscan or rotation)
Speed [mm/rot] as forHelical
as for NX/i as forNX/i
as for NX/i as forNX/i
2nd value in "Thick Speed"
pDose-relevantpitch factor
via Scan-Mode:HQ: p=0,75HS: p=1,5
normallyp = 1
as for NX/ias forNX/i
über Scan-Mode:UQ: p=0,625UM: p=0,875UF: p=1,35
US: p=1,675
as forNX/i
3rd value in "Thick Speed"
hrec
Reconstructed slicethickness (nominal) Helical Thickness
normallyh
rec = h
col
as for NX/ias forNX/i as for NX/i
as forNX/i 1st value in "Thick Speed"
L Scan length (in cm)via StartLocation and EndLocation (in mm):
L = 0,1 · (EndLocation - StartLocation)
Appendices
Appendices
Appendix A: MSCT Scan Parameter Translator
Tab. A.1 MSCT scanners manufactured by General Electric (I = electrical tube current, tR = exposure time (per scan orrotation) = Rotationtime (in s).

User’s Guide CT-Expo V 2.3
47
Scan parameter
CT Twin, Mx Twin Mx8000D Mx8000 (Quad)Mx8000 IDT seriesBrilliance series
Mx8000 (all)Brilliance (all)
Helical Axial Helical Helical Helical Axial
ITube current(effective)
via mAs/slice:I = (mAs/slice) / t
R
tR
Exposure time (perscan or rotation) 1 s Scan Time Rot. Time
QCurrent-timeproduct (effective) mAs/slice
NNumber of slicesscannedsimultaneously
via Scanmode:Single: N=1Dual: N=2Fused: N=2
via N·hcol
as for CT Twin
via hcol
:
hcol
=0,5mm: N=2else: N=4
via Collimation
hcol
Slice collimation (atdata acquisition)
via Slice ThicknessSingle/Dual:p=0.7 or 1.5:h
col = h
rec/1.1
p=1 or 2:h
col = h
rec/1.3
Fused::h
col = h
rec/2
Single/Dual:
via N*hcol
Fused:
hcol
= hrecon
/2
via Thickness /first sub-menu as for Mx8000D via Collimation
TV Table feed (perscan or rotation)
via Pitch, hcol
, N:TV = N*h
col*p
Scan Increment as for CT Twin as for CT Twin as for CT Twin Increment
pDose-relevantpitch factor
Pitch p=TV / N·hcol
as for CT Twin as for CT Twin as for CT Twin p=Increment / N·hcol
hrec
Reconstructed slicethickness (FWHM)
Thickness
L Scan length (in cm) 0.1 ·Sequence Length 0.1 · (Length- hrec
)
Appendices
Tab. A.2 MSCT scanners manufactured by Philips (applies also for Elscint, Marconi, and Picker).

User’s Guide CT-Expo V 2.3
48
Scan parameter All MSCT scanners
I Tube current (electrical) mA
tR
Exposure time (per scanor rotation)
"Scan time"
QCurrent-time product(electrical) Q = I · tR
N Number of slicesscanned simultaneously
column "Thickness",value in brackets / hcol
hcol
Slice collimation (at dataacquisition) "Thickness"
TF Table feed (per scan orrotation)
2nd level - "Continous"or "Range": table
pDose-relevantpitch factor
2nd level - "Continous"or "Range": table
hrec
Reconstructed slicethickness (nominal)
Image Thickness, 2ndlevel - "Recon Detail"
L Scan length (in cm) L = 0.1 · Range
Scan parameter All MSCT scanners
I Tube current (effective) via "mAs/slice":I = (mAs/slice) / tR
tR
Exposure time (per scanor rotation) "Rot. time"
Q Current-time product(effective) "mAs/slice"
N Number of slicesscanned simultaneously
via "Slice collimation"(N · h
col)
hcol
Slice collimation (at dataacquisition)
via "Slice collimation"(N · hcol)
TF Table feed (per scan orrotation) "Feed / rotation"
p Dose-relevantpitch factor
via N, hcol and TF:p=TF / N·h
col
hrec
Reconstructed slicethickness (FWHM) "Slice width"
L Scan length (in cm) L = 0.1 · Scan range
Appendices
Tab. A.3 MSCT scanners manufactured by Siemens. Tab. A.4 MSCT scanners manufactured by Toshiba.
Note:On Sensation 64, total collimation N · hcol in ’z-sharp’ mode isalways 32 · 0.6 mm, not 64 · 0.6 mm, as erroneously stated at thescanner’ s console ! Make therefore calculations with N = 32independently acquired slices.
Note:Make input of mAs for Toshiba’s multi-slice scanners alwaysseparately with (electrical) tube current I and exposure time tR,never with effective mAs (as also indicated on some consoles) !

User’s Guide CT-Expo V 2.3
49
Appendices
Appendix B: Calculation Formulas
Weighted CTDI:
CTDI CTDI UU
I t kw H B n w H Bref
kU H B
OB, / , /
, /
= u£
¤²²
¥
¦´́ u u u
CTDI for scan projection radiogram:as CTDI but with t N h TScol , / = u
Voltage correction factor:k a U bU H B U H B U H B, / , / , / = u +
Overbeaming correction factor:
kN h N h dz
N h N h dzOBref col
col ref
( )
( )=
u( ) u u +
u u u( ) +
Volume CTDI (= Effective CTDI (CTDIw,eff)):
CTDI CTDIpvol
w =
Pitch:
p TFN hcol
=u
Dose-length product:
DLP CTDI Lp CTDI Lw w
totvol tot = u = u
Total scan length:L first last slice position h Ltot rec = < + + 6
Overranging (spiral scanning mode only):6L N h m p bcol OR OR = u u u +( )
Effective dose:
E DLPP
kz z
f zw H B
H BCT H B
z
z
( ), /
/( / )= u u
<u
+ < <
+
-1
Uterine dose:
D CTDIP p k f Uterus zUterus
w H B
H BCT H
z
z
= u u u<
+
- ( , ), /
/( )
1

User’s Guide CT-Expo V 2.3
50
Appendix C: Types of Standard Examinations
Appendices
Tab. C.1 Standard examinations with specification of the anatomical and geometricallimits of the scan range.
Standard Examination Anatomical Landmarks Scan Range LengthName Abbr. caudal cranial (male) (female) (cm)
from to from to (m.) (f.)Routine Brain BRN Skull base Vertex 82 94 77 89 12 12Skull Base SKB Skull base Skull base 80 92 75 77 2 2
Facial Bones / Sinuses FB/SIN Occlusial plane Superior margin of frontalsinus 78 89 74 85 11 11
Dental DENT Inferior margin of teeth Superior margin of teeth 76 80 71 75 4 4
Facial Bones + Neck FB+N Inferior margin of thyroidgland
Superior margin of frontalsinus 70 88 66 84 18 18
Routine Chest CHE Sinus C7 / T1 41 69 39 65 28 26Chest Incl. Adrenals CHE+ Inferior margin of adrenals C7 / T1 36 69 34 65 33 31Chest + Upper Abdomen CHE Inferior extremity of kidney C7 / T1 25 69 23 65 44 42Routine Abdomen (tot.) ABD+PE Pubic symphysis Diaphragm 0 43 0 41 43 41Routine Abdomen +w.Testes ABD+PE+ Inferior extremity of testes Diaphragm -5 43 -5 41 48 46Liver/Kidneys (Upp. Abdomen) LI/KI Inferior extremity of kidney Diaphragm 25 43 23 41 18 18Routine Pelvis PEL Pubic symphysis Inferior extremity of kidney 0 25 0 23 25 23Routine Pelvis w. Testes PEL+ Inferior extremity of testes Inferior extremity of kidney -5 25 -5 23 30 28Whole Trunk TRUNK Pubic symphysis C7 / T1 0 68 0 64 68 64Whole Trunk w. Testes TRUNK+ Inferior extremity of testes C7 / T1 -5 68 -5 64 73 69CTA Carotid CAR Aortic arch Vertex 60 94 57 89 34 32CTA Aorta AOR Superior end of sacrum T1 12 67 12 63 55 51CTA Thoracic Aorta ATH T12 T1 40 67 38 63 27 25CTA Abdominal Aorta AAB Superior end of sacrum T12 12 41 12 39 29 27CTA Pulmonary Vessels PV T10 T2/3 48 65 46 61 17 15Coronary CTA CORO Sinus T8 41 53 39 51 12 12Coronary Bypass CTA CORO+ Sinus T5/6 40 58 38 56 18 18CTA Peripheral Runoff PRO Feet Iliac crest -76 23 -71 21 99 92Cervical Spine (Disk) CSPDI C5 C3 72 76 68 72 4 4Cervical Spine (Fracture) CSPDI C7 C1 69 79 65 75 10 10Lumbar Spine (Disk) LSPFR L5/S1 L3/4 24 30 22 28 6 6Lumbar Spine (Fracture) LSPFR L5/S1 L1/T12 24 40 22 38 16 16Osseous Pelvis OP Ischial tuberosity Iliac crest 0 23 0 21 23 21Osseous Pelvis w. Testes OP* Inferior extremity of testes Iliac crest -5 23 -5 21 28 26Head + Trunk H+T Pubic symphysis Vertex 0 94 0 89 94 89Head + Trunk +w. Testes H+T+ Inferior extremity of testes Vertex -5 94 -5 89 99 94Whole Body WHB Feet Vertex -76 94 -71 89 170 160

User’s Guide CT-Expo V 2.3
51
Appendix D: Accuracy of Dose Calculations
Appendices
The accuracy of the dose calculations made with CT-Expo depends on a number of factors. In this appen-dix these factors are described and the resulting er-rors are stated.
Data Input
Incorrect input of the required data (type of scanner,scan range, examination type, scan and examinationparameters) may result in considerable errors. There-fore all data should be input carefully. Detailed in-formation on items to be observed with each inputparameter is given in section 4.
Scanner Data
The accuracy of the scanner data directly affects thecalculation of all dose quantities. Potential sourcesof error are
• output (exposure) tolerances of the type of scan-
ner ranging typically from ±10% to ±30%;• unknown modifications to the type of scanner (re-
lating e.g. to beam filtration, beam shaper, colli-mation etc.).
The authors of CT-Expo in co-operation with thescanner manufacturers are attempting to keep thescanner database up-to-date and to supply all regis-tered users with actual values. The most accurate doseestimates are always achieved by using the latest ver-sion of CT-Expo.
Overbeaming Effects
In case of multi-slice scanners and single-slice scan-ners from Elscint and Toshiba the width of the beamin z-direction is larger than the portion used for de-tection for all collimator settings. The parameters thatare needed to correct for this effect (’overbeamingcorrection’) are included in the scanner data.

User’s Guide CT-Expo V 2.3
52
On some single-slice scanners, ‘post-patient colli-mation’ is used on scans where the slice thickness isbelow 2 mm. In this case, the dose profile resultingfrom the primary collimation close to the x-ray sourceis wider than the slice profile at the secondary colli-mation close to the detector array (e.g. 2mm vs.1mm). This overbeaming effect is also corrected.
Scan Projection Radiograph (SPR)
As demonstrated by calculations that can be made inmodule ’Standard’, the dose contribution from theSPR (‘Scanogram’, ‘Topogram’, ‘Scout View’ etc.)is relatively small. Normally it accounts for only 1 -2% of the effective dose of the CT examination andcan therefore be neglected. Larger contributions (10– 20% of total dose) may occur in examinations whichare characterised by low dose settings (e.g. sinuses,low dose chest, paediatric examaminations) or a shortscan range (e.g. bone mineral density studies and pae-diatric examinations), in particular if it is not possi-ble on your scanner to reduce the length of the SPR.
SPR dose assessment is primarily made by calcula-tion of the resulting CTDIvol. The absorbed energyfrom a SPR (and thus the average dose) is the sameas from a regular scan with rotating x-ray tube ac-quired with comparable exposure settings. The re-sulting organ doses, however, are different due to thedifferences in irradiation geometry. Therefore no ex-plicit statements on organ doses from SPR are given.The accuracy of the corresponding effective dose isalso restricted. As the resulting values are compara-bly small, this limitation can be tolerated.
Spiral Scans
Spiral scans require additional data at the start andthe end of the spiral. Only integral dose quantities(DLPw, E) are increased by this effect. This is takeninto account by the overranging correction introducedin V1.4.
Patient Influence
All dose calculations strictly apply only for standard
Appendices

User’s Guide CT-Expo V 2.3
53
patients that are represented by the mathematicalphantoms ‘ADAM’, ‘EVA’, ‘CHILD’ and ‘BABY’. Themost important specifications of these phantoms arelisted in tab. D.1.
Different patient dimensions only impact on the cal-culation of effective dose. Weighted CTDI and dose-length product, however, refer to standardised cylin-drical phantoms made from PMMA of diameter 16and 32 cm (‘Head’ and ‘Body’, respectively). Thesequantities are therefore independent of patient dimen-sions with the exception of body region and agegroup. A direct dependence on patient size is intro-duced, however, if CTDIw is used to determine organdose. Organ dose is dependant on many variables,such as variability of organ position and dimension,and is subject to large error.
Conversion Factors
Calculation of organ dose and effective dose inevita-bly depends on the accuracy of the conversion fac-tors used. These factors are based on the modelling
Tab. D.1Specifications of the mathematical phantoms on which theconversion factors used for the assessment of organ andeffective dose values are based (Zankl,1991; Zankl, 1993).
of mathematical phantoms. The statistical error ofthe Monte-Carlo simulation involved amounts to afew percentage points and can be neglected. The prin-cipal sources are (i) systematic errors which resultfrom the definition of these phantoms and (ii) thegeometrical position of the organs inside. Depend-ing on the set of conversion factors used, organ andeffective dose values calculated with different pro-grams may differ to some degree. The general agree-ment between the data set used in CT-Expo (Zankl,1991) and the NRPB data set (Shrimpton, 1991)which is frequently be used by others is good. Thisholds, however, for only one scanner model with
Appendices
Phantomtyp ADAM EVA CHILD BABY
Alter >18 J. >18 J. 7 J. 6 Wo.
Größe [cm] 170 160 115 57
Dicke a.p. [cm] 20 18,8 17,6 12,2
Gewicht [kg] 70 60 22 4,2

User’s Guide CT-Expo V 2.3
54
equal dose-relevant characteristics (Siemens Soma-tom DRH). No information is available up to now onthe agreement with other data sets (e.g. NIH, 1999).
In addition to the conversion factors used, the accu-racy of effective dose is also dependant on how thesefactors are used in the calculation. This applies tothe way in which organs are substituted (which arelisted in reports ICRP 60 (ICRP, 1991)and ICRP 103(ICRP, 2008) but not available in the pertaining dataset) as well as the correct treatment of the ‘remain-der’ organs. In CT-Expo, a simplified, acceleratedprocedure is used in the ‘Calculate’ module whichtakes the remainder organs into account slice-by-slice.The ‘Standard’, ‘Light’ and ‘Benchmarking’ modules,however, make use of pre-defined mean conversionfactors which have been determined by using a moreextended procedure which treats the remainder or-gan problem per anatomical region. Normally, theresults of these two different approaches differ byless than 5% except for the region ‘Facial Bone /Neck’ where differences can be up to 10%. However,the effective dose values which are typical for this
anatomical region are small relative to e.g. thoraxand abdomen, and hence this error can be tolerated.
Correction of Scanner Type
The conversion factors used in CT-Expo apply forthe scanner model Siemens Somatom DRH. The dosecharacteristics for this older type of scanner differsubstantially from other CT scanners. In order to cor-rect for scanner-specific calculations of organ doseand effective dose, discrete correction factors (in stepsof between 10 and 20%) are used (‘Scanner Match-ing’). The error resulting from this procedure amountsto approximately ±10% and thus remains at a levelcomparable to other factors influencing the accuracyof effective dose determined by this calculation.
Dose Modulation
On most types of scanner, the tube current can beadjusted automatically to the varying absorption be-tween a.p. and lateral projections (angular dose modu-lation) or/and along the patient’s long axis (longitu-
Appendices

User’s Guide CT-Expo V 2.3
55
dinal dose modulation). With respect to dose assess-ment, this is important only when calculating organdose and effective dose.
As far as effective dose is concerned, differences inthe radiation intensity with projection angle and/orlocation should be compensated approximately. Thisapplies for most types of examination except those
Appendices
that comprise trunk plus head or legs (e.g. CTA ofthe carotides or peripheral run-off). No compensa-tion effects, however, can be expected in the assess-ment of organ doses, resulting in larger discrepan-cies.
In order to allow for the correction of dose modulationeffects a typical mAs profile has been evaluated (fig.D1), which is based on measured attenuation data ofadult standard patients. The conversion into relativemAs values follows the modulation characteristic ofthe present CareDose 4D automatic dose controlsystem. This employs a gentle adaptation of mAs todifferences in effective body diameter (mAs x 2 per8cm in the trunk, per 20cm in the head/neck rangeand per 30 cm in the leg‘s range).
It should be noted that the actual profile depends to alarge degree on the modulation strength of thescanner, on the individual attenuation charecteristicsof the patient and on other factors such as upper andlower mAs limits. As an example, the mAs adaptionto differences in body diameter is much stronger
Fig. D.1 The mAs profiles used in CT-Expo to correct fordose modulation effects in dependence of the slice locationfrom feet (left) to head (right).

User’s Guide CT-Expo V 2.3
56
Appendices
(mAs x 2 per 4 cm) if automatic dose control systemswith ’constant noise‘ characteristic (GE, Hitachi,Toshiba) are used. At the same time the mAs range isrestricted in these systems by applying upper andlower limits (factor 2 to 3).
Nevertheless the mAs profiles shown in fig. D1 allowto account for the effects of longitudinal and 3D dosemodulation in adult patients in an approximatemanner. For these reasons, however, a similarcorrection for pure angular dose modulation is notpossible.
The average values of mAs or CTDIvol of the corre-sponding scan series have to be used as input param-eter. If these values are neither available at the scan-ner’s console nor in the dose report of the examina-tion (or if the display shows the peak instead of theaverage value, as currently applied by Toshiba scan-ners), the required average values must be determinedfrom the individual values of all images in the scanseries.
Effective Dose Calculation
The calculation of effective dose in modules’Calculate‘ and ’Standard‘is performed separately foreach gender. For males, the contribution of breast doseis not taken into account, as the associated radiationrisk is negligible due to the small size of the organcompared to the female breast.
In module ‚Benchmarking‘, however, the gender-in-dependent calculation is performed according to theformula defined in ICRP 74 (ICRP97):
E w H wH H
breast breast w TT m T f
T breast
,, ,= u + u+�
�³
�
�µ
&
- 2
This holds for both calculation modes (ICRP 60 and103). As the contribution of the breast is effectivelydoubled, effective doses for all types of examinationthat include the breast region (in particular heart andchest) are higher than the average of effective dosesseparataly assessed for ’ADAM‘ and ’EVA‘.

User’s Guide CT-Expo V 2.3
57
Appendices
Total Error
When using CT-Expo, the typical total error in dosecalculation is
• ±10 to ±15% for those quantities which can alsobe measured (CTDIvol, CTDIw, DLPw) and
• ±20 to ±30% for those quantities which can onlybe derived by using conversion coefficients (or-gan dose and effective dose).
Even larger errors may occur in case of
• incorrect data input,• organ dose assessment for organs located at the
boarder or outside of the scan range,• organ dose assessment when angular and/or lon-
gitudinal dose modulation is applied,• unusually large equipment tolerances,• unknown or unauthorised scanner modifications.

User’s Guide CT-Expo V 2.3
58
Literature
Brix, 2003 Brix G, Nagel HD, Stamm G et al. Radiationexposure in multi-slice versus single-slice spiralCT: Results of a nationwide survey. Eur. Radiol.2003; 13: 1979 - 1991
Brix, 2004 Brix G, Lechel U, Veit R et al. Assessment of atheoretical formalism for dose estimation in CT.Eur. Radiol. 2004; 14: 1274 - 1285
DGMP, 2002 Deutsche Gesellschaft für Medizinische Physike.V. und Deutsche Röntgengesellschaft. Präna-tale Strahlenexposition aus medizinischer Indi-kation; Dosisermittlung, Folgerung für Arzt undSchwangere. Überarbeitete und ergänzte Neuauf-lage 2002. DGMP Report No. 7, 2002 (ISBN 3-92518-74-2, see also: http://www.dgmp.de)
Galanski, 2001 Galanski M, Nagel HD, Stamm G. CT-Exposi-tionspraxis in der Bundesrepublik Deutschland -Ergebnisse einer bundesweiten Umfrage im Jahre1999. Fortschr. Röntgenstr. 2001; 173: R1 - R66
ICRP, 1991 International Commission on Radiological Pro-tection. 1990 Recommendations of the Interna-tional Commission on Radiological Protection.Publication 60. Oxford: Pergamon Press, 1991
ICRP, 1997 International Commission on Radiological Pro-tection. Conversion coefficients for use in radio-logical protection against external radiation. Pub-lication 74. Ann. ICRP 1997, Vol. 26/3
ICRP, 2008 International Commission on Radiological Pro-tection. The 2007 recommendations of the Inter-national Commission on Radiological Protection.Publication 103. Ann ICRP 2008; Vol. 37 (2-4):1-332
Nagel, 2002 Nagel HD (ed.), Galanski M, Hidajat N, Maier W,Schmidt Th. Radiation exposure in computedtomography - fundamentals, influencing param-eters, dose assessment, optimisation, scannerdata, terminology. 4th revised and updated edi-tion. Hamburg: CTB Publications, 2002 (Mail:[email protected])
Literature

User’s Guide CT-Expo V 2.3
59
Literature
Nagel, 2010 Nagel HD Guideline for the optimization of theradiation exposure of CT ecaminations 2nd re-vised and updated edition, 2010. Download:www.sascrad.com/page13.php
NIH, 1999 National Institute of Radiation Hygiene. CT dosecalculation software ‘CT-Dose’. Herlev: NationalInstitute of Radiation Hygiene, 1999 (Mail:[email protected]).
Shrimpton, 1991 Shrimpton PC, Jones DG, Hillier MC, WallBF, LeHeron JC and Faulkner K. Survey of CTPractice in the UK; Part 2: Dosimetric Aspects.NRPB-249. London: HMSO, 1991: 48
Shrimpton, 2000 Shrimpton PC and Wall B. Reference dosesfor paediatric computed tomography. RadiationProtection Dosimetry 2000; 90: 249 - 252
Stamm, 2002 Stamm G, Nagel HD. CT-Expo – ein neuarti-ges Programm zur Dosisevaluierung in der CT.Fortschr. Röntgenstr. 2002; 174: 1570 - 1576
Zankl, 1991 Zankl M, Panzer W and Drexler G. The Calcula-tion of Dose from External Photon ExposuresUsing Reference Human Phantoms and MonteCarlo Methods Part VI: Organ Doses from Com-puted Tomographic Examinations. GSF-Bericht30/91. Oberschleißheim: GSF-Forschungszen-trum, 1991
Zankl, 1993 Zankl M, Panzer W and Drexler G. TomographicAnthropomorphic Models Part II: Organ Dosesfrom Computed Tomographic Examinations inPaediatric Radiology. GSF-Bericht 30/93. Ober-schleißheim: GSF-Forschungszentrum, 1993