user s guide - autodeskimages.autodesk.com/adsk/files/autocadrasterdesign_10_usersguide.pdf ·...
TRANSCRIPT

AutoCAD Raster Design 2010
User’s Guide
April 2009

© 2009 Autodesk, Inc. All Rights Reserved. Except as otherwise permitted by Autodesk, Inc., this publication, or parts thereof, may not bereproduced in any form, by any method, for any purpose. Certain materials included in this publication are reprinted with the permission of the copyright holder. TrademarksThe following are registered trademarks or trademarks of Autodesk, Inc., in the USA and other countries: 3DEC (design/logo), 3December,3December.com, 3ds Max, ADI, Alias, Alias (swirl design/logo), AliasStudio, Alias|Wavefront (design/logo), ATC, AUGI, AutoCAD, AutoCADLearning Assistance, AutoCAD LT, AutoCAD Simulator, AutoCAD SQL Extension, AutoCAD SQL Interface, Autodesk, Autodesk Envision, AutodeskInsight, Autodesk Intent, Autodesk Inventor, Autodesk Map, Autodesk MapGuide, Autodesk Streamline, AutoLISP, AutoSnap, AutoSketch,AutoTrack, Backdraft, Built with ObjectARX (logo), Burn, Buzzsaw, CAiCE, Can You Imagine, Character Studio, Cinestream, Civil 3D, Cleaner,Cleaner Central, ClearScale, Colour Warper, Combustion, Communication Specification, Constructware, Content Explorer, Create>what's>Next>(design/logo), Dancing Baby (image), DesignCenter, Design Doctor, Designer's Toolkit, DesignKids, DesignProf, DesignServer, DesignStudio,Design|Studio (design/logo), Design Web Format, Discreet, DWF, DWG, DWG (logo), DWG Extreme, DWG TrueConvert, DWG TrueView, DXF,Ecotect, Exposure, Extending the Design Team, Face Robot, FBX, Filmbox, Fire, Flame, Flint, FMDesktop, Freewheel, Frost, GDX Driver, Gmax,Green Building Studio, Heads-up Design, Heidi, HumanIK, IDEA Server, i-drop, ImageModeler, iMOUT, Incinerator, Inferno, Inventor, InventorLT, Kaydara, Kaydara (design/logo), Kynapse, Kynogon, LandXplorer, LocationLogic, Lustre, Matchmover, Maya, Mechanical Desktop, Moonbox,MotionBuilder, Movimento, Mudbox, NavisWorks, ObjectARX, ObjectDBX, Open Reality, Opticore, Opticore Opus, PolarSnap, PortfolioWall,Powered with Autodesk Technology, Productstream, ProjectPoint, ProMaterials, RasterDWG, Reactor, RealDWG, Real-time Roto, REALVIZ,Recognize, Render Queue, Retimer,Reveal, Revit, Showcase, ShowMotion, SketchBook, Smoke, Softimage, Softimage|XSI (design/logo),SteeringWheels, Stitcher, Stone, StudioTools, Topobase, Toxik, TrustedDWG, ViewCube, Visual, Visual Construction, Visual Drainage, VisualLandscape, Visual Survey, Visual Toolbox, Visual LISP, Voice Reality, Volo, Vtour, Wire, Wiretap, WiretapCentral, XSI, and XSI (design/logo). The following are registered trademarks or trademarks of Autodesk Canada Co. in the USA and/or Canada and other countries:Backburner,Multi-Master Editing, River, and Sparks. The following are registered trademarks or trademarks of MoldflowCorp. in the USA and/or other countries: Moldflow, MPA, MPA(design/logo),Moldflow Plastics Advisers, MPI, MPI (design/logo), Moldflow Plastics Insight,MPX, MPX (design/logo), Moldflow Plastics Xpert. All other brand names, product names or trademarks belong to their respective holders. DisclaimerTHIS PUBLICATION AND THE INFORMATION CONTAINED HEREIN IS MADE AVAILABLE BY AUTODESK, INC. "AS IS." AUTODESK, INC. DISCLAIMSALL WARRANTIES, EITHER EXPRESS OR IMPLIED, INCLUDING BUT NOT LIMITED TO ANY IMPLIED WARRANTIES OF MERCHANTABILITY ORFITNESS FOR A PARTICULAR PURPOSE REGARDING THESE MATERIALS. Published by:Autodesk, Inc.111 Mclnnis ParkwaySan Rafael, CA 94903, USA

Contents
Chapter 1 Introduction to AutoCAD Raster Design 2010 . . . . . . . . . . . 1What is New in AutoCAD Raster Design 2010 . . . . . . . . . . . . . . . 1Accessing the Raster Design Home Page . . . . . . . . . . . . . . . . . . 4About AutoCAD Raster Design dialog box . . . . . . . . . . . . . . . . . 5Installation Requirements . . . . . . . . . . . . . . . . . . . . . . . . . 5Supported Image Formats . . . . . . . . . . . . . . . . . . . . . . . . . 5Image Portability . . . . . . . . . . . . . . . . . . . . . . . . . . . . . . 6AutoCAD Raster Design History . . . . . . . . . . . . . . . . . . . . . . 7
Chapter 2 Inserting and Correlating Images . . . . . . . . . . . . . . . . . 9Inserting Images . . . . . . . . . . . . . . . . . . . . . . . . . . . . . . 9
Inserting Local Images Using the Insert Image Dialog Box . . . . . 10Inserting an Image from the Internet Using the Insert Image
Dialog Box . . . . . . . . . . . . . . . . . . . . . . . . . . . . . 12Inserting an Image from an FTP Site Using the Insert Image
Dialog Box . . . . . . . . . . . . . . . . . . . . . . . . . . . . . 14Inserting an Image Using the Command Line . . . . . . . . . . . 16Adding Image Sources to Favorites . . . . . . . . . . . . . . . . . 18Assigning a Color Map to an Image . . . . . . . . . . . . . . . . . 18Creating New Images . . . . . . . . . . . . . . . . . . . . . . . . 20
Correlating Images . . . . . . . . . . . . . . . . . . . . . . . . . . . . 21Correlating an Image During Insertion . . . . . . . . . . . . . . . 21Using Quick Insert . . . . . . . . . . . . . . . . . . . . . . . . . 22
iii

Specifying Correlation Settings . . . . . . . . . . . . . . . . . . . 23Adjusting the Image Frame Before Insertion . . . . . . . . . . . . 27Correlating an Image After Insertion . . . . . . . . . . . . . . . . 28Matching Image Points . . . . . . . . . . . . . . . . . . . . . . . 28Moving an Image . . . . . . . . . . . . . . . . . . . . . . . . . . 29Scaling an Image . . . . . . . . . . . . . . . . . . . . . . . . . . 30Rubbersheeting an Image . . . . . . . . . . . . . . . . . . . . . . 31
Chapter 3 Saving Images . . . . . . . . . . . . . . . . . . . . . . . . . . . 39Saving an Image . . . . . . . . . . . . . . . . . . . . . . . . . . . . . . 39Saving Images with AutoCAD Save . . . . . . . . . . . . . . . . . . . . 41Embedding Images in a Drawing . . . . . . . . . . . . . . . . . . . . . 42Saving an Image to Another File Name, Type, or Location . . . . . . . . 43Saving an Image to an FTP Site . . . . . . . . . . . . . . . . . . . . . . 45Capturing an Image . . . . . . . . . . . . . . . . . . . . . . . . . . . . 47Exporting Images . . . . . . . . . . . . . . . . . . . . . . . . . . . . . 48
Exporting an Image . . . . . . . . . . . . . . . . . . . . . . . . . 49Exporting an Image to an FTP Site . . . . . . . . . . . . . . . . . 51Exporting a World File . . . . . . . . . . . . . . . . . . . . . . . 52Correlation Output Types . . . . . . . . . . . . . . . . . . . . . . 54Encoding and Data Organization Methods . . . . . . . . . . . . . 54
Chapter 4 Changing Image Properties . . . . . . . . . . . . . . . . . . . . 57AutoCAD Properties . . . . . . . . . . . . . . . . . . . . . . . . . . . . 57Image Display Properties . . . . . . . . . . . . . . . . . . . . . . . . . 58Image Display Quality . . . . . . . . . . . . . . . . . . . . . . . . . . . 58Image Frame Display . . . . . . . . . . . . . . . . . . . . . . . . . . . 59Image Layer . . . . . . . . . . . . . . . . . . . . . . . . . . . . . . . . 60Linetype of an Image Frame . . . . . . . . . . . . . . . . . . . . . . . . 61Foreground Color of a Bitonal Image . . . . . . . . . . . . . . . . . . . 61Transparency Color of an Image . . . . . . . . . . . . . . . . . . . . . 62Unused Color for Transparent Color . . . . . . . . . . . . . . . . . . . 63
Chapter 5 Managing Images and Insertions . . . . . . . . . . . . . . . . . 65Controlling the Image Manager Toolspace . . . . . . . . . . . . . . . . 65
Modifying the Item View Layout . . . . . . . . . . . . . . . . . . 65Copying Information to the Clipboard . . . . . . . . . . . . . . . 66
Managing Image Display and Data . . . . . . . . . . . . . . . . . . . . 67Zooming to an Image . . . . . . . . . . . . . . . . . . . . . . . . 67Changing the Color Map of an Image . . . . . . . . . . . . . . . 68Adding a Visual Elevation Key to a DEM Image . . . . . . . . . . 69Creating Another Insertion of an Image . . . . . . . . . . . . . . 70Displaying Point Data . . . . . . . . . . . . . . . . . . . . . . . . 71Showing and Hiding Images . . . . . . . . . . . . . . . . . . . . 72
iv | Contents

Changing the Display Order of Images . . . . . . . . . . . . . . . 73Erasing an Image . . . . . . . . . . . . . . . . . . . . . . . . . . 74Detaching an Image . . . . . . . . . . . . . . . . . . . . . . . . . 74Unloading/Reloading an Image . . . . . . . . . . . . . . . . . . . 75Changing the Active Path . . . . . . . . . . . . . . . . . . . . . . 75Changing the Saved Path . . . . . . . . . . . . . . . . . . . . . . 76
Chapter 6 Modifying Images . . . . . . . . . . . . . . . . . . . . . . . . . 79Selecting an Image . . . . . . . . . . . . . . . . . . . . . . . . . . . . 79Controlling Image Frames . . . . . . . . . . . . . . . . . . . . . . . . . 81Undoing Edits to an Image . . . . . . . . . . . . . . . . . . . . . . . . 81Snapping to COGO Points . . . . . . . . . . . . . . . . . . . . . . . . 82Cleaning Up Images . . . . . . . . . . . . . . . . . . . . . . . . . . . . 82
Deskewing an Image . . . . . . . . . . . . . . . . . . . . . . . . 83Removing Speckles from an Image . . . . . . . . . . . . . . . . . 84Adjusting the Image Bias . . . . . . . . . . . . . . . . . . . . . . 86Reversing the Light and Dark Shades in an Image . . . . . . . . . 88Mirroring an Image . . . . . . . . . . . . . . . . . . . . . . . . . 88Touching Up an Image . . . . . . . . . . . . . . . . . . . . . . . 89
Image Processing . . . . . . . . . . . . . . . . . . . . . . . . . . . . . 91Adjusting Images with the Histogram . . . . . . . . . . . . . . . 92
Adjusting the Brightness and Contrast of an Image . . . . . 92Maximizing Details in an Image . . . . . . . . . . . . . . . 96Converting a Color Image to Grayscale . . . . . . . . . . . 98Converting a Grayscale or Color Image to Bitonal . . . . . 100Making Tonal Adjustments to an Image . . . . . . . . . . 101
Convolving an Image . . . . . . . . . . . . . . . . . . . . . . . 105Reducing Harshness and Noise in an Image . . . . . . . . 105Median Filter . . . . . . . . . . . . . . . . . . . . . . . . . 106Making Differences in Shading More Distinct . . . . . . . 107Lowpass Filtering . . . . . . . . . . . . . . . . . . . . . . 108Highpass Filters . . . . . . . . . . . . . . . . . . . . . . . 109Edge Enhancements Filters . . . . . . . . . . . . . . . . . 110Shift and Difference Edge Enhancements Filters . . . . . . 110Laplace Edge Enhancements Filters . . . . . . . . . . . . . 110Gradient Directional Edge Enhancements Filters . . . . . . 111Matched Filter Edge Enhancements Filters . . . . . . . . . 111Using Bitonal Filters . . . . . . . . . . . . . . . . . . . . . 112Changing Image Density . . . . . . . . . . . . . . . . . . 115Setting the Color Depth for an Image . . . . . . . . . . . . 116
Using the Palette Manager . . . . . . . . . . . . . . . . . . . . . . . . 118Manipulating the Color Table . . . . . . . . . . . . . . . . . . . 118
Changing Selected Colors in the Image Palette . . . . . . . 118Combining Selected Colors in the Image Palette . . . . . . 120Designating a Transparent Color . . . . . . . . . . . . . . 121Selecting a Color Directly from the Image . . . . . . . . . 122
Contents | v

Removing Duplicate Entries from the Image Palette . . . . 123Resetting the Image Palette . . . . . . . . . . . . . . . . . 124
Importing and Exporting Image Palettes . . . . . . . . . . . . . 125Importing an Image Palette . . . . . . . . . . . . . . . . . 125Exporting an Image Palette . . . . . . . . . . . . . . . . . 128Displaying Image Palette Information . . . . . . . . . . . 129Converting Grayscale Images to Paletted Images . . . . . . 130
Controlling Palette Views . . . . . . . . . . . . . . . . . . . . . 131Controlling the Display of Unused Colors . . . . . . . . . 131Controlling the Display of Transparent Colors . . . . . . . 132Controlling the Display of Color Values . . . . . . . . . . 133Sorting the Color Table . . . . . . . . . . . . . . . . . . . 134Adding and Removing Columns from the List
Window . . . . . . . . . . . . . . . . . . . . . . . . . . 135Masking Images . . . . . . . . . . . . . . . . . . . . . . . . . . . . . 136
Creating a New Mask . . . . . . . . . . . . . . . . . . . . . . . 137Creating a New Mask Using the Command Line . . . . . . . . . 138Changing an Existing Mask . . . . . . . . . . . . . . . . . . . . 138
Changing the Image Mask Properties . . . . . . . . . . . . 139Changing an Existing Mask Using the Command
Line . . . . . . . . . . . . . . . . . . . . . . . . . . . . . 140Enabling or Disabling a Mask . . . . . . . . . . . . . . . . 141
Clipping an Image . . . . . . . . . . . . . . . . . . . . . . . . . 142Converting a Mask to Image Clips . . . . . . . . . . . . . . . . 143
Cropping Images . . . . . . . . . . . . . . . . . . . . . . . . . . . . . 144Line Cropping . . . . . . . . . . . . . . . . . . . . . . . . . . . 145Circular Cropping . . . . . . . . . . . . . . . . . . . . . . . . . 145Rectangular Cropping . . . . . . . . . . . . . . . . . . . . . . . 146Diagonal Cropping . . . . . . . . . . . . . . . . . . . . . . . . . 147Polygonal Cropping . . . . . . . . . . . . . . . . . . . . . . . . 147Aligned Rectangular Cropping . . . . . . . . . . . . . . . . . . . 148
Removing (Rubbing) Images . . . . . . . . . . . . . . . . . . . . . . . 149Rubbing a Raster Line . . . . . . . . . . . . . . . . . . . . . . . 149Rubbing a Raster Arc . . . . . . . . . . . . . . . . . . . . . . . . 150Rubbing a Raster Circle . . . . . . . . . . . . . . . . . . . . . . 151Rubbing Multiple Line Segments . . . . . . . . . . . . . . . . . 151Rubbing Raster Data Within a Circular Region . . . . . . . . . . 152Rubbing Raster Data Within a Diagonal Region . . . . . . . . . 153Rubbing Raster Data Within a Polygonal Region . . . . . . . . . 154Rubbing Raster Data Within a Rectangular Region . . . . . . . . 155Remove Raster Using Existing Vector Geometry . . . . . . . . . 155Removing Raster Entities Using REM Commands . . . . . . . . . 156
Removing a Line, Arc, or Circle Using Smart Pick . . . . . 157Removing a REM Line Primitive . . . . . . . . . . . . . . . 158Removing a REM Arc Primitive . . . . . . . . . . . . . . . 158Removing a REM Circle Primitive . . . . . . . . . . . . . . 159
vi | Contents

Merging Objects . . . . . . . . . . . . . . . . . . . . . . . . . . . . . 160Merging Images . . . . . . . . . . . . . . . . . . . . . . . . . . 160Merging Vectors into a Raster Image . . . . . . . . . . . . . . . 161Selecting Pen Widths for Vector Merge . . . . . . . . . . . . . . 162
Chapter 7 Raster Entity Manipulation . . . . . . . . . . . . . . . . . . . 165Characteristics of REM Objects . . . . . . . . . . . . . . . . . . . . . 166
How REM Objects Are Associated with an Image . . . . . . . . . 166Deciding Which Image to Use REM Commands On . . . . . . . 166AutoCAD Properties of REM Objects . . . . . . . . . . . . . . . 167REM Objects and Non-REM Edits . . . . . . . . . . . . . . . . . 167
Defining REM Region Objects . . . . . . . . . . . . . . . . . . . . . . 168Defining a REM Rectangular Region . . . . . . . . . . . . . . . . 169Defining a REM Polygonal Region . . . . . . . . . . . . . . . . . 170Defining a REM Diagonal Region . . . . . . . . . . . . . . . . . 171Defining a REM Circular Region . . . . . . . . . . . . . . . . . . 172Defining a Region From an Existing Vector Object . . . . . . . . 174Removing Part of a Region Object . . . . . . . . . . . . . . . . . 175
Defining REM Enhanced Bitonal Regions . . . . . . . . . . . . . . . . 176Defining REM Primitive Objects . . . . . . . . . . . . . . . . . . . . . 178
Defining a REM Line Primitive . . . . . . . . . . . . . . . . . . 180Defining a REM Circle Primitive . . . . . . . . . . . . . . . . . . 181Defining a REM Arc Primitive . . . . . . . . . . . . . . . . . . . 183Defining a REM Primitive Using Smart Pick . . . . . . . . . . . . 184Defining a REM Primitive From Existing Vectors . . . . . . . . . 185Changing the Linetype of a Primitive Object . . . . . . . . . . . 186
Manipulating REM Objects . . . . . . . . . . . . . . . . . . . . . . . 187Editing REM Objects . . . . . . . . . . . . . . . . . . . . . . . . 187Resizing a REM Object . . . . . . . . . . . . . . . . . . . . . . . 189Using REM Operations . . . . . . . . . . . . . . . . . . . . . . . 191
Trimming and Extending REM Lines . . . . . . . . . . . . 191Filleting REM Lines . . . . . . . . . . . . . . . . . . . . . 192Offsetting REM Objects . . . . . . . . . . . . . . . . . . . 193Smoothing REM Linework . . . . . . . . . . . . . . . . . . 194
Defining REM Objects Partially Outside the Image . . . . . . . . 195Using REM to Delete Raster Data . . . . . . . . . . . . . . . . . 195Clearing REM Objects . . . . . . . . . . . . . . . . . . . . . . . 197Merging REM Objects into an Image . . . . . . . . . . . . . . . 198Converting REM Objects to a New Raster Image . . . . . . . . . 199Using REM Transparency . . . . . . . . . . . . . . . . . . . . . 200Using REM Copy To Clipboard Command . . . . . . . . . . . . 200Separating Raster Linework Using Knife . . . . . . . . . . . . . . 201
Chapter 8 Converting Raster Entities to Vector . . . . . . . . . . . . . . 203Configuring VTools . . . . . . . . . . . . . . . . . . . . . . . . . . . 204
Contents | vii

ProdNameShort Options . . . . . . . . . . . . . . . . . . . . . . 204Dynamic Input Settings . . . . . . . . . . . . . . . . . . . . . . 204
Using SmartCorrect . . . . . . . . . . . . . . . . . . . . . . . . . . . 205Vectorizing Raster Geometry . . . . . . . . . . . . . . . . . . . . . . . 206
Vectorizing Raster Lines and Polylines . . . . . . . . . . . . . . 207Vectorizing Raster Rectangles . . . . . . . . . . . . . . . . . . . 212Vectorizing Raster Circles . . . . . . . . . . . . . . . . . . . . . 213Vectorizing Raster Arcs . . . . . . . . . . . . . . . . . . . . . . . 215
Following Polylines . . . . . . . . . . . . . . . . . . . . . . . . . . . 217Using the Polyline Follower . . . . . . . . . . . . . . . . . . . . 219Using the Contour Follower . . . . . . . . . . . . . . . . . . . . 220Using the 3D Polyline Follower . . . . . . . . . . . . . . . . . . 223
Vectorizing Raster Text . . . . . . . . . . . . . . . . . . . . . . . . . . 225Creating Single-Line Vector Text . . . . . . . . . . . . . . . . . 226Creating Multiline Vector Text . . . . . . . . . . . . . . . . . . 228Using Text Recognition . . . . . . . . . . . . . . . . . . . . . . 230
Entering Settings for Text Recognition . . . . . . . . . . . 230Recognizing and Converting Text . . . . . . . . . . . . . . 232
Using the Verify Text Window . . . . . . . . . . . . . . . . . . . 234View Window Options . . . . . . . . . . . . . . . . . . . . . . . 235Edit Pane Options . . . . . . . . . . . . . . . . . . . . . . . . . 235
Chapter 9 Raster Snapping . . . . . . . . . . . . . . . . . . . . . . . . . 237Specifying Raster Snap Settings . . . . . . . . . . . . . . . . . . . . . 237Snap Modes . . . . . . . . . . . . . . . . . . . . . . . . . . . . . . . 238
Chapter 10 Configuring Raster Design . . . . . . . . . . . . . . . . . . . . 241Changing the Quick Bar Visibility . . . . . . . . . . . . . . . . . . . . 241Changing the Image Frame Visibility . . . . . . . . . . . . . . . . . . 242Setting the Default Internet Location for Images . . . . . . . . . . . . 242Setting the Options . . . . . . . . . . . . . . . . . . . . . . . . . . . 244
Contour Vector Separation Options . . . . . . . . . . . . . . . . 244Correlation Defaults . . . . . . . . . . . . . . . . . . . . . . . . 245Correlation Search Paths . . . . . . . . . . . . . . . . . . . . . . 247General Vector Separation Options . . . . . . . . . . . . . . . . 249General VTool Settings . . . . . . . . . . . . . . . . . . . . . . . 250Image Detach Method . . . . . . . . . . . . . . . . . . . . . . . 252Image Defaults . . . . . . . . . . . . . . . . . . . . . . . . . . . 253Image Mask Options . . . . . . . . . . . . . . . . . . . . . . . . 254Image Thumbnails . . . . . . . . . . . . . . . . . . . . . . . . . 255Inserting Images From GSX or ESP . . . . . . . . . . . . . . . . 256Locking Method for Image Files . . . . . . . . . . . . . . . . . . 258Message Display Method . . . . . . . . . . . . . . . . . . . . . 259Mouse Settings . . . . . . . . . . . . . . . . . . . . . . . . . . . 260New Image Defaults . . . . . . . . . . . . . . . . . . . . . . . . 261
viii | Contents
QSave Preference . . . . . . . . . . . . . . . . . . . . . . . . . . 262Raster Design Startup Options . . . . . . . . . . . . . . . . . . . 263Raster Entity Detection Settings . . . . . . . . . . . . . . . . . . 264REM Settings . . . . . . . . . . . . . . . . . . . . . . . . . . . . 265Rub and Crop Line Width . . . . . . . . . . . . . . . . . . . . . 266Remove Under Method . . . . . . . . . . . . . . . . . . . . . . 268Vector Merge Settings . . . . . . . . . . . . . . . . . . . . . . . 268VTools Follower Settings . . . . . . . . . . . . . . . . . . . . . . 270
Appendix A Troubleshooting and Reference Guide . . . . . . . . . . . . . 273Troubleshooting . . . . . . . . . . . . . . . . . . . . . . . . . . . . . 273
Correcting Image Display Order using REGEN . . . . . . . . . . 273Raster Snap Troubleshooting . . . . . . . . . . . . . . . . . . . 274Plotting Raster Images . . . . . . . . . . . . . . . . . . . . . . . 274Images that are Not Editable . . . . . . . . . . . . . . . . . . . . 274Problems Inserting Images from the Internet . . . . . . . . . . . 275Sharing Projects with Images from Different Locations . . . . . . 276
Command-Line Commands . . . . . . . . . . . . . . . . . . . . . . . 276AutoCAD Commands for Images . . . . . . . . . . . . . . . . . . . . 285Image Menu . . . . . . . . . . . . . . . . . . . . . . . . . . . . . . . 286Toolbars . . . . . . . . . . . . . . . . . . . . . . . . . . . . . . . . . 288
Raster Design Toolbar . . . . . . . . . . . . . . . . . . . . . . . 288Raster Entity Manipulation Toolbars . . . . . . . . . . . . . . . 294The Quick Bar . . . . . . . . . . . . . . . . . . . . . . . . . . . 298
Appendix B Raster Design Dialog Boxes . . . . . . . . . . . . . . . . . . . 301About AutoCAD Raster Design Box . . . . . . . . . . . . . . . . . . . 301Assign Multispectral Band Dialog Box . . . . . . . . . . . . . . . . . . 301Band Assignment Color Map Dialog Box . . . . . . . . . . . . . . . . 301Bitonal Filters Dialog Box . . . . . . . . . . . . . . . . . . . . . . . . 302Change Density Dialog Box . . . . . . . . . . . . . . . . . . . . . . . 303Choose a New Directory Dialog Box . . . . . . . . . . . . . . . . . . . 303Choose a Resource File Directory Dialog Box . . . . . . . . . . . . . . 304Coordinate System Assignment Dialog Box . . . . . . . . . . . . . . . 305Data Organization Dialog Box . . . . . . . . . . . . . . . . . . . . . . 307Despeckle Dialog Box . . . . . . . . . . . . . . . . . . . . . . . . . . 307Display Manager Raster Layer Capture Dialog Box . . . . . . . . . . . 307Drafting Settings Dialog Box . . . . . . . . . . . . . . . . . . . . . . . 308
Raster Snap Tab (Drafting Settings Dialog Box) . . . . . . . . . . 309Edit Status Dialog Box . . . . . . . . . . . . . . . . . . . . . . . . . . 310Encoding Method Dialog Box . . . . . . . . . . . . . . . . . . . . . . 311Export Dialog Box . . . . . . . . . . . . . . . . . . . . . . . . . . . . 311Export Options Dialog Box . . . . . . . . . . . . . . . . . . . . . . . 313Export Palette Dialog Box . . . . . . . . . . . . . . . . . . . . . . . . 314GeoTIFF Coordinate System Properties Dialog Box . . . . . . . . . . . 315
Contents | ix
Grid Parameters Dialog Box . . . . . . . . . . . . . . . . . . . . . . . 315Histogram Dialog Box . . . . . . . . . . . . . . . . . . . . . . . . . . 316
Brightness/Contrast Tab (Histogram Dialog Box) . . . . . . . . . 316Equalize Tab (Histogram Dialog Box) . . . . . . . . . . . . . . . 318Threshold Tab (Histogram Dialog Box) . . . . . . . . . . . . . . 320Color to Grayscale Tab (Histogram Dialog Box) . . . . . . . . . . 321Tonal Adjustment Tab (Histogram Dialog Box) . . . . . . . . . . 322
Image Data Properties Dialog Box . . . . . . . . . . . . . . . . . . . . 324Image Filters Dialog Box . . . . . . . . . . . . . . . . . . . . . . . . . 324Image Insertion Dialog Box . . . . . . . . . . . . . . . . . . . . . . . 325
Assign Color Map Tab (Image Insertion Dialog Box) . . . . . . . 325Source Tab (Image Insertion Dialog Box) . . . . . . . . . . . . . 326Modify Tab (Image Insertion Dialog Box) . . . . . . . . . . . . . 327Insertion Tab (Image Insertion Dialog Box) . . . . . . . . . . . . 328Transform Tab (Image Insertion Dialog Box) . . . . . . . . . . . 329
Image Manager Toolspace . . . . . . . . . . . . . . . . . . . . . . . . 330Image Insertions View (Image Manager Toolspace) . . . . . . . . 331Image Data View (Image Manager Toolspace) . . . . . . . . . . . 332
Image Select Dialog Box . . . . . . . . . . . . . . . . . . . . . . . . . 335Import Data Dialog Box . . . . . . . . . . . . . . . . . . . . . . . . . 336Import Palette Dialog Box . . . . . . . . . . . . . . . . . . . . . . . . 337Insert Image Dialog Box . . . . . . . . . . . . . . . . . . . . . . . . . 338Median Filter Dialog Box . . . . . . . . . . . . . . . . . . . . . . . . 340Mirror Dialog Box . . . . . . . . . . . . . . . . . . . . . . . . . . . . 341Multi-frame Select Dialog Box . . . . . . . . . . . . . . . . . . . . . . 341New Image Dialog Box . . . . . . . . . . . . . . . . . . . . . . . . . . 342New Image Mask Dialog Box . . . . . . . . . . . . . . . . . . . . . . 343New Palette Color Insertion Dialog Box . . . . . . . . . . . . . . . . . 344Palette Assignment Color Map Dialog Box . . . . . . . . . . . . . . . 345Palette Color Map Definition Dialog Box . . . . . . . . . . . . . . . . 345Palette Information Dialog Box . . . . . . . . . . . . . . . . . . . . . 348Palette Manager Dialog Box . . . . . . . . . . . . . . . . . . . . . . . 348Raster Data Query Dialog Box . . . . . . . . . . . . . . . . . . . . . . 350Raster Design Options Dialog Box . . . . . . . . . . . . . . . . . . . . 351
Image Defaults Tab (Raster Design Options Dialog Box) . . . . . 351Feature Settings Tab (Raster Design Options Dialog Box) . . . . . 352Image Mask Tab (Raster Design Options Dialog Box) . . . . . . . 353New Image Tab (Raster Design Options Dialog Box) . . . . . . . 354Paths Tab (Raster Design Options Dialog Box) . . . . . . . . . . 355REM Tab (Raster Design Options Dialog Box) . . . . . . . . . . . 357Raster Entity Detection Tab (Raster Design Options Dialog
Box) . . . . . . . . . . . . . . . . . . . . . . . . . . . . . . . 357User Preferences Tab (Raster Design Options Dialog Box) . . . . 358Vector Merge Tab (Raster Design Options Dialog Box) . . . . . . 359VTools Follower Tab (Raster Design Options Dialog Box) . . . . . 360VTools General Tab (Raster Design Options Dialog Box) . . . . . 362
x | Contents

Raster Pen Settings Dialog Box . . . . . . . . . . . . . . . . . . . . . . 363Recognition Character Sets Dialog Box . . . . . . . . . . . . . . . . . 364Rubbersheet - Set Control Points Dialog Box . . . . . . . . . . . . . . 364Save As Dialog Box . . . . . . . . . . . . . . . . . . . . . . . . . . . . 366Select a Lock File Directory Dialog Box . . . . . . . . . . . . . . . . . 367Select Coordinate System (Export) Dialog Box . . . . . . . . . . . . . 368Select Coordinate System (Insert) Dialog Box . . . . . . . . . . . . . . 369Select Global Coordinate System Dialog Box . . . . . . . . . . . . . . 369Select Working Coordinate System Dialog Box . . . . . . . . . . . . . 369Target Color Dialog Box . . . . . . . . . . . . . . . . . . . . . . . . . 370Temporary File Location Dialog Box . . . . . . . . . . . . . . . . . . . 370Text Recognition Setup Dialog Box . . . . . . . . . . . . . . . . . . . 371Transparency Color Dialog Box . . . . . . . . . . . . . . . . . . . . . 373Vector Separation Options Dialog Box . . . . . . . . . . . . . . . . . 373
General Tab (Vector Separation Options Dialog Box) . . . . . . . 373Contour Tab (Vector Separation Options Dialog Box) . . . . . . 375
Verify Text/Table Dialog Box . . . . . . . . . . . . . . . . . . . . . . . 376VText Edit Dialog Box . . . . . . . . . . . . . . . . . . . . . . . . . . 379
Glossary . . . . . . . . . . . . . . . . . . . . . . . . . . . . . 381
Index . . . . . . . . . . . . . . . . . . . . . . . . . . . . . . . 403
Contents | xi

xii
Introduction to AutoCADRaster Design 2010
The AutoCAD Raster Design User's Guide includes conceptual, procedural, and referencedetails about the tools and features found in AutoCAD Raster Design 2010.
This chapter provides information to help you get acquainted with Raster Design requirements,capabilities, and history.
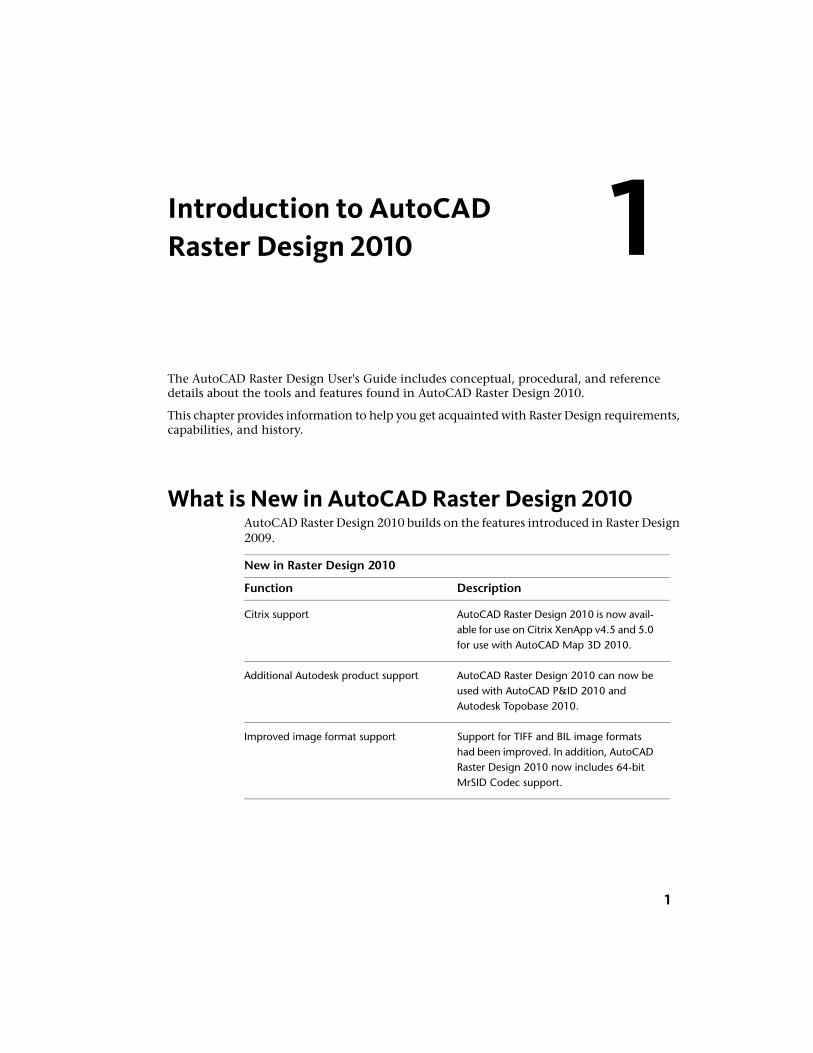
What is New in AutoCAD Raster Design 2010AutoCAD Raster Design 2010 builds on the features introduced in Raster Design2009.
New in Raster Design 2010
DescriptionFunction
AutoCAD Raster Design 2010 is now avail-able for use on Citrix XenApp v4.5 and 5.0for use with AutoCAD Map 3D 2010.
Citrix support
AutoCAD Raster Design 2010 can now beused with AutoCAD P&ID 2010 andAutodesk Topobase 2010.
Additional Autodesk product support
Support for TIFF and BIL image formatshad been improved. In addition, AutoCAD
Improved image format support
Raster Design 2010 now includes 64-bitMrSID Codec support.
1
1
New in Raster Design 2010
DescriptionFunction
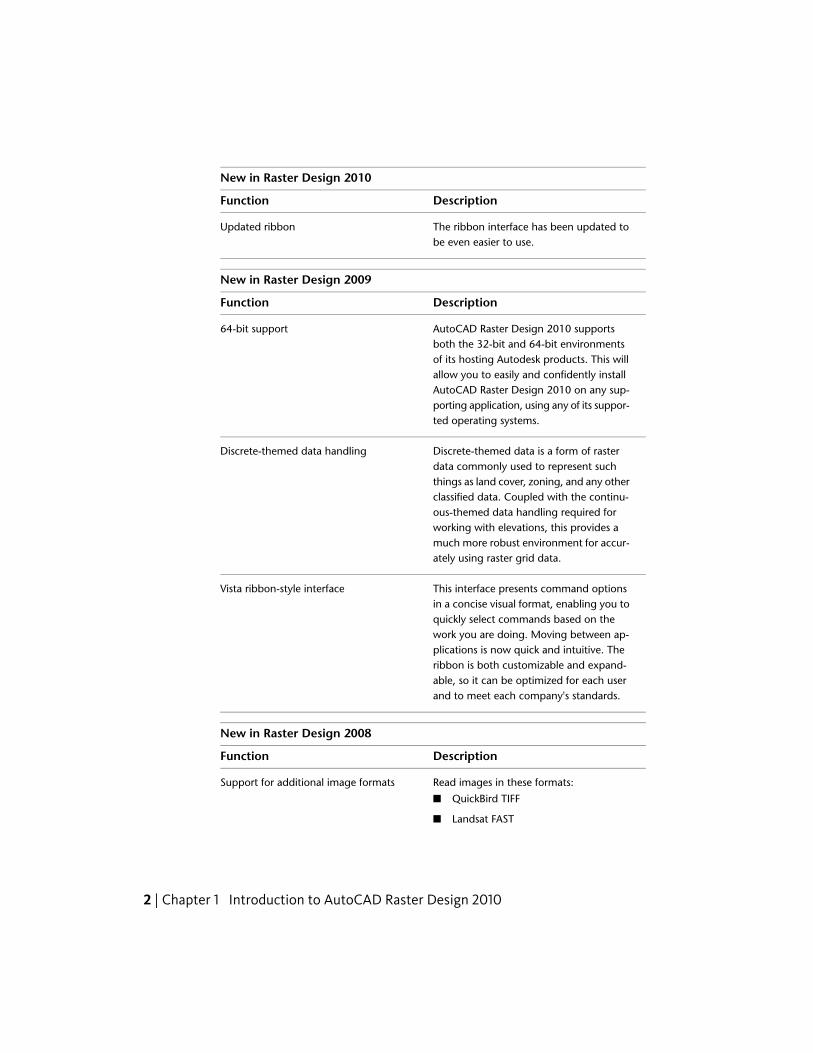
The ribbon interface has been updated tobe even easier to use.
Updated ribbon
New in Raster Design 2009
DescriptionFunction
AutoCAD Raster Design 2010 supportsboth the 32-bit and 64-bit environments
64-bit support
of its hosting Autodesk products. This willallow you to easily and confidently installAutoCAD Raster Design 2010 on any sup-porting application, using any of its suppor-ted operating systems.
Discrete-themed data is a form of rasterdata commonly used to represent such
Discrete-themed data handling
things as land cover, zoning, and any otherclassified data. Coupled with the continu-ous-themed data handling required forworking with elevations, this provides amuch more robust environment for accur-ately using raster grid data.
This interface presents command optionsin a concise visual format, enabling you to
Vista ribbon-style interface
quickly select commands based on thework you are doing. Moving between ap-plications is now quick and intuitive. Theribbon is both customizable and expand-able, so it can be optimized for each userand to meet each company's standards.
New in Raster Design 2008
DescriptionFunction
Read images in these formats:Support for additional image formats
■ QuickBird TIFF
■ Landsat FAST
2 | Chapter 1 Introduction to AutoCAD Raster Design 2010

New in Raster Design 2008
DescriptionFunction
■ NITF (National Image TransmissionFormat)
Prompts during vectorization operationscan display conveniently near the cursor,
Vectorization improvements
using AutoCAD Dynamic Input. Grips ap-pear on previously vectorized segments tofacilitate editing.
Edit MrSID, ECW, and JPEG2000 images,then save changes in JPEG2000 format.
Editing multi-resolution images
Embed one or more bitonal images insidethe drawing for convenience of imagetransfer and management.
Image embedding
The insert process has been improved withbetter image preview handling, support
Improved insert options
for multi-frame images, better indicationwhen default settings are being applied,and enhanced control over coordinatetransforms.
When used with AutoCAD Map 3D, RasterDesign can capture FDO (Feature Data
Enhanced image capture
Object) data, either in source format, or asstylized by Display Manager.
Procedures are streamlined to make des-peckle operations easier and more effective.
Improved Despeckle
New in Raster Design 2007
DescriptionFunction
Read images in this format.DTED format support
Read images in both ASCII and binary ver-sions of this format.
ESRI Grid format support
What is New in AutoCAD Raster Design 2010 | 3
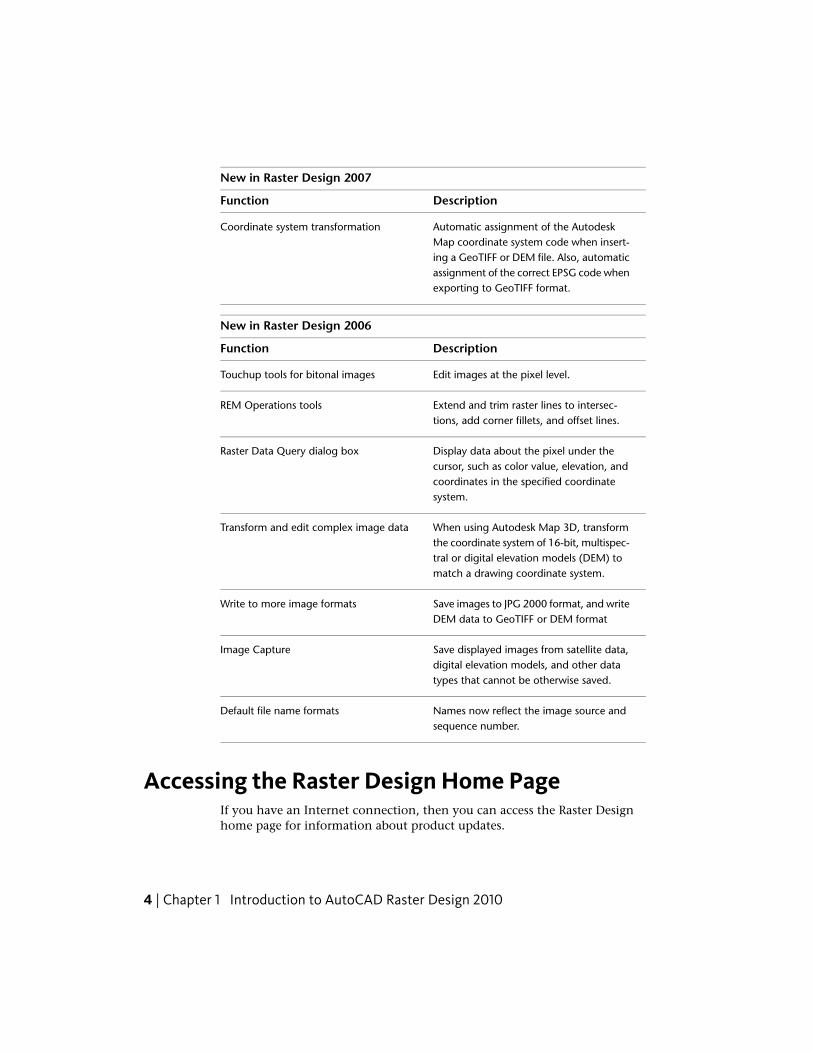
New in Raster Design 2007
DescriptionFunction
Automatic assignment of the AutodeskMap coordinate system code when insert-
Coordinate system transformation
ing a GeoTIFF or DEM file. Also, automaticassignment of the correct EPSG code whenexporting to GeoTIFF format.
New in Raster Design 2006
DescriptionFunction
Edit images at the pixel level.Touchup tools for bitonal images
Extend and trim raster lines to intersec-tions, add corner fillets, and offset lines.
REM Operations tools
Display data about the pixel under thecursor, such as color value, elevation, and
Raster Data Query dialog box
coordinates in the specified coordinatesystem.
When using Autodesk Map 3D, transformthe coordinate system of 16-bit, multispec-
Transform and edit complex image data
tral or digital elevation models (DEM) tomatch a drawing coordinate system.
Save images to JPG 2000 format, and writeDEM data to GeoTIFF or DEM format
Write to more image formats
Save displayed images from satellite data,digital elevation models, and other datatypes that cannot be otherwise saved.
Image Capture
Names now reflect the image source andsequence number.
Default file name formats
Accessing the Raster Design Home PageIf you have an Internet connection, then you can access the Raster Designhome page for information about product updates.
4 | Chapter 1 Introduction to AutoCAD Raster Design 2010

To access the Raster Design home page
■ On the Image menu, select Raster Design Home Page. or click in the Raster Design toolbar.
About AutoCAD Raster Design dialog boxThis dialog box provides you with the following information about RasterDesign:
■ Name of the licensed owner
■ Serial number
■ Source of the licence
Installation RequirementsFor hardware and software system requirements, refer to System Requirementsfor a Single User or System Requirements for Network Installations.
If your computer does not meet the minimum requirements, you shouldupgrade your computer before installing Raster Design.
Supported Image FormatsRaster Design can support most single-image and multispectral file formats.For multispectral files, Raster Design can read most common formats, but canbest interpret metadata for the formats listed in the following table.
Image Formats Supported by Raster Design
Read OnlyRead-Write
DTED (page 388)DOQ (page 388)CALS (page 383)bitmap (BMP)(page 382)
ESRI Grid (page389)
ECW (page 388)GeoTIFF (page390)
DEM (page 387)
About AutoCAD Raster Design dialog box | 5
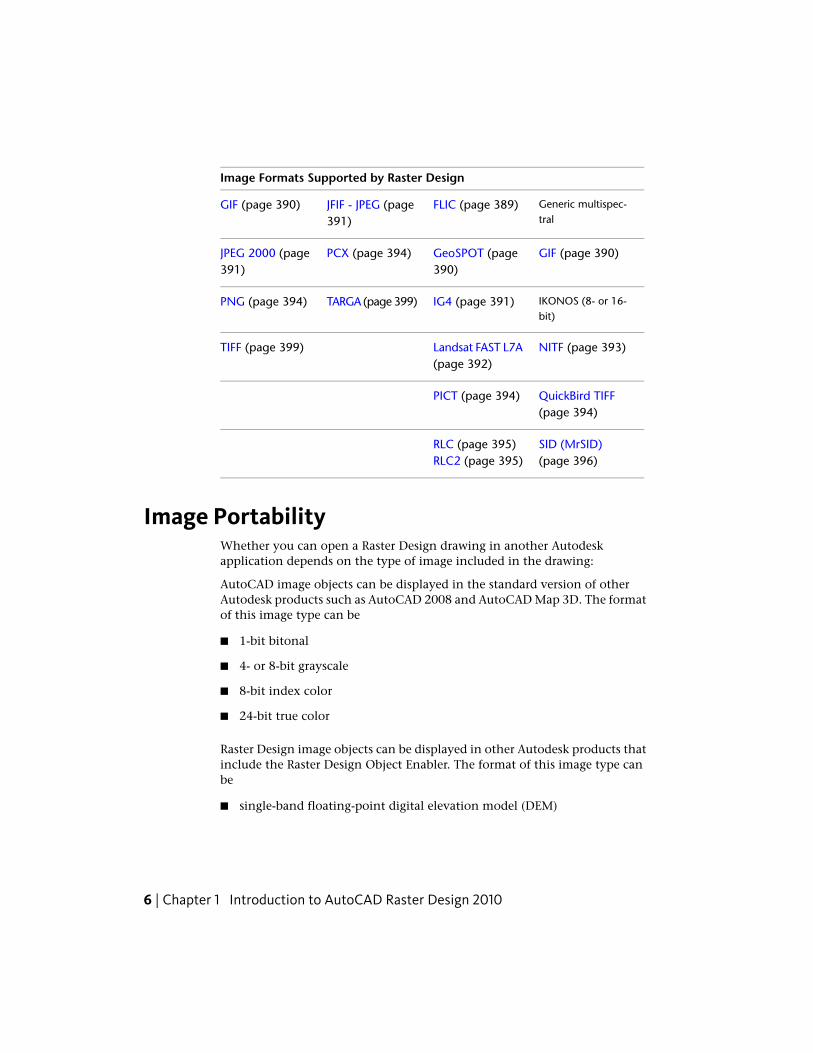
Image Formats Supported by Raster Design
Generic multispec-tral
FLIC (page 389)JFIF - JPEG (page391)
GIF (page 390)
GIF (page 390)GeoSPOT (page390)
PCX (page 394)JPEG 2000 (page391)
IKONOS (8- or 16-bit)
IG4 (page 391)TARGA (page 399)PNG (page 394)
NITF (page 393)Landsat FAST L7A(page 392)
TIFF (page 399)
QuickBird TIFF(page 394)
PICT (page 394)
SID (MrSID)(page 396)
RLC (page 395)RLC2 (page 395)
Image PortabilityWhether you can open a Raster Design drawing in another Autodeskapplication depends on the type of image included in the drawing:
AutoCAD image objects can be displayed in the standard version of otherAutodesk products such as AutoCAD 2008 and AutoCAD Map 3D. The formatof this image type can be
■ 1-bit bitonal
■ 4- or 8-bit grayscale
■ 8-bit index color
■ 24-bit true color
Raster Design image objects can be displayed in other Autodesk products thatinclude the Raster Design Object Enabler. The format of this image type canbe
■ single-band floating-point digital elevation model (DEM)
6 | Chapter 1 Introduction to AutoCAD Raster Design 2010

■ 16- or 32-bit single-band integer
■ 8- or 16-bit multiband multispectral
The Raster Design Object Enabler can be installed from the main Install pageof the application CD for AutoCAD Raster Design, or from the Autodesk ObjectEnabler website (http://www.autodesk.com/aecobjenabler). The followingapplications support the Raster Design Object Enabler:
■ AutoCAD® 2010
■ AutoCAD® Architectural Desktop 2010
■ AutoCAD® Civil 3D® 2010
■ AutoCAD® Electrical 2010
■ AutoCAD® Map 3D 2010
■ AutoCAD® Mechanical 2010
■ AutoCAD® MDE 2010
■ AutoCAD® Topobase 2010
AutoCAD Raster Design HistoryAutoCAD Raster Design was formerly known as CAD Overlay.
Raster Design History
CAD Overlay 1.0 was introduced in 1988 for AutoCAD Release 2.6. CADOverlay was the first application to display raster in AutoCAD for “heads updigitizing” of scanned drawings.
CAD Overlay ESP, introduced in 1989, allowed editing and plotting of scannedimages. This release was the first to be available in French, German and Italianversions. A Japanese version followed in 1991.
CAD Overlay GS, introduced in 1991, supported grayscale imagery in AutoCAD.
CAD Overlay ESP 4.0 was introduced in 1992 for AutoCAD Release 12.
CAD Overlay GSX was introduced in 1993, and in 1994 the LFX (line followingextension) function broke new ground in raster to vector conversion.
AutoCAD Raster Design History | 7

CAD Overlay S7.5 shipped in 1996, the first ObjectARX application thatsupported AutoCAD Release 13c4. This release combined the functionality ofESP, LFX, and GSX.
CAD Overlay S8 and Autodesk CAD Overlay Release 14 were introducedworldwide in 1997.
CAD Overlay 14.01, introduced in 1998, was the first AEC Product to becomeObject ARX compliant, and also introduced the first ActiveX interface in CADOverlay, which adds the ability to customize CAD Overlay through theAutoCAD Visual Basic Editor.
CAD Overlay 2000, introduced in 1999 as part of the Design 2000 family,focused on raster editing enhancements.
CAD Overlay 2000i, introduced in 2000, focused on vectorizationenhancements. Powerful “VTools” enhancements increased the speed andaccuracy of converting raster geometry to vector.
CAD Overlay 2002, introduced in 2001, was an AutoCAD 2002-enabled versionof CAD Overlay 2000i.
Raster Design 3, introduced in 2002, focused on improving the appearanceand standardizing the use of color images, and enabling the interactiveconversion of scanned text to AutoCAD text. Improved features also enabledthe correction of distortions in images with greater accuracy.
Raster Design 2004, introduced in 2003, was an AutoCAD 2004-enabledversion, including improved installation and licensing features, as well as TrueColor support.
Raster Design 2005, introduced in 2004, was based on AutoCAD 2005 andsupports a larger range of image types, including digital elevation models(DEM) and multispectral datatypes. Image analysis and display capabilitieswere improved.
Raster Design 2006, introduced in 2005, was based on AutoCAD 2006 andincluded new image capture functionality and new raster editing tools. Newwrite formats introduced in this release were GeoTIFF and JPEG 2000.
Raster Design 2007, introduced in 2006, was based on AutoCAD 2007 anddesigned for greater interoperability with Autodesk Map 3D. This releaseincluded support for new file formats ESRI GRID and DTED.
Raster Design 2008, introduced in 2007, was based on AutoCAD 2008.
Raster Design 2009, introduced in 2008, was based on AutoCAD 2009.
8 | Chapter 1 Introduction to AutoCAD Raster Design 2010

Inserting and CorrelatingImages
Use the ProdNameShort insertion tools to insert images into AutoCAD drawings and assigncolor maps; use correlation tools to precisely position, scale, and rotate images.
Inserting ImagesYou can use ProdNameShort to insert images for many different supported imagetypes (page 399) and formats into an AutoCAD drawing.
You can insert images from local folders, network locations, or from the Internet.
ProdNameShort provides three ways to insert an image:
■ Use the Insert Image (page 338) dialog box to select the image, assign a colormap, and specify a correlation method. In this dialog box, you can alsopreview the image and information such as file type, color depth, density,and size. Shortcuts are provided to various file locations, includingBuzzsaw.com and a History folder, which displays the locations you haveused most recently.
■ Use the Image Data (page 332) view of the Image Manager toolspace to createanother insertion of an image that is already in the drawing. For moreinformation, see Creating Another Insertion of an Image (page 70).
■ Bypass the Insert Image dialog box by setting the AutoCAD FILEDIA variableto 0, which allows you to insert an image by typing an image file name onthe command line. This method is useful if you already have correlationdata stored with your images, or if you want to use an AutoLISP routine toautomatically insert images into your drawing.
2
9

When you use ProdNameShort to open image files from the Internet, theimage file you specify is downloaded to your computer and inserted into yourdrawing using the correlation method you select. Images downloaded froman HTTP site are opened as read-only files. You can edit the image and saveit locally. Images opened from FTP sites can be saved back to their originallocations.
NOTE When you insert a bitonal image, ProdNameShort looks for the foregroundcolor in the correlation source selected. If it cannot find the color information,then the foreground color defaults to the current color.
See also:
■ Correlating an Image During Insertion (page 21)
■ Inserting Images From GSX or ESP (page 256)
■ Assigning a Color Map to an Image (page 18)
Inserting Local Images Using the Insert Image DialogBox
Use the Insert Image dialog box to insert images from a folder on yourcomputer or from a source on the local area network.
After selecting the image, you can view information about the image, andspecify a correlation method.
See also:
■ Selecting an Image (page 79)
■ Assigning a Color Map to an Image (page 18)
■ Correlating an Image During Insertion (page 21)
■ Image Insertion Dialog Box (page 325)
To insert images from local sources
1 Click Image menu ➤ Insert.
10 | Chapter 2 Inserting and Correlating Images
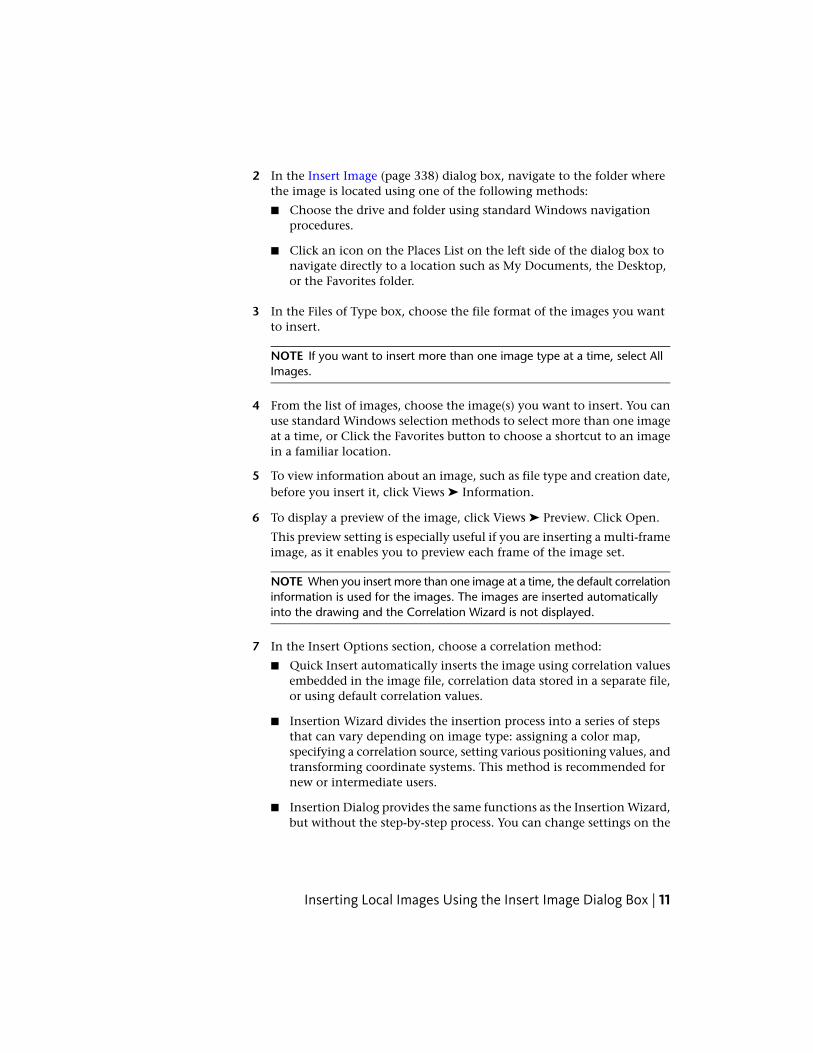
2 In the Insert Image (page 338) dialog box, navigate to the folder wherethe image is located using one of the following methods:
■ Choose the drive and folder using standard Windows navigationprocedures.
■ Click an icon on the Places List on the left side of the dialog box tonavigate directly to a location such as My Documents, the Desktop,or the Favorites folder.
3 In the Files of Type box, choose the file format of the images you wantto insert.
NOTE If you want to insert more than one image type at a time, select AllImages.
4 From the list of images, choose the image(s) you want to insert. You canuse standard Windows selection methods to select more than one imageat a time, or Click the Favorites button to choose a shortcut to an imagein a familiar location.
5 To view information about an image, such as file type and creation date,before you insert it, click Views ➤ Information.
6 To display a preview of the image, click Views ➤ Preview. Click Open.
This preview setting is especially useful if you are inserting a multi-frameimage, as it enables you to preview each frame of the image set.
NOTE When you insert more than one image at a time, the default correlationinformation is used for the images. The images are inserted automaticallyinto the drawing and the Correlation Wizard is not displayed.
7 In the Insert Options section, choose a correlation method:
■ Quick Insert automatically inserts the image using correlation valuesembedded in the image file, correlation data stored in a separate file,or using default correlation values.
■ Insertion Wizard divides the insertion process into a series of stepsthat can vary depending on image type: assigning a color map,specifying a correlation source, setting various positioning values, andtransforming coordinate systems. This method is recommended fornew or intermediate users.
■ Insertion Dialog provides the same functions as the Insertion Wizard,but without the step-by-step process. You can change settings on the
Inserting Local Images Using the Insert Image Dialog Box | 11

tabs of the dialog box in any order, then apply them to the image.This method is recommended for advanced users.
8 If you want to display only the frame (page 389) of the image you insert,select the Show Frames Only check box.
9 If you are inserting multiple images that you want to view as amultispectral set, select Treat as Multispectral.
10 To zoom to the extents of the image(s) you insert after correlation, selectZoom to Image(s).
11 After configuring the insert options, select the image or images to insert.
12 If you are inserting a multi-frame image, under Multi-frame Options,specify whether to insert only the first frame, all frames, or a selection offrames. If you choose the latter, you will see the Multi-frame Select DialogBox (page 341) after you click Open.
13 Click Open to insert the image or images.
Quick Reference
Menu
Image ➤ Insert
Raster Design Toolbar
Command Line
iinsert
Dialog Box
Insert Image Dialog Box (page 338)
Inserting an Image from the Internet Using the InsertImage Dialog Box
Use the Insert Image dialog box to insert an image file from the Internet.
12 | Chapter 2 Inserting and Correlating Images
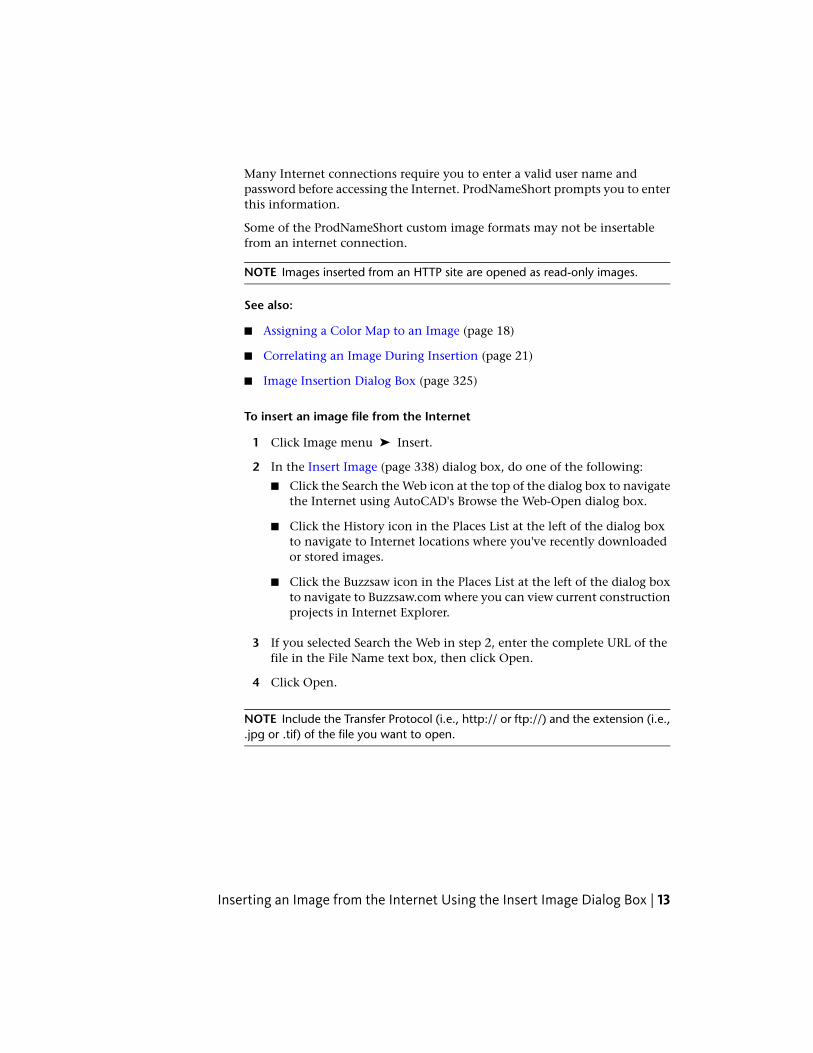
Many Internet connections require you to enter a valid user name andpassword before accessing the Internet. ProdNameShort prompts you to enterthis information.
Some of the ProdNameShort custom image formats may not be insertablefrom an internet connection.
NOTE Images inserted from an HTTP site are opened as read-only images.
See also:
■ Assigning a Color Map to an Image (page 18)
■ Correlating an Image During Insertion (page 21)
■ Image Insertion Dialog Box (page 325)
To insert an image file from the Internet
1 Click Image menu ➤ Insert.
2 In the Insert Image (page 338) dialog box, do one of the following:
■ Click the Search the Web icon at the top of the dialog box to navigatethe Internet using AutoCAD's Browse the Web-Open dialog box.
■ Click the History icon in the Places List at the left of the dialog boxto navigate to Internet locations where you've recently downloadedor stored images.
■ Click the Buzzsaw icon in the Places List at the left of the dialog boxto navigate to Buzzsaw.com where you can view current constructionprojects in Internet Explorer.
3 If you selected Search the Web in step 2, enter the complete URL of thefile in the File Name text box, then click Open.
4 Click Open.
NOTE Include the Transfer Protocol (i.e., http:// or ftp://) and the extension (i.e.,.jpg or .tif) of the file you want to open.
Inserting an Image from the Internet Using the Insert Image Dialog Box | 13

Quick Reference
Menu
Image ➤ Insert
Raster Design Toolbar
Command Line
iinsert
Dialog Box
Insert Image Dialog Box (page 338)
Inserting an Image from an FTP Site Using the InsertImage Dialog Box
Use the Insert Image dialog box to insert an image file from an FTP site onthe Internet.
Unlike images from HTTP sites, images inserted from FTP sites can be savedback to their original location.
See also:
■ Assigning a Color Map to an Image (page 18)
■ Correlating an Image During Insertion (page 21)
■ Image Insertion Dialog Box (page 325)
To insert an image file from an FTP site
1 Click Image menu ➤ Insert.
2 In the Insert Image (page 338) dialog box, click the FTP icon in the PlacesList.
3 Click Tools menu ➤ Add/Modify FTP Locations.
The Add/Modify FTP Locations dialog box appears.
4 In the Name of FTP Site text box, type the name of the FTP server.
14 | Chapter 2 Inserting and Correlating Images

5 In the Log On As section, choose either Anonymous or User.
If you select the User option, enter a username in the combo box.
6 Enter a password in the Password text box.
7 Click Add.
8 Click OK to return to the Insert Image dialog box.
9 Navigate to the FTP site using standard Windows navigation methods.
10 On the list of images, choose the image(s) that you want to insert. Youcan use standard Windows selection methods to select more than oneimage at a time. The selected image(s) are listed in the File Name box.
NOTE If more than one kind of file with the same name is present in thefolder, do not type in a filename with no extension.
11 In the Insert Options section, choose a correlation method:
■ Quick Insert automatically inserts the image using correlation valuesembedded in the image file, correlation data stored in a separate file,or using default correlation values.
■ Insertion Wizard divides the insertion process into a series of stepsthat can vary depending on image type: assigning a color map,specifying a correlation source, setting various positioning values, andtransforming coordinate systems. This method is recommended fornew or intermediate users.
■ Insertion Wizard divides the insertion process into a series of stepsthat can vary depending on image type: specifying a correlation source,setting various positioning values. This method is recommended fornew or intermediate users.
■ Insertion Dialog provides the same functions as the Insertion Wizard,but without the step-by-step process. You can change settings on thetabs of the dialog box in any order, then apply them to the image.This method is recommended for advanced users.
12 If you want to display only the frame of the image you insert, select theShow Frames Only check box.
13 To zoom to the extents of the image(s) you insert after correlation, selectthe Zoom to Image(s) check box.
Inserting an Image from an FTP Site Using the Insert Image Dialog Box | 15

14 To view information about an image before you insert it, choose ViewsInformation to view information such as file type and creation date.
15 To display a preview of the image, click Views ➤ Preview. Click Open.
NOTE When you insert more than one image at a time, the default correlationinformation is used for the images. The images are inserted automaticallyinto the drawing and the Insertion Wizard is not displayed.
Quick Reference
Menu
Image ➤ Insert
Raster Design Toolbar
Command Line
iinsert
Dialog Box
Insert Image Dialog Box (page 338)
Inserting an Image Using the Command LineYou can bypass the Insert Image dialog box by using the command line.
Setting the AutoCAD FILEDIA variable to 0 allows you to insert an image bytyping an image file name on the command line. This method is useful if youalready have correlation data stored with your images, or if you want to usean AutoLISP routine to automatically insert images into your drawing.
When ProdNameShort locates the image, it inserts it into your drawing usingcorrelation data stored with the image. If ProdNameShort cannot find acorrelation file, the image is inserted using the information you defined inthe Raster Design Options dialog box. For more information, see Image DefaultsTab (ProductNameShort Options Dialog Box) (page 351). ProdNameShortsearches for a correlation source using the following order:
■ Resource file
16 | Chapter 2 Inserting and Correlating Images
■ World file
■ Tab file
■ Image file
For more information about the AutoCAD FILEDIA variable, see the AutoCADonline Help or printed User’s Guide.
See also:
■ Assigning a Color Map to an Image (page 18)
■ Correlating an Image During Insertion (page 21)
■ Image Insertion Dialog Box (page 325)
To insert an image when FILEDIA is <0>
1 Click Image menu ➤ Insert.
2 Do one of the following:
■ Type the name of the image you want to insert and its file extension.Example: contour.rlcIf you do not specify a path to the image, ProdNameShort searchesfor the image using the Project Files Search Path configured in theAutoCAD Preferences dialog box. For more information, open themain Help window for Autodesk Civil 3D or Land Desktop, then selectAutoCAD Help ➤ User’s Guide ➤ The User Interface ➤ Customizethe Drawing Environment ➤ Set Interface Options.
■ Type the path name of the image, the image name, and the fileextension. Example: c:\AutoCAD 2000\co\sample\contour.rlcProdNameShort searches for the image in the path that you specify.If ProdNameShort cannot locate the image in this path, it searchesfor the image using the AutoCAD Project Files Search Path.
NOTE When FILEDIA is set to 0, you can type a tilde (~) to display the InsertImage dialog box if needed.
Inserting an Image Using the Command Line | 17

Adding Image Sources to FavoritesYou can create shortcuts to provide quick access to the files or folders thatcontain your images.
When you select a folder, drawing, or other file and choose Add to Favorites,a shortcut to that item is added to the Favorites folder in the Windows system.The original file or folder doesn't move. The shortcuts you create usingAutoCAD DesignCenter can also be stored in Favorites.
A shortcut relies on a specific path, so it fails if the destination file or folderis moved or renamed. In that case, you need to create a new shortcut.
To add image sources to Favorites
1 Click Image menu ➤ Insert.
The Insert Image (page 338) dialog box is displayed.
2 Do one of the following:
■ If the source is a file, folder, or Internet location, in the Insert Imagedialog box, select the item, then click Tools menu ➤ Add to Favorites.
■ If the source consists of DesignCenter palette contents, right-click thepalette background and choose Add to Favorites. The container of thepalette contents is added to the Favorites folder.
Quick Reference
Menu
Tools ➤ Add to Favorites
Dialog Box
Insert Image Dialog Box (page 338)
Assigning a Color Map to an ImageYou typically assign a color map to an image at the time of insertion, but youcan change the color map at any time, using the Image Manager toolspace.
Color maps apply primarily to digital elevation models (DEM) and multispectralimages. ProdNameShort automatically assigns color maps to traditionalbitmaps, tagged image files (TIFF) and other displayed images at the time of
18 | Chapter 2 Inserting and Correlating Images

insertion. When a DEM or multispectral image is inserted, ProdNameShortdisplays the appropriate dialog for configuring a color map.
DEM files use a palette color map, which has multiple settings that areconfigured in the Palette Color Map Definition Dialog Box (page 345). Palettecolor maps can be saved for reuse with other files.
NOTE To remove all unused color maps from a drawing, type ipurgecm at thecommand line.
Multispectral files use a band assignment color map, which simply assignsdata bands to color channels. This type of color map is not saved, as it is quiteeasy to configure in the process of image insertion.
See also:
■ Assign Color Map Tab (Image Insertion Dialog Box) (page 325)
To assign a color map to an image
➤ On the Color Map Assignment dialog box, do one of the following:
■ For a palette color map, use the drop-down list to select a color map.If you want to edit, copy, or create a new color map, click theappropriate button to the right of the list, then use the Palette ColorMap Definition (page 345) dialog box to make changes. If you do notwant to insert the image into the display, clear the Insert Into Displaycheck box.
■ For a band assignment color map, use the three drop-down lists tospecify a data band for each color channel. If you want to turn offone or more of the colors, clear the appropriate check boxes. If youdo not want to insert the image into the display, clear the Insert IntoDisplay check box.
Quick Reference
Menu
Click Image ➤ Insert. Then select Insertion Wizard or Insertion Dialog
Command Line
iinsert
Assigning a Color Map to an Image | 19
Dialog Box
Assign Color Map Tab (Image Insertion Dialog Box) (page 325)
Creating New ImagesYou can create a new blank image for use with the image merge and vectormerge tools.
When you create a new image, you begin by defining an image frame in theNew Image (page 342) dialog box. After you have created a new image, youmust save it to create a link between the drawing and the image file.
To create a new image
1 Click Image menu ➤ New.
The New Image (page 342) dialog box is displayed.
NOTE If the Show New Image Dialog check box is cleared in the RasterDesign Options dialog box, on the New Image tab, then you can access thecommand line interface. For more information, see New Image Tab(ProductNameShort Options Dialog Box) (page 354).
2 Do one of the following to choose the AutoCAD properties of your image:
■ Type the X, Y, and Z coordinates of the lower left corner of the image,and values for scale and rotation.
■ Click Pick to select two points on the AutoCAD screen that are usedto define these properties.
3 In the Color Type area, select the color type of your new image, eitherBitonal, Grayscale, Indexed Color, or True Color.
4 In the Image Properties area, review the values for width, height, anddensity and modify them if required.
Specify width and height values using either image units (pixels) or surfaceunits (meters, feet, etc.). You can use the Dots Per drop-down list tochange surface units.
5 Click OK to close the dialog box and create the new image.
20 | Chapter 2 Inserting and Correlating Images

Quick Reference
Menu
Image ➤ New
Raster Design Toolbar
Command Line
inew
Dialog Box
New Image Dialog Box (page 342)
Correlating ImagesUse correlation procedures to precisely position, scale, and rotate an imagewithin an AutoCAD drawing.
You can correlate an image during or after insertion. For instance, when usingthe Insertion Wizard, correlation data can be read from the image or from afile associated with the image. After you have inserted the image, you maywant to rubbersheet the image to correct distortions that interfere with precisealignment of the image. Once you've aligned the image precisely, you canexport correlation data for use in other drawings.
See also:
■ Exporting Images (page 48)
■ Correlation Output Types (page 54)
Correlating an Image During InsertionYou can choose from three methods to provide correlation data duringinsertion.
■ Quick Insert automatically inserts the image using correlation valuesembedded in the image file, correlation data stored in a separate file, orusing default correlation values.
Correlating Images | 21

■ Insertion Wizard divides the insertion process into a series of steps thatcan vary depending on image type: assigning a color map, specifying acorrelation source, setting various positioning values, and transformingcoordinate systems. This method is recommended for new or intermediateusers.
■ Insertion Wizard divides the insertion process into a series of steps thatcan vary depending on image type: specifying a correlation source, settingvarious positioning values. This method is recommended for new orintermediate users.
■ Insertion Dialog provides the same functions as the Insertion Wizard, butwithout the step-by-step process. You can change settings on the tabs ofthe dialog box in any order, then apply them to the image. This methodis recommended for advanced users.
Using Quick InsertYou can use Quick Insert to perform automatic correlation during imageinsertion.
The Quick Insert option uses the correlation data stored with the image or inan associated file. ProdNameShort searches for a correlation data source usingthe following order:
1 Resource file
2 World file
3 Tab file
4 Image file
The highest order source is used to correlate the image after you click Openon the Insert Image dialog box. If ProdNameShort cannot find correlationdata stored with the image, the image is inserted using the settings definedon the Image Defaults (page 351) tab of the Raster Design Options dialog box.For example, geographical maps are often used not in true scale, but in 1:1scale. With ProdNameShort you can set the default value of the insertion pointto 0,0, the scale to 1:1, and the rotation to 0, then use the Quick Insert methodto make insertion quicker and more efficient.
22 | Chapter 2 Inserting and Correlating Images

To insert an image using Quick Insert
■ In the Insert Options section of the Insert Image (page 338) dialog box,choose Quick Insert.
Quick Reference
Menu
Image ➤ Insert
Raster Design Toolbar
Command Line
iinsert
Dialog Box
Insert Image Dialog Box (page 338)
Specifying Correlation SettingsYou can use either the Insertion Wizard or the Image Insertion (page 325) dialogbox to provide correlation settings at the time of image insertion.
The Insertion Wizard is recommended for new or intermediate ProdNameShortusers, as it walks you through the correlation settings in a logical sequence.The Image Insertion dialog box presents the same settings on several tabs soyou can review and modify the settings in any order.
The tabs are as follows, though you may see only three or four of them,depending on image type and application environment:
■ The Assign Color Map (page 325) tab is presented when inserting digitalelevation model (DEM) files or multispectral images, as you can choosevarious color map options before insertion.
■ The Source (page 326) tab displays correlation data from the currentcorrelation source for the image.
■ The Modify (page 327) tab displays the correlation values in fields that youcan modify to correlate the image.
Specifying Correlation Settings | 23

■ The Transform (page 329) tab is presented only if ProdNameShort is runningon a geographic application such as AutoCAD Map 3D. This tab is used totransform the coordinate system of an image.
■ The Insertion (page 328) tab displays the revised correlation values, reflectingany changes you made on the Modify and Transform tabs. Use this tab toreview the settings before insertion and to select a color for the imageframe or the foreground of a bitonal image.
To use the Insertion Wizard
1 In the Insert Options section of the Insert Image dialog box, chooseInsertion Wizard.
2 After you have chosen your insert option and image file name, clickOpen.
3 If applicable, choose a color map for the image.
4 On the Pick Correlation Source panel, select a correlation source andreview the displayed correlation settings.
For correlation sources other than Image Default and Image File, the fullpath for the listed source is displayed for you to verify that the propercorrelation file is being read. If you find that the desired correlation sourceis not available, you should cancel the insertion process and set thecorrelation path in the Raster Design Options (page 351) dialog box, orcopy the correlation file to a new folder.
5 Click Next. The Modify Correlation Values panel is displayed.
Modify correlation values
6 On the Modify (page 327) tab, in the Modify Correlation Values area, enterany required changes to the location of the insertion point, rotation, orscale.
The insertion point is the lower left corner of the image in the drawing.
The scale value represents the ratio of AutoCAD units to the scannedimage units. A scale factor greater than 1 enlarges the image; a value lessthan 1 shrinks the image.
7 Optionally choose new units of measurement from the Image Units list.
For example, if your image was scanned at 300 dpi, choose Inch as thedensity units. If density information was stored with the correlationsource you selected, you cannot change this value.
8 Click Next.
24 | Chapter 2 Inserting and Correlating Images

If the Transform panel is displayed, complete step 9 to 14; otherwise goto step 15.
Transform coordinate system
9 Compare the coordinate systems of the image and of the current drawing,as displayed on the Transform (page 329) panel. If the two coordinatesystems do not match, you should perform a coordinate transformationon the image to position it properly in the drawing.
10 To convert the image coordinate system, select the Transform to Drawing’sCoordinate System check box; otherwise, go to step 14. If you aretransforming the image, select the appropriate Transform Type:
■ True (pixel by pixel): produces the most accurate results.
■ 4-Point Rubbersheet: approximate transformation, most accurate nearthe control points.
■ 3-Point Affine: replicates the transformation performed by FDOConnect.
11 If known, enter the code for the image coordinate system, then go tostep 14.
12 Choose the coordinate system category used in your image from the listat the top of the dialog box.
13 Choose the coordinate system used in your image from the CoordinateSystems in Category list.
14 Click Next. The Insertion panel is displayed.
Change AutoCAD insertion values
15 Optionally, to change correlation values, do one of the following:
■ To specify numeric values, type coordinates in the X, Y, and Z boxesto identify the insertion point in the drawing, and type any requiredchanges to the rotation and scale values.
■ to specify the insertion point (lower left corner), rotation, and scaleon the screen, click the Pick button. The Pick button is dimmed if acoordinate transformation has been applied. For more information,go to Adjusting the Image Frame Before Insertion (page 27).The ProdNameShort Insertion Wizard is modeless, which means youcan leave the wizard open on your desktop and continue to grip-editthe image frame during correlation. Any grip editing changes that
Specifying Correlation Settings | 25

you make to the image frame are reflected immediately in the InsertionValues dialog box.
16 Optionally, to change the color of the image frame, under Color, clickSelect.
NOTE Inserting a bitonal image (page 382) changes the foreground color.When you insert a bitonal image, ProdNameShort first looks for the foregroundcolor in the correlation source specified. If it cannot find the color information,the foreground color defaults to current color.
17 Click Finish. The image is inserted into the drawing.
To use the Insertion dialog box
1 In the Insert Options section of the Insert Image dialog box, chooseInsertion dialog box.
2 After you have chosen your insert option and image file name, clickOpen.
3 In the Image Insertion dialog box, review and modify correlation dataon the available tabs.
It is recommended that you review and modify data on the tabs from leftto right: Assign Color Map, Source, Modify, Transform, then Insertion.Use the Source tab to see settings linked to the image, then modify thesettings as required on the Modify and Transform tabs, finally review theresults on the Insertion tab before inserting the image into the drawing.For more information about the settings on each tab, click the Helpbutton on the tab or use the following links:
■ Assign Color Map tab (page 325)
■ Source tab (page 326)
■ Modify tab (page 327)
■ Transform tab (page 329)
■ Insertion tab (page 328)
4 On the Insertion tab, click Finish. The image is inserted into the drawing.
26 | Chapter 2 Inserting and Correlating Images

Adjusting the Image Frame Before InsertionYou can manually or numerically adjust the frame size, scale, and rotationbefore inserting an image into a drawing.
This procedure is useful if you do not know the exact coordinates for theimage, but you have a general idea of the image location, size, and rotationangle.
As you draw the frame on screen, its size changes proportionally to retain theaspect ratio of the image.
To adjust the frame for the image you want to insert
1 On the Insertion Tab (Image Insertion Dialog Box) (page 328), click Pick.
The dialog box closes so you can select points on the screen.
2 Specify an insertion point.
You can also enter coordinates on the command line, or, if correlationdata is already specified, you can press Enter to accept the existingcoordinates.
An outline of the frame is displayed, reflecting the aspect ratio of theimage you are inserting.
3 Enter the rotation angle or move the cursor to define the rotation angle.
The Insertion tab displays the new coordinates, scale, and rotation.
4 Specify the second corner point to define the size of the frame.
NOTE You can type UNDO to undo each point, and then specify the pointsagain.
5 If you are using the Insertion dialog box, click Apply; if you are using theInsertion Wizard, click Finish.
The image is inserted onto the current AutoCAD layer, and its correlationdata is saved in the AutoCAD drawing. The next time you open thedrawing, the image is displayed.
NOTE You can select the frame and use grip(s) (page 390) or AutoCADcommands to size, move, or rotate the image while the Insertion Wizard isopen.
Adjusting the Image Frame Before Insertion | 27
Correlating an Image After InsertionYou can adjust the size and location of an image at any time after insertingit into a drawing.
For instance, you may need to correct distortions caused by scanning errors.There are several ways to ensure precise correlation of an inserted image:
■ Match points on an image to points in your drawing in order to scale orrotate a raster image.
■ Displace an image, to move it in reference to existing raster or vectorentities without scaling or rotating it.
■ Scale a raster image without rotating it.
■ Rubbersheet an image to eliminate distortion and stretch or shrink aportion of your image to align with selected control points.
Matching Image PointsYou can match points between two images or between an image and a vectordrawing to change the image scale and position.
The image size and orientation change to align the selected match points.
To match image points
1 Click Image menu ➤ Correlate ➤ Match.
2 Select one or more images to scale and rotate by clicking the image frames,then press Enter.
3 Specify the first source point on the selected image.
NOTE You can select a point on the image frame by using object snaps, oryou can select points on specific raster entities by using raster snaps.
4 Specify the destination point where you want the first source point tomove to.
5 Specify the second source point on the selected image.
6 Specify the destination point where you want the second source pointto move to.
28 | Chapter 2 Inserting and Correlating Images

NOTE If you are using AutoCAD Land Desktop, you can substitute COGOpoints by typing .p, .g, or .n when ProdNameShort prompts you to enterdestination points. For more information, see Snapping to COGO Points(page 82).
Quick Reference
Menu
Image ➤ Correlate ➤ Match
Raster Design Toolbar
Command Line
imatch
Moving an ImageYou can move an image without rotating or scaling it so that a base point onthe image matches with a destination point on an existing vector entity orraster image.
To move an image
1 Click Image menu ➤ Correlate ➤ Displace.
2 Select an image to move by clicking its image frame.
3 Select the base point on the image you want to move.
NOTE You can select a point on the image frame by using object snaps, oryou can select points on specific raster entities by using raster snaps.
4 Select the destination point for the image. This can be any AutoCADpoint, a point on an existing vector, or a point on a raster image.
Moving an Image | 29

Quick Reference
Menu
Image ➤ Correlate ➤ Displace
Raster Design Toolbar
Command Line
idisplace
Scaling an ImageYou can match the scale of an image to the scale of a vector drawing or anotherimage.
To scale an image
1 Click Image menu ➤ Correlate ➤ Scale.
2 Select an image to scale by clicking its image frame.
3 Select a base point for the scale. This point acts as an anchor point forthe image as its dimensions are scaled.
NOTE You can select a point on the image frame by using object snaps, oryou can select points on specific raster entities by using raster snaps.
4 Define the source distance factor by typing a value or by selecting twopoints to define the distance.
For example, if you want to match the scale of one image to anotherimage, select two points on the source image that you want to matchwith points on the image that is correctly scaled.
5 Define the destination distance by typing a value or by picking two pointsto define the distance.
For example, select two points on the correctly scaled image that youwant the source image to align with. If the source and destination distancefactors are the same value, then the image will not be scaled.
30 | Chapter 2 Inserting and Correlating Images

NOTE If you want to match the image rotation, use the Deskew option. Ifyou want to move or scale the image as well as rotate the image, use theMatch option. For more information, see Snapping to COGO Points (page82) and Correlating an Image After Insertion (page 28).
Quick Reference
Menu
Image ➤ Correlate ➤ Scale
Raster Design Toolbar
Command Line
iscale
Rubbersheeting an ImageYou can transform an image to correct distortions in distance and shape.
Image distortions can sometimes prevent you from aligning an image in yourdrawing. For example, correlation by scanning or matching may not work onaerial photographs that include distortions caused by parallax, unevenness ofterrain, or lens distortion. In these cases, you can use rubbersheeting topermanently correct most of the distortions in an image.
Rubbersheeting uses a set of matched control points, consisting of sourcepoints in the image and destination points in the drawing. You can specifythese points by picking them directly in the drawing, or by establishing a gridof destination points, to which you match source points. Once these controlpoints are established, the image is transformed so that the points align asclosely as possible.
NOTE If you are using AutoCAD Land Desktop, you can substitute COGO pointsby typing .p, .g, or .n when ProdNameShort prompts you to enter destinationpoints. For more information, see Snapping to COGO Points (page 82).
Rubbersheeting an Image | 31

There are two transformation methods you can use to correct your image:
■ The Triangular method draws a series of triangles between the controlpoints, then applies the transformation to those areas. This process usesthe Delaunay triangulation method in which no point lies inside the circlethat includes the vertices of any triangle. Each triangular area is transformedseparately, so this method is much more accurate than the polynomialmethod, but can result in the loss of some image data. The area to betransformed, called the convex hull, is defined by the outermost destinationpoints. Image data outside the convex hull is discarded. You can see whichportion of the image will be transformed using the Preview. If you wantto preserve more of the image data, place control points near the extentsof the image.
■ The Polynomial method transforms the entire image to match, as nearlyas possible, the control points you specify. Unlike the triangular method,however, the actual destination points are not always located at thedestination points you specified. The resulting positional error is expressedas a numerical value in the Rubbersheet dialog box, and is displayedgraphically on the image after the control points have been entered. Asshown in the following figure, the error for each point is measured as adistance from the intended destination point to the actual destinationpoint.
The error is calculated using the following distance formula:
The total RMS (Root Mean Square) error of the image is calculated using thefollowing formula:
32 | Chapter 2 Inserting and Correlating Images

By adjusting the polynomial degree, you can increase the accuracy of thematching points. However, reducing the error can create a higher degree ofwarping in the image as it is transformed to match the control points.Therefore, you should use the lowest possible polynomial degree that will stillgive you an acceptable result. Higher polynomial degrees result in smallererrors at the control points, but more warping at locations away from thecontrol points.
The following table lists the maximum polynomial degrees possible for rangesof control points. For example, if you select 12 control points, the maximumpolynomial degree you can select is 3. When the minimum number of controlpoints is used for a particular polynomial degree, the reported errors at thecontrol points will be zero.
Maximum Polynomial De-grees
Number of Control Points
13-5
26-9
310-14
415-20
521-27
ProdNameShort does not limit the number of control points you can use.
The Preview tool allows you to see the extents of the transformed image beforeyou actually apply the changes. The convex hull of destination points isdisplayed in red, while the convex hull of source points is shown in blue.
Using four points to rubbersheet (e.g., four corners of an image) usually resultsin error at these points. In some applications, such as when rubbersheetedimages will be tiled, this error may be unacceptable. To eliminate this error,you can change the polynomial equation so that a zero error condition resultsfrom the use of four points rather than three points. This change is made inthe system registry. For complete instructions, go to the ProdNameShortSupport website (http://www.autodesk.com/rasterdesign-support) and search onthe term “4 point rubbersheet”.
Rubbersheeting an Image | 33
NOTE Rubbersheeting is best suited for making minor transformations to animage. For best results, start with a comprehensive and accurate network of surveycontrol points, then use match and scale before rubbersheeting to get the imageas close to the desired results as possible. It is also helpful to get a good spread ofthe control points over the entire image. Where you don't have control points,you can specify anchor points.
TIP If you prefer to use the command line to rubbersheet your images, type-irsheet.
NOTE Use the match feature to get the image as close as possible to the desiredresult before you begin rubbersheeting.
To rubbersheet an image
1 Click Image menu ➤ Correlate ➤ Rubbersheet.
2 Select the image to rubbersheet.
NOTE If there is only one image in the current drawing, that image isautomatically selected.
3 On the Rubbersheet dialog box, select a method: Triangular or Polynomial.
4 Choose one of the following rubbersheeting methods:
■ Manually add control points by picking directly from the image.Follow steps 5 to 8.
■ Create a grid of destination points to which you can match sourcepoints. Follow steps 9 to 15.
■ Import a list of saved control points by clicking the Import buttonand choosing the .txt file from the Open dialog box.
NOTE When you click OK, Rubbersheet automatically saves the last controlpoints you enter to a file named LASTRS.txt in your Temp folder.
The Rubbersheet dialog box displays the exact coordinates of each sourcepoint and destination point, and the amount of error (if any).
Pick control points
5 Click the Add Points button.
34 | Chapter 2 Inserting and Correlating Images

The Rubbersheet dialog box disappears and ProdNameShort prompts youto select the first source point. You must select at least three pairs ofsource points and destination points.
6 Select the first source point for the first control point on the image.
NOTE You can select points on specific raster entities by using raster snaps.
7 Do one of the following:
■ Specify the destination point to which the source point should bemoved.
■ Type a to anchor the selected point where it is.
■ Type u to undo the point and select the point again.
NOTE If you are using AutoCAD Land Desktop, you can substitute COGOpoints by typing .p, .g, or .n when ProdNameShort prompts you to enterdestination points. For more information, see Snapping to COGO Points(page 82).
8 Select at least three more pairs of source and destination points, and thenpress Enter to return to the Rubbersheet dialog box. Go to step 16.
9 Click the Grid Points button.
The Rubbersheet dialog box disappears and the Grid Parameters dialogbox appears.
10 In the Points section, choose how many rows and columns of points youwant to comprise the grid.
The total number of points in the grid is displayed at the bottom of thePoints section.
11 In the Grid section, enter the X and Y origins of the grid, or click the Pickbutton to choose the grid origin directly from the drawing (pressing Enterto return to the Grid Parameters dialog box).
12 In the Cell section, enter the X and Y sizes to determine the distancebetween columns and rows (respectively), or click the Pick button to drawa two-point rectangle representing the cell size directly in the drawing(pressing Enter to return to the Grid Parameters dialog box).
13 Click the Preview button to see a representation of the grid in the drawing(pressing Enter to return to the Grid Parameters dialog box).
Rubbersheeting an Image | 35

14 Click the Add Points button to match source points to the grid ofdestination points.
The Grid Parameters dialog box disappears and ProdNameShortautomatically pans to the first destination point.
NOTE You can select points on specific raster entities by using raster snaps.
15 Do one of the following:
■ Click to enter a corresponding source point for the current destinationpoint.
■ Type a to anchor the selected point where it is.
■ Type s to skip to the next destination point. ProdNameShort willreturn to this point when the other destination points have beenmatched to source points.
■ Type u to undo the point and select the point again.ProdNameShort automatically pans to the next point until all of thedestination points have been matched to source points.
16 If you selected Polynomial as the transformation method, and you enteredsix or more control points, you can adjust the polynomial Degree value.
This decreases error by increasing the degree to which an image can betransformed in order to match control points.
NOTE It is a good idea to use the lowest possible polynomial degree thatwill still give you an acceptable result. Higher polynomial degrees result insmaller errors at the control points, but also result in more warping at placeswhere there are no control points.
17 If you want to view a specific point, select that point from the list ofcontrol points, and then click the Zoom To button to view the point inthe drawing.
18 If you want to adjust a specific point, select that point from the list ofcontrol points, and then click the Repick button to enter a new controlpoint.
NOTE Select the Auto Zoom check box if you want AutoCAD to zoom in tothe selected control point when you use Repick.
36 | Chapter 2 Inserting and Correlating Images
19 If you want to remove a specific control point from the list, select thatpoint from the list of control points, and then click the Delete button.
20 Click the Preview button to see the extents of the transformed imagebefore you actually apply the changes. The convex hull of destinationpoints is displayed in red, while the convex hull of source points is shownin blue. Press Enter to return to the Rubbersheet dialog box.
21 Click the Export button to save your control point set to a .txt file forlater use.
NOTE You can import the saved control points to rubbersheet other images,such as superimposed images for the same drawing.
22 Click OK to perform the rubbersheet.
If you do not get the results you want, use the UNDO command and tryagain. Use the match feature to get the image as close as possible to thedesired result. For more information, see Undoing Edits to an Image (page81).
Quick Reference
Menu
Image ➤ Correlate ➤ Rubbersheet
Raster Design Toolbar
Command Line
irsheet
Dialog Box
Grid Parameters Dialog Box (page 315)
Rubbersheeting an Image | 37

38

Saving Images
Images are saved and managed separate from the drawings that contain them.
There are several ways to save images in Raster Design:
■ Click File ➤ Save/Save As. You are prompted to save each image that has changes, andthen you are prompted to save the drawing. You can click Save As to save the image witha new name, location, or file format.
■ Click Image menu ➤ Save. This command saves an image without saving the drawing.You can save more than one image at a time using this command.
■ Click Image menu ➤ Save As. This command saves an image to another file name, fileformat, or location, without saving the drawing.
■ Click Image menu ➤ Capture. This command saves a displayed image or image set as astandard AutoCAD image, for use with Raster Design or other programs.
■ Click Image menu ➤ Image Embed. This command saves a bitonal image within the hostdrawing, making it easier to manage for transmission and storage.
■ Click Image ➤ Export ➤ Image.This command saves an image to a different file format and allows you to save correlationdata separately in resource files and world files, for use with Raster Design or otherprograms. For more information, see Correlation Output Types (page 54).
Export is the only way to save images displayed from digital elevation models (DEM) andmultispectral data.
Saving an ImageAfter you edit an image, you can save it without saving your drawing.
You can save more than one image at a time using this method. The image willbe saved using the current name and format.
3
39

To save an image without saving your drawing
1 Click Image menu ➤ Save.
2 Select the image(s) you want to save.
NOTE You can also select the image first, and then right-click to display theshortcut menu where you can select Image ➤ Write ➤ Save.
3 Press Enter to complete the selection set.
The image(s) you selected are saved.
If any of the images you select are unnamed, then the Save As dialog boxis displayed so you can give the image a name, location, and file type.For more information, see Saving an Image to Another File Name, Type,or Location (page 43).
If your image does not save correctly, verify the following
■ No copies of the image exist in other drawings.
■ The URL address you specified is correct.
■ The read-only attribute is not set on your disk.
NOTE Raster Design uses Single Image Optimization (page 396) to speed up theediting commands.
Quick Reference
Menu
Image ➤ Save
Toolspace Shortcut Menu
Image Insertions view, image ➤ Write ➤ Save
Object Shortcut Menu
Image ➤ Write ➤ Save
Raster Design Toolbar
40 | Chapter 3 Saving Images

Command Line
isave
Saving Images with AutoCAD SaveYou can use the AutoCAD Save option to save the changes to your images.
The AutoCAD Save option is standard for most Autodesk products that useRaster Design. When you save in this way, the correlation data for the imagesis stored in the drawing. The next time you open the drawing, the images aredisplayed.
NOTE You can use the AutoCAD UNDO command to undo each edit that youmake, back to the last time you saved your drawing. The information pertainingto these edits is saved in a buffer file that can become quite large and reduce theperformance of your system. Saving your drawing and images clears this buffer.
To save an image using the AutoCAD Save command
1 Click File menu ➤ Save. Or exit AutoCAD.
You are prompted to save your drawing, and then you are promptedseparately for each image that has changed. The name of the image tobe saved is specified in the Save dialog box.
NOTE You are only prompted to save your image files if you have modifiedimage data. If you have changed only correlation information, then AutoCADsaves the correlation information but does not prompt you to save your imagefiles.
2 Click one of the following:
■ Save save the specified image and be prompted for the next image.This option saves the image using the same path, name, and format.
■ Save All saves all images with no further prompts.
■ Skip continues without saving the specified image and be promptedfor the next image.
■ Skip All continues without saving any more images.
■ Save As saves the specified image to another path, name, or file format.
■ Information displays information about the image before you save it.
Saving Images with AutoCAD Save | 41

For certain file formats, such as TIFF, you are prompted for theencoding and data organization methods you want to use. For moreinformation, see Encoding and Data Organization Methods (page 54).
Quick Reference
Menu
File ➤ Save
AutoCAD Toolbar
Dialog Box
Save As Dialog Box (page 366)
Embedding Images in a DrawingYou can save bitonal images within a drawing to simplify file management.
The regular Save operations save drawings and their associated images asseparate files, often in different directories. This structure can be difficult tomanage if you need to transfer drawings and images to other locations andretain the file relationships. Image embedding (iembed command) providesan alternative for bitonal images by saving them within the host drawing.
An embedded image can be removed from its host drawing and saved as anseparate file by using the Un-embed (iunembed) or Save As (isaveas) commands.
To save an image using the Image Embed command
1 In the drawing window, select the image or images you want to embed.
2 Click Image menu ➤ Image Embed.
3 Verify that the images are embedded in the drawing.
In Image Manager, “_EMBED” is added to the end of the image name foreach embedded image. If you need to open Image Manager, click Imagemenu ➤ Manage.
42 | Chapter 3 Saving Images

To un-embed an image
1 In Image Manager, select the image you want to un-embed.
2 Right-click and click Un-embed.
3 In the Save As dialog box, specify the name, location, and format for theimage.
Quick Reference
Menu
Image ➤ Image Embed
Command Line
iembed, iunembed
Image Manager
Right-click image ➤ Embed or Un-embed
Dialog Box
Save As
Saving an Image to Another File Name, Type, orLocation
You can save an image to another file name, file type, or location, withoutsaving the drawing file.
For example, if you have edited an image and you do not want to modify theoriginal image file, then you can save the edited image to a different file name.
If you have access to an FTP site, you can save your images to the Internet.For more information, see Saving an Image to an FTP Site (page 45).
The Save As option is also useful if you inserted a non-editable image file thatyou want to edit. This situation may occur if you inserted an image from aCD-ROM, for example, or if you inserted an image that has a file format thatRaster Design cannot write to.
NOTE Raster Design uses Single Image Optimization (page 396) to speed up theediting commands.
Saving an Image to Another File Name, Type, or Location | 43

To save an image to a different file name, file type, or location
1 Click Image menu ➤ Save As.
2 Select the image to save. You can save only one image at a time usingthis command.
The Save As (page 366) dialog box is displayed.
NOTE You can also select the image first, and then right-click to display theshortcut menu where you can select Image ➤ Write ➤ Save As.
3 You can enter a different file name in the File Name box.
4 There are two methods you can use to navigate to a new location to whichto save the image:
■ Choose the drive and folder using standard Windows navigationprocedures.
■ Choose a location from the Places List on the left side of the dialogbox to navigate directly to the My Documents folder (or the Personalfolder, depending on which operating system you are using), theDesktop, or the Favorites folder.
5 You can save the image to a different file type by selecting a file typefrom the Save File as Type list.
NOTE AutoCAD works best with certain image types. To optimizeperformance, export or save your images as tiled, compressed TIFFs wheneverpossible.
6 Click OK when you are ready to save the image.
For certain file formats, such as TIFF, you are prompted for the encodingand data organization methods you want to use. For more information,see Encoding and Data Organization Methods (page 54)
NOTE If you have saved using the save as command, multiple copies of theimage now exist, but all copies point to the new filename. For moreinformation, see Save As Dialog Box (page 366).
44 | Chapter 3 Saving Images

Quick Reference
Menu
Image ➤ Save As
Toolspace Shortcut Menu
Image ➤ Write ➤ Save As
Object Shortcut Menu
Image ➤ Write ➤ Save As
REM Toolbar
Command Line
isaveas
Dialog Box
Save As Dialog Box (page 366)
Saving an Image to an FTP SiteIf you have access to an FTP site, you can save your images to the Internet.
To save an image to an FTP site
1 Click Image menu ➤ Save As.
2 Select the image to save. You can only save one image at a time usingthis command.
The Save As (page 366) dialog box is displayed.
3 Click the FTP icon in the Places List.
4 Click Tools menu ➤ Add/Modify FTP Locations.
The Post to FTP Locations dialog box is displayed.
5 In the Name of FTP Site text box, enter the name of the FTP server.
6 In the Log On As section, select either Anonymous or User.
If you select the User option, enter a username in the combo box.
Saving an Image to an FTP Site | 45
7 Enter a password in the Password text box.
8 Click Add.
9 Click OK to return to the Save As dialog box.
10 Navigate the FTP site using standard Windows navigation methods.
11 You can enter a different file name in the File Name box.
12 You can save the image to a different file type by selecting a file typefrom the Save File as Type list.
13 Click OK when you are ready to save the image.
For certain file formats, such as TIFF, you are prompted for the encodingand data organization methods you want to use. For more information,see Encoding and Data Organization Methods (page 54)
NOTE If you have saved using the save as command, multiple copies of theimage now exist, but all copies point to the new filename. For moreinformation, see Save As Dialog Box (page 366).
Quick Reference
Menu
Image ➤ Save As
Toolspace Shortcut Menu
Image Insertions view, Insertion object ➤ Write ➤ Save As
Object Shortcut Menu
Image ➤ Write ➤ Save As
Raster Design Toolbar
Command Line
isaveas
Dialog Box
Save As Dialog Box (page 366)
46 | Chapter 3 Saving Images

Capturing an ImageYou can capture an image if it cannot be saved in the usual way, or if youwant to preserve a specific display for later use.
An image capture is like a photograph of the displayed image on your screen.It is particularly useful when you want to prepare images for a presentationor a report. For example, you can capture several displays of satellite data withdifferent color maps. Then you can edit these static images with regularAutodesk tools, and save them in a simpler format such as JPEG or TIFF.
The transparency setting in the source image is preserved in the capture. Forcomplex images from digital elevation models (DEM) or multispectral data,the capture is simplified to a true color image with an Image Adjust color map.
The transparency setting in the source image is preserved in the capture.
When used with AutoCAD Map 3D, Raster Design can capture data from alayer in Display Manager, which can include Feature Data Objects (FDO) andother imported data. In this type of capture, you have several options for thecapture, such as capturing the stylized display or the source data, selectingthe capture area, resolution, and type of coordinate transformation, ifapplicable.
To capture an image
1 Click Image menu ➤ Capture.
If you are using AutoCAD Map 3D and capturing a raster layer, the DisplayManager Raster Layer Capture Dialog Box (page 307) is displayed for youto specify capture parameters such as the data type, area, resolution, andtype of coordinate transformation.
The current image is captured and inserted into the display, directly ontop of the source image. The capture is also added to the top of the ImageManager tree.
2 If you want to save the capture with a different name, format, or location,select the capture, right-click and click Image menu ➤ Write ➤ Save As.
Quick Reference
Menu
Image ➤ Capture
Capturing an Image | 47
Command Line
icapture
Toolspace Shortcut Menu
Image Insertions view, Insertion object ➤ Capture
Object Shortcut Menu
Image ➤ Capture
Raster Design Toolbar
Command Line
icapture
Exporting ImagesUse Export commands to save an image to a different file format or to savecorrelation files for the image.
Exporting is the only way to save images displayed from digital elevationmodels (DEM) and multispectral data. These images are saved in GeoTIFFformat.
Use the options in the Export Options (page 313) dialog box to handle imagecorrelation data and rotation values, if applicable.
NOTE If you want to save an image to another file format, name, or location,without saving correlation information, then do not select a correlation outputtype, or use the Save As option instead. For more information, see Save As DialogBox (page 366).
Correlation files store insertion point, scale (page 396), rotation angle (page 395),and density (page 387) information for the image. GeoTIFF files can also includecoordinate system data. Depending on the file format you select, you can savethe correlation information to a resource file (page 395), a world file (page 400),or to the image file. Normally, these files are saved to the same location asthe image file. However, you can control this path on the Paths tab (page 355)of the Raster Design options dialog box. For more information, see CorrelationSearch Paths (page 247).
48 | Chapter 3 Saving Images

Correlation files store insertion point, scale (page 396), rotation angle (page 395),and density (page 387) information for the image. Depending on the file formatyou select, you can save the correlation information to a resource file (page395), a world file (page 400), or to the image file. Normally, these files are savedto the same location as the image file. However, you can control this path onthe Paths tab (page 355) of the Raster Design options dialog box. For moreinformation, see Correlation Search Paths (page 247).
If you want to export correlation as a world file without exporting theassociated image, you can use the iworldout command.
NOTE Raster Design uses Single Image Optimization (page 396) to speed up theediting commands.
For certain file formats, such as TIFF, you are prompted for the encoding anddata organization methods you want to use. For more information, seeEncoding and Data Organization Methods (page 54).
Exporting an ImageYou can export images in order to save them to new locations, file names, orfile types.
You can also save image correlation data as a separate file.
To export an image
1 Click Image menu ➤ Export ➤ Image.
2 Click the frame of the image you want to export.
The Export (page 311) dialog box is displayed.
3 In the Files Of Type box, select the desired format for the new image.
If you are exporting a DEM or multispectral image the type must beGeoTIFF.
NOTE AutoCAD works best with certain image types. To optimizeperformance, export or save your images in tiled compressed TIFF formatwhenever possible.
4 Optionally, to navigate to a new location to which to export the image,do one of the following:
■ Select the drive and folder using standard Windows navigationprocedures.
Exporting an Image | 49

■ Select a location from the Places List on the left side of the dialog boxto navigate directly to the My Documents folder (or the Personalfolder, depending on which operating system you are using), theDesktop, or the Favorites folder.
5 In either the File Name or Base Name box, enter a name for the imagefile or select a file name from the list.
NOTE You cannot export an image to a file name that is locked. For example,if one person loads image1.tif and locks the raster image file, then anotherperson can not export image2.tif to image1.tif because the first person hasa raster file lock for image1.tif. For more information about locking imagefiles, see Locking Method for Image Files (page 258).
6 Click Export.
7 In the Encoding Method (page 311) dialog box, specify whether tocompress the image, and if so, which encoding method to use. ClickNext.
8 In the Data Organization (page 307) dialog box, specify Tiled, Stripped,or Monolithic. Click Next.
9 In the Export Options (page 313) dialog box, specify the relationshipbetween the exported image and the drawing. Specify how to handleimage rotation, if applicable, and correlation data.
10 Do one of the following:
■ If a Finish button is displayed at the bottom of the screen, click thebutton to export the image.
■ If a Next button is displayed at the bottom of the screen, click thebutton to open the Coordinate System Assignment (page 305) dialogbox, where you can select a GeoTIFF coordinate system for theexported image.
Quick Reference
Menu
Image ➤ Export ➤ Image
50 | Chapter 3 Saving Images
Toolspace Shortcut Menu
Image Insertions view, Insertion object ➤ Write ➤ Export
Raster Design Toolbar
Command Line
iexport
Dialog Box
Export Dialog Box (page 311)
Exporting an Image to an FTP SiteIf you have access to an FTP site, you can export your images to the Internet.
To export an image to an FTP site
1 Click Image ➤ Export ➤ Image.
2 Select the image to export. You can export only one image at a time usingthis command.
NOTE You can also select the image first, and then right-click to display theshortcut menu where you can select Image ➤ Write ➤ Export.
3 In the Export Data (page 311) dialog box, click the FTP icon in the PlacesList.
4 Click Tools menu ➤ Add/Modify FTP Locations.
The Post To FTP Locations dialog box is displayed.
5 In the Name Of FTP Site text box, enter the name of the FTP server.
6 In the Log On As section, select either Anonymous or User.
If you select the User option, enter a username in the combo box.
7 Enter a password in the Password text box.
8 Click Add.
9 Click OK to return to the Export dialog box.
Exporting an Image to an FTP Site | 51
10 Navigate the FTP site using standard Windows navigation methods.
11 You can enter a different file name in the File Name box.
12 You can export the image to a different file type by selecting a file typefrom the Save File as Type list.
13 Click OK when you are ready to export the image.
For certain file formats, such as TIFF, you are prompted for the encodingand data organization methods you want to use. For more information,see Encoding and Data Organization Methods (page 54).
NOTE If you have saved using the Save As option, multiple copies of theimage now exist, but all copies point to the new filename. For moreinformation, see Save As Dialog Box (page 366).
Quick Reference
Menu
Image ➤ Export ➤ Image
Toolspace Shortcut Menu
Image Insertions view, Insertion object ➤ Write ➤ Export
REM Toolbar
Command Line
iexport
Dialog Box
Export Dialog Box (page 311)
Exporting a World FileYou can export the image correlation without exporting the entire image byusing the iworldout command to create a world file (page 400).
52 | Chapter 3 Saving Images

The resulting world file shares the same file name as the associated image, butthe extension ends in a “w” (for example, the world file for lakshor.tif islakshor.tfw).
NOTE Raster Design exports world files based on World coordinates and importsthem based on the current UCS.
To export a World File
1 Click Image menu ➤ Export ➤ World File.
2 Type a path to which to save the file, or press Enter to accept the defaultpath.
NOTE By default this command saves the world file to the same location as theimage file. However, you can control this path on the Paths tab of the Raster DesignOptions dialog box. For more information, see Correlation Search Paths (page247).
Quick Reference
Menu
Image ➤ Export ➤ World File
Toolspace Shortcut Menu
Image Insertions view, Insertion object ➤ Write ➤ Export
Raster Design Toolbar
Command Line
iexport
Dialog Box
Export Dialog Box (page 311)
Exporting a World File | 53
Correlation Output TypesDepending on what type of image you are exporting, you can choose fromamong some of the following correlation output file types:
■ Bitonal Images. Use to creates resource files compatible with Raster DesignESP version 7 (or higher).
■ Color or Grayscale Images. Use to creates resource files compatible withRaster Design 7.5 (or higher). You can save the correlation data externally,rather than in the drawing, so that you can use the same correlation datain another drawing.
■ World File. Use if you need to transfer the image to another program thatcan use a world file (page 400), such as a mapping program. You can use theiworldout command to export a world file without exporting the associatedimage.
■ Resource File. Use to share images with other Raster Design users, or forinserting the image into another drawing. A resource file has a .RESextension. You can create resource files for all image types.
■ Image File. Use with file types that can store correlation information withinthe image file. Image File is also a correlation output type option whenyou are saving an RLC image.
■ GeoTIFF. Use with TIFF files to store correlation information within theimage file.
NOTE Both Resource files and World files are saved to the path specified in theRaster Design Options dialog box. If no correlation search path is designated,Raster Design uses the folder where the image file is stored. For more information,see Correlation Search Paths (page 247).
Encoding and Data Organization MethodsWhen you export certain file formats, such as TIFF, you are prompted for theencoding and data organization methods you want to use. If you are uncertainabout which method to choose, then accept the default, which reflects howthe image was saved previously.
NOTE AutoCAD works best with certain image types. To optimize performance,export or save your images in tiled compressed TIFF format whenever possible.
54 | Chapter 3 Saving Images

To choose a method of data encoding (compression) and data organization
1 In the Encoding Method dialog box, choose an encoding method toreduce the image file size. If file size is not an issue, then select theUncompressed option.
NOTE If you are unsure which method to choose, then accept the default,which reflects how the image was saved previously.
2 Click Next to display the Data Organization dialog box. The dataorganization method affects how your image data is stored, regardless ofthe encoding method. Choose one of the following methods:
■ Monolithic stores all image data together (not recommended for largeimages).
■ Stripped stores the image data in strips.
■ Tiled stores the image data in tiles.
3 Click Finish to complete the process, or click Back to return to theEncoding Method page.
Encoding and Data Organization Methods | 55

56

Changing Image Properties
You can use the AutoCAD Properties window to specify image properties.
AutoCAD PropertiesIn the AutoCAD Properties window, you can specify image properties.
The properties are as follows:
■ Layer
■ Color
■ Linetype
■ Display options, including image transparency, visibility, brightness, contrast,and fade values
■ Geometry settings, such as X, Y, and Z position, rotation, width, height, andscale
When an image mask is selected, you can turn the mask on or off, turn imageframes on or off, and set properties of the images outside the mask.
You can also use the Properties window to obtain the following informationabout the image:
■ Name
■ Path (saved path)
■ File type and size
■ Dates when the image was created and last modified
■ Color depth and type
4
57

■ Pixel width and height
■ Edit status
If the image contains raster entity manipulation (REM) objects, you can usethe Properties window to see detailed specifications of these objects.
Image Display PropertiesYou can choose to hide or display images in your drawing to improve thesystem redraw time.
You can also hide/show and unload/reload images from the Image ManagerToolspace (page 330).
To change image display properties
1 Click the frame of the image(s) you want to change, thenright-click ➤ Properties.
TIP If you are zoomed in and cannot see the image frames, press Shift +left-click to select the image(s).
2 Click the Show Image property, then select Yes or No from the list.
3 Click the Show Clipped property, then select Yes or No from the list.
4 Close the Properties dialog box.
For more information on the Properties window, see the AutoCADCommand Reference in the AutoCAD Help or Users Guide.
Image Display QualityYou can display your images in high quality or draft quality.
High quality involves dithering the pixels so that the transitions between pixelsappear more gradual. Draft quality can speed up the performance of yoursystem, but may reduce the quality of some color and grayscale images onscreen.
To change the image display quality
1 Select an Image, then right-click ➤ Properties.
58 | Chapter 4 Changing Image Properties

2 Click the Quality Setting property, then select a new setting from the list:
■ High dithers the pixels. Color and shade differences between pixelsare blended for a more realistic appearance.
■ Draft does not dither the pixels. This setting is recommended forbitonal images, or whenever you want to see the pixel size.
NOTE The display quality setting affects only how the image is displayedon screen. It does not alter in any way the contents of the image file.
3 Close the Properties dialog box.
Image Frame DisplayYou can choose to display the image frame (page 391) above the images, behindthe images, or you can turn off the frames.
When frames are behind the images, you can still select an image by selectingthe frame. However, when you turn frames off, you cannot select an imageframe.
To change how image frames are displayed
1 Click the frame of the image(s) you want to change, thenright-click ➤ Properties.
NOTE If you are zoomed in and cannot see the image frames, press Shift +left-click to select the image(s).
2 Click the Frame Setting property, then select a setting from the list:
■ Frame above displays the frame above the image.
■ Frame below hides the frame behind the image, but you can still selectthe image by selecting the frame.
■ Frames off turns off the frames. If frames are turned off, you must usethe Shift + left-click select method to select an image.
NOTE If you use the Toggle Frames option to turn the frames off andthen turn them on again, the frames reappear above the image. For moreinformation, see Changing the Image Frame Visibility (page 242).
Image Frame Display | 59

3 Close the Properties dialog box.
Image LayerWhen you insert an image, it is inserted onto the current AutoCAD layer.However, you can move the image to another layer. The following layerproperties allow you to control image display, image editing, and image saving.
FunctionLayer Proper-ties
Turns images on and off. Images that are off are still regen-erated.
On/Off
When a layer is off, you can save an image to the layer, butyou cannot edit an image on that layer.
Saves the image. You cannot display or edit an image ona frozen layer. The system does not update a frozen layer.
Thaw/Freeze
Displays and saves an image on a locked layer. You cannotedit a locked layer.
Unlocked/Locked
A bitonal image can use the color of the layer. For moreinformation, see Foreground Color of a Bitonal Image (page61).
Color
TIP If you have multiple images on top of each other, and you do not want torub, crop, or mask all of the images, you can lock a layer containing an image youdo not want modified.
To move an image to a different layer
1 Click the frame of the image(s) you want to move to a different layer,then right-click ➤ Properties.
TIP If you are zoomed in and cannot see the image frames, press Shift +left-click to select the image(s).
2 Click the Layer property, then select a new layer from the list.
3 Close the Properties dialog box.
60 | Chapter 4 Changing Image Properties
For more information on the Properties window, see the AutoCAD CommandReference in the AutoCAD Help or Users Guide.
Linetype of an Image FrameYou can select a different AutoCAD linetype for an image frame.
To change the linetype of an image frame
1 Click the frame of the image(s) whose linetype you want to change, thenright-click ➤ Properties.
2 Click the Linetype property, then select a new linetype from the list.
3 Close the Properties dialog box.
For more information on the Properties window, see the AutoCADCommand Reference in the AutoCAD Help or Users Guide.
Foreground Color of a Bitonal ImageThe foreground color is used for the raster entities in a bitonal image.
The foreground color is also known as the color map of a bitonal image. Itcan be changed from the Image Manager toolspace, just like color maps forother image types.
You can select a color for the image from the current palette or have the imageuse the color of the AutoCAD layer it is on.
To change the foreground color of a bitonal image
1 Click the frame of the bitonal image(s) you want to change.
TIP If you are zoomed in and cannot see the image frames, press Shift +left-click to select the image(s).
2 Right-click, then choose Properties from the short-cut menu.
3 Click the Color property, then select a new color from the drop-downlist.
4 Close the Properties dialog box.
For more information on the Properties window, see the AutoCADCommand Reference in the AutoCAD Help or Users Guide.
Linetype of an Image Frame | 61

Quick Reference
Toolspace Shortcut Menu
From color map object ➤ Edit Color Map
Object Shortcut Menu
Properties, Color
Command Line
properties
Transparency Color of an ImageYou can make one color in each image transparent.
Making a color transparent is helpful if you want to see information that isdisplayed behind the image. In a bitonal image, the transparency color isalways the background color of the image. For grayscale and color images,you can choose the transparency color.
The transparency color is also used to replace data that is removed when youedit an image using the rub or crop commands. If transparency is turned onfor the image, the rubbed areas (or the slack space in a cropped image) becometransparent. For more information, see Cropping Images (page 144) andRemoving (Rubbing) Images (page 149).
If you merge two images, the transparency color that is used to fill the spacebetween the two images depends upon the display order you specify in theImage Manager Toolspace (page 330).To use the transparency color of the firstimage in the list for the fill color, click Image menu ➤ Merge ➤ Images.
Sometimes you may want to designate an unused color as the transparencycolor. For instance, when merging images, turning on transparency may makesome desirable pixels transparent. The rbackground command allows you todesignate an unused color in a grayscale image as the transparency color.Pixels with a value of 255 (white) are changed to a value of 254 (near white),then the transparency color is set to a value of 255. The resulting image willhave no pixels with a value of 255.
NOTE Changing the transparency color does not affect the color of the existingrubs and crops.
62 | Chapter 4 Changing Image Properties

To change the transparency color
1 Zoom in on the image so you can accurately select the color.
2 Select the image, then right-click ➤ Properties.
NOTE If you are zoomed so you cannot see the image frames, press Shift +left-click to select the image.
3 Click the Transparency Color property, then click the button in theproperty field.
The Transparency Color dialog box is displayed.
NOTE Selecting a color is necessary only for color and grayscale images. Tomake a bitonal image transparent, skip to step 7.
4 Click Select.
The cursor changes shape and the dialog box temporarily disappears sothat you can choose a color from the image.
5 Pick the desired color on the image, and click OK.
6 Click the Transparency property, then select Yes from the list to makethe color you just selected transparent.
If you want to use the color for rubbing and cropping but you also wantthe color displayed in the image, select No for Transparency.
NOTE Changing the transparency color does not affect the color of theexisting rubs and crops.
7 Close the Properties dialog box.
Unused Color for Transparent ColorThe rbackground command allows you to designate an unused color as thetransparency color.
This is especially useful for merging images in which the designatedtransparency color in one image may cause valuable pixels in the other imageto become transparent.
Unused Color for Transparent Color | 63

To designate an unused color as the transparency color
1 On the command line, enter rbackground.
2 Select the image or images that you want to change, and then press Enter.
NOTE You can also select your image or images before you use therbackground command.
64 | Chapter 4 Changing Image Properties

Managing Images andInsertions
Each instance of an image that you insert into a drawing is called an insertion. Each insertionis based on an image data definition. Changing the attributes of an insertion does not affectthe image data definition.
The Raster Design Image Manager (page 330) provides two views of the image data in a drawing:
■ The Image Insertions (page 331) view focuses mainly on the screen display; the object treeshows only image insertions and color maps.
■ The Image Data (page 332) view is more detailed, showing the data elements associatedwith an image.
Each view provides different shortcut menus for object types, and an item view that showsproperties of the insertions and data in tabular form. In the Image Insertions view, a buttonat the top of the toolspace toggles between the item view and the image preview.
Controlling the Image Manager ToolspaceYou should understand several controls to make the Image Manager work bestfor you.
For more information on the toolspace controls, see Image Manager (page 330).
Modifying the Item View LayoutFor some image data, you can choose which columns to display and changethe order of columns in the table.
The Image Manager item view is editable for object types such as the drawing,where the data display is a table of three or more columns. This format is more
5
65
common in the Image Data view than in the Image Insertions view. Someobject types, such as the color map show a two-column item view (Propertiesand Value) that is not editable.
To modify the layout of the Item View table
1 To display the Image Manager (page 330) toolspace, click Image ➤
Manage..
2 Choose either the Image Insertions or Image Data view, then click thedrawing name at the top of the tree.
3 In the tabular item view, click a column-head and drag it left or right inthe list to change the order of the columns.
4 Right-click a column head to see a menu where you can show or hidecolumns in the table.
Displayed column headings are checked. If you want to remove a columnfrom the display, clear the check mark for the column name.
5 Click a column head to sort the information in the table by that column.
6 Click and drag the edge of the dialog box to resize it.
NOTE You can also change the width of the columns. Just click on the linebetween column headings and drag it left or right. When you click Close,your changes to the column widths are saved and used the next time youopen the dialog box.
Copying Information to the ClipboardYou can transfer reference information about raster insertions or images toother applications.
Both views of the Image Manager toolspace display data about the images inthe drawing. Where this data is displayed in a table of three or more columns,you can transfer the data to other applications by copying the contents ofone or more selected rows to the Clipboard, then pasting it into the otherapplication window.
To copy item view data to the Clipboard
1 To display the Image Manager (page 330) toolspace, click Image ➤
Manage.
66 | Chapter 5 Managing Images and Insertions
2 Choose the row(s) you want to copy from the toolspace item view.
3 Right-click and click Copy to Clipboard.
4 Click Close.
Managing Image Display and DataYou can arrange the images within a drawing, removing or restoring them,and changing their saved location.
Multiple insertions of an image can show different views of the data.
This is especially useful with multispectral and digital elevation model (DEM)data. For example, you could have one DEM insertion with a color map thatshows elevation bands and another insertion that shows ground slopes.
The Image Insertions (page 331) view of the Image Manager toolspace isespecially useful for zooming to an image, changing image display order, andediting color maps. You can change the attributes of an insertion, withoutaffecting the image source data.
The Image Data (page 332) view is useful for creating new image insertions andmanaging the image data in your drawing.
See also:
■ Embedding Images in a Drawing (page 42)
Zooming to an ImageYou can use the Image Manager toolspace to zoom to the extents of one ormore insertions.
If you can see the frame of an image, you can also zoom to it by right-clickingthe frame and selecting Image ➤ Zoom To. This is especially useful if you arezoomed in close and want to zoom out to see the complete image.
To zoom to an image
1 To display the Image Manager (page 330) toolspace, click Image ➤
Manage..
2 Click the Image Insertions (page 331) view.
Managing Image Display and Data | 67

3 Click the name of the insertion or insertions you want to see, thenright-click and click Zoom To.
Quick Reference
Toolspace Shortcut Menu
Image Insertions view: right-click image name ➤ Zoom To
Object Shortcut Menu
Right-click image frame ➤ Image ➤ Zoom To
Changing the Color Map of an ImageYou can change the color map to modify the appearance and the type of datadisplayed in the image.
The complexity of this procedure varies with color map type, as detailed inthe following table.
Color Map Editing ProcessColor Map Type
Use AutoCAD Select Color dialog to choose foregroundcolor
Bitonal
Use AutoCAD Image Adjust dialog to set image brightness,contrast, and fade levels
Image Adjust
Use Palette Assignment Color Map (page 345) dialog tochoose or edit a palette color map
Palette
Use Band Assignment Color Map (page 301) dialog to assignimage bands to color channels
Band Assignment
NOTE To remove all unused color maps from a drawing, type ipurgecm at thecommand line.
See also:
■ Adding a Visual Elevation Key to a DEM Image (page 69)
■ Creating Another Insertion of an Image (page 70)
68 | Chapter 5 Managing Images and Insertions

■ Adjusting Images with the Histogram (page 92)
To change the color map of an image
1 To display the Image Manager (page 330) toolspace, click Image ➤
Manage..
2 Click the Image Insertions (page 331) view.
3 Click the image insertion for which you want to change the color map,right-click and click Edit Color Map. Depending on image type, theapplicable dialog box opens.
NOTE If you edit an existing palette color map that is used by several imagesin the drawing, the changes will affect all of the images. To affect only oneimage, you can assign the color map that is closest to what you want, thencopy that color map and rename it.
4 Make changes as required.
Adding a Visual Elevation Key to a DEM ImageYou can add a small image that displays how colors are mapped to elevationranges from lowest to highest on a digital elevation model.
Sample elevation key
To make the elevation key more useful, add elevation values to the colorbands.
See also:
■ Changing the Color Map of an Image (page 68)
Adding a Visual Elevation Key to a DEM Image | 69

To add a visual elevation key
1 Click Image menu ➤ Insert. Navigate to Raster Design\Samples, andinsert the image elev_small.dem into your current drawing.
2 In the Image Manager toolspace, expand the object tree under the imageelev_small, right-click the color map, and click Edit Color Map.
3 In the Palette Assignment Color Map dialog, select the color map that isused in your primary image.
4 Adjust the size and location of the elevation key in relation to the primaryDEM image.
Creating Another Insertion of an ImageYou can insert another copy of an image when you want to use a differenttype of color map or make other display changes.
When you create another insertion of an AutoCAD image object (bitonal,grayscale, index color or true color), you use the same type of color map,which you can edit later.
Some of the custom image types that Raster Design handles can use two orthree different types of color maps, and the only place where these optionsare presented is on the Image Data (page 332) view of the Image Managertoolspace, when you right-click the image data definition. If you right-clickan existing color map, you can create a new image insertion using the samecolor map type.
When the image data definition is in single-band integer format, such asIKONOS 16-bit, a new insertion can use either a grayscale or palette colormap.
When the image data definition is multispectral, a new insertion can use agrayscale, palette color, or false color map.
To create another insertion of an image
1 To display the Image Manager (page 330) toolspace, click Image ➤
Manage..
2 Right-click the image data definition for which you want a newinsertion and click New Insertion.
70 | Chapter 5 Managing Images and Insertions

If the image is of single-band integer or multiband multispectral format, yousee a submenu with two or three color band types to choose from. As shownin the following table, some of these choices invoke another dialog box whereyou configure the color map to your needs.
Dialog BoxColor Map TypeImage Data Type
Palette Assignment ColorMap Dialog Box (page345)
Palette colorSingle-band integer
Assign Multispectral BandDialog Box (page 301)
GrayscaleMultiband Multispectral
New Palette Color Inser-tion Dialog Box (page 344)
Palette color
Band Assignment ColorMap Dialog Box (page301)
False color
The new insertion is added to the drawing.
Displaying Point DataInteractively display the cursor location and data about the image pixel atthat location.
The Raster Data Query (page 350)dialog box always tracks the cursor locationand displays the color values of the image pixel at that location. Other datavalues associated with the pixel are displayed, subject to image type.
For example, if the image is displayed from a digital elevation model (DEM)with a color map that interprets elevation values, the elevation of the pixelat the cursor location is displayed. If Raster Design is running on AutodeskMap, the working coordinate system is also displayed.
To query pixel data in an image
1 Click Image menu ➤ Raster Data Query. The Raster Data Query dialogbox is displayed.
2 Optionally, resize the dialog box or dock it in the left pane.
Displaying Point Data | 71

Quick Reference
Image Menu
Image ➤ Raster Data Query
Raster Design Toolbar
Dialog Box
Raster Data Query Dialog Box (page 350)
Showing and Hiding ImagesYou can use the Image Insertions view of the Image Manager toolspace toshow or hide an image.
The Hide operation causes the least change to an displayed image, as comparedto unload (page 400), erase (page 389), or detach (page 387). A hidden image isremoved from the display, but the frame remains visible and the image dataremains in the toolspace tree.
Use Show to restore a hidden image to the display. If an image has beenunloaded, a show operation reloads it.
To show or hide an image
1 To display the Image Manager (page 330) toolspace, click Image ➤
Manage..
2 Click the Image Insertions (page 331) view.
3 Click the insertion whose display status you want to change, then doone of the following:
■ If the image is hidden, right-click and click Show.
■ If the image is displayed, right-click and click Hide.
Quick Reference
Toolspace Shortcut Menu
Image Insertions view: right-click insertion ➤ Hide/Show
72 | Chapter 5 Managing Images and Insertions
Object Shortcut Menu
Click image frame, right-click Image ➤ Hide/Show
Command Line
ihideimage, ishowimage
Dialog Box
Image Insertions View (Image Manager Toolspace) (page 331)
Changing the Display Order of ImagesYou can change the order in which images are stacked for display in thedrawing.
The Image Insertions (page 331) view of the Image Manager toolspace showsthe display order of inserted images. Insertions at the top of the tree are at thetop of the display order. New image insertions are placed at the top of thetree, but you can manually move them.
Display order is especially important if you want to layer a transparent bitonalimage directly above another image.
NOTE When you perform an editing command on an image, the display orderchanges so that the image you modified is displayed on top of the other images.To correct this, type REGEN on the command line. You do not need to changethe image order using the method described here. For more information, seeCorrecting Image Display Order using REGEN (page 273).
To change the order in which your images are displayed
1 To display the Image Manager (page 330) toolspace, click Image ➤
Manage..
2 Select the Image Insertions (page 331) view.
3 Click the insertion you want to move, then right-click and select the typeof move: Move Forward, Move Back, Bring to Front, Send to Back.
NOTE You can also click and drag the insertion object up or down in the tree.The insertion at the top of the tree is at the top of the display order.
Changing the Display Order of Images | 73

Erasing an ImageYou can erase an image from the AutoCAD drawing when you no longer needit.
When you erase (page 389) an image, you can also detach (page 387) it, subjectto the Image Detach Options set on the User Preferences Tab(ProductNameShort Options Dialog Box) (page 358). If you want to simplyremove the image from the display, without having to reconstruct it later,consider using the hide (page 390) or unload (page 400) operations.
To erase an image
1 To display the Image Manager (page 330) toolspace, click Image ➤
Manage..
2 Click the Image Insertions (page 331) view.
3 Click the insertion you want to erase, right-click and click Erase.
If no more insertions from this image data definition remain in yourdrawing, you may be asked if you want to detach the image. Detachingremoves the image data definition from the drawing.
NOTE If you want to restore the images, click Edit ➤ Undo.
Detaching an ImageUse the Detach operation to completely remove from a drawing an imagedata definition and all its insertions.
The detach (page 387) operation is the most complete image removal method.If you want to simply remove the image from the display, without having toinsert it later, consider using the hide (page 390) or unload (page 400) operations.
To detach an image
1 To display the Image Manager (page 330) toolspace, click Image ➤
Manage..
2 Click the Image Data (page 332) view.
3 Click the image data definition you want to detach, then right-clickand click Detach.
74 | Chapter 5 Managing Images and Insertions
Unloading/Reloading an ImageUnloading an image removes the image data from working memory withouterasing the image objects from the drawing.
To improve application performance, you can unload images you no longerneed. An unloaded image cannot be displayed or plotted. The unload (page400) operation is just one of several image removal methods. For temporaryremoval, consider the hide (page 390) operation. For more complete removal,consider the erase (page 389) and detach (page 387) operations.
Reloading puts the image back into working memory and redisplays it.
To unload or reload an image
1 To display the Image Manager (page 330) toolspace, click Image ➤
Manage..
2 Select the Image Data (page 332) view.
3 Click the data definition for the image you want to change, then do oneof the following:
■ If the image is loaded, right-click and click Unload.
■ If the image is unloaded, right-click and click Reload.
Changing the Active PathThe active path is the current location of the inserted image file.
Compare the definitions for active path (page 381) and saved path (page 396).The current active path is visible in the list view of Image Manager when youselect the image. This is also where any changes to the image are saved if youclick Image ➤ Save..
If you want to edit an image without changing the original version, you shouldsave a copy in a different location and file format. To do this, click Imagemenu ➤ Save As. Doing this also directs the active path to the copy. For moreinformation,see Saving an Image to Another File Name, Type, or Location(page 43).
To change the active path
1 To display the Image Manager (page 330) toolspace, click Image ➤
Manage..
Unloading/Reloading an Image | 75

2 Click the Image Data (page 332) view.
3 Select the image data definition whose active path you want tochange, then right-click and click Browse Path.
4 In the Insert Image dialog box, navigate to the correct image data location,then choose the image file and click Open.
The active path is updated to reflect the new location of the image.
Changing the Saved PathThe saved path is where Raster Design looks first for the image.
Usually, the active path (page 381) and saved path (page 396) are identical. If thesaved path file name is not found, Raster Design searches other paths until itfinds the image. The search order of paths is as follows:
1 Saved path
2 Current folder (usually the AutoCAD folder)
3 Folder where the current drawing is stored
4 The AutoCAD current project search paths are searched in the order listedon the Files tab of the AutoCAD Options dialog box.
Raster Design searches for the file name and extension (if there is one). If thefile name is not found, Raster Design searches the same path for the file namewith every other valid extension.
If you want to decrease the time Raster Design spends searching for the image,you can designate the active path as the saved path.
TIP If you are saving the image in the same directory as the drawing, you can usethe Clear Path option to save only the image name, without a full path. This canbe useful when you are preparing sets of drawings and images that will reside inthe same directory.
To designate the active path as the saved path
1 To display the Image Manager (page 330) toolspace, click Image ➤
Manage..
2 Select the Image Data (page 332) view.
76 | Chapter 5 Managing Images and Insertions

3 Choose the image data definition whose saved path you want tochange, then right-click and click Save Path.
To clear the saved path
1 To display the Image Manager (page 330) toolspace, click Image ➤
Manage..
2 Select the Image Data (page 332) view.
3 Choose the image data definition whose saved path you want todelete, then right-click and click Clear Path.
Changing the Saved Path | 77

78

Modifying Images
Raster Design provides several tools for modifying images.
■ Cleanup. Correct scanning errors or minor imperfections in bitonal images. You candeskew, despeckle, touchup, adjust the bias, invert, or mirror an image.
■ Image Processing. Adjust the appearance of an image. For example, you can use theconvolve filter to reduce harshness or noise in an image.
■ Raster Entity Manipulation (REM). Edit raster entities in bitonal, color, and grayscaleimages. For example, you can adjust the radius of a raster circle, remove dimension lineson a mechanical drawing, or use REM to copy electrical symbols from one image to another.
■ Mask. Clip images inside the mask boundary and hide or unload images outside the maskboundary. A mask does not permanently alter an image.
■ Crop. Delete data outside a selected area. The image frame size is adjusted automatically.A crop permanently alters an image.
■ Remove. Rub raster data within an image or across multiple images. The only imagesaffected are those within, or partly within, the selected entity or area.
■ Merge. Merge images, merge vectors into raster data, and select raster pen widths.
■ Properties. Adjust the attributes of an image such as position or transparency color.
Selecting an ImageThis topic explains how to select an image if you have more than one in adrawing.
6
79

If your drawing contains only one image, Raster Design automatically selectsit when you run a command that requires a selection set. Otherwise, you canuse one of two methods to select a specific image.
■ Click on the frame (if it is visible), or draw a crossing window around aframe edge. When you do this, grip(s) (page 390) are displayed, and theimage is marked with a hatch pattern to indicate that it has been selected.If you do not want to display the hatch pattern, click Toolsmenu ➤ Options ➤ Display. Then select Highlight Raster Image FrameOnly.
■ Place your cursor over the image, then press Shift + left-click. This featureis useful when you cannot see the image frame. When you do this, theimage grips are displayed but the image is not marked with a hatch pattern.To use this feature, you must enable it in the ProductNameShort OptionsDialog Box (page 351). For more information, see Mouse Settings (page 260).
When you select an image by selecting the image frame, the image rises tothe top of the display order, obscuring any vectors intersecting it. However,you can use the Shift left-click method to select an image without bringing itto the top and highlighting it. This allows you to select the image and keepthe vectors on top so that you can manipulate the frame with the vectors stillvisible. However, when the frame operation is complete, the image rises tothe top of the display order. Use the AutoCAD REGEN command to restorethe proper display order. For more information, see Correcting Image DisplayOrder using REGEN (page 273).
To select an image using Shift + left-click
1 Position your pointer so it is over the image(s) you want to select.
2 Press Shift and click the left button of your mouse.
If you clicked on more than one image, the Image Select Dialog Box (page335) is displayed. This dialog box displays the names of all the images thatare inserted into your drawing. The image(s) that are already selected arehighlighted (not just the images that you selected using the Shift +left-click method).
3 Click one of the following:
■ OK to select the image(s) that are highlighted.
■ An image to select it.
■ Select All to select all the images in your drawing.
80 | Chapter 6 Modifying Images

■ Select None to clear the selection set.
Controlling Image FramesAn image frame encloses each image you insert.
If you select an image frame, grip(s) (page 390) appear and hatch marks aredrawn over the image to indicate that it is selected. You can select the frameusing standard AutoCAD methods. For more informational, see Selecting anImage (page 79).
After you select an image frame, you have several choices:
■ Use an editing command from the Image menu.
■ Right-click to display the Raster Design shortcut menu.
■ Select a grip and then right-click to display the AutoCAD shortcut menu.
■ Manipulate the image using the AutoCAD commands. For moreinformation, see AutoCAD Commands for Images (page 285).
You can turn off the frames in your drawing or you can choose to place thembehind the images.
You can change the color of an image frame using AutoCAD Properties. If theimage is a bitonal image, the frame color and the bitonal objects are alwaysdrawn in the same color. For more information, see AutoCAD Properties (page57).
An image frame is usually rectangular. However, a frame may be irregularlyshaped if the image is clipped.
See also:
■ Image Frame Display (page 59)
Undoing Edits to an ImageYou can use the AutoCAD UNDO command to undo the changes you madeto an image.
However, for each image, only your last ten edits can be undone. This limitdoes not include display-only changes, such as changing the scale, rotation,or position of an image. There is no limit for undoing display-only changes.
Controlling Image Frames | 81
The limit of ten edits applies to operations that change the image data, suchas Rubbersheet, Remove, Crop, Histogram, using a vectorization tool with theREM setting, and so on.
NOTE If you try to undo more than ten edits, then the eleventh undo undoesevery edit you made to the image since you last saved it.
Snapping to COGO PointsCoordinate geography points, or COGO points, can store information suchas a point node, point number, northing and easting values, and elevation.
COGO points are the foundation for any civil engineering or surveying project.When you use Raster Design with a geographic application, you can substituteCOGO points anytime Raster Design asks you to enter a point. This is especiallyuseful for rubbersheeting or matching operations.
There are three ways to specify a COGO point in Raster Design:
■ Enter .p when prompted to enter a point, then enter a COGO pointnumber.
■ Enter .g to select a COGO point using the mouse.
■ Enter .n when prompted to enter a point, then enter northing and eastingvalues that correspond to a COGO point.
Cleaning Up ImagesUse cleanup commands to correct errors that occur during the scanningprocess.
Misaligned drawings, dust on the scanning bed, and mistakes with scanningsoftware can all be corrected using the following Cleanup commands:
■ Deskew. Rotate an image so that it matches the rotation angle of a vectordrawing or another image.
■ Despeckle. Remove speckles or stray pixels that can appear in an imagewhen you scan drawings or blueprints that are dirty or wrinkled.
■ Bias. Correct distortions in an image aspect ratio (page 381). If, for instance,the image is distorted due to paper shrinkage or optical distortions in thescanning process, the Bias tool can correct the aspect ratio by resizing theimage in one or two dimensions.
82 | Chapter 6 Modifying Images

■ Invert. Reverse the light and dark shades of an image. You can invertbitonal, color, and grayscale images. Inversion reverses the dark and lightareas of an image.
■ Mirror. Flip an image along either the horizontal or vertical axis to correctproblems that occur when scanning software reverses drawings, or whenthe back of the drawing is scanned by mistake.
■ Touchup. Edit lines at the pixel level, using a square, circular, or diagonalshaped brush tool that you can resize.
NOTE Raster Design uses Single Image Optimization (page 396) to speed up theediting commands.
Deskewing an ImageYou can rotate an image so that it matches the rotation angle of a vectordrawing or another image.
If you want to match the scale of the image with another image or vector youcan use the Scale command. If you want to move or scale the image as wellas rotate the image, you can use the Match command.
For more information, see Correlating an Image After Insertion (page 28).
To deskew an image
1 Click Image menu ➤ Cleanup ➤ Deskew.
2 Select the image you want to correct.
3 Select the base point you want to rotate the image around.
4 Define the source angle by entering a value or by picking two points onthe raster image that you want to rotate.
For example, select two points you want to match up with two otherpoints on an image that is already rotated correctly.
5 Define the destination angle by typing a value or by picking two pointsto define the angle.
Deskewing an Image | 83

Quick Reference
Menu
Image ➤ Cleanup ➤ Deskew
Raster Design Toolbar
Object Shortcut Menu
Right-click ➤ Image ➤ Rotate
Command Line
ideskew
Removing Speckles from an ImageYou can remove speckles or stray pixels from your bitonal image.
Speckles can appear in an image when you scan drawings or blueprints thatare dirty or wrinkled, or when the scanner itself is dirty. The process consistsof three main actions:
1 Specify the area to be cleaned. Draw a rectangle around the region,despeckle the entire image, or define a smaller region by means of apolygon, clip region, or an existing vector entity.
2 Specify the maximum size of pixel to delete. Click an existing speckle forthis purpose, or define the size by drawing a small rectangle or enteringa numeric value in drawing units or number of pixels.
Raster Design then searches the image to identify speckles that are equalto or smaller than the defined speckle size, highlighting those that meetyour criteria.
3 Inspect the identified speckles, then press Enter to delete them, orrespecify the speckle size, or deselect any speckles you want to keep.
NOTE Raster Design uses Single Image Optimization (page 396) to speed up theediting commands.
To remove speckles from a bitonal image
1 Click Image menu ➤ Cleanup ➤ Despeckle.
84 | Chapter 6 Modifying Images

2 Select the image or images you want to remove speckles from, and thenpress Enter.
The following prompt appears:
Specify first corner point of window or [entire Image/Clipregion/Polygon/Existing] <entire Image>:
3 To define the region to despeckle, do one of the following:
■ Press Enter to despeckle the entire image(s).
■ In the drawing, define a rectangular sub-region.
■ Enter c to use an existing image clip.
■ Enter p, then enter several points to define a polygonal sub-region.
■ Enter e, then click an existing closed vector entity to define the region.
The following prompt appears:
4 Pick a speckle to set size or [Window/size in piXels/size in Units]<Window>:
5 To define the maximum size of speckle to delete, do one of the following:
■ In the drawing, click a speckle.
■ Enter w and then draw a window that defines the maximum specklesize.
■ Enter x and then enter a numeric speckle size in AutoCAD units.
■ Enter u and then enter a numeric speckle size in pixels.
TIP When determining the best size to use, note that a size too large canremove parts of text, such as periods or dots.
The speckles to be deleted are highlighted, and the following promptappears:
Press enter to proceed, pick a speckle to deselect or specify deselectionoption [Window/Polygon/Respecify size]:
6 Review the highlighted speckles to determine if you want them all deleted,then do one of the following:
■ Press Enter to delete the speckles.
■ Click any speckles that you want to keep.
Removing Speckles from an Image | 85
■ Enter w and then draw a window around any group or groups ofspeckles that you want to keep.
■ Enter p and then draw a polygon around a group of speckles that youwant to keep.
■ Enter r and then repeat step 4 to respecify the speckle size and see adifferent set of speckles highlighted for deletion.
Quick Reference
Menu
Image ➤ Cleanup ➤ Despeckle
Raster Design Toolbar
Command Line
idespeckle
Adjusting the Image BiasYou can use the Bias tool to correct distortions in the aspect ratio of an image.
Normally, this ratio is maintained when scaling an image in AutoCAD.However, if the image is distorted due to paper shrinkage or optical distortionsin the scanning process, the Bias tool can correct the aspect ratio by resizingthe image in one or two dimensions, using either existing vector geometry ora distance you specify.
When you use the Bias tool, Raster Design prompts you to enter calibration(existing) distances and desired distances in the X and Y directions. Theapplication stretches or shrinks the entire image to correspond to the ratio ofthe distances you specified. The X and Y directions are relative to the imageand not its position in the drawing. In each case, you can select two points(or enter a distance) to specify the calibration distance, then select twocorresponding points (or enter a new distance) to specify the desired distance.You can also use existing geometry to define the desired distance; for instance,by selecting the endpoints of a line.
86 | Chapter 6 Modifying Images

Raster Design maintains the current base point location for the image unlessyou specify a new base point. You can enter a new base point with numericvalues or by clicking the point in the image.
NOTE The ibias command can only operate on a single image at a time.
To adjust image bias
1 Click Image menu ➤ Cleanup ➤ Bias.
2 If you have not already selected an image, select the image you want tocorrect, and then press Enter.
NOTE You can select your image or images before you select the Biascommand.
3 Click a point in the drawing to use as a base point, or press Enter to usethe origin as the base point.
4 Enter a calibration distance for the X direction by selecting two pointsto represent the distance, or enter the distance in AutoCAD units on thecommand line. Then enter a desired distance for the X direction usingone of the two methods, or Press Enter to leave the X directionunchanged.
5 Enter a calibration distance for the Y direction by selecting two pointsto represent the distance, or enter the distance in AutoCAD units on thecommand line. Then enter a desired distance for the Y direction usingone of the two methods, or press Enter to leave the Y direction unchanged.
Quick Reference
Menu
Image ➤ Cleanup ➤ Bias
Raster Design Toolbar
Command Line
ibias
Adjusting the Image Bias | 87
Reversing the Light and Dark Shades in an ImageYou can use the Invert filter to reverse the light and dark shades of any image.
You can invert bitonal, color, and grayscale images.
Raster Design uses Single Image Optimization (page 396) to speed up the editingcommands.
To reverse the light or dark shades in an image
1 Click Image menu ➤ Cleanup ➤ Invert.
2 Select the image or images you want to invert, and then press Enter.
NOTE You can select your image or images before you select the Invertcommand.
3 Press Enter to start the inversion process.
If you are not satisfied with the results, then you can use the AutoCADUNDO command to restore the image to its original settings.
NOTE Because the Invert operation changes the colors in an image, you mayneed to select a different transparency color after you invert the image. For moreinformation, see Transparency Color of an Image (page 62).
Quick Reference
Menu
Image ➤ Cleanup ➤ Invert
Raster Design Toolbar
Command Line
iinvert
Mirroring an ImageYou can mirror or flip an image along either the horizontal or vertical axis.
88 | Chapter 6 Modifying Images
Scanning software might mirror drawings, or you might occasionally scan theback of the drawing by mistake. You can correct these problems by mirroringthe image.
IMPORTANT The axes for mirror operations are always relative to the image. Ifthe image has been rotated or repositioned in the drawing, the mirror axes arealso moved, so they may not appear horizontal or vertical in the display.
Raster Design uses Single Image Optimization (page 396) to speed up the editingcommands.
To mirror an image along the horizontal or vertical axis
1 Click Image menu ➤ Cleanup ➤ Mirror.
2 Select the image or images that you want to mirror, then press Enter.
3 Do one of the following:
■ To mirror the image along the horizontal axis, select Top To Bottom.
■ To mirror the image along the vertical axis, select Side to Side.
4 Click OK to mirror the image.
5 If you are not satisfied with the results, you can use the AutoCAD UNDOcommand to restore the image to its original settings.
Quick Reference
Menu
Image ➤ Cleanup ➤ Mirror
Raster Design Toolbar
Command Line
imirror
Touching Up an ImageEdit bitonal images at the pixel level using resizable brushes and automatedline-drawing functions.
Touching Up an Image | 89

Touchup tools are provided on the Touchup toolbar.
The touchup brush can be square, round, or diagonal rectangular in shape.You can resize it to match the line weight in your drawing. The brush sizeremains constant in relation to the pixels, so it varies with your zoom level.
Using a toggle control, you can switch from foreground to background color,in effect switching from drawing pixels to erasing them.
The Shift key provides two automated line-drawing controls. You can restrictthe line direction to horizontal, vertical, or 45-degree angle. You can alsocreate lines or polylines.
Raster Design uses Single Image Optimization (page 396) to speed up the editingcommands.
To touch up an image
1 Zoom in to your image so the pixels you want to touch up are clearlyvisible.
2 Click Image menu ➤ Cleanup ➤ Touchup.
The Touchup toolbar is displayed.
3 Click the touchup tool shape you want to use:
■ Square
■ Round
■ Diagonal
4 Optionally, use the controls on the Touchup toolbar to modify yourbrush, adjust the display, and undo or redo lines during your editingsession.
TIP If Dynamic Input is active, you may see a tooltip area that moves withyour cursor. Click DYN at the bottom of the main window to turn this featureoff or on.
5 If you are satisfied with the touchup, click to end the session and
save the results; otherwise, click to erase the touchup and start again.
90 | Chapter 6 Modifying Images
To draw a fixed angle line
1 Click and drag the cursor slowly in the desired direction.
2 Hold down the Shift key.
The line continues horizontal, vertical, or at a 45-degree angle, whicheveris closest to the direction of cursor movement. If the direction is not what
you intended, click (Undo) and start again.
To draw a line or polyline
1 Draw a short first segment freehand, then release the mouse button.
This establishes a known endpoint from which to start the series.
2 Hold down the Shift key, move the cursor to the next desired vertex,then click.
A straight line is drawn between the two points.
3 If you want to add more lines to the series, repeat step 2 for each one.
Quick Reference
Menu
Image ➤ Cleanup ➤ Touchup
Raster Design Toolbar
Command Line
itouchup
Image ProcessingUse Image Processing tools to adjust the appearance of an image.
These tools filter the image, resulting in permanent changes to the imagepixels.
■ Histogram. Adjust the tone of an image in many ways, including conversionof color images to grayscale and color or grayscale images to bitonal.
Image Processing | 91

■ Convolve. Use smoothing filters (page 398) and sharpening filters (page 396)to improve the appearance of your image. Smoothing filters reduceharshness and noise in your image. Sharpening filters make differences inshading more distinct.
■ Bitonal Filters. Smooth the appearance of raster lines or separate partiallymerged raster lines.
■ Change Density. Increase or decrease the resolution of an image.
■ Change Color Depth. Increase or decrease the color depth of an image.For instance, you can change an 8-bit grayscale image to a bitonal image.
■ Palette Manager. Change colors or shades of gray in an 8-bit image, importand export palettes.
NOTE Raster Design uses Single Image Optimization (page 396) to speed up theediting commands.
Adjusting Images with the HistogramYou can use the Histogram to adjust the brightness and contrast of an image,to maximize detail, to convert color or grayscale images to bitonal, and toconvert color images to grayscale.
The Histogram changes the image data definition, so all future insertions ofthe image include these changes. If you want to just change brightness andcontrast of a particular insertion, you can change the color map. For moreinformation, see Changing the Color Map of an Image (page 68).
You can adjust a whole image or a sub-region. You can define a sub-regionusing one of four methods:
■ Use an existing closed vector entity to define the sub-region.
■ Use an existing image clip.
■ Define a rectangular sub-region by clicking two-points.
■ Define a polygonal sub-region by clicking several points.
Adjusting the Brightness and Contrast of an ImageYou can permanently change the tone and visibility of images.
92 | Chapter 6 Modifying Images

Increasing the brightness (page 383) lightens the image and can bring out imagedetail in the shadow areas, although increasing brightness too much can washout the light areas. Decreasing the brightness darkens the image and can bringout details in the light areas. Likewise, decreasing brightness too much cancause the dark areas can become almost black.
Increasing the contrast makes the differences between dark and light areasmore distinct. You can increase contrast in a grayscale image to the pointwhere the image becomes black and white. Decreasing the contrast makes animage that consists mostly of mid-level grays.
In color images, you can adjust the brightness and contrast for individualcolor channelscolor_channel_1 (red, green, blue, or RGB, which is acombination of the colors). For example, if you choose red and then increasethe brightness, you see more reds. In grayscale images, you can adjust onlythe single channel that represents gray.
You can limit the effect of brightness or contrast changes to a portion of theimage called a sub-region. If the image palette is Index Color (8-bit) (page 391)you can alter the palette of the image to include the new colors.
NOTE Raster Design uses Single Image Optimization (page 396) to speed up theediting commands.
To adjust brightness or contrast for a selected image
1 Click Image menu ➤ Image Processing ➤ Histogram.
The following prompt appears:
Press Enter for entire image or specify sub-region option [Existing/Clipregion/Window/Polygon]:
2 Do one of the following:
■ Press Enter to use the histogram on the entire image.
■ Enter e, then click a closed vector entity to use an existing entity todefine the region.
■ Enter c to use an existing image clip.
■ Enter w, then enter two points to define a rectangular sub-region.
■ Enter p, then enter several points to define a polygonal sub-region.
The Histogram (page 316) dialog box is displayed.
3 Click the Brightness/Contrast tab.
Adjusting Images with the Histogram | 93
A preview of the image is displayed. If you selected more than one image,the histogram displays a composite of the images' values. You can vieweach image by clicking its name in the list.
NOTE The preview reflects the image as it was read from the disk. If youhave made any display-only adjustments to the image using the Image Adjustcolor map or the AutoCAD IMAGEADJUST command, then those adjustmentsare not displayed in the image preview. If you make adjustments to the imageusing the Histogram, the adjustments made with IMAGEADJUST are no longerapplied to the image; instead the new settings are applied.
4 If you selected a color image, then choose a color channel from the RGBbox.
5 Do one of the following to manipulate the image:
■ To make the image lighter, drag the Brightness slider to the right.
■ To make the image darker, drag the Brightness slider to the left.
■ To increase the distinction between the light and dark, drag theContrast slider to the right.
■ To decrease the distinction between the light and dark, drag theContrast slider to the left.
6 To adjust the scale in the histogram window, move the slider up anddown. Moving the slider up increases the scale such that low frequencyvalues become more visible and the highest frequency values becometruncated by the top of the window.
7 Click Apply to change the color values in the image file and generate anew histogram that reflects the changes.
NOTE After you click Apply and generate the new histogram, the Brightnessand Contrast sliders are reset to 0.
8 If you specified a sub-region in step 2, select an option from the ApplyChanges To section:
■ Sub-Region applies the changes to the sub-region only.
■ Entire Image applies the changes to the selected image.
94 | Chapter 6 Modifying Images

9 If you selected sub-region in step 6, and if the sub-region is associatedwith an 8-bit color image, select a palette option from the drop-downlist:
■ Retain Current Palette applies your changes to the sub-region bymapping to the closest colors from the current palette. This optionmaintains the current palette and will not affect pixels outside theselected region.
■ Rebuild Palette With All Colors creates a new palette to bestaccommodate all colors in the entire image. Because this imagechanges the palette, pixels inside and outside the sub-region may beaffected by this option.
■ Rebuild Palette With New Colors also creates a new palette, but thisoption guarantees that colors in the sub-region are included in thepalette by giving preference to those pixels over pixels outside thesub-region. Because this image changes the palette, pixels outside thesub-region may be affected by this option.
10 Click Close to exit the Histogram dialog box.
If you are not satisfied with the results, you can use the AutoCAD UNDOcommand to restore the image to the original settings.
NOTE You can reset the brightness and contrast to zero for all color channels byclicking Reset Controls. This does not undo any edits you have already applied tothe image.
Quick Reference
Menu
Image ➤ Image Processing ➤ Histogram
Raster Design Toolbar
Command Line
ihistogram
Dialog Box
Histogram Dialog Box (page 316)
Adjusting Images with the Histogram | 95

Maximizing Details in an ImageIf an image has many pixels that are approximately the same color or shade,you can equalize the image to bring out more detail.
Equalization makes the darkest pixels darker and the lightest pixels lighter,then reassigns the remaining pixels to the colors in between. This is alsoknown as a non-linear contrast stretch.
You can limit the effect of brightness or contrast changes to a portion of theimage called a sub-region. If the image palette is Index Color (8-bit) (page 391),you can alter the palette of the image to include the new colors.
NOTE Raster Design uses Single Image Optimization (page 396) to speed up theediting commands.
To maximize details on a selected image
1 Click Image menu ➤ Image Processing ➤ Histogram.
The following prompt appears:
Press Enter for entire image or specify sub-region option [Existing/Clipregion/Window/Polygon]:
2 Do one of the following:
■ Press Enter to use the histogram on the entire image.
■ Enter e, then click a closed vector entity to use an existing entity todefine the region.
■ Enter c to use an existing image clip.
■ Enter w, then enter two points to define a rectangular sub-region.
■ Enter p, then enter several points to define a polygonal sub-region.
The Histogram (page 316) dialog box is displayed.
3 Click the Equalize tab.
A preview of the image is displayed. If you selected more than one image,the histogram displays a composite of the images' values. You can vieweach image by clicking its name in the list.
96 | Chapter 6 Modifying Images

NOTE The preview reflects the image as it was read from the disk. If youhave made any display-only adjustments to the image using the AutoCADIMAGEADJUST command, then those adjustments are not displayed in theimage preview. If you make adjustments to the image using the Histogram,the adjustments made with IMAGEADJUST are no longer applied to the image;instead the new settings are applied.
4 If you selected a color image, then select a color channel to equalize. Youcan equalize the combined RGB channels, or you can select a singlechannel (Red, Green, or Blue).
5 To adjust the scale in the histogram window, move the slider up anddown. Moving the slider up increases the scale such that low frequencyvalues become more visible and the highest frequency values becometruncated by the top of the window.
6 Click Apply to equalize the image(s).
7 If you specified a sub-region in step 2, select an option from the ApplyChanges To section:
■ Sub-Region applies the changes to the sub-region only.
■ Entire Image applies the changes to the selected image.
8 If the sub-region is associated with an 8-bit color image, select a paletteoption from the Sub-Region Options drop-down list:
■ Retain Current Palette applies your changes to the sub-region bymapping to the closest colors from the current palette. This optionmaintains the current palette and will not affect pixels outside theselected region.
■ Rebuild Palette With All Colors creates a new palette to bestaccommodate all colors in the entire image. Because this imagechanges the palette, pixels inside and outside the sub-region may beaffected by this option.
■ Rebuild Palette With New Colors also creates a new palette, but thisoption guarantees that colors in the sub-region are included in thepalette by giving preference to those pixels over pixels outside thesub-region. Because this image changes the palette, pixels outside thesub-region may be affected by this option.
9 Click Close to exit the Histogram dialog box.
Adjusting Images with the Histogram | 97

If you are not satisfied with the results, then you can use the AutoCADUNDO command to restore the image to the original settings.
Quick Reference
Menu
Image ➤ Image Processing ➤ Histogram
Raster Design Toolbar
Command Line
ihistogram
Dialog Box
Histogram Dialog Box (page 316)
Converting a Color Image to GrayscaleYou can convert a color image to a grayscale image using the Histogram (page316) dialog box.
Converting a color image to an 8-bit grayscale image can reduce the imagefile size. You can also use the smoothing filters (page 398) or the sharpeningfilters (page 396) to enhance the details of an image. These editing filters workonly on grayscale images.
Raster Design uses Single Image Optimization (page 396) to speed up the editingcommands.
To convert a selected color image to a grayscale image
1 Click Image menu ➤ Image Processing ➤ Histogram.
The Histogram (page 316) dialog box is displayed.
2 Select the Color to Grayscale tab.
A preview of the image is displayed. If you selected more than one image,the histogram displays a composite of the images' values. You can vieweach image by clicking its name in the list.
98 | Chapter 6 Modifying Images

NOTE The preview reflects the image as it was read from the disk. If youhave made any display-only adjustments to the image using the AutoCADIMAGEADJUST command, then those adjustments are not displayed in theimage preview. If you make adjustments to the image using the Histogram,the adjustments made with IMAGEADJUST are no longer applied to the image;instead the new settings are applied.
3 Select a channel from which to apply the conversion values. You canselect RGB, or you can select a single channel (Red, Green, or Blue). Ifyou select RGB, then the values for red, green, and blue pixels in theimage are added together and divided by three to achieve the grayscalevalue. If you select one channel, then the Color to Grayscale operationtakes the value for that channel and uses it for the grayscale value.
4 To adjust the scale in the histogram window, move the slider up anddown. Moving the slider up increases the scale such that low frequencyvalues become more visible and the highest frequency values becometruncated by the top of the window.
5 Select Apply to convert the color image(s) to grayscale.
6 Select Close to exit the Histogram dialog box.
If you are not satisfied with the results, you can use the AutoCAD UNDOcommand to restore the original settings.
Quick Reference
Menu
Image ➤ Image Processing ➤ Histogram
Raster Design Toolbar
Command Line
ihistogram
Dialog Box
Histogram Dialog Box (page 316)
Adjusting Images with the Histogram | 99

Converting a Grayscale or Color Image to BitonalYou can convert a grayscale image (page 390) or color image to a bitonal image(page 382).
Converting an image to bitonal can help isolate features in an image, such asthe contour lines in a USGS map. After the image is converted to a bitonalimage, you can use the vectorization tools to convert the raster objects tovectors.
You use a threshold value to determine which pixels become black and whichpixels become white. Raster Design uses Single Image Optimization (page 396)to speed up the editing commands.
NOTE When you use the Threshold option on an image, the foreground color ofthe image is BYLAYER.
To convert a grayscale or color image to a bitonal image
1 Click Image menu ➤ Image Processing ➤ Histogram.
The Histogram (page 316) dialog box is displayed.
2 Click the Threshold tab.
A preview of the image is displayed. If you selected more than one image,the histogram displays a composite of the images' values. You can vieweach image by clicking its name in the list.
NOTE The preview reflects the image as it was read from the disk. If youhave made any display-only adjustments to the image using the AutoCADIMAGEADJUST command, then those adjustments are not displayed in theimage preview. If you make adjustments to the image using the Histogram,the adjustments made with IMAGEADJUST are no longer applied to the image;instead the new settings are applied.
3 Drag the Threshold slider to determine which pixels are black and whichpixels are white. All of the pixels to the left of the slider are black and allpixels to the right of the slider are white.
4 To adjust the scale in the histogram window, move the slider up anddown. Moving the slider up increases the scale such that low frequencyvalues are more visible and the highest frequency values are truncatedby the top of the window.
5 Click Apply to convert the image(s) to bitonal image(s).
100 | Chapter 6 Modifying Images

6 Click Close to exit the Histogram dialog box.
If you are not satisfied with the results, you can use the AutoCAD UNDOcommand to restore the image to the original settings.
NOTE When you use the Threshold command on a color image, Raster Designfirst converts the image to grayscale, and then uses the grayscale value to createthe bitonal image. This grayscale value is obtained by adding the values of thered, green, and blue channels in an image and dividing the value by three. If youwant to have more control over which grayscale value Raster Design uses to createthe grayscale, then you can convert the color image to grayscale first, and thenuse the Threshold command on the grayscale image. For more information, seeConverting a Color Image to Grayscale (page 98).
Quick Reference
Menu
Image ➤ Image Processing ➤ Histogram
Raster Design Toolbar
Command Line
ihistogram
Dialog Box
Histogram Dialog Box (page 316)
Making Tonal Adjustments to an ImageYou can adjust the contrast selectively along the spectrum of dark and lightshades.
Many digital images, particularly those produced on a scanner, display lessdetail in darker or shadowed regions of the image. Adjusting brightness andcontrast for the entire image can improve the level of detail in the darkerregions, but usually does so at the expense of the midtones and lighter colors.Controls on the Tonal Adjustment tab of the Histogram dialog box can adjustthe contrast more selectively. You can, for example, increase the contrast inthe darker tones, while maintaining the current level of contrast amongmidtones and lighter colors.
Adjusting Images with the Histogram | 101

Three types of contrast curve are available:
■ A Gamma correction curve is exponential. You can either specify the singleexponent (gamma) value or use an interactive slider to determine thegamma value.
■ A Fitted curve is drawn smoothly through points you specify. You can addor remove points from the curve, and drag them to modify the shape ofthe curve.
■ A Piecewise Linear curve is constructed of straight-line segments betweenpoints you specify.
You can use a grid as a visual reference for constructing the curve. You canturn the grid on and off by right-clicking in the curve window and selectingGrid on the shortcut menu.
Two sliders under the curve control the lower and upper cut-off points for thecurves. Input values below the lower cutoff point are displayed as 0, whileinput values above the upper cutoff point are displayed as 255. Curves can besaved and imported as Gamma Point List (*.gpl) files.
Like the other histogram functions, when you are operating on a true colorimage, you can choose to manipulate a single color channel, or all threechannels together.
NOTE The Tonal Adjustment feature does not apply to bitonal images.
Above the curve window, the histogram window displays input and outputhistograms. The input histogram is a graph, shown in gray, representing thenumber of pixels in the original image containing each of the given colors.Similarly, the output histogram previews the number of pixels present foreach of the given colors in the image after the curve is applied.
By default, the histogram window adjusts the vertical scale of the histogramssuch that the entry with the highest frequency extends to the top of thehistogram window. You can use the vertical scale slider to effectively zoomin on the histogram. As you move the slider upward, the scale is increased sothat low frequency values are more visible and high frequency values aretruncated by the top of the window.
To adjust the image contrast curve
1 Click Image menu ➤ Image Processing ➤ Histogram.
The following prompt appears:
102 | Chapter 6 Modifying Images

Press Enter for entire image or specify sub-region option [Existing/Clipregion/Window/Polygon]:
2 Do one of the following:
■ Press Enter to use the histogram on the entire image.
■ Enter e, then click a closed vector entity to use an existing entity todefine the region.
■ Enter c to use an existing image clip.
■ Enter w, then enter two points to define a rectangular sub-region.
■ Enter p, then enter several points to define a polygonal sub-region.
The Histogram (page 316) dialog box is displayed.
3 Click the Tonal Adjustment tab.
A preview of the image is displayed. If you selected more than one image,the histogram displays a composite of the images' values. You can vieweach image by clicking its name in the list.
NOTE The preview reflects the image as it was read from the disk. If youhave made any display-only adjustments to the image using the AutoCADIMAGEADJUST command, then those adjustments are not displayed in theimage preview. If you make adjustments to the image using the Histogram,the adjustments made with IMAGEADJUST are no longer applied to the image;instead the new settings are applied.
4 If you selected a color image, then select a color channel to manipulate.You can manipulate the contrast curve for the combined RGB channels,or you can select a single channel (red, green, or blue).
5 Select a curve type from the Select Curve Type list:
■ Choose Gamma correction to create an exponential curve by definingeither the single exponent (gamma) value or using an interactive sliderwhich determines the gamma value.
■ Choose Fitted to draw a curve smoothly through points you specifyby clicking and dragging on curve segments or on existing points.
■ Choose Piecewise Linear to draw straight segments between pointsyou specify. You can create or modify points by clicking and draggingon curve segments or on existing points.
Adjusting Images with the Histogram | 103

6 To delete a point on a Piecewise Linear or Fitted curve, select the point,and press Delete, or right-click and click Delete Point.
7 To import a curve, click the Import button, or right-click in the contrastcurve window and click Import. In the Import (page 336) dialog box,simply navigate to the Gamma Point List (*.gpl) file and click Open.
8 To export a curve, click the Export button, or right-click in the contrastcurve window and click Export. In the Export (page 311) dialog box,navigate to the folder where you want to save the Gamma Point List(*.gpl) file and click Save.
9 To adjust the scale in the histogram window, move the slider up anddown. Moving the slider up increases the scale such that low frequencyvalues are more visible and the highest frequency values are truncatedby the top of the window.
10 To restore the default settings for the curve, click the Reset button, orright-click in the contrast curve window and click Reset.
11 Click Apply.
12 If you specified a sub-region in step 2, select an option from the ApplyChanges To section:
■ Sub-Region applies the changes to the sub-region only.
■ Entire Image applies the changes to the selected image.
13 If the sub-region is associated with an 8-bit color image, select a paletteoption from the Sub-Region Options list:
■ Retain Current Palette applies your changes to the sub-region bymapping to the closest colors from the current palette. This optionmaintains the current palette and will not affect pixels outside theselected region.
■ Rebuild Palette With All Colors creates a new palette to bestaccommodate all colors in the entire image. Because this imagechanges the palette, pixels inside and outside the sub-region may beaffected by this option.
■ Rebuild Palette With New Colors also creates a new palette, but thisoption guarantees that colors in the sub-region are included in thepalette by giving preference to the pixels inside the sub-region overpixels outside the sub-region. Because this image changes the palette,pixels outside the sub-region may be affected by this option.
104 | Chapter 6 Modifying Images

14 Click Close to exit the Histogram dialog box.
If you are not satisfied with the results, then you can use the AutoCADUNDO command to restore the image to the original settings.
Quick Reference
Menu
Image ➤ Image Processing ➤ Histogram
Raster Design Toolbar
Command Line
ihistogram
Dialog Box
Histogram Dialog Box (page 316)
Convolving an ImageConvolve uses smoothing filters (page 398) and sharpening filters (page 396) toimprove the appearance of grayscale images.
Smoothing filters reduce harshness and noise in your image. Sharpening filtersmake differences in shading more distinct.
Reducing Harshness and Noise in an ImageYou can use the smoothing filters (page 398) to reduce the harshness and visualnoise (page 393) in a grayscale image.
If an image contains small details that are noise rather than useful data, youcan use the smoothing filters to remove these details. For example, a smoothingfilter can improve the appearance of scans of half-toned originals.
There are two types of smoothing filters, Low Pass and Median. For moreinformation, see Lowpass Filtering (page 108) and Median Filter (page 106).
Raster Design uses Single Image Optimization (page 396) to speed up the editingcommands.
Convolving an Image | 105

To reduce harshness and visual noise in a selected image
1 Click Image menu ➤ Image Processing ➤ Convolve.
2 Select the image or images you want to filter,then press Enter.
3 Click Expand All to expand the filter list.
4 Choose the smoothing filter you want to use. A description of the selectedfilter is displayed in the Image Filters (page 324) dialog box.
5 Click Run Filter to filter the image(s)
If you are not satisfied with the results, then you can use the AutoCADUNDO command to restore the image to its original settings.
Quick Reference
Menu
Image ➤ Image Processing ➤ Convolve,Smoothing Filters
Raster Design Toolbar
Command Line
iconvolve
Dialog Box
Image Filters Dialog Box (page 324)
Median FilterYou can use this filter to remove random visual noise (page 393) in the image.
The median filter changes each pixel value to match the average value of theneighboring pixels.
To use the median filter on a selected image
1 Click Image menu ➤ Image Processing ➤ Convolve.
2 Click Smoothing Filters.
3 Click Expand All to expand the filter list.
106 | Chapter 6 Modifying Images

4 Click Median Filter.
5 Click Run Filter to filter the image(s).
6 Enter a filter (or matrix) size. This filter uses a matrix for smoothing thepixels. For example, a filter size of 3 would filter each pixel by averagingthe values of the 8 surrounding pixels.
NOTE The filter size must be an odd number.
7 Click OK to apply the filter.
Quick Reference
Menu
Image ➤ Image Processing ➤ Convolve,Smoothing Filters
Raster Design Toolbar
Command Line
iconvolve
Dialog Box
Image Filters Dialog Box (page 324)
Making Differences in Shading More DistinctYou can use the sharpening filters on grayscale images to make differences inshading more distinct.
Sharpening filters can enhance edges in the image. It may be necessary to usethese filters to extract the highest amount of useful data from a low resolutionscan.
For more information on the two types of sharpening filters (page 396), seeHighpass Filters (page 109) and Edge Enhancements Filters (page 110).
Raster Design uses Single Image Optimization (page 396) to speed up the editingcommands.
Convolving an Image | 107

To make differences in shading more distinct for a selected image
1 Click Image menu ➤ Image Processing ➤ Convolve.
2 Select the image or images you want to filter,then press Enter.
3 Click Expand All to expand the filter list.
4 Select the sharpening filter you want to use. A description of the selectedfilter is displayed in the Image Filters (page 324) dialog box.
5 Click Run Filter to filter the image(s).
See also:
■ Reducing Harshness and Noise in an Image (page 105)
Quick Reference
Menu
Image ➤ Image Processing ➤ Convolve, Smoothing Filters
Raster Design Toolbar
Command Line
iconvolve
Dialog Box
Image Filters Dialog Box (page 324)
Lowpass FilteringLowpass filtering can lessen the severity of tone change by reducinghigh-frequency detail in an image in areas where pixel intensities changerapidly.
The result is a slightly blurred image.
108 | Chapter 6 Modifying Images

Raster Design uses the following lowpass filters:
■ Lowpass Filter #1 averages differences between the target pixel value andits side to side and top and bottom neighbors. Diagonally adjacent pixelsare ignored.
■ Lowpass Filter #2 evenly weighs all pixels in the kernel including the target.
■ Lowpass Filter #3 evenly weighs all pixels surrounding the target whileproviding extra weight to the target pixel. This tends to reduce the blurringeffect to the image.
■ Lowpass Filter #4 heavily weighs the target pixel while weighing adjacentside to side and top and bottom pixels more heavily than diagonallyconnected pixels. Heavy weighting on the target pixel tends to reduceblurring effects and less weighting on the diagonal pixels acknowledgesthat their centers are further away than side adjacent pixels.
■ Blurring evenly weighs all pixels in the kernel including the target. Thisfilter, while similar to Lowpass Filter #2, gives slightly brighter results.
On a low resolution scan, you can also use the sharpening filters (page 396) tomake differences in shading more distinct and enhance edges in the image.For more information on sharpening filters, see Highpass Filters (page 109) andEdge Enhancements Filters (page 110).
Raster Design uses Single Image Optimization (page 396) to speed up the editingcommands.
Highpass FiltersHighpass filters can enhance the edges and sharpen details in a grayscaleimage.
Raster Design uses the following highpass filters:
■ Highpass Filter #1 picks up differences between the target pixel and itsneighbor's side to side and top and bottom. Diagonally connected pixelsare ignored.
■ Highpass Filter #2 evenly weighs all the surrounding pixels in the kernelbut places an especially high weight is on the target pixel. Thus, if thetarget pixel differs significantly from its neighbors, the dimming effect ofthe neighboring pixels negligible.
Convolving an Image | 109

■ Highpass Filter #3 weighs side to side and top and bottom neighbors moreheavily than diagonal neighbors.
Edge Enhancements FiltersYou can use these filters to enhance edges so you can easily identify boundariesand property lines. You can also use them for object extraction or objectrecognition by higher-level algorithms.
Raster Design supports the following edge enhancements filters:
Shift and Difference Edge Enhancements Filters (page 110)
Laplace Edge Enhancements Filters (page 110)
Gradient Directional Edge Enhancements Filters (page 111)
Matched Filter Edge Enhancements Filters (page 111)
Shift and Difference Edge Enhancements FiltersYou can use these filters to shift the image by one pixel and subtract the shiftedimage from the original.
Raster Design uses the following shift and difference edge enhancementsfilters:
■ Vertical enhances vertical edges composed of black-to-white transitions.
■ Horizontal enhances horizontal edges composed of black-to-whitetransitions.
■ Vertical and Horizontal combines operation of both vertical and horizontaledge enhancements.
Laplace Edge Enhancements FiltersYou can use these filters to enhance the image in all directions. These filtersenhance all edges that are composed of black-to-white transitions by makingthem white.
110 | Chapter 6 Modifying Images
Raster Design uses the following Laplace edge enhancements filters:
■ #1 uses the target pixel and its horizontal and vertical neighbors. Diagonallyadjacent pixels are ignored.
■ #2 uses a uniform kernel with a high weighting on the target pixel.
■ #3 uses a uniform kernel with the highest weighting on the target pixel.
■ #4 weighs adjacent horizontal and vertical pixels more heavily thandiagonally adjacent pixels.
Gradient Directional Edge Enhancements FiltersYou can use these filters in any one of the eight compass directions. Usingthese directional filters results in a black background with white outlines ofthe objects in the original image.
Each filter enhances the edges composed of black-to-white transitions in aspecific direction, making these edges white. Raster Design uses the followinggradient directional edge enhancements filters:
■ North
■ Northeast
■ East
■ Southeast
■ South
■ Southwest
■ West
■ Northwest
Matched Filter Edge Enhancements FiltersYou can use these filters to search for features in images that are obscured bynoise (page 393). These filters use a directional 3x5 or 5x3 pixel kernel.
Raster Design uses the following matched filter edge enhancements filters:
Horizontal searches for horizontal lines in a noisy image.
Convolving an Image | 111

Vertical searches for vertical lines in a noisy image.
Using Bitonal FiltersYou can use these filters to clean up bitonal images.
Bitonal filters can be used in conjunction with other clean up commands,such as despeckle and deskew. For more information, see Removing Specklesfrom an Image (page 84) and Deskewing an Image (page 83).
You can use bitonal filters on an entire image, or on a portion of an imagecalled a sub-region. You can define a sub-region using one of four methods:
■ Use an existing closed vector entity to define the region.
■ Use an existing image clip.
■ Define a rectangular sub-region by clicking two-points.
■ Define a polygonal sub-region by clicking several points.
The smooth filter removes unnecessary pixels from the edges of raster objects,fills holes in raster lines, and removes speckles from the raster image.
Click here to see sample raster objects before and after using a smooth filter.
NOTE The smooth filter can eliminate small details in the image.
112 | Chapter 6 Modifying Images

The thin filter trims raster objects by one pixel (per pass) in all directions.Thinning reduces the number of pixels while maintaining the basic shape ofthe feature.
Click here to see sample raster objects before and after using a thin filter.
The thickening filter thickens the edges of raster objects by one pixel (perpass) in the directions you specify.
Click here to see sample raster objects before and after using a thickening filter.
A separate filter separates partially merged lines to prevent Raster Design fromconverting them to one thick line.
Click here to see sample raster objects before and after using a separate filter.
A skeletonize filter thins all raster data to a one pixel thickness. You can usea skeletonize filter to thin your entire raster image down, then run the thickenfilter to make all of your Raster data one consistent width.
To use bitonal filters for a selected image
1 Click Image menu ➤ Image Processing ➤ Bitonal Filters.
The following prompt appears:
Convolving an Image | 113

Press Enter for entire image or specify sub-region option [Existing/Clipregion/Window/Polygon]:
2 Do one of the following:
■ Press Enter to use the filter on the entire image.
■ Enter e, then click a closed vector entity to use an existing entity todefine the region.
■ Enter c to use an existing image clip.
■ Enter w, then enter two points to define a rectangular sub-region.
■ Enter p, then enter several points to define a polygonal sub-region.
The Bitonal Filters (page 302) dialog box is displayed.
3 Choose the Filter Type you would like to run on your image.
4 Choose the Number of Passes.
For example, a pass value of 3 means running the operation 3 times.
5 Choose the Direction(s) in which you would like the filter to run.
6 Click OK to apply the filter.
See also:
■ Bitonal Filters Dialog Box (page 302)
Quick Reference
Menu
Image ➤ Image Processing ➤ Bitonal Filters
Raster Design Toolbar
Command Line
ibfilter
Dialog Box
Bitonal Filters Dialog Box (page 302)
114 | Chapter 6 Modifying Images

Changing Image DensityFor editable image types, you can change the pixel density value, densityunits, or both.
Common reasons for changing density are as follows:
■ Decrease the image density to reduce the file size of the image or of thedrawing.
■ Increase the image density to make more pixels available in your image.For instance, circles and other curves look smoother at higher densities.
You can adjust the density of multiple images simultaneously if all selectedimages have the same density and units.
The Change Density Dialog Box (page 303) displays the current pixel density(using the current image units) and prompts you to enter a new density. Afteryou enter the new density value, you see what the image dimensions will beif you apply the change.
You can select one of five resampling methods: bicubic (page 382), bilinear (page382), Lanczos (page 391), Mitchell (page 392), or nearest neighbor (page 393).
NOTE Changing the density of an 8-bit image using bilinear or bicubic resamplingmay replace some existing colors in your palette. If you would like the image toretain all of its colors you should increase the pixel depth before using bilinear orbicubic resampling. For more information, see Setting the Color Depth for anImage (page 116).
Adjusting the density of an image can change the image file size, but it doesnot change the image correlation, scale, or (in most cases) the image size inAutoCAD units.
To change the density of a selected image
1 Click Image menu ➤ Image Processing ➤ Change Density.
2 Select the image or images you want to change, and then press Enter.
NOTE You can also select your image or images before you select the ChangeDensity command.
3 In the Change Density (page 303) dialog box, enter a new density valueor pixel size. Optionally note the resulting change to image dimensions.
Convolving an Image | 115
4 Select an image resampling method.
5 Click OK to change image density.
Quick Reference
Menu
Image ➤ Image Processing ➤ Change Density
Raster Design Toolbar
Command Line
idensity
Dialog Box
Change Density Dialog Box (page 303)
Setting the Color Depth for an ImageYou can alter the color depth of an image.
Each pixel in a raster image stores color information. The amount ofinformation within each pixel is called depth and is measured in bits. Pixelswith more depth can store more information and therefore display morecolors. For instance, an 8-bit pixel can display one of 256 indexed colors (or,in the case of grayscale images, shades of gray), while a 24-bit pixel can displayone of 16.7 million colors.
The following table shows the color depths supported by Raster Design andthe number of colors each depth can display.
Available Color(s)Color DepthType of Image
1 color1-BitBitonal
256 shades of gray8-BitGrayscale
256 colors8-BitIndexed Color
16.7 million colors24-BitTrue Color
116 | Chapter 6 Modifying Images

Changing the pixel depth is useful because it allows you to manipulate filesize or add colors to the palette. Decreasing pixel depth decreases the numberof colors that can be displayed, and decreases the file size of the image.Likewise, increasing pixel depth increases the number of colors that can bedisplayed and increases the file size.
The following table shows the depth conversions supported by the idepthcommand:
True ColorGrayscaleColorBitonalType of Image
YesYesYesN/ABitonal
YesYesN/AYesIndexed Color
YesN/AN/AYesGrayscale
YesTrue ColorN/AYesTrue Color
In most cases, when you convert an image for which you have already specifieda transparency color, the transparency color is maintained. However, thereare two exceptions:
■ When converting to a bitonal image, transparent pixels are OFF iftransparency is enabled. If transparency is disabled, transparent pixels aretreated the same as other pixels.
■ When converting to grayscale, a transparent color is mapped to itscorresponding gray value, whether transparency is ON or OFF.
To change the color depth of an image
1 Click Image menu ➤ Image Processing ➤ Change Color Depth.
2 Select the image or images you want to change, and then press Enter.
NOTE You can also select your image or images before you select the ChangeColor Depth command.
3 Choose a color depth and press Enter.
NOTE You can adjust the pixel depth of multiple images if all selected imageshave the same pixel depth.
Convolving an Image | 117

Quick Reference
Menu
Image ➤ Image Processing ➤ Change Color Depth
Raster Design Toolbar
Command Line
idepth
Dialog Box
Bitonal Filters Dialog Box (page 302)
Using the Palette ManagerRaster Design allows you to manipulate individual colors and entire palettesfor 8-bit images.
The Palette Manager can determine which colors are actually being used,change an existing color to a different color, combine several color indicesinto a single mapped color, compress the palette, and even import and exportpalettes.
Manipulating the Color TableThe Palette Manager (page 348) dialog box displays color tables representingthe values in the image palette.
These color tables are displayed both as an array of color buttons, and a listwindow. You can select individual colors in the color table to get informationon their color values, frequency, and index values. By selecting one or morecolors from the color table, you can also change their color values, combinecolors, assign transparency, and delete colors from the palette.
Changing Selected Colors in the Image PaletteIn a paletted image, when you select a color from the color table or the listview, the Change button becomes active.
118 | Chapter 6 Modifying Images

Clicking the Change button gives you the option to change the selected color.In the Target Color (page 370) dialog box, you can select a color from thecurrent palette, or from a standard palette, such as the AutoCAD palette or aspectrum palette. You can also select a custom color.
As with most changes in the Palette Manager (page 348) dialog box, the changesyou make to the palette are not permanent until you click the Apply button.
To replace a color from the color table
1 Click Image menu ➤ Image Processing ➤ Palette Manager.
The Palette Manager (page 348) dialog box is displayed.
2 Select one or more colors from the color table or list view, or use theSelect Color button to pick a color directly from the image. For moreinformation, see Selecting a Color Directly from the Image (page 122).
3 Click the Change button, or right-click and click Change on the shortcutmenu. The Target Color (page 370) dialog box appears.
4 Do one of the following:
■ Replace the selected color with a color from the current palette byselecting a replacement color from the color table in the Target Colordialog box.
■ Replace the selected color with a color from another palette byselecting a new palette from the Palette list. The color table changesto reflect the new palette. You can also select a replacement colorfrom the color table in the Target Color dialog box.
■ Replace the selected color with a custom color by clicking the CustomColor button. The Select Custom Color dialog box appears. You canalso define a custom color by clicking a color from the matrix, usingthe luminosity slider, or entering values in the Red, Green, Blue, Hue,Saturation, or Luminosity text boxes.
5 Click OK to close the Target Color dialog box.
6 In the Palette Manager dialog box, click Apply.
7 Click OK to close the Palette Manager dialog box.
Manipulating the Color Table | 119
Quick Reference
Menu
Image ➤ Image Processing ➤ Palette Manager
Raster Design Toolbar
Command Line
ipal
Dialog Box
Palette Manager Dialog Box (page 348)
Combining Selected Colors in the Image PaletteWhen you select two or more color values from the color table, you can usethe Combine button to consolidate the selected values into a single value youchoose from the Target Color (page 370) dialog box.
Combining values is a good way to control the number of colors used in thepalette.
As with most changes in the Palette Manager (page 348) dialog box, the changesyou make to the palette are not permanent until you click the Apply button.
To combine two or more values from the color table
1 Click Image menu ➤ Image Processing ➤ Palette Manager.
The Palette Manager (page 348) dialog box is displayed.
2 Select two or more values from the color table:
■ Press Ctrl and click to select multiple values individually.
■ Press Shift and click to select a series of multiple values.
■ Click and drag in the color table to select the values within arectangular window.
■ Click the Select Color button to pick a color directly from the image.For more information, see Selecting a Color Directly from the Image(page 122).
120 | Chapter 6 Modifying Images

3 Click the Combine button, or right-click and click Combine on theshortcut menu. The Target Color (page 370) dialog box appears.
4 Select a new color from the color table in the Target Color dialog box.
NOTE The last selected color is selected by default in the Target Color dialogbox.
5 Click OK to close the Target Color dialog box.
6 In the Palette Manager dialog box, click Apply.
7 Click OK to close the Palette Manager dialog box.
Quick Reference
Menu
Image ➤ Image Processing ➤ Palette Manager
Raster Design Toolbar
Command Line
ipal
Dialog Box
Palette Manager Dialog Box (page 348)
Designating a Transparent ColorYou can use the Palette Manager to designate a transparent color in an image.Making a color transparent is helpful if you want to see information that isdisplayed behind the image. The transparency color is also used to replace thedata that is removed when you edit an image using the rub or crop commands.If transparency is also turned on for the image, the rubbed areas (or the slackspace in a cropped image) become transparent.
As with most changes in the Palette Manager (page 348) dialog box, the changesyou make to the palette are not permanent until you click the Apply button.
For more information, see Transparency Color of an Image (page 62).
Manipulating the Color Table | 121

To specify a transparent color from the color table
1 Click Image menu ➤ Image Processing ➤ Palette Manager.
The Palette Manager (page 348) dialog box is displayed.
2 Select a color from the color table or use the Select Color button to picka color directly from the image. For more information, see Selecting aColor Directly from the Image (page 122).
3 Click the Transparent button, or right-click and select Set Transparenton the shortcut menu.
4 To turn on transparency in the image, select the Image Transparencycheck box and click Apply.
5 Click OK to close the Palette Manager dialog box.
NOTE If the Image Transparency check box is cleared, the transparency willnot appear.
Quick Reference
Menu
Image ➤ Image Processing ➤ Palette Manager
Raster Design Toolbar
Command Line
ipal
Dialog Box
Palette Manager Dialog Box (page 348)
Selecting a Color Directly from the ImageUse the Select Color tool to pick colors directly from the selected image.
A single click will add one color to the selection set, or you can select all ofthe colors within a rectangular or polygonal window.
122 | Chapter 6 Modifying Images

To select palette colors directly from the image
1 Click Image menu ➤ Image Processing ➤ Palette Manager.
The Palette Manager (page 348) dialog box is displayed.
2 Click the Select Color button.
The following prompt is displayed:
Select point or [Window/Polygon]:
3 Do one of the following:
■ Select a single color by picking a point in the image.
■ Enter w, then click two points to define a rectangular selection windowin the image. The colors within the window are selected.
■ Enter p, then select several points to define a polygonal selectionwindow in the image. The colors within the window are selected.The Palette Manager dialog box reappears and the colors you pickedfrom the image are added to the selection set in the color table.
Quick Reference
Menu
Image ➤ Image Processing ➤ Palette Manager
Raster Design Toolbar
Command Line
ipal
Dialog Box
Palette Manager Dialog Box (page 348)
Removing Duplicate Entries from the Image PaletteThe Palette Manager can compress the palette to remove duplicate entriesfrom a paletted image.
Duplicate entries are two or more indexed entries that share the same RGB(page 395) values. The unused entries are changed to black (0,0,0) and the color
Manipulating the Color Table | 123

table is resorted according to the current sorting scheme. Transparent colorsare not compressed.
The Compress button is not available for grayscale images.
As with most changes in the Palette Manager (page 348) dialog box, the changesyou make to the palette are not permanent until you click the Apply button.
To remove duplicate entries from the Image Palette
1 Click Image menu ➤ Image Processing ➤ Palette Manager.
The Palette Manager (page 348) dialog box is displayed.
2 Click the Compress button.
3 Click Apply.
4 Click OK to close the Palette Manager dialog box.
Quick Reference
Menu
Image ➤ Image Processing ➤ Palette Manager
Raster Design Toolbar
Command Line
ipal
Dialog Box
Palette Manager Dialog Box (page 348)
Resetting the Image PaletteYou can remove unwanted changes to the palette by using the Reset button.
Resetting restores the palette to its original state, or to its state before you lastclicked Apply.
To remove unwanted palette changes
■ On the Palette Manager (page 348) dialog box, click the Reset button.
124 | Chapter 6 Modifying Images

The palette is restored to its original state, or to its state just after the lastApply.
Quick Reference
Menu
Image ➤ Image Processing ➤ Palette Manager
Raster Design Toolbar
Command Line
ipal
Dialog Box
Palette Manager Dialog Box (page 348)
Importing and Exporting Image PalettesYou can apply the same palette changes to multiple images by using the importand export tools.
The Palette Manager also allows you to view information about the palettefile and convert grayscale images to paletted images.
Importing an Image PaletteYou can apply a saved palette to your color image (or paletted grayscale image)using the Import command.
The Import Palette (page 337) dialog box allows you to navigate to any palettefile (*.pf) and displays a preview of the palette, as well as a title.
The Import Palette dialog box gives you three options for applying theimported palette to your image:
■ Substitute simply replaces the current palette with the imported palette.Indexed colors are not changed, they are mapped to the new colors in theimported palette.
■ Match replaces the current palette with the imported palette by remappingthe indexed colors to the closest colors in the imported palette. Matching
Importing and Exporting Image Palettes | 125
is especially useful for synthetic images with areas of nearly-uniform color.A scanned USGS map, for instance, can be matched to an imported web-safepalette.
■ Dither is similar to Match because the current indexed colors are usuallyre-mapped to the closest colors in the imported palette. Unlike matching,however, dithering attempts to reduce color banding by using groups ofpixels displaying the target colors. The combination of these colors isperceived as a single color. Because dithering sacrifices spatial resolutionin order to match the appearance of the original color, the dither optionis best suited for continuous tone images such as photographs.
NOTE Unlike many other actions in the Palette Manager, importing a paletteeffects the image without clicking the Apply button. To restore the image palette,you should exit the Palette Manager and use the AutoCAD UNDO command.
To import a saved palette
1 Click Image menu ➤ Image Processing ➤ Palette Manager.
The Palette Manager (page 348) dialog box is displayed.
2 To display the Import Palette (page 337) dialog box, click Palettemenu ➤ Import.
NOTE Grayscale images must be converted to color before you can importa palette. For more information, see Converting Grayscale Images to PalettedImages (page 130)
3 Navigate to the folder where the palette is located using one of thefollowing methods:
■ Choose the drive and folder using standard Windows navigationprocedures.
■ Choose a location from the Places List on the left side of the dialogbox to navigate directly to the My Documents folder (or the Personalfolder, depending on which operating system you are using), theDesktop, or the Favorites folder.
■ In the Files Of Type box, choose the file format of the palette youwant to import.
NOTE If more than one kind of file with the same name is present in thefolder, do not enter in a filename with no extension.
126 | Chapter 6 Modifying Images
4 From the list of palettes, select the palette you want to import. Theselected palette is listed in the File Name box. Alternatively, click theFavorites button to choose a shortcut to palette in a local or networklocation, or on the Internet.
5 To change the way Raster Design applies the new palette to the image,select one of the following options in the Palette Application section:
■ Substitute to replace the current palette with the imported palette.
■ Match to replace the current palette with the imported palette byre-mapping the indexed colors to the closest colors in the importedpalette.
■ Dither to replace the current palette with the imported palette byremapping the indexed colors to the closest colors in the importedpalette.
6 To view information about a palette, such as the palette title, before youinsert it, click Views ➤ Information.
7 To display a preview of the palette, click Views ➤ Preview.
8 Click Open to import the palette file and return to the Palette Managerdialog box.
Quick Reference
Menu
Image ➤ Image Processing ➤ Palette Manager
Raster Design Toolbar
Command Line
ipal
Dialog Box
Import Palette Dialog Box (page 337)
Importing and Exporting Image Palettes | 127
Exporting an Image PaletteYou can save the changes you make in the Palette Manager and export thosechanges for use with other images.
The Export Palette (page 314) dialog box allows you to create a palette file (*.pf)with a title and to save that palette file to a local, network, or Internet location.
To export a saved palette
1 Click Image menu ➤ Image Processing ➤ Palette Manager.
The Palette Manager (page 348) dialog box is displayed.
2 To display the Export Palette (page 314) dialog box, click Palettemenu ➤ Export.
3 In the Files Of Type box, choose the desired file format for the new image.
4 There are two methods you can use to navigate to a new location to whichto export the palette file:
NOTE The default file extension for Raster Design palette files is .pf. However,you can specify another file extension if you wish.
■ Select the drive and folder using standard Windows navigationprocedures.
■ Select a location from the Places List on the left side of the dialog boxto navigate directly to the My Documents folder (or the Personalfolder, depending on which operating system you are using), theDesktop, or the Favorites folder.
5 In the File Name box, enter a name for the palette file or choose a filename from the list.
6 In the Palette Title box, enter a title for the palette file. This name isdisplayed in the preview window when a palette file is imported.
7 Click Save to export the palette file and return to the Palette Managerdialog box.
128 | Chapter 6 Modifying Images

Quick Reference
Menu
Image ➤ Image Processing ➤ Palette Manager
Raster Design Toolbar
Command Line
ipal
Dialog Box
Export Palette Dialog Box (page 314)
Displaying Image Palette InformationThe Information option allows you to view basic information about the paletteas a whole.
The Palette Information dialog box displays the following information:
■ Palette Type: Grayscale or Color Palette
■ Used: number of colors used in the image
■ Unused: number of colors not used in the image (256 – Used)
■ Palette Status: Modified or Unmodified
■ Image Status: Modified or Unmodified
■ Transparency: ON or OFF
To view information about the current palette
1 Click Image menu ➤ Image Processing ➤ Palette Manager.
The Palette Manager (page 348) dialog box is displayed.
2 To display the Palette Information dialog box, click Palettemenu ➤ Information.
3 Click OK to return to the Palette Manager dialog box.
Importing and Exporting Image Palettes | 129

Quick Reference
Menu
Image ➤ Image Processing ➤ Palette Manager
Raster Design Toolbar
Command Line
ipal
Dialog Box
Palette Manager Dialog Box (page 348)
Converting Grayscale Images to Paletted ImagesThe Palette Manager can convert a grayscale image to a paletted image bycreating an indexed palette of gray values.
One reason for doing this would be to apply spot color to a grayscale imagethat uses a small range of gray values. After you convert the image to a palettedimage, you can change a particular gray value to a color.
NOTE If you make no changes, the image is restored to grayscale when you exitthe Palette Manager.
To convert a grayscale image to a paletted image
1 Click Image menu ➤ Image Processing ➤ Palette Manager.
The Palette Manager (page 348) dialog box is displayed.
2 Click the Convert to Color button.
3 Make any desired changes to the palette.
4 Click Apply.
5 Click OK to close the Palette Manager dialog box.
130 | Chapter 6 Modifying Images

Quick Reference
Menu
Image ➤ Image Processing ➤ Palette Manager
Raster Design Toolbar
Command Line
ipal
Dialog Box
Palette Manager Dialog Box (page 348)
Controlling Palette ViewsThe Palette Manager features a number of ways to control the appearance andcontents of the color table.
Commands on the View menu allow you to display indicators for unused andtransparent colors in the color table. You can also choose to display a selectedcolor's Red, Green, Blue values (RGB) or Hue, Saturation, Luminance values(HSL) on the status bar. The Sort By list allows you to sort the colors in thecolor table according to Index, Frequency, Transparency, Dominant Color,Luminance, and so on. Grayscale images can be sorted by Index and Frequency.
Controlling the Display of Unused ColorsThe Palette Manager can help you differentiate between used and unusedcolors in the color table by displaying unused colors with an X-shapedindicator.
To change the display of unused colors
1 Click Image menu ➤ Image Processing ➤ Palette Manager.
The Palette Manager (page 348) dialog box is displayed.
2 Click View menu ➤ Show Unused. Or with no colors selected in the colortable, right-click and click Show Unused on the shortcut menu. A checkmark means that unused colors will be displayed with an X indicator.
Controlling Palette Views | 131

Quick Reference
Menu
Image ➤ Image Processing ➤ Palette Manager
Raster Design Toolbar
Command Line
ipal
Dialog Box
Palette Manager Dialog Box (page 348)
Controlling the Display of Transparent ColorsThe Palette Manager can help you identify the transparent color in the colortable by displaying the transparent color with a “+” indicator.
If there are multiple entries in the palette with the same color as thetransparent color, then they are all shown with a + indicator.
To change the display of transparent colors
1 Click Image menu ➤ Image Processing ➤ Palette Manager.
The Palette Manager (page 348) dialog box is displayed.
2 Click View menu ➤ Show Transparent. Or with no colors selected in thecolor table, right-click and click Show Transparent on the shortcut menu.A check mark means that transparent colors will be displayed with a “+”indicator.
NOTE If no transparent color has been assigned, the Show Transparent menuitem will be grayed.
Quick Reference
Menu
Image ➤ Image Processing ➤ Palette Manager
132 | Chapter 6 Modifying Images

Raster Design Toolbar
Command Line
ipal
Dialog Box
Palette Manager Dialog Box (page 348)
Controlling the Display of Color ValuesThe Palette Manager features a status bar that displays information aboutselected colors in the color table.
In addition to the index and frequency (which are always presence) the PaletteManager can display the selected color's Red, Green, Blue values (RGB) or Hue,Saturation, Luminance values (HSL) on the status bar.
To change the display of color values
1 Click Image menu ➤ Image Processing ➤ Palette Manager.
The Palette Manager (page 348) dialog box is displayed.
2 Click View menu ➤ RGB. Or click View menu ➤ HSL. Or with no colorsselected in the color table, right-click and click RGB or HSL on the shortcutmenu. A check mark means that corresponding color values are displayedon the status bar.
Quick Reference
Menu
Image ➤ Image Processing ➤ Palette Manager
Raster Design Toolbar
Command Line
ipal
Controlling Palette Views | 133

Dialog Box
Palette Manager Dialog Box (page 348)
Sorting the Color TableThe Palette Manager gives you several criteria by which to sort the color tableand list window.
Use the Sort By list, or click a corresponding column in the list window tosort the colors according to one of the following criteria:
■ Index
■ Frequency
■ Transparency
■ Color
■ Red
■ Green
■ Blue
■ Hue
■ Saturation
■ Luminance
To sort the color table or list window
1 Click Image menu ➤ Image Processing ➤ Palette Manager.
The Palette Manager (page 348) dialog box is displayed.
2 In the Sort By list, select a sort method, or click one of the columns inthe list window. The color table and list window are re-arranged to reflectthe new order.
Quick Reference
Menu
Image ➤ Image Processing ➤ Palette Manager
134 | Chapter 6 Modifying Images

Raster Design Toolbar
Command Line
ipal
Dialog Box
Palette Manager Dialog Box (page 348)
Adding and Removing Columns from the List WindowThe Palette Manager features a list window as an alternative view of the colortable.
By default, the list window displays the following columns:
■ Index
■ Frequency
■ Transparency
■ Color
■ Red
■ Green
■ Blue
■ Hue
■ Saturation
■ Luminance
You can show or hide a column simply by right-clicking on any of the columns,then selecting the column name. A check mark next to the column nameindicates that it is displayed.
To show or hide a column in the list window
1 Click Image menu ➤ Image Processing ➤ Palette Manager.
The Palette Manager (page 348) dialog box is displayed.
Controlling Palette Views | 135

2 In the list window, right-click on one of the column headings to displaythe shortcut menu.
3 Click one of the column names to toggle the display status. A check marknext to the column name indicates that is displayed.
Quick Reference
Menu
Image ➤ Image Processing ➤ Palette Manager
Raster Design Toolbar
Command Line
ipal
Dialog Box
Palette Manager Dialog Box (page 348)
Masking ImagesTo display and plot a subset of the images in your drawing, you can create amask.
A mask clips the images that are inside the mask boundary and hides orunloads the images that are completely outside the mask boundary.
A mask is similar to an image clip, but a mask can affect more than one imageat a time. Like a clip, a mask does not permanently modify the images. Youcan disable the mask to redisplay all of the images and you can also converta mask to image clips. For more information, seeEnabling or Disabling a Mask(page 141), Clipping an Image (page 142), and Converting a Mask to Image Clips(page 143).
You can mask images using a rectangular or polygonal mask boundary. Themask boundary is an AutoCAD object that you can move, stretch, scale, anderase like any other AutoCAD object.
136 | Chapter 6 Modifying Images

Creating a New MaskTo display and plot a subset of the images in your drawing, you can create amask (page 392).
NOTE When drawing a mask, set the color of the current layer to a color you caneasily distinguish from the AutoCAD background and your images.
To create a new mask
1 Click Image menu ➤ Mask ➤ Create.
The New Image Mask (page 343) dialog box is displayed.
2 Define the mask properties. For more information, see Changing theImage Mask Properties (page 139).
3 Click either Rectangular or Polygonal to draw the mask boundary. Youmust select at least three points to define a polygonal mask. Once youhave selected all the points, right-click and click Enter on the shortcutmenu.
The mask clips the images that are inside the mask boundary. Dependingon the properties you set for the mask, the images that are completelyoutside the mask boundary are hidden, unloaded, or unaffected.
NOTE You can have two enabled masks per drawing: one in model space andone in paper space. If you create more than one mask in model space or paperspace, then the most recently created mask is enabled, and all other masks in thatspace are disabled automatically. For more information, see Enabling or Disablinga Mask (page 141).
Quick Reference
Menu
Image ➤ Mask ➤ Create
Raster Design Toolbar
Command Line
imask
Creating a New Mask | 137

Dialog Box
New Image Mask Dialog Box (page 343)
Creating a New Mask Using the Command LineYou can bypass the New Image Mask (page 343) dialog box by typing -imaskon the command line.
To create a new mask using the command line
1 Enter -imask to display the following prompt:
New or [Select Image Mask]:
2 Enter n to create a new mask. The following prompt is displayed:
Enter an option [Polygon/Rectangular/prOperties/eXit]<eXit>:
3 Enter p to define a polygonal mask or enter r to define a rectangular mask.You must select at least three points to define a polygonal mask. Onceyou have selected all the points, right-click and click Enter on the shortcutmenu
The default mask properties are used to create the mask. For moreinformation, see Changing the Image Mask Properties (page 139).
See also:
■ Changing an Existing Mask Using the Command Line (page 140)
Quick Reference
Command Line
-imask
Dialog Box
New Image Mask Dialog Box (page 343)
Changing an Existing MaskYou can edit the vertices of a mask by selecting and moving them usingAutoCAD grips.
138 | Chapter 6 Modifying Images

You can add vertices to the boundary of an existing mask by selecting andmoving a midpoint of a mask boundary segment.
NOTE If you cannot see the image mask boundary, then enter REGEN to refreshthe AutoCAD display order.
You can use AutoCAD editing commands to move, rotate, stretch, erase, orscale a mask.
If you want to change how the mask affects the images that are outside themask boundary, then you can change the mask properties, disable the mask,or convert a mask to image clips.
Changing the Image Mask PropertiesBy changing the image mask properties, you can control what happens to theimages that are outside the mask boundary.
For example, you can:
■ Unload the images from memory to enhance performance.
■ Display image frames when you use a mask so you can easily see wherethe image(s) you masked are located.
■ Convert an existing mask to image clips.
■ Disable and enable a mask.
To change the image mask properties for a new mask
1 Click Image menu ➤ Mask ➤ Create.
2 You can clear the Enable Mask check box if you want to disable (turn off)a mask. When the mask is disabled, you can still edit the mask boundary,but the images are not affected until you enable the mask again. Onlyone mask in model space or paper space can be enabled at a time. Formore information, seeEnabling or Disabling a Mask (page 141)
3 Choose one of the following mask options:
■ Do Not Affect
■ Hide Image(s)
■ Unload Images
Changing an Existing Mask | 139

4 Select the Show Image Frame(s) check box if you want to show the framesof the images that are outside the mask object. This option is availableonly if the Hide Image(s) or Unload Image(s) option is selected.
NOTE If you used the AutoCAD IMAGEFRAME command to turn off imageframes in your drawing, then the Show Image Frame(s) check box isunavailable and you cannot show the image frames.
5 Click Close to save your changes.
Quick Reference
Menu
Image ➤ Mask ➤ Create
Raster Design Toolbar
Command Line
imask
Changing an Existing Mask Using the Command LineYou can bypass the New Image Mask (page 343) dialog box by typing -imaskat the command line.
To edit an existing mask using the command line
1 Enter -imask to display the following prompt:
New or [Select Image Mask]:
2 Select an existing mask from the drawing. The following prompt isdisplayed:
Enter an option [Polygonal/Rectangular/Convert/prOperties/eXit]<eXit>:
3 Do one of the following
■ Enter p to redefine the mask using a polygon.
■ Enter r to redefine the mask using a rectangle.
140 | Chapter 6 Modifying Images
■ Enter c to convert the mask to image clips.
■ Enter o to redefine mask properties. For more information, seeChanging the Image Mask Properties (page 139).
■ Enter x to exit the command.
Quick Reference
Command Line
-imask
Enabling or Disabling a MaskYou can have two enabled masks per drawing: one in model space and onein paper space.
If you create more than one mask in model space or paper space, the mostrecently created mask is enabled; all other masks in that space are disabledautomatically.
Effects of disabling a mask
The mask boundary is still visible in the drawing, but the images that crossthe mask boundary are not clipped. You can edit the mask boundary whenthe mask is disabled, but the affected images are not clipped until the maskis enabled again.
If you used the Hide Image(s) option for the mask, then the images that wereaffected by the mask are shown when you disable the mask.
If you used the Unload Image(s) option for the mask, then the images arereloaded when you disable the mask.
Effects of enabling a mask
The images are clipped and the mask properties control the display of theimages that are outside the mask boundary.
Only one mask in model space or paper space can be enabled. If you createmore than one mask, the most recently created mask is enabled automatically;all other masks in that space are disabled. If you manually enable a mask, thenall other masks are disabled automatically.
Changing an Existing Mask | 141
To enable or disable a mask
1 Select the mask boundary, then right-click to open the Properties dialogbox.
2 In the Properties dialog box, click Enabled in the Misc category.
3 Click Yes from the list to enable the mask, or No to disable the mask.
Quick Reference
Menu
Image ➤ Mask ➤ Create
Command Line
imask
Clipping an ImageYou can use the AutoCAD IMAGECLIP command to display a subregion ofone image.
A clip is a display-only feature that you can use for viewing and plottingpurposes. It does not permanently change image data.
The subregion is defined by a clip boundary. When you clip an image, partsof the image outside the clip boundary are hidden from view. You can turnoff the clip to redisplay the entire image. You can grip edit the clip boundariesto display more or less of the image. If the clip boundary encloses multipleimages, each one is handled as a separate clip.
The IMAGECLIP command works on AutoCAD images (bitonal, grayscale,index color or true color) and on Raster Design custom images (digital elevationmodels, single-band integer data, or multiband multispectral data).
The IMAGECLIP command works on AutoCAD images (bitonal, grayscale,index color or true color) and on Raster Design custom images.
NOTE To display a polygonal sub-region of more than one image, use the RasterDesign Mask command. For more information, see Creating a New Mask (page137). To permanently trim one or more images, use the Raster Design Cropcommand. For more information, see Cropping Images (page 144).
142 | Chapter 6 Modifying Images

To clip an image
1 Enter IMAGECLIP.
2 Select the image you want to clip. You can only clip one image at a time.
The following prompt is displayed:
Enter image clipping option [ON/OFF/Delete/New boundary] <New>:
3 Press Enter to create a new clip boundary.
4 Enter r to create a rectangular boundary, or enter p to create a polygonalboundary. You must select at least three points to define a polygonalmask. Once you have selected all the points, right-click and click Enteron the menu.
To restore the image, you can use the IMAGECLIP OFF command orDelete option. For more information, see the AutoCAD online Help.
You can also choose to show or hide clips by changing the image displayproperties in the Image Properties dialog box. For more information, see ImageDisplay Properties (page 58).
Quick Reference
Command Line
imageclip
Object Shortcut Menu
Image ➤ Clip
Converting a Mask to Image ClipsA mask is essentially a clip that can affect more than one image at a time.
If you want to remove a mask but preserve the clipping effect on the images,you can convert a mask to image clips.
To convert a mask to image clips
■ Click Image menu ➤ Mask ➤ Convert to Image Clip. Then select themask boundary.The mask is removed but the clips on the image(s) are preserved. After youconvert a mask to image clips, you may need to manually show or reload
Converting a Mask to Image Clips | 143

any images that were hidden or unloaded by the mask. To show imagesthat are hidden, you can select the image frame, then right-click and clickShow Image on the shortcut menu.
You can then use the AutoCAD IMAGECLIP command to turn off the clipsand change the clip boundary if desired. Any image that you insert intothe drawing after converting a mask is visible.
NOTE If you want to remove a mask boundary and restore all clipped images totheir extents, then use the AutoCAD ERASE command to erase the mask boundary.
Quick Reference
Menu
Image ➤ Mask ➤ Convert to Image Clip
Raster Design Toolbar
Command Line
imaskconvert
Cropping ImagesYou can crop raster data within an image or across multiple images.
The only images that are affected are those that are within or partly withinthe selected entity or area. When you crop an image, the image frame sizechanges to compensate for any removed border data.
Crops use the current transparency color. For example, if you perform a circularcrop on an image, then the area outside of the circle is filled with thetransparency color. If you later change the transparency color, the color ofthe cropped area remains the same, but any subsequent crops are drawn inthe new color. For more information, see Transparency Color of an Image(page 62).
144 | Chapter 6 Modifying Images

Line CroppingRemove all raster data except for a specific line segment by selecting a pointon each end of the raster line. You must set an appropriate line width for thecrop. For more information, see Rub and Crop Line Width (page 266).
To crop a raster line
1 Set an appropriate line width for the crop.
2 Click Image menu ➤ Crop ➤ Line.
3 Select the first point on the line.
4 Select the second point on the line to remove all the raster data exceptfor the selected line.
After the data is cropped, the image frame changes to reflect the new sizeof the image.
Quick Reference
Menu
Image ➤ Crop ➤ Line
Raster Design Toolbar
Command Line
icropline
Circular CroppingRemove all the raster data outside a defined circular region. The area outsidethe circle is filled with the transparency color. For more information, see,Transparency Color of an Image (page 62).
To crop raster data outside a circle
1 Click Image menu ➤ Crop ➤ Circular Region.
2 Select three points to define the circle around the raster data you wantto preserve.
Line Cropping | 145

Quick Reference
Menu
Image ➤ Crop ➤ Circular Region
Raster Design Toolbar
Command Line
icropcirc
Dialog Box
Bitonal Filters Dialog Box (page 302)
Rectangular CroppingRemove all the raster data outside a defined rectangular region, which can berotated at any angle.
To remove raster data outside a rectangle
1 Click Image menu ➤ Crop ➤ Rectangular Region.
2 Select a point that represents one corner of the rectangular crop region.A rubber-band line is displayed to help you establish the angle.
3 Pick a point at one corner of the raster data you want to preserve.
4 Pick a third point to define the final size of the rectangular region topreserve. The image is cropped to this region, and the image frame followsthe edge of the cropped region.
Quick Reference
Menu
Image ➤ Crop ➤ Rectangular Region
Raster Design Toolbar
146 | Chapter 6 Modifying Images

Command Line
icroprect
Diagonal CroppingRemove all the raster data outside a parallelogram.
To remove raster data outside a diagonal region
1 Click Image menu ➤ Crop ➤ Diagonal Region.
2 Select a starting point for the diagonal crop region. This point can be anycorner of the area that you want to preserve.
3 Select a second point to define one of the edges of the area you want topreserve.
A bounding parallelogram is displayed to help you select the next point.
4 Select the third point to complete the selection of the diagonal cropregion.
Quick Reference
Menu
Image ➤ Crop ➤ Diagonal Region
Raster Design Toolbar
Command Line
icropdiag
Polygonal CroppingRemove all the raster data outside a defined polygonal region.
To crop raster data outside a polygon
1 Click Image menu ➤ Crop ➤ Polygonal Region.
Diagonal Cropping | 147

2 Pick a minimum of three points around the raster data you want topreserve.
3 Right-click and click Enter to close the polygon.
Quick Reference
Menu
Image ➤ Crop ➤ Polygonal Region
Raster Design Toolbar
Command Line
icroppoly
Aligned Rectangular CroppingRemove all the raster data outside a rectangular region that is aligned at anyangle, while preserving the rotation angle of the original image.
To crop raster data outside an aligned rectangle
1 Click Image menu ➤ Crop ➤ Aligned Rectangular Region.
2 Pick a point at one corner of the raster data you want to preserve.
3 To define the baseline, pick a second point or enter a numeric angle inrelation to horizontal.
4 Pick a third point to define the final size of the rectangular region topreserve. The image is cropped to this region, but the image frame retainsthe angle of the original image at the time the crop was made.
Quick Reference
Menu
Image ➤ Crop ➤ Aligned Rectangular Region
148 | Chapter 6 Modifying Images

Command Line
icropalign
Removing (Rubbing) ImagesYou can rub raster data within an image or across multiple images.
Only the images that are within or partly within the selected entity or areaaffected.
Rubs use the current transparency color. For example, if the color fortransparency is blue, then the rub is drawn in blue. If you later change thetransparency color, the color of the rubbed area remains blue, but subsequentrubs are drawn in the new color. For more information, see, TransparencyColor of an Image (page 62).
You can also remove raster entities (lines, arcs, and circles) by using REM deletecommands or by using existing vector geometry. For more information, seeRemoving Raster Entities Using REM Commands (page 156).
NOTE Rubs permanently change the raster data in the image; they do nottemporarily remove raster data from the display. To reverse a rub, use the AutoCADUNDO command.
Rubbing a Raster LineYou can remove a raster line by picking a point on each end of the raster line.You must set an appropriate line width. For more information, see Rub andCrop Line Width (page 266).
NOTE Unlike previous versions of Raster Design, rubs permanently change theraster data after you have saved the image. They do not temporarily remove rasterdata from the display. To reverse a rub, use the AutoCAD UNDO command.
To rub a raster line
1 Set an appropriate line width for the rub.
2 Click Image menu ➤ Remove ➤ Line.
3 Select the first point on the raster line you want to remove.
4 Select the second point on the raster line to remove the line.
Removing (Rubbing) Images | 149

Quick Reference
Menu
Image ➤ Remove ➤ Line
Raster Design Toolbar
Command Line
irubline
Rubbing a Raster ArcYou can remove a raster arc by picking the start, center, and end points of theraster arc. You must set an appropriate line width. For more information, seeRub and Crop Line Width (page 266).
NOTE Unlike previous versions of Raster Design, rubs permanently change theraster data after you have saved the image. They do not temporarily remove rasterdata from the display. To reverse a rub, use the AutoCAD UNDO command.
To rub a raster arc
1 Set an appropriate line width for the rub.
2 Click Image menu ➤ Remove ➤ Arc.
3 Select the start point of the raster arc you want to remove.
4 Select the center point of the raster arc.
5 Select the end point of the raster arc to remove the raster arc.
Quick Reference
Menu
Image ➤ Remove ➤ Arc
Raster Design Toolbar
150 | Chapter 6 Modifying Images

Command Line
irubarc
Rubbing a Raster CircleYou can remove a raster circle that has a width (sometimes called a donut) bypicking three points on the circle. You must set an appropriate line width.For more information, see Rub and Crop Line Width (page 266).
NOTE Unlike previous versions of Raster Design, rubs permanently change theraster data after you have saved the image. They do not temporarily remove rasterdata from the display. To reverse a rub, use the AutoCAD UNDO command.
To rub a raster circle
1 Set an appropriate line width for the rub.
2 Click Image menu ➤ Remove ➤ Circle.
3 Select the center point of the raster circle you want to remove.
4 Select the second point to define the radius of the raster circle.
Quick Reference
Menu
Image ➤ Remove ➤ Circle
Raster Design Toolbar
Command Line
irubcircle
Rubbing Multiple Line SegmentsYou can remove more than one raster line segment at a time by using the RubPolyline command. You must set an appropriate line width. For moreinformation, see Rub and Crop Line Width (page 266).
Rubbing a Raster Circle | 151

NOTE Unlike previous versions of Raster Design, rubs permanently change theraster data after you have saved the image. They do not temporarily remove rasterdata from the display. To reverse a rub, use the AutoCAD UNDO command.
To rub multiple line segments
1 Set an appropriate line width for the rub.
2 Click Image menu ➤ Remove ➤ Polyline.
3 Select the first point of the line segment you want to rub.
4 Select the second point of the line segment you want to rub.
5 Do one of the following:
■ Select additional points to rub more line segments.
■ Right-click and click Enter to end the polyline and rub the rasterunderneath it.
■ Enter c when you have selected at least three vertices to draw a closedpolyline and rub the raster beneath it.
Quick Reference
Menu
Image ➤ Remove ➤ Polyline
Raster Design Toolbar
Command Line
irubpline
Rubbing Raster Data Within a Circular RegionYou can remove a circular area of your raster image.
NOTE Unlike previous versions of Raster Design, rubs permanently change theraster data after you have saved the image. They do not temporarily remove rasterdata from the display. To reverse a rub, use the AutoCAD UNDO command.
152 | Chapter 6 Modifying Images
To remove the raster data within a circular region
1 Click Image menu ➤ Remove ➤ Circular Region.
2 Select the center point of the raster circle you want to remove.
3 Select the second point to define the radius of the raster circle.
Quick Reference
Menu
Image ➤ Remove ➤ Circular Region
Raster Design Toolbar
Command Line
irubcirc
Rubbing Raster Data Within a Diagonal RegionYou can rub raster data within a diagonal parallelogram.
NOTE Unlike previous versions of Raster Design, rubs permanently change theraster data after you have saved the image. They do not temporarily remove rasterdata from the display. To reverse a rub, use the AutoCAD UNDO command.
To rub the raster data within a diagonal region
1 Click Image menu ➤ Remove ➤ Diagonal Region.
2 Select a starting point for the diagonal region. This point can be anycorner of the area you want to remove.
3 Select a second point to define one of the edges of the region you wantto remove.
4 A bounding parallelogram is displayed to help you select the next point.
5 Select the third point to remove data within the diagonal rectangle orparallelogram.
Rubbing Raster Data Within a Diagonal Region | 153

Quick Reference
Menu
Image ➤ Remove ➤ Diagonal Region
Raster Design Toolbar
Command Line
irubdiag
Rubbing Raster Data Within a Polygonal RegionYou can remove raster data by defining a polygon around the data you wantto remove.
NOTE Unlike previous versions of Raster Design, rubs permanently change theraster data after you have saved the image. They do not temporarily remove rasterdata from the display. To reverse a rub, use the AutoCAD UNDO command.
To remove the raster data within a polygonal region
1 Click Image menu ➤ Remove ➤ Polygonal Region.
2 Select a minimum of three points around the raster data you want toremove.
3 Right-click to close the polygon and remove the data within the polygon.
Quick Reference
Menu
Image ➤ Remove ➤ Polygonal Region
Raster Design Toolbar
Command Line
irubpoly
154 | Chapter 6 Modifying Images

Rubbing Raster Data Within a Rectangular RegionYou can rub raster data within a rectangular region.
NOTE Unlike previous versions of Raster Design, rubs permanently change theraster data after you have saved the image. They do not temporarily remove rasterdata from the display. To reverse a rub, use the AutoCAD UNDO command.
To rub the raster data within a rectangular region
1 Click Image menu ➤ Remove ➤ Rectangular Region.
2 Select a starting point for the rectangle.
3 Select the opposite corner of the rectangle to remove data within therectangle.
Quick Reference
Menu
Image ➤ Remove ➤ Rectangular Region.
Raster Design Toolbar
Command Line
irubrect
Remove Raster Using Existing Vector GeometryThe Remove Raster Under Vector tool allows you use existing vector geometryto remove portions of the underlying raster image.
For instance, you could use AutoCAD tools to trace a complex spline in yourimage, then use the Remove Raster Under Vector tool to remove the tracedraster.
Depending on the settings in the Raster Design Options (page 351) dialog box,the removal is accomplished using either rub (page 395) or raster entitymanipulation (REM) methods. If you choose the REM removal method, rasterintersections are preserved. For more information, see Remove Under Method(page 268).
Rubbing Raster Data Within a Rectangular Region | 155

NOTE The Remove Raster Under Vector tool does not remove raster data withinthe selected vector, only around the selected vector. For instance, using a vectorpolygon will only remove the raster around the polygon segments, ignoring theraster data within the interior of the polygon.
To remove raster data using existing vector geometry
1 Click Image menu ➤ Remove ➤ Raster Under Vector.
2 Select the vector geometry to remove that portion of the underlying rasterimage.
NOTE A faster way to use the Remove Raster Under Vector tool is to selectthe vector entity, then right-click and click Remove Raster Underneath.
Quick Reference
Menu
Image ➤ Remove ➤ Raster Under Vector
Raster Design Toolbar
Command Line
irmvexisting
Removing Raster Entities Using REM CommandsYou can remove raster lines, arcs, and circles from bitonal images using rasterentity manipulation (REM) delete commands.
When you remove raster entities using these commands, Raster Designautomatically cleans up intersections with other raster entities. For example,if you remove a line that bisects a circle, no gap is left in the circle where theline was removed.
In the following illustration, the left displays REM primitive line (shown inred). The illustration on the right shows how the image appears after theprimitive line is deleted. The intersections with the circles and vertical lineare preserved.
156 | Chapter 6 Modifying Images
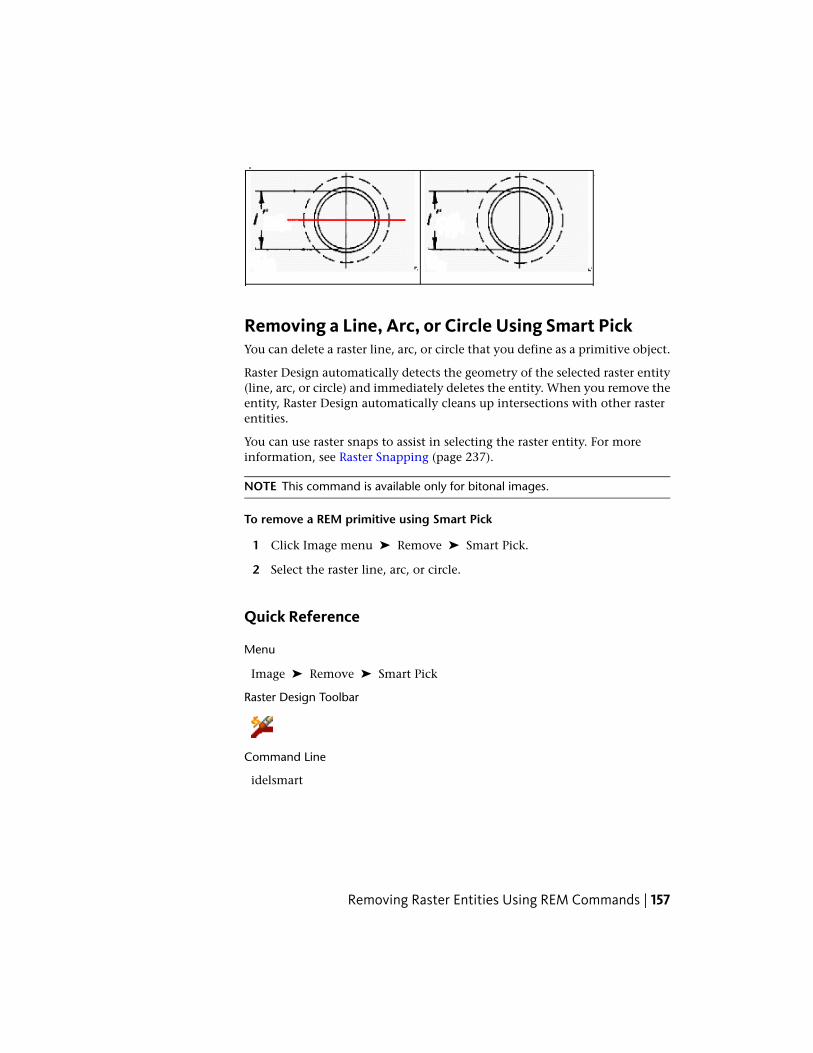
Removing a Line, Arc, or Circle Using Smart PickYou can delete a raster line, arc, or circle that you define as a primitive object.
Raster Design automatically detects the geometry of the selected raster entity(line, arc, or circle) and immediately deletes the entity. When you remove theentity, Raster Design automatically cleans up intersections with other rasterentities.
You can use raster snaps to assist in selecting the raster entity. For moreinformation, see Raster Snapping (page 237).
NOTE This command is available only for bitonal images.
To remove a REM primitive using Smart Pick
1 Click Image menu ➤ Remove ➤ Smart Pick.
2 Select the raster line, arc, or circle.
Quick Reference
Menu
Image ➤ Remove ➤ Smart Pick
Raster Design Toolbar
Command Line
idelsmart
Removing Raster Entities Using REM Commands | 157
Removing a REM Line PrimitiveYou can delete a raster line that you define as a primitive object.
When you remove the line, Raster Design automatically cleans up theintersections of the line with other raster entities.
You can use raster snaps to assist in selecting the raster line. For moreinformation, see Raster Snapping (page 237).
NOTE This command is available only for bitonal images.
To remove a REM line primitive
1 Click Image menu ➤ Remove ➤ Line Entity.
2 Select the raster line using one of the following methods
■ Select a single point on the line.
■ Enter 2p and select the start and end points of the raster line.
Quick Reference
Menu
Image ➤ Remove ➤ Line Entity
Raster Design Toolbar
Command Line
idelline
Removing a REM Arc PrimitiveYou can delete a raster arc that you define as a primitive object.
When you remove the arc, Raster Design automatically cleans up theintersections of the arc with other raster entities.
You can use raster snaps to assist in selecting the raster arc. For moreinformation, see Raster Snapping (page 237).
158 | Chapter 6 Modifying Images

NOTE This command is available only for bitonal images.
To remove a REM arc primitive
1 Click Image menu ➤ Remove ➤ Arc Entity.
2 Select the raster arc using one of the following methods
■ Select a single point on the arc.
■ Enter c and then select the center point, the start point, and the endpoint. Instead of selecting the end point, you can also enter a andspecify the angle, or you can enter l (lowercase L) and specify thechord length.
■ Enter 3p and select the start point, the second point, and the endpoint of the arc.
Quick Reference
Menu
Image ➤ Remove ➤ Arc Entity
Raster Design Toolbar
Command Line
idelarc
Removing a REM Circle PrimitiveYou can delete a raster circle that you define as a primitive object.
When you remove the circle, Raster Design automatically cleans up theintersections of the circle with other raster entities.
You can use raster snaps to assist in selecting the raster circle. For moreinformation, see Raster Snapping (page 237).
NOTE This command is available only for bitonal images.
Removing Raster Entities Using REM Commands | 159

To remove a REM circle primitive
1 Click Image menu ➤ Remove ➤ Circle Entity.
2 Select the raster circle using one of the following methods
■ Select a single point on the circle.
■ Enter 2p and select two points to define the diameter of the circle.
■ Enter 3p and select three points on the circumference.
Quick Reference
Menu
Image ➤ Remove ➤ Circle Entity
Raster Design Toolbar
Command Line
idelcircle
Merging ObjectsYou can use Raster Design to merge objects in the following ways:
■ Merge any number of images together.
■ Merge vector into a new or existing raster image.
Merging ImagesYou can merge images by selecting the destination image you want to mergesource images into.
Raster Design merges your source images into a single destination image. Theproperties of your destination image, such as dpi and color depth will notchange as a result of the merge. The merge will also respect any polygonalclip boundaries you have set, as well as brightness and contrast resolutions.
160 | Chapter 6 Modifying Images
For example, if your source image has a value of 200 dpi, and your destinationimage has the value of 400 dpi, the destination image will retain the value of400 dpi after you have performed a merge.
The destination image is expanded to encompass your source image(s). Thebackground will be filled with the transparency color. You can change thetransparency color in your image. For more information, see TransparencyColor of an Image (page 62).
To merge images together
1 Click Image menu ➤ Merge ➤ Images.
2 Select your source images.
3 Select your destination image.
You are prompted whether to remove the source images after the merge.
4 Click Yes to start the merge process.
Quick Reference
Menu
Image ➤ Merge ➤ Images
Raster Design Toolbar
Command Line
iimerge
Merging Vectors into a Raster ImageMerging vectors creates a raster equivalent of a vector entity.
When working with a hybrid (page 391) drawing you can merge vectors intoan existing image or a new raster image. Vector merge allows you to makeprecise changes to your raster image with AutoCAD, while keeping your datain a raster format.
NOTE Vector merge can only operate on a single image at a time.
Merging Vectors into a Raster Image | 161

To merge vectors into a raster image
1 To display the Select objects prompt at the command line, click Imagemenu ➤ Merge ➤ Vector into Raster.
2 Select the vectors and image you want to merge.
You are prompted to delete vectors if the Prompt to Delete Vectors checkbox is selected on the Vector Merge tab in the Raster Design Options(page 351) dialog box. For more information, see Vector Merge Settings(page 268).
3 Press Enter to start the vectors merge operation
NOTE A quick way of merging vector into raster using the default mergesettings is to right-click the selected vector entities, then click Merge Vectorto Raster Image on the shortcut menu. However, you should ensure thePrompt to Delete Vectors check box is not selected on the Vector Merge tabin the Raster Design Options dialog box.
Quick Reference
Menu
Image ➤ Merge ➤ Vector into Raster
Raster Design Toolbar
Command Line
ivmerge
Selecting Pen Widths for Vector MergeYou can select widths for Raster Pen for vector merge by specifying penthickness in the Raster Pen Settings (page 363) dialog box.
To select raster pen widths for vector merge
1 Click Image menu ➤ Merge ➤ Configure Raster Pens.
The Raster Pen Settings (page 363) dialog box is displayed.
162 | Chapter 6 Modifying Images

NOTE Enter -rpens to access the command line interface.
2 On the Color Index list, select the color(s) for which you want to modifythe line width.
3 Enter the width you want in the Pen Width edit box, or select the UseFixed Width check box, then enter the width you want to apply to all ofthe raster pens in the Pen Width edit box
4 Click OK to close the dialog and apply the raster pen settings.
See also:
■ Raster Pen Settings Dialog Box (page 363)
Quick Reference
Menu
Image ➤ Merge ➤ Configure Raster Pens
Raster Design Toolbar
Command Line
rpens
Dialog Box
Raster Pen Settings Dialog Box (page 363)
Selecting Pen Widths for Vector Merge | 163

164
Raster Entity Manipulation
You can use Raster Entity Manipulation (REM) to edit raster entities in bitonal, color, andgrayscale images.
For example, you can adjust the radius of a raster circle, remove some dimension lines on amechanical drawing, or copy electrical symbols from one image to another.
You use REM commands to define raster entities as REM objects. After defining the REMobjects, you can use either AutoCAD commands or Raster Design commands to operate onthe objects in the same way you work with vector objects. You can merge the modified rasterdata into the existing image or create a new image from the data.
Types of REM Objects
There are three types of REM objects:
■ Region. Use a region object to select all of the pixels within the given geometry, whetheror not the pixels make up individual raster entities. You can define region objects for allimage types (bitonal image (page 382), grayscale image (page 390), and clipped image (page383)). A region can be rectangular, polygonal, diagonal, or circular.
■ Enhanced Bitonal Region. On bitonal images, use an enhanced bitonal region toautomatically select complete raster entities.
■ Primitive. Use a primitive object to select individual raster lines, circles, or arcs. Primitivesare more intelligent than regions and enhanced bitonal regions because their dimensionscan be changed. For example, you can change the diameter of a circle and still have itmaintain its original line width. You can also use grips or the Properties dialog box tochange the dimensions of a primitive object. For more information, see AutoCAD Propertiesof REM Objects (page 167).
7
165

Characteristics of REM ObjectsIn most respects, REM objects are similar to other AutoCAD objects. However,some behavior and characteristics of REM objects are specific to their functionin Raster Design.
How REM Objects Are Associated with an ImageWhen you create a REM object, it is associated with an image. Any AutoCADcommand that changes the geometry or location of a REM object causes theREM object to dissociate from the image. Such commands include MOVE,SCALE, ROTATE, and ERASE. REM Smooth also causes a dissociation. For moreinformation, see Smoothing REM Linework (page 194).
If the geometry or location of your source image changes, the associated REMobjects adjust accordingly. For example, if you move an image to a newlocation, all the REM objects associated with the image move with it and arenot deleted. If an image is erased or unloaded, all the REM objects associatedwith it are also erased.
If you define a rectangular region as a REM object and then move it, theoriginal raster data in the source image is deleted.
If your REM primitive or enhanced bitonal region is defined over anintersection, the intersection is preserved even after you MOVE the primitiveobject.
NOTE REM region and primitive objects that are dissociated from an image cannotbe refined.
In order to save your changes to your REM objects, you must either merge theobjects into an image, or create a new raster image from the objects. For moreinformation, see Merging REM Objects into an Image (page 198) and ConvertingREM Objects to a New Raster Image (page 199).
REM objects cannot be plotted.
Deciding Which Image to Use REM Commands OnThere are only two conditions under which REM cannot automaticallydetermine what image to acquire data from:
■ Overlapping images: One image overlaps the other, and the geometry forthe REM object is within or touching both images.
166 | Chapter 7 Raster Entity Manipulation

■ Adjacent images: One image is tiled next to another, and the geometry forthe REM object is within or touching both images.
Raster Design prompts you to select one or more images to operate on. If youare defining a region object, you can select multiple images and a REM objectis created for each image. If you are defining an enhanced bitonal region objector a primitive object, you can select only one image when prompted.
AutoCAD Properties of REM ObjectsSome AutoCAD properties apply differently to REM objects than to otherAutoCAD objects:
■ Color: REM objects do not respond to the AutoCAD Properties color setting.Instead, you can use the Raster Design Options (page 351) dialog box toselect the color of all REM objects. For more information, see AutoCADProperties (page 57) and REM Settings (page 265).
■ Layer: REM objects are created on the current AutoCAD layer by default.However, you can specify any layer.
■ Linetype: The vector boundary of a REM object is always displayed withthe current AutoCAD linetype. You can, however, change the linetype ofthe raster data of a REM primitive object. For more information, seeChanging the Linetype of a Primitive Object (page 186).
■ Width: Allows you to change the line width of the raster entity.
REM Objects and Non-REM EditsYou cannot use Raster Design commands that apply to an entire image if REMobjects are associated with the image. Such commands include Despeckle,Mirror, Invert, Histogram, and Crop. Commands that operate on a sub-regionof an image are allowed only if the bounding box of the edit operation doesnot overlap any REM objects.
When you create REM objects in an image, you must finish all REM edits andmerge, convert, or remove all REM objects before you can do any raster editing.
If you attempt to perform a non-REM edit that overlaps a REM object, theRaster Design Edit Status (page 310) dialog box is displayed. Clear the REMobjects or merge the objects into the image before editing the entire image.
AutoCAD Properties of REM Objects | 167
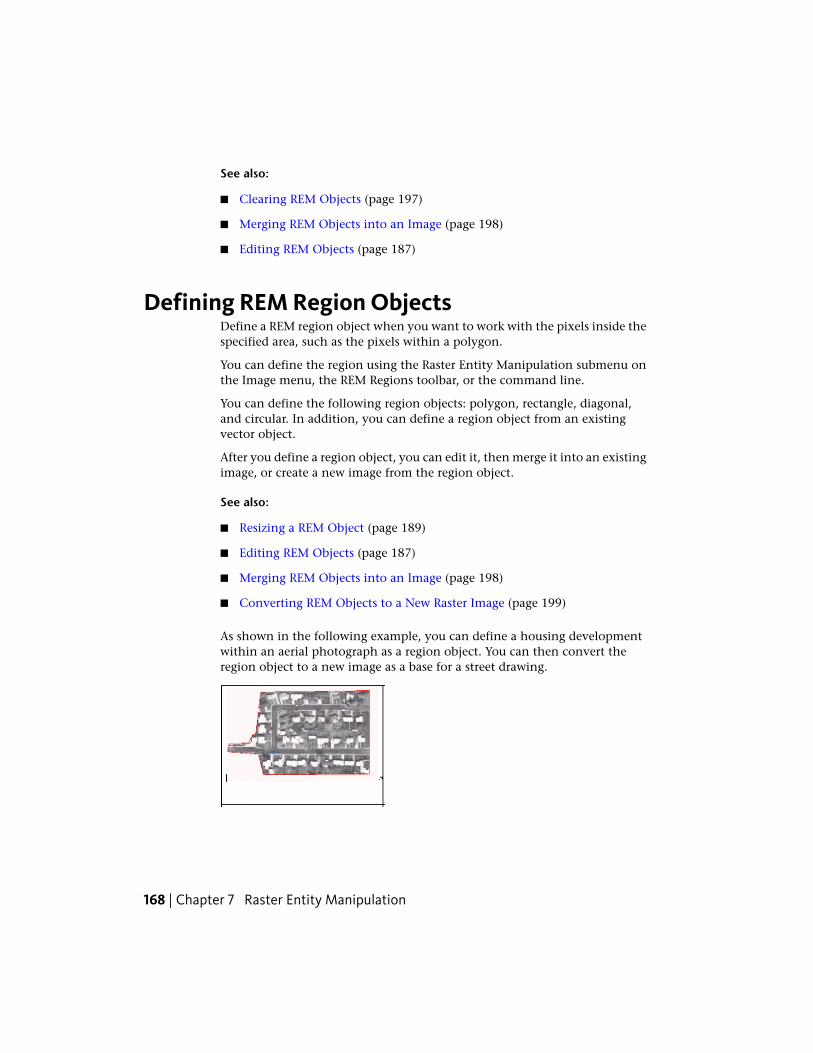
See also:
■ Clearing REM Objects (page 197)
■ Merging REM Objects into an Image (page 198)
■ Editing REM Objects (page 187)
Defining REM Region ObjectsDefine a REM region object when you want to work with the pixels inside thespecified area, such as the pixels within a polygon.
You can define the region using the Raster Entity Manipulation submenu onthe Image menu, the REM Regions toolbar, or the command line.
You can define the following region objects: polygon, rectangle, diagonal,and circular. In addition, you can define a region object from an existingvector object.
After you define a region object, you can edit it, then merge it into an existingimage, or create a new image from the region object.
See also:
■ Resizing a REM Object (page 189)
■ Editing REM Objects (page 187)
■ Merging REM Objects into an Image (page 198)
■ Converting REM Objects to a New Raster Image (page 199)
As shown in the following example, you can define a housing developmentwithin an aerial photograph as a region object. You can then convert theregion object to a new image as a base for a street drawing.
168 | Chapter 7 Raster Entity Manipulation

Grip Behavior
Each vertex of a polygonal, rectangular, or diagonal region object has a gripyou can use to select the object. Moving a grip moves the object.
A circular region object has five grips: one at the center of the circle and fourgrips on the circumference.
If you stretch either the start or end grip point of a line, Raster Design redrawsthe line with the new start or end point, respecting the original line width.When the line is redrawn, Raster Design uses the current AutoCAD linetype.
If you stretch any of the grip points of an arc, Raster Design redraws the arc'sstart, end, and radius, respecting the original line width. When the arc isredrawn, Raster Design uses the current AutoCAD linetype.
NOTE This grip behavior does not apply when you are in REM define mode.
Defining a REM Rectangular RegionA rectangular region object includes all the pixels within the rectangle youdefine.
Click here to see an illustration of raster data selected within a rectangle.
All of the raster data within the defined rectangle is selected.
See also:
■ Resizing a REM Object (page 189)
■ Editing REM Objects (page 187)
■ Merging REM Objects into an Image (page 198)
■ Converting REM Objects to a New Raster Image (page 199)
Defining a REM Rectangular Region | 169
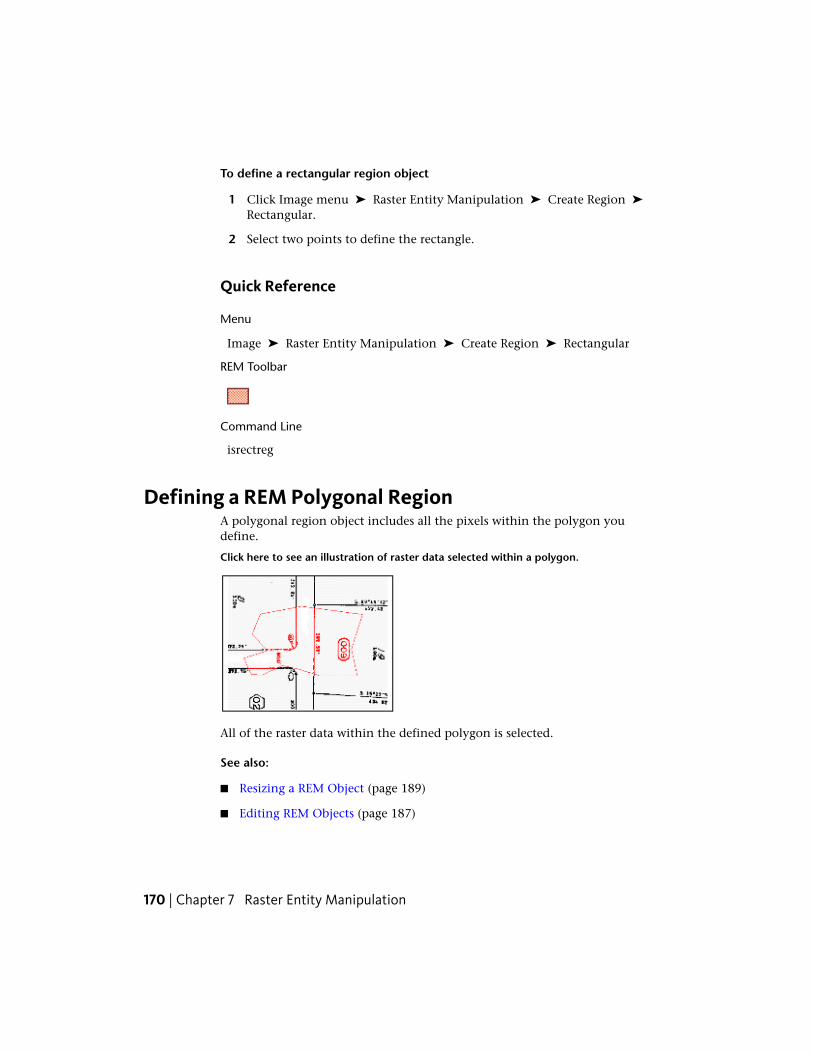
To define a rectangular region object
1 Click Image menu ➤ Raster Entity Manipulation ➤ Create Region ➤
Rectangular.
2 Select two points to define the rectangle.
Quick Reference
Menu
Image ➤ Raster Entity Manipulation ➤ Create Region ➤ Rectangular
REM Toolbar
Command Line
isrectreg
Defining a REM Polygonal RegionA polygonal region object includes all the pixels within the polygon youdefine.
Click here to see an illustration of raster data selected within a polygon.
All of the raster data within the defined polygon is selected.
See also:
■ Resizing a REM Object (page 189)
■ Editing REM Objects (page 187)
170 | Chapter 7 Raster Entity Manipulation

■ Merging REM Objects into an Image (page 198)
■ Converting REM Objects to a New Raster Image (page 199)
To define a polygonal region object
1 Click Image menu ➤ Raster Entity Manipulation ➤ Create Region ➤
Polygonal.
2 Select points to define the polygon and then press Enter to close it.
Quick Reference
Menu
Image ➤ Raster Entity Manipulation ➤ Create Region ➤ Polygonal
REM Toolbar
Command Line
ispolyreg
Defining a REM Diagonal RegionA diagonal region object includes all of the pixels within the diagonal areayou define.
The diagonal region is a parallelogram that you define with three points. Youcan move the third point to control the final shape of the region.
Click here to see an illustration of raster data selected within a diagonal region.
Defining a REM Diagonal Region | 171

All of the raster data within the defined diagonal region is selected.
See also:
■ Resizing a REM Object (page 189)
■ Editing REM Objects (page 187)
■ Merging REM Objects into an Image (page 198)
■ Converting REM Objects to a New Raster Image (page 199)
To define a diagonal region object
1 Click Image menu ➤ Raster Entity Manipulation ➤ Create Region ➤
Diagonal.
2 Select points for the first corner point, the adjacent corner point, and thelast corner point.
Quick Reference
Menu
Image ➤ Raster Entity Manipulation ➤ Create Region ➤ Diagonal
REM Toolbar
Object Shortcut Menu
Right-click image ➤ REM ➤ Create ➤ Diagonal Region
Command Line
isdiagreg
Defining a REM Circular RegionA circular region object includes all of the pixels within the circle you define.
172 | Chapter 7 Raster Entity Manipulation

Click here to see an illustration of raster data selected within a circular region.
All of the raster data within the defined circular region is selected.
See also:
■ Resizing a REM Object (page 189)
■ Editing REM Objects (page 187)
■ Merging REM Objects into an Image (page 198)
■ Converting REM Objects to a New Raster Image (page 199)
To define a circular region object
1 Click Image menu ➤ Raster Entity Manipulation ➤ Create Region ➤
Circular.
2 Do one of the following:
■ Select the center point and one point on the circumference.
■ Type 3P and select three points on the circumference.
Quick Reference
Menu
Image ➤ Raster Entity Manipulation ➤ Create Region ➤ Circular
REM Toolbar
Defining a REM Circular Region | 173

Object Shortcut Menu
Right-click image ➤ REM ➤ Create ➤ Circular Region
Command Line
iscircreg
Defining a Region From an Existing Vector ObjectYou can define a region object using the geometry of an existing vector object,such as a polyline, rectangle, circle, or ellipse.
For example, you may have a vector circle corresponding to a 5-mile radiuswhere an all-vegetation area will be affected by a contamination spill. Youcan select the vector circle to define a circular region object corresponding toall the raster data within the circle.
See also:
■ Resizing a REM Object (page 189)
■ Editing REM Objects (page 187)
■ Merging REM Objects into an Image (page 198)
■ Converting REM Objects to a New Raster Image (page 199)
To define a region from an existing vector object
1 Click Image menu ➤ Raster Entity Manipulation ➤ Create Region ➤
From Existing Vector.
2 Select the closed vector object.
Quick Reference
Menu
Image ➤ Raster Entity Manipulation ➤ Create Region ➤ From ExistingVector
REM Toolbar
174 | Chapter 7 Raster Entity Manipulation

Object Shortcut Menu
Right-click image ➤ REM ➤ Create ➤ From Existing Vector
Command Line
iregfromvec
Removing Part of a Region ObjectYou can remove part of a selected region object using a variety of methodsthat specify subregions, individual entities, or a series of connected entities.
For example, you may have selected a shaft as a circular region object andwould like to remove a drill hole from that shaft before moving the shaft. Youcan do this by defining a REM circular region to remove the drill hole fromthe region object.
The removal process is the same for all REM region objects, including enhancedbitonal regions.
NOTE You cannot remove an enhanced bitonal region object or a primitive objectfrom a REM object in a grayscale or color image.
Removing has two main purposes:
■ If a region is associated, it deselects raster data in the REM object so thatwhen the object is dissociated, the deselected data remains in the originalimage.
■ If a region is dissociated, it removes raster data so that when the object ismerged into an image or converted to a raster image, the removed datawill not be present.
Removal Methods
You can use the following methods to specify what to remove from the REMregion:
■ Select an individual raster entity for removal, using menu selections Line,Circle, Arc, or Smart Pick. Smart Pick is recommended if the entity is notspecifically a line, circle, or arc.
■ Define a subregion using one of the menu selections Rectangle, Polygon,Diagonal, or Circle. This method works with pixels rather than rasterentities, and removes all pixels within the area you define.
Removing Part of a Region Object | 175
■ Create an enhanced bitonal region object to select one or more rasterentities. For more information, see Defining REM Enhanced Bitonal Regions(page 176).
To remove part of a region object
1 Select the region object you want to modify.
2 Right-click, click Remove, and select a removal method. For moreinformation on the methods, see Defining REM Enhanced Bitonal Regions(page 176).
3 Define the area that you want to remove from the first REM object.
Quick Reference
Menu
Image ➤ Raster Entity Manipulation ➤ Remove Data From Region
REM Toolbar
Object Shortcut Menu
Right-click REM region ➤ Remove ➤ (select removal method)
Command Line
iremove
Defining REM Enhanced Bitonal RegionsDefine a REM enhanced bitonal region when you want to select completeraster entities within a bitonal image.
For example, you might be working with an image of a mechanical drawingthat contains a plan view of a cylinder. You want to scale the size of thecylinder hole to make it larger. You can accomplish this by selecting thecylinder as an enhanced bitonal region object. You can then use this objectto quickly scale the size of the cylinder, without touching any other part ofthe image.
176 | Chapter 7 Raster Entity Manipulation

See also:
■ Editing REM Objects (page 187)
■ Merging REM Objects into an Image (page 198)
■ Converting REM Objects to a New Raster Image (page 199)
NOTE You can define enhanced bitonal region objects only in bitonal images.
An enhanced bitonal region is defined by the selection method you choose,based either on smart objects or connected objects.
Smart Objects
Use this type of object to select complete raster entities such as lines, arcs,circles, polygons, or text characters in a region. You can define the region bydrawing a rectangular window or a polygon. Use a crossing window or polygonif you want to include entities that cross the region boundary. You can alsodraw a smart polyline or fence to select entities that touch the fence. Forfurther information, including illustrated examples of smart object selection,see the following Glossary links: smart crossing polygon, smart crossing window,smart fence (page 397), smart window (page 397), smart window polygon.
Connected Objects
Use this type of object to select complete raster entities based on how theyare connected to each other. This approach makes it easier to either select orexclude a connected series of entities. You can select entities that are connectedto an entity you select or to a region you define. You can define the regionby drawing a rectangular window or a polygon. Use a crossing window orpolygon if you want to include entities that cross the region boundary or areconnected to such entities. You can also draw a connected polyline or fenceto select entities that touch the fence and all entities connected to theseentities. For further information, including illustrated examples of connectedobject selection, see the following Glossary links: connected crossing polygon,connected crossing window, connected entity (page 385), connected fence (page385), connected window (page 386), connected window polygon.
Grip Behavior
A REM enhanced bitonal region object has four grips, one at each vertex.Select a grip to move the object.
Defining REM Enhanced Bitonal Regions | 177
To define a REM enhanced bitonal region
1 From the Menu Browser, click Image menu ➤ Raster EntityManipulation ➤ Create Enhanced Bitonal Region. Then click the selectionmethod. For more information on the methods, see Smart Objects (page177) and Connected Objects (page 177).
2 Select one or more points to define the set of entities in the region.
Quick Reference
Menu
From the Menu Browser, clickImage ➤ Raster Entity Manipulation ➤ CreateEnhanced Bitonal Region. (Then click Smart Window or other selectionmethod.)
Object Shortcut Menu
Right-click image ➤ REM ➤ Create. (Then click Smart Window or otherselection method.)
Command Line
isebrsmart (for smart object)isebrcon (for connected object)then one of the following selection methods:w (for window)c (for crossing window)wp (for window polygon)cp (for crossing polygon)f (for fence)e (for connected entities, used only with isebrcon)
Defining REM Primitive ObjectsYou can define a REM primitive object (line, arc, or circle) whenever you needto edit or move a raster entity.
For example, you may need to move a lot line in a parcel map. You can selectthe lot line as a primitive object, and use the AutoCAD MOVE command tomove the line to a new location.
178 | Chapter 7 Raster Entity Manipulation

See also:
■ Resizing a REM Object (page 189)
■ Editing REM Objects (page 187)
■ Merging REM Objects into an Image (page 198)
■ Converting REM Objects to a New Raster Image (page 199)
NOTE Using an AutoCAD command such as MOVE causes the primitive objectto be different from the original image. Raster Design erases the original rasterdata from the source image. For more information, see How REM Objects AreAssociated with an Image (page 166).
You can define three primitive objects: lines, arcs, and circles. You can alsouse two other methods:
■ The Smart Pick command automatically detects the geometry of the selectedraster entity and defines the entity as a primitive line, arc, or circle.
■ Define a primitive object using the geometry of an existing vector line,arc, or circle.
If your REM primitive is defined over an intersection, the intersection ispreserved even after you move the primitive object.
Click here to see an illustration of a lot line (shown in red) defined as a REM primitiveline.
NOTE You cannot remove subsections of a primitive object.
Grip behavior depends on the primitive object you define:
■ A line has three grips: one at the start, one at the end, and one in the centerof the line. Grip editing a REM line is the same as editing an AutoCAD
Defining REM Primitive Objects | 179

line. If you stretch an end grip point, Raster Design redraws the line withthe new endpoint, respecting the original width. If the line is redrawn,Raster Design uses the current linetype. If you move the center grip, theentire object moves.
■ A circle has five grips: one at the center of the circle and four on thecircumference. Grip editing a REM circle is the same as editing an AutoCADcircle. If you move the center grip, the entire circle moves. If you moveone of the grips on the circumference, the radius changes. If you changethe radius of the circle, Raster Design redraws the circle using the currentlinetype but preserving the original width.
■ An arc has three grips: at the start, end, and midpoint of the arc. Gripediting a REM arc is the same as editing an AutoCAD arc. If you stretch agrip point, the arc is redrawn with its new start, end, and radius, respectingthe original width. If the arc is redrawn, Raster Design uses the currentlinetype.
Defining a REM Line PrimitiveYou can define a line primitive when you need to edit or move a raster lineentity.
You can use raster snaps to select the raster line. For more information, seeRaster Snapping (page 237).
See also:
■ Resizing a REM Object (page 189)
■ Editing REM Objects (page 187)
■ Merging REM Objects into an Image (page 198)
■ Converting REM Objects to a New Raster Image (page 199)
180 | Chapter 7 Raster Entity Manipulation

Click here to see an illustration of selecting a raster line (shown in red).
To define a REM line primitive
1 Click Image menu ➤ Raster Entity Manipulation ➤ Create Primitive ➤ Line.
2 Select the raster line using one of the following methods:
■ Select a single point on the line.
■ Type 2p, and select the start and end points of the raster line.
Quick Reference
Menu
Image ➤ Raster Entity Manipulation ➤ Create Primitive ➤ Line
REM Toolbar
Object Shortcut Menu
Right-click image ➤ REM ➤ Create ➤ Line
Command Line
isline
Defining a REM Circle PrimitiveYou can define a circle primitive when you need to edit or move a raster circleentity.
Defining a REM Circle Primitive | 181

You can use raster snaps to select the raster circle. For more information, seeRaster Snapping (page 237).
See also:
■ Resizing a REM Object (page 189)
■ Editing REM Objects (page 187)
■ Merging REM Objects into an Image (page 198)
■ Converting REM Objects to a New Raster Image (page 199)
Click here to see an illustration of selecting a raster circle (shown in red).
To define a REM circle primitive
1 Click Image menu ➤ Raster Entity Manipulation ➤ Create Primitive ➤ Circle.
2 Define the raster circle using one of the following methods:
■ Select a single point on the circle.
■ Type c and select a center point.
■ Type 2p and select two points to define the diameter.
■ Type 3p and select three points on the circumference.
Quick Reference
Menu
Image ➤ Raster Entity Manipulation ➤ Create Primitive ➤ Circle
182 | Chapter 7 Raster Entity Manipulation
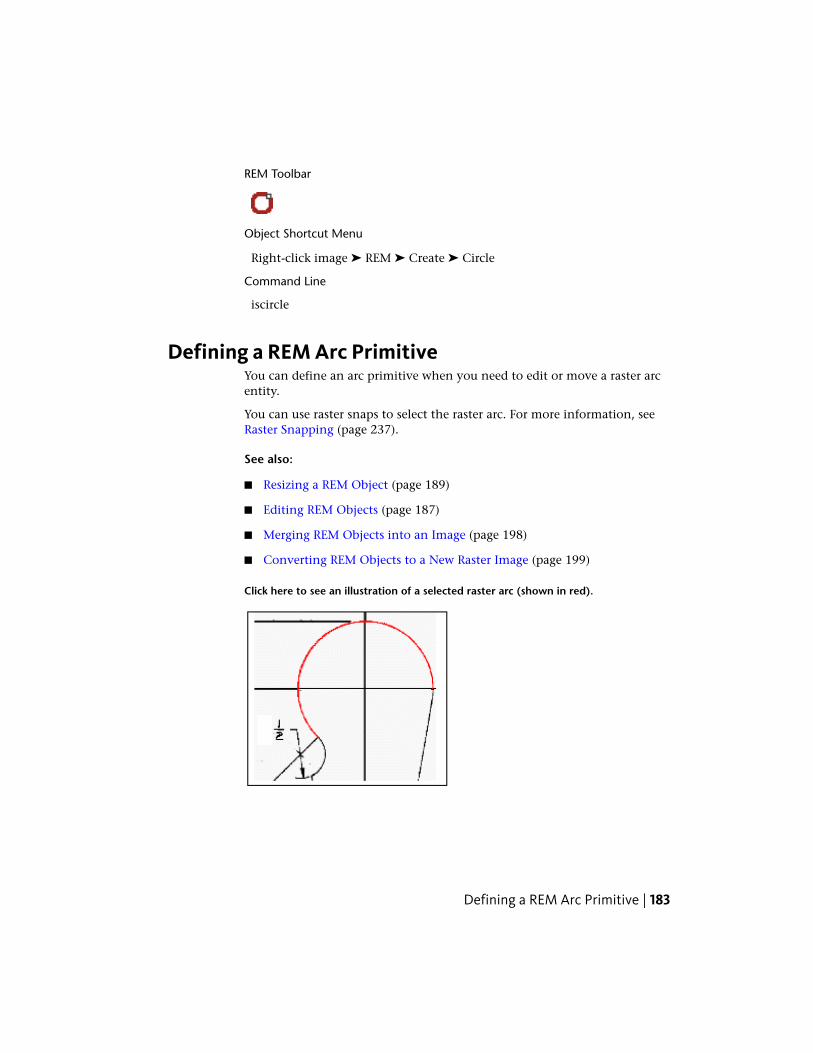
REM Toolbar
Object Shortcut Menu
Right-click image ➤ REM ➤ Create ➤ Circle
Command Line
iscircle
Defining a REM Arc PrimitiveYou can define an arc primitive when you need to edit or move a raster arcentity.
You can use raster snaps to select the raster arc. For more information, seeRaster Snapping (page 237).
See also:
■ Resizing a REM Object (page 189)
■ Editing REM Objects (page 187)
■ Merging REM Objects into an Image (page 198)
■ Converting REM Objects to a New Raster Image (page 199)
Click here to see an illustration of a selected raster arc (shown in red).
Defining a REM Arc Primitive | 183
To define a REM arc primitive
1 Click Image menu ➤ Raster Entity Manipulation ➤ Create Primitive ➤ Arc.
2 Select the raster arc using one of the following methods:
■ Select a single point on the arc.
■ Type c and then select the center point, the start point, and the endpoint. Instead of selecting the end point, you can also type a andspecify the angle, or you can type l (lowercase L) and specify the chordlength.
■ Type 3p and select the start point, a second point, and the end pointof the arc.
Quick Reference
Menu
Image ➤ Raster Entity Manipulation ➤ Create Primitive ➤ Arc
REM Toolbar
Object Shortcut Menu
Right-click image ➤ REM ➤ Create ➤ Arc
Command Line
isarc
Defining a REM Primitive Using Smart PickWhen you use Smart Pick to define a primitive object, Raster Designautomatically detects the geometry of the selected raster entity and definesthe entity as a primitive line, arc, or circle.
Results of using Smart Pick can be unpredictable where pixels do not clearlydefine raster entities. For example, Smart Pick may detect an arc instead of afull circle, or a line length may differ from what you expect.
184 | Chapter 7 Raster Entity Manipulation

You can use raster snaps to select the raster line, circle, or arc. For moreinformation, see Raster Snapping (page 237).
See also:
■ Resizing a REM Object (page 189)
■ Editing REM Objects (page 187)
■ Merging REM Objects into an Image (page 198)
■ Converting REM Objects to a New Raster Image (page 199)
To define a primitive object using Smart Pick
1 Click Image menu ➤ Raster Entity Manipulation ➤ Create Primitive ➤ Smart Pick.
2 Select the raster entity to be converted.
Quick Reference
Menu
Image ➤ Raster Entity Manipulation ➤ Create Primitive ➤ Smart Pick
REM Toolbar
Object Shortcut Menu
Right-click image ➤ REM ➤ Create ➤ Smart Pick
Command Line
issmart
Defining a REM Primitive From Existing VectorsYou can define a primitive object using the geometry of an existing line,polyline, arc, or circle.
For example, if a vector line is drawn over a raster line and you want to movethe raster line, you can use the vector line to define a primitive line objectand then move the raster.
Defining a REM Primitive From Existing Vectors | 185

See also:
■ Resizing a REM Object (page 189)
■ Editing REM Objects (page 187)
■ Merging REM Objects into an Image (page 198)
■ Converting REM Objects to a New Raster Image (page 199)
To define a REM primitive object from existing vectors
1 Click Image menu ➤ Raster Entity Manipulation ➤ Create Primitive ➤ From Existing Vector.
2 Select the vector object.
Quick Reference
Menu
Image ➤ Raster Entity Manipulation ➤ Create Primitive ➤ From ExistingVector
REM Toolbar
Object Shortcut Menu
Right-click image ➤ REM ➤ Create ➤ From Existing Vector
Command Line
iprimfromvec
Changing the Linetype of a Primitive ObjectYou can change the linetype of a primitive object using the Properties Window.For more information, see AutoCAD Properties (page 57).
If a raster entity has a dashed line or other non-continuous linetype whenyou define it as a primitive object, Raster Design changes the linetype tocontinuous if you edit the object, such as by stretching or smoothing it. Youcan then apply a linetype other than continuous to the object before mergingit into the image.
186 | Chapter 7 Raster Entity Manipulation

For example, you want to extend a gas line, shown as a dashed line. You definethe line as a REM primitive object and use grips to stretch the line to a newposition. Raster Design redraws this line as a continuous line. You use AutoCADProperties dialog box to reapply the original linetype to the line before mergingit into the image.
To change the linetype of a primitive object
1 Select the primitive object.
2 Apply the linetype to the object.
The raster line is redrawn using the new linetype.
Manipulating REM ObjectsAfter you define a region object or primitive object, you can manipulate theREM objects to modify the raster data.
You work with REM objects much as you work with other AutoCAD objects,although REM objects have special characteristics.
See also:
■ Defining REM Region Objects (page 168)
■ Defining REM Enhanced Bitonal Regions (page 176)
■ Defining REM Primitive Objects (page 178)
■ Characteristics of REM Objects (page 166)
Editing REM ObjectsAfter defining a region object or a primitive object, you can use a variety ofcommands to modify the raster data.
You can use the Merge To Raster command on a modified REM object to makeit part of the raster image. For more information, see Merging REM Objectsinto an Image (page 198).
NOTE REM objects are not automatically saved with the drawing. You must eithermerge the REM objects back into the original raster image or create a new imagefrom the REM objects.
Manipulating REM Objects | 187

The Edit Mode menu appears when you select one or more REM objects andright-click. This menu provides a mixture of AutoCAD commands and REMcommands.
AutoCAD Commands
The following AutoCAD commands can operate on one or more REM objects:
■ COPY
■ COPYCLIP (copy to clipboard)
■ ERASE
■ MIRROR
■ MODIFY
■ MOVE
■ ROTATE
■ SCALE
■ STRETCH
■ UNDO
NOTE AutoCAD commands that cannot be used on REM objects are BLOCK,WBLOCK, TRIM, EXTEND, and EXPLODE.
When an AutoCAD command causes a REM object to become out of syncwith the original image, Raster Design erases the corresponding raster datafrom the source image. For example, you can define a region object and thenmove it. After you move the region object, the raster data is deleted from theoriginal image. If you want to delete a REM object immediately after definingit, use the AutoCAD ERASE command.
For detailed instructions on using AutoCAD commands, see AutoCAD onlineHelp.
REM Commands
To access the full list of REM commands, from the Menu Browser, click Imagemenu ➤ Raster Entity Manipulation. You can clear (delete) the REM objects,select all REM objects in the image, refine the selection that you used to createthe entity, remove sub-components of the object, toggle transparency or mergethe object into a raster image.
188 | Chapter 7 Raster Entity Manipulation

If you have multiple REM objects selected, only those options that are validfor all of the objects are enabled. For example, if you select three REM objectsand only two of them are in refine mode, the Refine Mode option is unavailableon the menu.
You can perform the following tasks from the edit mode menu:
■ Resizing a REM Object (page 189)
■ Removing Part of a Region Object (page 175)
■ Merging REM Objects into an Image (page 198)
■ Converting REM Objects to a New Raster Image (page 199)
■ Using REM Transparency (page 200)
■ Smoothing REM Linework (page 194)
NOTE These options are also available on the Raster Entity Manipulation Toolbarand the Raster Entity Manipulation submenu on the Image menu.
Resizing a REM ObjectUse REM Refine Mode to modify the geometry of a REM region or primitiveobject.
When a REM object is in Refine Mode, only the vector image of the object isdisplayed, which makes it easier to correct the geometry.
NOTE Enhanced bitonal region objects cannot be refined.
Some typical situations for using Refine Mode:
■ After you define a region object, you realize that the boundary of the regionneeds some adjustment to include the right pixels.
■ You define a primitive object and it does not end where you expected. Forexample, you selected a line, and the primitive crosses an intersectionwhen you want it to end at the intersection.
Grip Behavior
Region objects and primitive objects have different grips to use for resizing.
Resizing a REM Object | 189

Region Objects
■ REM polygonal, rectangular, and diagonal region objects have grips oneach vertex and midpoint. You can reposition each vertex independentlyof the others. If you reposition a midpoint grip, the affected segment isbroken into two segments. This operates like the Raster Design Image Maskobject. All other grip operations, such as scale and stretch, use AutoCADpolyline grip behavior.
■ A circular region object has five grips: one grip at the center of the circleand four on the circumference. REM circular region objects behave likeAutoCAD circles. If you move the center grip, the entire circle moves. Ifyou move one of the grips on the circumference, the radius changes.
Primitive Objects
■ A line primitive has three grips: one at each endpoint, and one in thecenter. If you move the center grip, the entire object moves. Grip editinga REM line is the same as editing an AutoCAD line.
■ A circle primitive has five grips: one grip at the center of the circle andfour on the circumference. Grip editing a REM circle is the same as editingan AutoCAD circle. If you move the center grip, the entire circle moves.If you move one of the grips on the circumference, the radius changes.
■ An arc primitive has three grips: one at each endpoint, and one at themidpoint of the arc. Grip editing a REM arc is the same as editing anAutoCAD arc.
To use REM refine mode
1 Select the region object or primitive object you want to refine.
2 Right-click and click Refine Mode.
3 Use the grips to modify the geometry of the object to include or excluderaster data.
4 Right-click and click Refine Mode to exit from refine mode.
If you select a region object or a primitive, you can switch to Refine Modeto fine tune the geometry used for defining the REM object.
NOTE You can only switch to Refine Mode if the REM object is still associatedwith the image.
190 | Chapter 7 Raster Entity Manipulation
Quick Reference
Menu
Image ➤ Raster Entity Manipulation ➤ Refine Mode
REM Toolbar
Object Shortcut Menu
Right-click REM object ➤ Refine Mode
Command Line
irefinemode
Using REM OperationsUse REM operations to trim or extend raster lines, to add offset lines, to addcorner fillets, or to smooth raster linework.
The REM operation commands are designed to function like the relatedAutoCAD commands for vector lines. Where possible, the REM commandsuse the same options as the AutoCAD commands.
The underlying raster is rubbed by REM operations.
Trimming and Extending REM LinesYou can trim or extend raster lines so that they intersect other lines correctly.
Use either a REM line or a vector line to mark the boundary edge (intendedlength) of the modified line. After a trim or extend operation, the REM lineis automatically smoothed.
You can trim or extend several lines within the same command by using aShift-click option to switch between trim and extend operations.
To trim a REM line
1 Ensure that the boundary edge of the REM line is marked with anintersecting REM or vector line.
2 Click Image menu ➤ Raster Entity Manipulation ➤ REM Operations ➤ Trim.
Using REM Operations | 191

3 Click the boundary edge, then right-click.
4 Click anywhere on the part of the line that you want to remove.
The line is trimmed to the boundary edge.
To extend a REM line
1 Ensure that the boundary edge of the REM line is marked with anintersecting REM or vector line.
2 Click Image menu ➤ Raster Entity Manipulation ➤ REM Operations ➤ Extend.
3 Click the boundary edge, then right-click.
4 Click anywhere on the line that you want to extend.
The line is extended to the boundary edge.
Quick Reference
Menu
Image ➤ Raster Entity Manipulation ➤ REM Operations ➤ Trim. (OrExtend)
REM Toolbar
Trim
Extend
Command Line
itrim, iextend
Filleting REM LinesCreate a fillet wherever you want two raster lines to meet at a rounded orsquare corner.
192 | Chapter 7 Raster Entity Manipulation

You can specify a radius for the corner arc by drawing a line or entering anumeric value. This radius is used as the default value for the next use of thefillet command in this editing session. If you specify no radius value, the twolines are extended to intersect.
If you want to leave a small gap between the fillet and one of the lines, setthe Trim option to No Trim.
To add a fillet between two REM lines
1 Click Image menu ➤ Raster Entity Manipulation ➤ REM Operations ➤ Fillet.
2 Optionally, to specify a radius, enter r, then enter a value.
3 Optionally, to check or change the trim option, enter t.
4 Click one of the REM lines, then click the other.
The fillet is drawn between the two lines.
5 Click anywhere on the part of the line that you want to remove.
Quick Reference
Menu
Image ➤ Raster Entity Manipulation ➤ REM Operations ➤ Fillet
REM Toolbar
Command Line
ifillet
Offsetting REM ObjectsCreate a new REM object that is offset a specified distance from an existingREM line, circle, or arc.
Offsets are especially useful for creating accurate parallel lines and concentriccircles. When you offset a line, the new line is the same length as the original.
Using REM Operations | 193

You can specify the offset distance by clicking a through point, drawing a linesegment, or entering a numeric offset value. This offset distance is used as thedefault value for the next use of the offset command in this editing session.
To create an offset from a REM object
1 Click Image menu ➤ Raster Entity Manipulation ➤ REM Operations ➤ Offset.
2 Specify the offset distance by entering a number, drawing a line, orentering t then picking a through point.
3 Click the REM object to offset.
4 Optionally, click the side of the object where you want the offset, or clickthe through point.
The offset object is drawn.
Quick Reference
Menu
Image ➤ Raster Entity Manipulation ➤ REM Operations ➤ Offset
REM Toolbar
Command Line
ioffset
Smoothing REM LineworkRuns a series of thinning and thickening filters on the raster linework of oneor more REM objects.
NOTE If you are editing REM lines by trimming, extending, or other operations,you should finish all such editing before smoothing. After smoothing, you can getunpredictable results with other editing operations.
The Smooth operation applies only to the REM objects you select. By contrast,the smoothing filter available in the bitonal filters applies to the entire image.For more information, see Using Bitonal Filters (page 112).
194 | Chapter 7 Raster Entity Manipulation
If you made the object's linetype dashed, Raster Design redraws a dashed lineafter you execute the Smooth command. If an object's linetype has not beenset, the object is redrawn as continuous.
If you are working with a REM primitive, Raster Design completely redrawsthe raster primitive. The linetype setting is maintained.
To smooth the linework of REM objects
1 Click Image ➤ Raster Entity Manipulation ➤ REM Operations ➤
Smooth.
2 Select the REM objects and press Enter.
Quick Reference
Menu
Image ➤ Raster Entity Manipulation ➤ REM Operations ➤ Smooth
REM Toolbar
Command Line
ismooth
Defining REM Objects Partially Outside the ImageDefine a REM region object to be partly outside the image.
For example, if you want to select a semi-circular raster object along the outsideedge of the image, you can create a circular region object with only half ofthe circle touching the image. Raster Design ignores any part of the REM objectthat does not contain raster data. Only the true extents of the raster datadefined by the region are merged into the image.
NOTE Enhanced bitonal regions and primitives automatically clip themselvesagainst the raster image.
Using REM to Delete Raster DataYou can use REM objects to delete raster data from your image.
Defining REM Objects Partially Outside the Image | 195
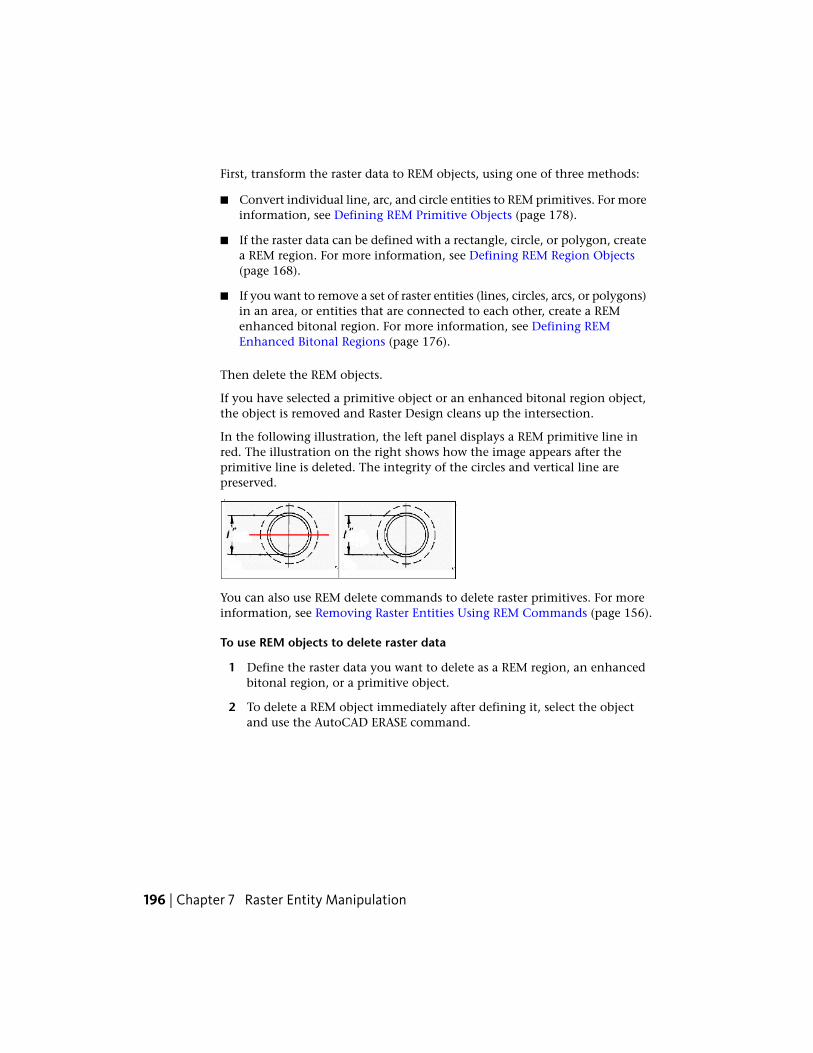
First, transform the raster data to REM objects, using one of three methods:
■ Convert individual line, arc, and circle entities to REM primitives. For moreinformation, see Defining REM Primitive Objects (page 178).
■ If the raster data can be defined with a rectangle, circle, or polygon, createa REM region. For more information, see Defining REM Region Objects(page 168).
■ If you want to remove a set of raster entities (lines, circles, arcs, or polygons)in an area, or entities that are connected to each other, create a REMenhanced bitonal region. For more information, see Defining REMEnhanced Bitonal Regions (page 176).
Then delete the REM objects.
If you have selected a primitive object or an enhanced bitonal region object,the object is removed and Raster Design cleans up the intersection.
In the following illustration, the left panel displays a REM primitive line inred. The illustration on the right shows how the image appears after theprimitive line is deleted. The integrity of the circles and vertical line arepreserved.
You can also use REM delete commands to delete raster primitives. For moreinformation, see Removing Raster Entities Using REM Commands (page 156).
To use REM objects to delete raster data
1 Define the raster data you want to delete as a REM region, an enhancedbitonal region, or a primitive object.
2 To delete a REM object immediately after defining it, select the objectand use the AutoCAD ERASE command.
196 | Chapter 7 Raster Entity Manipulation
Clearing REM ObjectsClearing a REM object has one of two effects, depending on whether the objectis associated with an image:
■ If the REM object is associated with an image, clearing the object mergesthe raster data defined by the object into the image.
■ If the REM object is not associated with an image, clearing the objectdeletes the object.
For example, you can define a region object and copy it to another area of theimage. Then if you clear all objects, the original object (still associated withthe image) merges into the image, but the copy (not associated with the image)is deleted.
You cannot do non-REM raster editing operations such as Touchup while REMobjects remain in the image. The clear commands are useful for removingsuch objects after a REM editing session.
To clear REM objects
■ Click Image menu ➤ Raster Entity Manipulation ➤ Clear Selected. Selectthe REM objects, and press Enter. or
■ Click Image menu ➤ Raster Entity Manipulation ➤ Clear All.
Quick Reference
Menu
Image ➤ Raster Entity Manipulation ➤ Clear Selected (or Clear All)
REM Toolbar
Clear Selected
Clear All
Object Shortcut Menu
Select REM objects, then right-click ➤ Clear
Command Line
iclear (selected objects)
Clearing REM Objects | 197

iclearall (all objects)
Merging REM Objects into an ImageYou can use the Merge to Raster Image command to merge REM objects intothe source image or into another image.
This command merges all selected REM objects into the image under them.If your REM objects are not over an image, a merge operation is not possible.If your REM objects are partly touching the image, the image expands toaccommodate them. If your REM objects are below the image, the objectsmerge into the image above. Unlike vector merge, display order is notrespected.
If the selected REM objects are over multiple images or span adjacent images,a dialog box prompts you to choose an image.
If you defined a REM object but did not modify the object, clear the object tomerge it into the source image. If you want to create a new image from theREM object, use the Convert to Raster Image command.
See also:
■ Clearing REM Objects (page 197)
■ Converting REM Objects to a New Raster Image (page 199)
To merge REM objects into an image
1 Select the REM objects you want to merge into the image.
2 Click Image menu ➤ Raster Entity Manipulation ➤ Merge to RasterImage.
Quick Reference
Menu
Image ➤ Raster Entity Manipulation ➤ Merge to Raster Image
REM Toolbar
198 | Chapter 7 Raster Entity Manipulation

Object Shortcut Menu
Select REM objects, then right-click ➤ Merge to Raster Image
Command Line
imergetoimg
Converting REM Objects to a New Raster ImageYou can convert one or more REM objects to a new raster image.
If you select more than one REM object, Raster Design merges all REM objectsinto one new image.
If the raster image was created from a REM polygonal or diagonal region, theimage is clipped to match the geometry of the REM object. Raster data thatfalls outside the clip, but within the boundary of the image, is set to thetransparency color.
Converting REM objects to a new image has one of two effects on the originalimage:
■ If a REM object is associated with the original image, the raster data definedby the object remains in the original image.
■ If a REM object is not associated with the original image, the raster datadefined by the object is cleared from the original image.If you select REM objects from images with different properties (forexample, images with different color depths and densities) and convertthe objects to a new image, the properties of the new image are determinedby the first REM object you select.
To convert REM objects to new raster image
1 Select the REM objects you want to convert to a new image.
2 Click Image menu ➤ Raster Entity Manipulation ➤ Convert to RasterImage.
Quick Reference
Menu
Image ➤ Raster Entity Manipulation ➤ Convert to Raster Image
Converting REM Objects to a New Raster Image | 199

REM Toolbar
Command Line
iconvtoimg
Using REM TransparencyREM objects respect the transparency settings of the source image, includingstate and color.
You can change the transparency of a region object or an enhanced bitonalregion object. REM primitive objects are always transparent.
To turn the transparency of a REM object off or on
1 Select the REM objects whose transparency you want to change.
2 Click Image menu ➤ Raster Entity Manipulation ➤ Transparency.
Quick Reference
Menu
Image ➤ Raster Entity Manipulation ➤ Transparency
REM Toolbar
Command Line
itransparent
Using REM Copy To Clipboard CommandUse this command to copy REM objects to the Windows Clipboard. You canthen use the objects in an external application.
The Copy to Clipboard command has two options for data capture:
■ Native Capture copies all the data of the REM object at its full resolution.
200 | Chapter 7 Raster Entity Manipulation

■ Display Capture copies the data of the REM object at screen resolution.
You can specify the option for data capture on the REM tab (page 357) of theRaster Design Options dialog box.
If you select REM objects from images with different properties (for example,images with different color depths and densities) and convert the objects toa new image, the properties of the new image are determined by the first REMobject you select.
NOTE You can also use Ctrl+C to run COPYCLIP. If the cursor is in the drawingarea, Raster Design copies the selected objects to the Clipboard. If the cursor ison the command line or in the text window, Raster Design copies the selectedtext to the Clipboard.
To copy REM objects to the clipboard
1 Select the REM objects you want to copy to the Clipboard.
2 Click Image menu ➤ Raster Entity Manipulation ➤ Copy to Clipboard.
Quick Reference
Menu
Image ➤ Raster Entity Manipulation ➤ Copy to Clipboard
REM Toolbar
Command Line
icopyss
Separating Raster Linework Using KnifeUse the Knife command to separate raster linework by drawing a line that isone pixel wide through raster data.
Knife is useful for precisely separating raster entities in detailed areas of animage. For example, you can use Knife to separate a raster title block from araster border so you can work with the title block and border as separate rasterentities.
Separating Raster Linework Using Knife | 201

To separate raster linework using Knife
1 Click Image ➤ Raster Entity Manipulation ➤ Knife.
2 Select the start and end points for the knife cut.
3 Continue selecting start and end points through each raster line youwant to cut.
4 Press Enter to end the command.
Quick Reference
Menu
Image ➤ Raster Entity Manipulation ➤ Knife
REM Toolbar
Command Line
iknife
202 | Chapter 7 Raster Entity Manipulation

Converting Raster Entitiesto Vector
Vectorization tools (VTools) can convert geometry and text in a bitonal raster image.
With vectorization tools, you can:
■ Use a one-pick method to accurately trace raster entities you select.
■ Use a follower method to trace complex geometry, such as contours.
■ Verify and adjust a vector entity's dimensions as it is drawn to make it more precise.
■ Remove a raster entity automatically as you trace it.
In many cases, a vectorization command can convert a raster entity to vector with a singleclick. You can also define the raster entity by clicking two or more points on the image. Oncea vectorization command is initiated, you can continue to vectorize additional raster entitiesusing either selection method.
There are seven primary vectorization tools for converting raster entities to correspondingAutoCAD objects:
■ Line tool
■ Polyline tool
■ Rectangle tool
■ Circle tool
■ Arc tool
■ Text tool and Multiline Text tool
Follower VTools provide a semi-automatic method of tracing the raster polylines you wantto vectorize. For example, the contour follower tool traces a selected contour line until itmeets a decision point such as an endpoint or a contour label. At each decision point, you
8
203

can provide more information, change course, go back up to a previous vertex, or stop thefollower.
Vector separation options can help you to manage new vectors by automatically assigningline weights (widths) or drawing layers based on vector attributes. For more information,see the Vector Separation Options (page 373) dialog box.
NOTE To make the most efficient use of vectorization tools, adjust the vectorizationtools settings in the Raster Design Options dialog box. These settings are located onthree tabs: VTools General, VTools Follower, and Raster Entity Detection.
Text recognition tools in ProdNameShort can automatically read raster text in an image,present it to you for correction, and convert it to a line or block of AutoCAD vector text.
Configuring VToolsUse these settings to work most efficiently with vectorization tools.
VTools are controlled by a number of settings in the Raster Design Optionsdialog box. In addition, you can choose whether to use AutoCAD DynamicInput prompts as you vectorize raster entities.
ProdNameShort OptionsThe Raster Design Options dialog box includes three tabs with settings thataffect vectorization:
■ Raster Entity Detection (page 357) tab specifies how the VTools detect rasteracross gaps and in the vicinity of the cursor.
■ VTools General (page 362) tab specifies general vectorization behavior, suchas the removal of raster, line separation, and the rounding scheme fornumeric values.
■ VTools Follower (page 360) tab specifies the behavior of the tools forfollowing contours and polylines.
Dynamic Input SettingsIf you enable AutoCAD Dynamic Input, you see on-screen prompts near yourcursor as you vectorize. Vectorized lines, arcs, and figures also have grips that
204 | Chapter 8 Converting Raster Entities to Vector

you can use to edit the line work. This feature is particularly useful forproviding numeric values for coordinates, line length, and angle. WhenDynamic Input is disabled, the prompts appear only on the command line.
To configure the pointer input and the dimension input, use the AutoCADcommand DSETTINGS to open the Drafting Settings dialog box.
To turn Dynamic Input on and off, use the AutoCAD system variableDYNMODE, which has four settings:
■ 0 to turn off all Dynamic Input features
■ 1 to turn on pointer input
■ 2 to turn on dimensional input
■ 3 to turn on both pointer and dimensional input
See AutoCAD Help for more information on Dynamic Input.
Using SmartCorrectThis one-pick selection method for Line and Polyline tools vectorizes a rasterline with a single click.
ProdNameShort automatically corrects the resulting line to conform to currentdrafting settings. The following sequence of decisions applies:
■ If AutoCAD SNAP is active, the start point and the endpoint are snappedto the grid. No other correction is performed.
■ If AutoCAD SNAP is inactive but OSNAP is active, ProdNameShort adjustspoints that are within the tolerance defined in the Correction Tolerancesection on the VTools General tab of the Raster Design Options dialog box.If both ends of the line are osnapped, no further correction is performed.
Using SmartCorrect | 205

■ If OSNAP is inactive, or at least one point was not osnapped,ProdNameShort determines if POLAR or ORTHO snap is active. If so,ProdNameShort aligns the line by moving the endpoint. If one point wassnapped earlier, then the free end is automatically considered the endpoint.ProdNameShort adjusts the angle about the start point without changingthe length. The angle snap occurs only if the new endpoint falls withinthe tolerance distance.
■ If Round Values is enabled, the line length is rounded to the precisionspecified on the VTools General tab of the Raster Design Options dialogbox.
For more information about adjusting SmartCorrect settings, see GeneralVTool Settings (page 250).
Vectorizing Raster GeometryProdNameShort provides separate vectorization tools to convert raster lines,polylines, rectangles, circles, and arcs.
Depending on which raster line type you select, ProdNameShort creates anAutoCAD line or polyline entity with the same position and dimensions asthe raster original. Once ProdNameShort has vectorized a line segment, youcan verify its geometry (including angle and length), switch the start pointand endpoint, and trim or extend the line.
Settings on the VTools General tab of the Raster Design Options dialog boxspecify whether the Line tool removes the underlying raster when you exitthe command, forces the vector lines to conform to current drafting settings,or assigns layers to the vectors based on the width of the underlying rasterlines.
If Dynamic Input is active, prompts appear near the cursor duringvectorization; otherwise, the prompts appear only on the command line.
When you use the Line or Polyline tool, you can select the raster line forvectorizing using one of the following two selection methods.
One Pick
This default method vectorizes a bitonal raster line with a single click. Theone-pick method is especially useful when you want to quickly vectorize manyseparate lines, which can include polylines, circles, and arcs. The endpointnearest the point you select is considered the start point (an arrow glyphpoints away from the start-point). Depending on which AutoCAD drafting
206 | Chapter 8 Converting Raster Entities to Vector

settings are active, SmartCorrect automatically corrects the resulting line toconform to current drafting settings. For more information, see UsingSmartCorrect (page 205).
Multi-pick
This method vectorizes a raster line that you define by clicking two or morepoints. The multi-pick method provides you with more control over thevectorizing process. It is useful for creating vector polylines, rectangles, circles,and arcs.
After you select a raster line to vectorize, the AutoCAD command line displaysseveral editing options that vary according to the line type. In general, youcan select another entity to vectorize using the one-pick method, or you canedit the vector line by entering numeric attributes or picking additional points.
NOTE To make the most efficient use of vectorization tools, you should adjust thesettings on the VTools General (page 362) tab on the Raster Design Options dialogbox.
Vectorizing Raster Lines and PolylinesThe Polyline tool converts raster lines to vector lines or polylines.
ProdNameShort creates an AutoCAD entity with the same position anddimensions as a raster line you select. Once ProdNameShort has vectorized aline, you can verify its geometry (including angle and length), switch the startpoint and endpoint, and trim or extend the line. Depending on the settingsyou specified on the VTools General (page 362) tab of the Raster Design Optionsdialog box, the Polyline tool can remove the underlying raster when you exitthe command, force the vector polylines to conform to current draftingsettings, or assign layers to the vectors based on the width of the underlyingraster lines.
When you use the Polyline tool, you can select the raster line for vectorizingusing one of two selection methods:
■ The default, or one-pick method, vectorizes a bitonal raster line with asingle click. The endpoint nearest the point you select is considered thestart point (an arrow glyph points away from the start-point). Dependingon which AutoCAD drafting settings are active, SmartCorrect automaticallycorrects the resulting polyline to conform to current drafting settings.
■ The multi-pick method vectorizes any raster line that you define by clickinga start point and an endpoint. After you select the first start point, you are
Vectorizing Raster Lines and Polylines | 207

prompted to enter subsequent endpoints to create a single polyline withmultiple segments.
After you select a raster line to vectorize, the AutoCAD command line displaysa number of choices. You can select another entity to vectorize using theone-pick method, or you can use any of the following options on the vectorline segment you just created:
■ 2P, to select another entity using the multi-pick method.
■ Angle, to adjust the angle. You can enter an angular value, or match theangle of another vector line.
■ Length, to adjust the length. You can enter a length value, or match thelength of another vector line.
■ Undo, to remove the line.
If you used the one-pick method to select the raster line, the following optionsare available to modify the vector line segment you just created:
■ Start, to change the start point.
■ End, to change the endpoint.
■ Switch, to reverse the direction, moving the start point to the other end.
■ Trim, to shorten the line by clicking an intersecting vector entity to trimto, or by clicking another entity that, if extended, would intersect the lineyou are trimming. ProdNameShort moves the endpoint to the apparentintersection.
■ Extend, to lengthen the line by clicking an intersecting vector entity toextend to, or by clicking another entity that, if extended, would intersectthe raster line you are extending. ProdNameShort moves the endpoint tothe apparent intersection.
NOTE To make the most efficient use of vectorization tools, you should adjust thesettings on the VTools General (page 362) tab on the Raster Design Options dialogbox.
TIP Use raster snapping to make picking points on the raster entity you areconverting easier. For more information, see Raster Snapping (page 237).
208 | Chapter 8 Converting Raster Entities to Vector

To convert a raster line to a vector line or polyline
1 For straight lines, click Image menu ➤ Vectorization Tools ➤ Line. Orfor polylines, Click Image ➤ Vectorization Tools ➤ Polyline..
The following prompt appears:
Specify one-pick point or [2P]:
NOTE When you use the one-pick method to select the raster entity,ProdNameShort corrects the point you picked according to the currentdrafting settings or rounding values. For more information, see UsingSmartCorrect (page 205).
2 Do one of the following:
■ Select a raster line by clicking near the beginning of the line. Theendpoint nearest the point you select is considered the start point.
■ Enter 2p, then enter two points to define the raster line you arevectorizing.
3 NOTE You can cancel the selection of a point by typing undo after you pickthe point.
4 Select another raster line using the one-pick method, or do one of thefollowing:
■ Enter 2p to select another raster line to vectorize using the multi-pickselection method.
■ Enter a (Angle) to verify the angle of the vector line segment you justcreated. See Options for Verifying an Angle (page 210).
■ Enter l (Length) to verify the length of the vector line segment youjust created. See Options for Verifying a Length (page 210).
■ Enter u (Undo) to remove the last vector line segment you created.
If you used the one-pick method to select the raster line, the followingoptions are available:
■ Enter st (Start) to verify the start point of the vector line segment youjust created. A rubber-band line appears from the current endpoint.Click to select a new start point.
Vectorizing Raster Lines and Polylines | 209

■ Enter e (End) to verify the endpoint of the vector line segment youjust created. A rubber-band line appears from the current start point.Click to select a new endpoint.
■ Enter sw (Switch) to make the current endpoint the start point, andthe current start point the endpoint.
■ Enter t (Trim) to trim (shorten) the vector line segment you just createdby clicking an intersecting vector entity. See Options for Trimmingor Extending a Line (page 211).
■ Enter x (Extend) to lengthen the vector line segment you just createdby clicking an intersecting vector entity. See Options for Trimmingor Extending a Line (page 211).
5 Repeat step 3, or press Enter to exit the command.
Options for Verifying an Angle
When you select the Angle option of the Line tool, the following prompt isdisplayed:
Enter new angle or [Match]<“XdX'X”>
NOTE ProdNameShort adjusts the angle about the start point.
Do one of the following:
■ To change the angle, enter a new angle.
■ To match the angle of an existing vector, enter m, then select the vectorline.
■ To use an angle from the Most Recently Used or Most Frequently Used list(depending on your settings in the Raster Design Options dialog box),right-click, then click a value on the shortcut menu.
Options for Verifying a Length
When you select the Length option of the Line tool, the following prompt isdisplayed:
Enter new length or [Match]<XXX>:
Do one of the following:
■ To change the length, enter a new length.
210 | Chapter 8 Converting Raster Entities to Vector

■ To match the length of an existing vector line, enter m, then select thevector line.
■ To use a length from the Most Recently Used or Most Frequently Used list(depending on your settings in the Raster Design Options dialog box),right-click, then click a value on the shortcut menu.
Options for Trimming or Extending a Line
When you select the Trim option, the following prompt is displayed:
Select cutting edge or [Apparent]:
When you select the Extend option, the following prompt is displayed:
Select boundary edge or [Apparent]:
NOTE ProdNameShort trims or extends the line by moving the endpoint.
To either trim or extend the line, do one of the following:
■ To connect the current vector line to an intersecting vector entity, selectthe intersecting entity.
■ To end the current vector line at an apparent intersection with anothervector entity, enter a (Apparent) and select YES, then select the other vectorentity.
Quick Reference
Menu
Image ➤ Vectorization Tools ➤ LineClick Image ➤ Vectorization Tools ➤ Polyline.
Raster Design Toolbar
Vectorize Line
Vectorize Polyline
Command Line
vlinevpline
Vectorizing Raster Lines and Polylines | 211

Dialog Box
VTools General Tab (ProductNameShort Options Dialog Box) (page 362)
Vectorizing Raster RectanglesYou can convert a raster rectangle to a vector rectangle by using the Rectangletool.
NOTE To make the most efficient use of the Rectangle tool, you should first adjustthe settings on the VTools General tab on the Raster Design Options dialog box.For more information, see VTools General tab (page 362).
To convert a raster rectangle to a vector rectangle
1 Click Image menu ➤ Vectorization Tools ➤ Rectangle.
2 Click the first corner of the raster rectangle.
NOTE You can cancel the selection of a point by typing u (Undo) after youpick the point.
3 Select a point to define the angle of the rectangle, or press Enter to accept0 (zero) as the angle.
The cursor now controls the size of the vector rectangle.
4 Expand the rectangle to the desired size, then click the location of thecorner opposite the first corner.
5 Do one of the following
■ Press Enter or right-click to draw the rectangle with the current height,width, and angle.
■ Enter v (Verify) to see the rectangle’s current size and orientationangle. If you want to change one of these values, enter h (Height), w(Width), or a (Angle) and enter a numeric value or pick a point todefine the new value.
TIP Use raster snapping to make it easier to pick points on the raster entity youare converting. For more information, see Specifying Raster Snap Settings (page237).
212 | Chapter 8 Converting Raster Entities to Vector

Quick Reference
Menu
Image ➤ Vectorization Tools ➤ Rectangle
Raster Design Toolbar
Command Line
vrect
Vectorizing Raster CirclesThe Circle tool converts raster circles to vector circles. Select a raster circle andProdNameShort creates vector that matches its geometry.
Depending on the settings you have specified on VTools General tab on theRaster Design Options dialog box, the Circle tool can even remove theunderlying raster circle when you exit the command. For more information,see VTools General Tab (ProductNameShort Options Dialog Box) (page 362).
There are four methods of defining raster circles:
■ One-pick method detects a bitonal raster circle with a single click.
■ Center multi-pick method converts any type of raster circle by selectingthe center point and any point on the circumference of the circle.
■ 2P multi-pick method converts a raster circle by selecting two points todefine the diameter of the circle.
■ 3P multi-pick method converts a raster circle by selecting three points onthe circle.
Once ProdNameShort has vectorized a circle, you can:
■ Vectorize another circle using any of the four selection methods discussedabove.
■ Verify or edit the center, radius, or diameter of the circle. You can specifynew values by numeric entry or by clicking another circle in the drawingthat has an attribute you want to match. This matching operation is
Vectorizing Raster Circles | 213

particularly useful when you are vectorizing several circles of identicaldiameter, or a set of concentric circles.
To convert a raster circle to vector
1 Click Image menu ➤ Vectorization Tools ➤ Circle.
The following prompt is displayed:
Specify one-pick point or [Center/2P/3P]:
2 Do one of the following:
■ Select a raster circle using the one-pick selection method.
■ Enter c (Center), then select the center point and a point along thecircumference of the circle.
■ Enter 2p, then select two points to define the diameter of the rastercircle.
■ Enter 3p, then select three points along the circumference to definethe circle.
The following prompt is displayed:
Specify one-pick point or [Center/2P/3P/Verifycenter/Radius/Diameter/Undo]:
3 Do one of the following:
■ Select another circle to vectorize, using one of the methods describedin step 2.
■ Enter v (Verify center) to verify the center. Select a new location forthe center point, or type m and select another vector circle to matchthe center point.
■ Enter r (Radius) to verify the radius. Select a new radius, type a newradius at the command line, or type m and select another vector circleto match the radius. Depending on the setting you selected in theRaster Design Options dialog box, you can right click to select a radiusfrom a Most Recently Used list or a Most Frequently Used list.
■ Enter d (Diameter) to verify the diameter. Select a new diameter, entera new diameter at the command line, or enter m and select anothervector circle to match the diameter. Depending on the setting youselected in the Raster Design Options dialog box, you can right-clickto select a diameter from a Most Recently Used list or a MostFrequently Used list.
214 | Chapter 8 Converting Raster Entities to Vector

■ Enter u (Undo) to undo the last circle selected.
■ Press Enter to exit the command.
TIP Use raster snapping to make it easier to pick points on the raster entity youare converting. For more information, see Specifying Raster Snap Settings (page237).
Quick Reference
Menu
Image ➤ Vectorization Tools ➤ Circle
Raster Design Toolbar
Command Line
vcircle
Vectorizing Raster ArcsThe Arc tool converts raster arcs to vector arcs. Select a raster arc andProdNameShort creates vector that matches its geometry.
Depending on the settings you have specified on the VTools General (page362) tab on the Raster Design Options dialog box, the Arc tool can even removethe underlying raster when you exit the command.
There are three methods of defining raster arcs:
■ One-pick method detects a bitonal raster arc with a single click.
■ Center multi-pick method converts any type of raster arc by selecting acenter point, a start point, and an end point.
■ 3P multi-pick method converts a raster arc by selecting three points alongthe arc.
Vectorizing Raster Arcs | 215
Once ProdNameShort has vectorized an arc, you can:
■ Vectorize another arc using any of the three selection methods discussedabove.
■ Verify the center or radius of the arc. You can specify new values bynumeric entry or by clicking another arc in the drawing that has anattribute you want to match. This matching operation is particularly usefulwhen you are vectorizing several arcs of identical diameter, or a set ofconcentric arcs.
To convert a raster arc to vector
1 Click Image menu ➤ Vectorization Tools ➤ Arc.
The following prompt is displayed:
Specify one-pick point or [Center/3P]:
2 Do one of the following:
■ Select a raster arc using the one-pick selection method.■
■ Enter c (Center), then select a center point, a start point, and anend point to define the arc.
■ Enter 3p, then select three points along the radius to define thearc.The following prompt is displayed:
Specify one-pick point or [Center/3P/Verify center/Radius/Undo]:
3 Do one of the following:
■ Select another arc to vectorize, using one of the methods describedin step 2.
■ Enter v (Verify center) to verify the center point. Select a new locationfor the center point, or type m and select another vector arc to matchthe center point.
■ Enter r (Radius) to verify the radius. Select a new radius, type a newradius at the command line, or type m and select another vector arcto match the radius. Depending on the setting you selected in theRaster Design Options dialog box, you can right-click to select a radiusfrom a Most Recently Used list or a Most Frequently Used list.
■ Enter u (Undo) to undo the last arc selected.
216 | Chapter 8 Converting Raster Entities to Vector

■ Press Enter to exit the command.
TIP Use raster snapping to make it easier to pick points on the raster entity youare converting. For more information, see Specifying Raster Snap Settings (page237).
Quick Reference
Menu
Image ➤ Vectorization Tools ➤ Arc
Raster Design Toolbar
Command Line
varc
Following PolylinesThe polyline follower tools can trace bitonal raster polylines and convert themto AutoCAD polyline entities or contours.
Separate tools are available for vectorizing 2D polylines, contour lines, and3D polylines.
Follower tools trace or follow the selected polyline, pausing for input at anydecision point where the follower can no longer proceed on its own. Decisionpoints occur when the follower meets confusing geometry or reaches the endof a raster line. You can also use settings in the Raster Design Options dialogbox to instruct the follower to stop at raster intersections.
The follower traces the polyline in both directions from the point you clicked,and always presents you with two decision points at the same time. If thecurrent decision point is not on screen, ProdNameShort automatically pansto it. At each decision point, you can take one of the following actions:
■ Manually add points. This is useful, for instance, to cross the gaps indimension lines created for labels.
■ Switch to the other decision point.
Following Polylines | 217
■ Backup to the last vertex.
■ Rollback to a previous vertex that you select with the pointer.
■ Specify a direction for the follower to take. This option is useful when thefollower pauses at a “T” intersection.
NOTE When you use the Direction option, it becomes the default option untilanother option is used or until the polyline is completed.
■ Continue in the direction that seems most apparent to the follower. Thisoption is useful when the follower has simply paused at a rasterintersection.
■ Follow a vector entity. This option is useful for following portions of animage that have already been vectorized.
■ Close the polyline by drawing a single segment between the two decisionpoints.
■ Join the current polyline to an existing vector polyline.
■ Cancel the current polyline and begin again by pressing Esc.
NOTE To make the most efficient use of the Polyline Follower, you should adjustthe settings on the VTools Follower (page 360) tab on the Raster Design Optionsdialog box.
Vector Separation Options
You can use these options to automatically manage layers, linetypes, andpolyline widths for lines created by vectorization tools. Specify a range of linewidths for the raster entity on the General tab of the Vector Separation Options(page 373) dialog box, then assign layer and polyline width values to theseranges. When a vectorization command is executed, ProdNameShort examinesthe raster line width and assigns the values you specified for that width to thenewly created polylines. You can access the Vector Separation Options dialogbox by clicking the Vector Separation button on the VTools General tab ofthe Raster Design Options dialog box. For more information, see GeneralVector Separation Options (page 249).
See also:
■ Configuring VTools (page 204)
218 | Chapter 8 Converting Raster Entities to Vector

Using the Polyline FollowerThis tool traces raster polylines and converts them to AutoCAD polylineentities.
See also:
■ Following Polylines (page 217)
To convert a raster polyline to a vector
1 Click Image menu ➤ Vectorization Tools ➤ Polyline Follower.
The following prompt appears:
Specify point to follow or [manually Add/Partial]:
2 Do one of the following:
■ Enter a (Add) to manually add a point.
■ Enter p (Partial) to add a partial polyline. Click two points on thepolyline to mark the start and end of the section you want to convert,then click the polyline. The follower traces between those points, andprompts you as shown below.
■ Click a raster polyline to follow.
The following prompt appears:
Manually add point or[Add/Switch/Backup/Rollback/Direction/cOntinue/Vector/Close/Join]:
NOTE When you use the Direction option, it becomes the default optionuntil the Add option is used or until the command is completed.
3 Do one of the following:
■ Click to manually add a point to the polyline. If Add is not the default,enter a (Add), then click to manually add a point to the polyline.
■ Enter s (Switch) to switch between decision points.
■ Enter b (Backup) to go back to the previous vertex.
■ Enter r (Rollback), then click the vertex to which you want to rollback.
Using the Polyline Follower | 219

■ Enter d (Direction), then click the direction you want the followertogo. You do not have to click on the entity, only near it, to specifythe direction.
■ Enter o (Continue) to make the follower continue in the currentdirection.
■ Enter v (Vector), then select the vector to follow. You must specifythe first and last vertices of the vector. ProdNameShort follows thevector entity between these vertices.
■ Enter c (Close) to close the polyline by drawing a single segmentbetween the two decision points.
■ Enter j (Join), then click an existing vector polyline to join to thecurrent polyline.
■ Press Esc to cancel the current polyline and begin another.
■ Press Enter to accept the current polyline and begin another.
4 Repeat step 3, or press Enter to exit the command.
NOTE Use raster snapping to make it easier to pick points on the raster entity youare converting. For more information, see Raster Snapping (page 237).
Quick Reference
Menu
Image ➤ Vectorization Tools ➤ Polyline Follower
Raster Design Toolbar
Command Line
vfpline
Using the Contour FollowerThis tool traces raster contour lines and converts them to AutoCAD polylineentities or to contour objects if you are using Autodesk Land Desktop.
220 | Chapter 8 Converting Raster Entities to Vector

For general information on the use of polyline followers and operationalsettings, see Following Polylines (page 217).
After completing a contour, ProdNameShort prompts you to enter an elevation,depending on the settings you have specified on the VTools Follower tab ofthe Raster Design Options dialog box. These settings also allow you toautomatically increment the elevation value. For more information, see VToolsFollower Settings (page 270).
The Contours tab of the Vector Separation Options dialog box allows you toassign layer and polyline widths to contours based on their elevation interval.For instance, you might set the elevation interval for major contours to 50,and the elevation interval for minor contours to 10. If you then followed acontour and set the elevation value to 50, the resulting vector contour wouldbe assigned to the major layer. Likewise, if you traced a contour and set theelevation value to 40, the resulting vector would be assigned to the minorlayer. For more information, see General Vector Separation Options (page 249).
To convert a raster contour to a vector
1 Click Image menu ➤ Vectorization Tools ➤ Contour Follower.
The following prompt appears:
Specify point to follow or [manually Add/Partial]:
2 Do one of the following:
■ Enter a (Add) to manually add a point.
■ Enter p (Partial) to add a partial contour. Click two points on thecontour to mark the start and end of the section you want to convert,then click the contour. The follower traces between those points, andprompts you as shown below.
■ Click a raster contour to follow.The following prompt appears:
Manually add point or[Add/Switch/Backup/Rollback/Direction/cOntinue/Vector/Close/Join]:
NOTE When you use the Direction option, it becomes the default optionuntil the Add option is used or until the command is completed.
3 Do one of the following:
■ Click to manually add a point to the contour. If Add is not the default,enter a, then click to manually add a point to the contour.
Using the Contour Follower | 221

■ Enter s (Switch) to switch between decision points.
■ Enter b (Backup) to back up to the previous vertex.
■ Enter r (Rollback), then click the vertex to which you want to rollback.
■ Enter d (Direction), then click the direction you want the follower toproceed in. You do not have to click on the entity, only near it, tospecify the direction.
■ Enter o (Continue) to make the follower continue in the currentdirection.
■ Enter v (Vector), then select the vector to follow. You must specifythe first and last vertices of the vector. ProdNameShort follows thevector entity between those vertices.
■ Enter c (Close) to close the contour by drawing a single segmentbetween the two decision points.
■ Enter j (Join), then click an existing vector polyline or contour to jointo the current polyline.
■ Press Esc to cancel the current contour and begin another.
■ Press Enter to accept the current contour and begin another.
The following prompt appears:
Specify elevation for contour <X.XX>:
4 If the contour follower is set to prompt for elevation, do one of thefollowing:
■ Enter a new elevation.
■ Press Enter to accept the current value.
NOTE You can control the amount ProdNameShort increments/decrementsthe suggested elevation for the contour follower by adjusting the Intervalsettings on the VTools Follower tab of the Raster Design Options dialog box.For more information, see VTools Follower Settings (page 270).
5 Repeat steps 3 and 4, or press Enter to exit the command.
NOTE Use raster snapping to make it easier to pick points on the raster entity youare converting. For more information, see Raster Snapping (page 237).
222 | Chapter 8 Converting Raster Entities to Vector

Quick Reference
Menu
Image ➤ Vectorization Tools ➤ Contour Follower
Raster Design Toolbar
Command Line
vfcontour
Using the 3D Polyline FollowerThis tool interacts with raster entities and existing vectors to create AutoCAD3D polylines.
When using the 3D Polyline Follower, you can either draw a polyline fencethat intersects raster contours, or you can select an existing polyline.ProdNameShort then follows the polyline, pausing at each intersection toprompt for elevation. At each such raster impact point (page 395), the followerautomatically inserts a vertex and prompts you to enter elevation data. Youcan reference the elevation of existing vectors by using OSNAP to place thepolyline vertices on these vectors. When the follower pauses at a vertex,ProdNameShort uses the elevation values of the intersecting vector entity asthe default value when it prompts for elevation.
At each vertex, you can take one of the following actions:
■ Enter an elevation.
■ Press Enter to accept the current elevation value.
■ Interpolate the value based on the previous and next elevation.
■ Use the elevation value of an existing vector that you specify.
■ Undo the last elevation entered.
■ Skip the current raster impact point.
■ Insert another vertex, then enter an elevation value for it.
■ Move the current vertex.
Using the 3D Polyline Follower | 223

NOTE To make the most efficient use of the 3D Polyline Follower, you should firstadjust the settings on the VTools Follower (page 360) tab on the Raster DesignOptions dialog box.
To create a 3D Polyline
1 Click Image menu ➤ Vectorization Tools ➤ 3D Polyline Follower.
The following prompt appears:
Specify first fence point or [follow Vector]:
2 Do one of the following:
■ Click several points to define a polyline fence that intersects severalcontours.
■ Enter v (Follow Vector) and press enter, then select an existing vectorpolyline for the follower to use.
TIP If you have already vectorized a contour, use OSNAP to snap a polylinevertex to that contour. ProdNameShort uses its elevation as the default whenthe follower pauses at that vertex.
The following prompt appears:
Specify elevation, press Enter to accept or[Interpolate/Existing/Undo/Skip/iNsert/Move]:
3 Do one of the following:
■ Enter an elevation, then press Enter.
■ Press Enter to accept the current elevation value.
■ Enter i (Interpolate) to interpolate the value based on the previouselevation and the next elevation.
■ Enter e (Existing), then click a vector entity from which to copy theelevation.
■ Enter u (Undo) to undo the last elevation entered.
■ Enter s (Skip) to skip the current raster impact point.
■ Enter n (Insert), then click a point to insert another vertex for thepolyline.
■ Enter m (Move), then click a point to move the current vertex.
224 | Chapter 8 Converting Raster Entities to Vector

4 Repeat step 3, or press Enter to exit the command.
NOTE When following an existing polyline, the 3D Polyline follower considers theend nearest the point you picked as the start point, regardless of the original startor endpoint for the polyline.
TIP Use raster snapping to make it easier to pick points on the raster entity youare converting. For more information, see Raster Snapping (page 237).
Quick Reference
Menu
Image ➤ Vectorization Tools ➤ 3D Polyline Follower
Raster Design Toolbar
Command Line
vf3dpoly
Vectorizing Raster TextYou can replace raster text with vector text either by retyping the text or byusing automated text recognition tools.
When retyping the text, you have a choice of two tools:
■ The Text tool can replace a single line of raster text with a single line ofAutoCAD text. You control the height, baseline angle, and justificationfor the text entity.
■ The Multiline Text tool can replace multiple lines of raster text with ablock of AutoCAD multiline text (Mtext).
Once you have entered the text for the Text or Multiline text tools,ProdNameShort may prompt you to remove the original raster text. Use theVTools General (page 362) tab of the Raster Design Options dialog box to setthe method of removing this text.
Vectorizing Raster Text | 225

Text Recognition
ProdNameShort’s text recognition tools can recognize raster text in an imageand convert it to AutoCAD vector text. These tools can recognize bothmachine-printed and hand-printed text displayed as plain text or text withina table.
NOTE The Recognize Text tool is optimized for images with a resolution of 300dpi. If the image resolution is less than 150, or greater than 400, you may getundesirable results.
Creating Single-Line Vector TextUse the Text vectorization tool to create a line of AutoCAD vector text as areplacement for raster text or as a new entity.
Each line of vector text created with this procedure is a separate entity thatcan be selected, edited, and moved. If you want to create a multiline textblock, see Creating Multiline Vector Text (page 228).
NOTE To make the most efficient use of the Text tool, you should first adjust thesettings on the VTools General (page 362) tab of the Raster Design Options dialogbox.
To create a line of vector text
1 Click Image menu ➤ Vectorization Tools ➤ Text.
2 The current style, height, and rotation are displayed and the followingprompt appears.
Specify insertion point or [Height/Angle/Baseline/Justify]:
Do one of the following:
■ Enter h (Height) to set the text height in pixels. Enter a value on thecommand line or click two points in the drawing to specify the textheight.
■ Enter a (Angle) to set the text angle. Enter a value in the currentAutoCAD units on the command line or click two points in thedrawing to indicate the start and endpoint of a line segment at thedesired angle. You will then be prompted to specify the insertionpoint.
226 | Chapter 8 Converting Raster Entities to Vector

■ Enter b (Baseline) to set the text baseline by clicking two points inthe drawing to indicate the start point and the direction of thebaseline.
■ Enter j (Justify) to specify the justification method for the text.
■ The following prompt is displayed:
Specify justification [Left/Center/Right/Align/Mid/Fit] <Left>:
For more information, see Justification Options (page 227).
3 In the drawing window, select an insertion point for the text, subject tothe justification method.
For example, for left-justified text, select an insertion point thatcorresponds to the lower-left corner of the text block.
The VText Edit dialog box is displayed.
4 Enter the text you want to place on your image and click OK.
5 The text is placed at the location that you selected.
NOTE If want to change the text, type e (Edit) to edit the text in the VTextEdit dialog box.
6 Do one of the following, depending on the VTools Removal Method youselected in the Raster Design Options dialog box:
■ If None, you can press Enter to end the command.
■ If Rub, see Rubbing Raster Data Within a Diagonal Region (page 153).
■ If REM, see Defining REM Enhanced Bitonal Regions (page 176).
7 You can continue to replace raster text with vector text, use the COPYLASToption, or press Enter to end the command.
NOTE The COPYLAST command displays the VText Edit dialog box wherethe last text string you placed in the drawing is displayed. You can edit thistext string if necessary, then click OK and pick an insertion point for the copy.
Justification Options
■ You can justify text in the following ways:
■ Left, to place the insertion point at the left side of the text baseline.
Creating Single-Line Vector Text | 227

■ Center, to place the insertion point at the center of the text baseline.
■ Right, to place the insertion point at the lower-right corner of the textbaseline.
■ Align, to select two points to define the text baseline. This option doesnot stretch or compress the text like the Fit option; it maintains the aspectratio of the text style and overrides any height setting you have specified.With this option, you do not need to specify an insertion point.
■ Mid, to place the insertion point in the middle of the text block.
■ Fit, to select two points to define the baseline for the text. This option usesthe height that you specify and stretches or compresses the text to fit intothe length specified. With this option, you do not need to specify aninsertion point.
Quick Reference
Menu
Image ➤ Vectorization Tools ➤ Text
Raster Design Toolbar
Command Line
vtext
Creating Multiline Vector TextUse the Multiline Text vectorization tool to create a block of AutoCAD vectortext (Mtext) as a replacement for raster text or as a new entity.
Each multiline block of vector text created with this procedure is a separateentity that can be selected, edited, and moved. If you want to create a singleline of vector text, see Creating Single-Line Vector Text (page 226).
NOTE To make the most efficient use of the Mtext tool, adjust the Removal Methodand other settings on the VTools General (page 362) tab of the Raster DesignOptions dialog box.
228 | Chapter 8 Converting Raster Entities to Vector

To create a block of multiline vector text
1 Click Image menu ➤ Vectorization Tools ➤ Multiline Text.
2 Enter a point to specify the first corner of the text box.
3 Enter a second point to define the angle of the baseline.
4 Enter a third point to define the extents of the Mtext box.
The Text Formatting dialog box is displayed. This is formally known asthe AutoCAD In-Place Text Editor.
5 Enter the replacement vector text in the In-Place Text Editor, and reviewtext properties to ensure they are correct. For more information, click
and click Learn About MTEXT.
6 Remove the original raster text. Do one of the following, depending onthe VTools Removal Method specified in the Raster Design Options dialogbox:
■ If None, press Enter to end the command.
■ If Rub, click points to create the removal region. For more information,see Rubbing Raster Data Within a Rectangular Region (page 155).
■ If REM, define a removal region around the raster text. For moreinformation, see Defining REM Enhanced Bitonal Regions (page 176).
Quick Reference
Menu
Image ➤ Vectorization Tools ➤ Multiline Text
Raster Design Toolbar
Command Line
vmtext
Creating Multiline Vector Text | 229

Using Text RecognitionText Recognition tools can convert the raster text in your image to AutoCADtext or AutoCAD Mtext.
The recognition engine recognizes both machine-printed and hand-printedtext displayed as text or as text in a table within the image. The text recognitioncommands can work on only one image at a time.
NOTE The Recognize Text tool is optimized for images with a resolution of 300dpi. If the image resolution is less than 150 or greater than 400, you may getundesirable results.
Entering Settings for Text RecognitionThese settings control the behavior of the Text Recognition tools.
For initial settings, access the Text Recognition Setup (page 371) dialog box.During the text recognition process, if you want to review or modify settings,use the Setup button in the Verify Text or Verify Table dialog box to returnto Text Recognition Setup.
The Text Recognition Setup settings determine the following output:
■ Recognition parameters for the search engine
■ Display values for the Verify Text or Verify Table dialogs
■ Text entity output to the AutoCAD drawing file
By default the Verify Text and Verify Table dialogs have two equally sizedpanes, the Image pane (upper pane) that displays the original raster text andthe Edit pane (lower pane) that displays the findings of the recognition engine.
For more information, see View Window Options (page 235) and Edit PaneOptions (page 235).
To enter settings for text recognition
1 Click Image menu ➤ Text Recognition ➤ Recognize Setup. The TextRecognition Setup (page 371) dialog box is displayed.
2 In the Input section, enter the following settings:
■ Text Format
■ Selection Shape
230 | Chapter 8 Converting Raster Entities to Vector

■ Dictionaries for spell checking
■ Language Character Set
■ Character types for recognition
NOTE If you select multiple character sets, it increases the number of possiblecharacters the system tries to recognize. As a result, the recognition processcan be slower and produce more errors.
TIP Review the area of text you select for recognition and ensure that youcheck all boxes for each class in the text.
3 In the AutoCAD Output section enter the following settings:
■ Output Type
■ Text Height
■ Removal Method
■ AutoCAD Style
4 Under Verification Display enter any format settings for the textrecognition engine to ignore.
5 If you want to display the original raster test in a small window abovethe text being verified in the Edit pane of the Verify Text dialog box,select Enable Verifier.
6 Click OK.
Quick Reference
Menu
Image ➤ Text Recognition ➤ Recognize Setup
Raster Design Toolbar
Command Line
irecsetup
Using Text Recognition | 231

Dialog Box
Text Recognition Setup Dialog Box (page 371)
Recognizing and Converting TextUse the text recognition tools to select raster text in your drawing and convertit to AutoCAD text or multiline text (Mtext).
Separate tools exist for recognizing plain text and text within a table. Theyare very similar in operation, so both are described together in this topic.
Settings you enter in the Text Recognition Setup (page 371) dialog boxdetermine the search parameters for the text recognition engine and thedisplay of recognized text in the Verify Text window. Because no textrecognition program is 100% accurate, you should carefully review not onlythe highlighted areas, but all text in the Edit window. For more information,see Using the Verify Text Window (page 234).
NOTE Depending on the results displayed in the Edit pane, you may want tomodify search parameters. To return to the Text Recognition Setup dialog boxclick the Setup button in the Edit pane.
NOTE The Recognize Text feature is optimized for images with a resolution of300 dpi. Images of resolution less than 150 or greater than 400, may returnundesirable results.
NOTE This procedure assumes that you have adjusted text recognition settingsfor the drawing. For more information, see Entering Settings for Text Recognition(page 230).
To recognize and convert text in a drawing
1 Click Image menu ➤ Text Recognition ➤ Recognize Text. Or ClickImage menu ➤ Text Recognition ➤ Recognize Table.
2 On the left side of the text or table that you want to convert, specify thefirst corner point for the rectangle or polygon that will enclose the textarea.
3 Specify an angle at the command line. If the area of text to be recognizedis horizontal, enter 0. If the area of text is angled, pick a second point tospecify the angle in the drawing, or enter the numeric value at thecommand line.
232 | Chapter 8 Converting Raster Entities to Vector

NOTE The program maintains the angle you establish as a default, until youenter a new angle.
4 Click OK. The Verify Text window is displayed. A progress bar displaysat the bottom of the window as the recognition is taking place.
5 Review the recognized raster text in the View window using options onthe View window toolbar. For more information, see View WindowOptions (page 235).
6 Review the recognition results in the Edit pane using the options on theEdit pane toolbar. For more information, see Edit Pane Options (page235).
7 Edit the recognized text in the Edit pane. Click the Find Next button todisplay suspect words or rejected characters. Rejected characters can becaused by speckles or badly formed letters in the text.
8 To replace a suspect word, select a word from the Change To list or typethe correct word in the Change To box and click Replace.
NOTE Replacing a rejected character may require copying and pasting aspecial character from the Windows Character Map. From the Start buttonselect Programs ➤ Accessories ➤ System Tools ➤ Character Map. Selecta character and Click Copy. Paste the character from the map into the Editpane in the Verify Text window.
TIP Click Add To Dictionary to add specific words or acronyms to theRecognition dictionary. At the end of the command you are prompted tosave these words to the AutoCAD user dictionary.
9 Select the text style from the AutoCAD style list to be used when the textis inserted into the drawing.
10 Select Text or Mtext in the Output To list, to determine how the verifiedtext is inserted into the drawing.
11 In the Justify list, select the justification (alignment) for the text whenit is inserted into the drawing.
12 Optionally, click Setup to change settings in the Text Recognition Setupdialog box.
NOTE Use the UNDO command if you are not satisfied with the new text inthe drawing.
Using Text Recognition | 233

13 Optionally, click Export to save the file as a text file.
TIP Printed copy of the recognized raster text can be useful for reviews andhard copy edits.
14 Click OK to insert the AutoCAD text or Mtext into the drawing.
Quick Reference
Menu
Image ➤ Text Recognition ➤ Recognize TextImage ➤ Text Recognition ➤ Recognize Table
Raster Design Toolbar
Recognize Text
Recognize Table
Command Line
irectextirectable
Using the Verify Text WindowThe Verify Text window has two panes; the View pane (upper pane) and theEdit pane (lower pane). You can control the ratio of the display size in thesepanes by clicking and dragging the divider bar at the bottom of the View pane.You can expand the Verify Text window by clicking and dragging a corner.
■ The View pane displays the original raster text to be recognized. The rastertext is shown deskewed and is horizontally aligned with the dialog box.You can use the toolbar to zoom and scroll within the pane and to printthe results.
■ The Edit pane displays the recognized text. Suspect words are highlightedin green, rejected characters are highlighted yellow and characters thatwere not recognized display as red tilde (~) characters.
You can make corrections directly in the Edit pane or you can use the FindNext button to highlight the suspect words and rejected characters. In each
234 | Chapter 8 Converting Raster Entities to Vector

case, you can select a replacement word or character from the Change To listor enter the correct word and click Replace. Any changes to a word or characterremoves the highlighting for that word. Rejected characters (displayed as redtildes) remain in place and highlighted until they are replaced. For somecharacters, you may want to copy special characters from the WindowsCharacter Map into the Edit pane.
Using the options on the toolbar you can zoom and scroll within the Editpane, change formatting and print the results. When you click in the Editpane, the original raster text is also displayed for comparison purposes. Byclicking the Add To Dictionary button you add words or abbreviations to therecognition dictionary.
View Window Options
Zoom Width: the recognized raster text fills the width of the view windowand there is no horizontal scroll bar.
Zoom Height: the recognized raster text fills the height of the view windowand there is no vertical scroll bar.
Zoom Extents: the recognized raster text is completely contained in theview window at the greatest zoom possible.
Zoom In: the recognized raster text expands in the view window by afactor of 10%.
Zoom Out: the recognized raster text shrinks in the view window by a factorof 10%.
Print Image: the recognized raster text can be printed at a 1:1 ratio thatis determined by the DPI in the original image. When you click the Print iconthe standard windows Print dialog box is displayed.
Edit Pane Options
Zoom Width: the recognized raster text fills the width of the view windowand there is no horizontal scroll bar.
View Window Options | 235
Zoom Height: the recognized raster text fills the height of the view windowand there is no vertical scroll bar.
Zoom Extents: the recognized raster text is completely contained in theview window at the greatest zoom possible.
Zoom In: expands the recognized raster text in the view window by afactor of 25% of its' normal size. The text may be zoomed in to a maximumfactor of 300%.
Zoom Out: shrinks the recognized raster text by a factor of 25% of its' normalsize. The raster may be zoomed out to a maximum factor of 25%.
Bold: toggles the bold attribute for selected text in the editor window.
Italic: toggles the italic attribute for selected text in the editor window.
Underline: toggles the underline attribute for selected text in the editorwindow.
Non-printing characters: specifies whether the non-printing characterssuch as TAB or NEW-LINE are to be displayed.
Undo: reverses the last editing action.
Print image: displays the standard Windows Print dialog box.
NOTE The Edit window supports standard editing functions from the keyboard.
236 | Chapter 8 Converting Raster Entities to Vector

Raster Snapping
Raster Snap makes it easy to select points on raster entities when you are using vectorizationtools (VTools) or REM commands.
NOTE Raster Snapping works only with bitonal images.
You can use raster snapping to move your AutoCAD cursor precisely to the center, end, corner,intersection or edge of a bitonal raster entity. When raster snapping is on (active), RasterDesign displays a snap window (page 398) around the AutoCAD cursor. This window moveswith the AutoCAD cursor and displays the crosshairs over points you can snap to.
Raster snap modes are very similar to AutoCAD object snap modes (OSNAP), except that theysnap to raster objects instead of to vector objects. Also, Raster Snap is active only when youare in a command and are being prompted for a point. Raster Snap settings are located onthe Raster Snap tab of the AutoCAD Drafting Settings dialog box.
Conflicts can occur between raster snapping and other utilities that control the cursor, suchas Mechanical Desktop’s “Ignore Z Coordinate” feature. When a conflict occurs, the applicationthat cannot gain cursor control displays an error message such as “Unable to Register InputPoint Filter.” If Raster Design’s Raster Snap interferes with a cursor control feature in anotherapplication, you can turn off Raster Snap. If another application is interfering with RasterSnap, consult that application's documentation for details on how to disable the conflictingfeature.
See also:
■ Manipulating REM Objects (page 187)
■ Converting Raster Entities to Vector (page 203)
Specifying Raster Snap SettingsYou can configure raster snapping and toggle it on and off on the Raster Snapstab of the Drafting Settings dialog box.
9
237

Raster Snap is active only when you are in a command and are being promptedfor a point.
To set the snap settings
1 Click Click Image ➤ Raster Snap..
2 On the Raster Snap (page 309) tab, under the Snap Modes section, selectthe snap mode or modes you want to use.
If you choose more than one snap mode, then the cursor snaps to theclosest of the possible snap points. For more information, see Snap Modes(page 238).
3 In the snap window (page 398) box, type the desired size (up to 300 pixels)for the snap window. The larger you make the snap window, the longerRaster Design takes to search for points.
NOTE Because the snap window is measured in image pixels, not screenpixels, the size of the snap window changes with the zoom level.
Quick Reference
Menu
Click Image ➤ Raster Snap.
Raster Design Toolbar
Command Line
isnap
Dialog Box
Raster Snap Tab (Drafting Settings Dialog Box) (page 309)
Snap ModesSeveral snap modes are available to snap to useful points on raster entities.
■ Center snaps to the center of a raster line. The entire width of the linemust be in the snap window.
238 | Chapter 9 Raster Snapping

■ End snaps to the end of a raster line.
NOTE When a line ends because it intersects another line, this is considered anintersection, not an end point.
■ Corner snaps to the intersection of 2 raster lines.
■ Intersection snaps to the intersection of 3 or more raster lines. The entireintersection must be in the snap window.
■ Edge snaps to the edge of a raster line. Any part of the raster line can bein the snap window.
NOTE Raster Snap is active only when you are in a command and are beingprompted for a point.
Snap Modes | 239

240

Configuring Raster Design
You can configure the appearance and behavior of ProdNameShort using the Options dialogbox and other tools.
Use toggle controls on the Image menu to control image frames and the Raster Design QuickBar. The ProductNameShort Options Dialog Box (page 351) allows you to change many defaultsettings.
Changing the Quick Bar VisibilityYou can use the Toggle Quick Bar command to turn the Raster Design QuickBar on and off.
Use the Quick Bar to set raster snap modes and controls for the vectorizationtools.
For more information, see Snap Modes (page 238) and The Quick Bar (page 298).
To make the Quick Bar invisible or visible
■ Click Image ➤ Toggle Quick Bar..
Quick Reference
Menu
Click Image ➤ Toggle Quick Bar.Image ➤ Toggle Quick Bar
Raster Design Toolbar
10
241

Command Line
iqbar
Changing the Image Frame VisibilityAn image frame (page 391) encloses an image. You can make an image frameinvisible while you continue to display the image.
To make frames invisible or visible
■ Click Image ➤ Toggle Frames..
NOTE When frames are invisible, or when an image is on a locked or frozen layeror on a layer that is turned off, you cannot select the image by clicking the frame.However, if frames are not displayed but the image is on an editable layer, youcan select the image using the Shift+ left-click method. For more information, seeSelecting an Image (page 79).
See also:
■ Image Frame Display (page 59)
■ Linetype of an Image Frame (page 61)
Quick Reference
Menu
Click Image ➤ Toggle Frames.Image ➤ Toggle Frames
Raster Design Toolbar
Command Line
iframe
Setting the Default Internet Location for ImagesYou can specify an Internet location to start from when retrieving or savingimages.
242 | Chapter 10 Configuring Raster Design

The default Internet location is loaded each time you click to go to theInternet from either the Insert Image dialog box or the Save As dialog box.From this location, you can use standard Internet navigation methods tosearch or browse to another location as required.
To set the default Internet location for browsing files
1 Ensure that the Tools menu is visible in the application window. Forexample, if you are working in Land Desktop 2005 and the Tools menuis not displayed, click Projects ➤ Menu Palettes. Then choose LandDesktop 2005 Complete and click Load.
2 Click Tools menu ➤ Options.
3 On the Files tab, click + beside Menu, Help, and Miscellaneous Files Namesto display its sub-list.
4 Click Default Internet Location, then click Browse.
5 In the Select a File dialog box, do one of the following:
■ Enter the URL to an Internet location, then choose Open.
■ Click
■ Navigate to an Internet location, then click OK.
6 Click OK.
Quick Reference
Menu
Tools ➤ Options
Raster Design Toolbar
Command Line
options
Dialog Box
IOptions (standard AutoCAD dialog box)
Setting the Default Internet Location for Images | 243

Setting the OptionsThe ProductNameShort Options Dialog Box (page 351) provides many settingsfor the control of Raster Design tools and operations.
Any settings you specify here persist as default settings for the next session.
Contour Vector Separation OptionsThese settings are used in vectorization to specify vector line widths forcontours based on their elevation interval.
For instance, you might set the elevation interval for major contours to 50,and the elevation interval for minor contours to 10. If you then followed acontour and set the elevation to 200, the resulting vector contour would beassigned to the major layer. Likewise, if you followed a contour and set theelevation value to 220, the resulting vector would be assigned to the minorlayer.
TIP If you are using vector separation to control the layer and polyline width ofvectors created from the Contour Follower, it is a good idea to use the same valuefor the Minor Interval and the Elevation Interval on the VTools Follower tab of theRaster Design Options dialog box. For more information, see VTools FollowerSettings (page 270).
To change the Contour Vector Separation Options
1 Click Image menu ➤ Options. The Raster Design Options (page 351)dialog box is displayed.
2 Click the VTools General tab.
3 Click the Vector Separation button.
4 Click the Contour (page 375) tab.
5 If you want to assign layer and polyline width values to contours basedon their elevation interval, select Separate Contours By Elevation.
6 If you have ProdNameShort installed on Autodesk Land Desktop and youwant to use its settings for minor and major layers and intervals, selectUse Autodesk Land Development Desktop’s Settings.
7 In the Minor section, set the elevation Interval for minor contours, thenselect a default Layer and specify a Polyline Width for these contours.
244 | Chapter 10 Configuring Raster Design

NOTE ProdNameShort first checks to see if the elevation is a multiple of theMajor Interval.
8 In the Major section, set the elevation interval for major contours, thenselect a default Layer and specify a Polyline Width for these contours.
9 If you want to import vector separation settings, click Import. Vectorseparation files have a .vs extension.
10 If you want to export the current vector separation settings, click Export.
11 If you want to make the current vector separation settings the defaultvalues, click Save As Default.
12 Click OK to exit the dialog box.
Quick Reference
Menu
Image ➤ Options
Raster Design Toolbar
Command Line
ioptions
Dialog Box
Contour Tab (Vector Separation Options Dialog Box) (page 375)
Correlation DefaultsThese settings specify default values for Raster Design to use whenever animage does not have correlation data.
The correlate (page 386) data for most images is stored in the image file header,or in a resource file, or in the drawing file. However, some images may nothave correlation data.
Correlation Defaults | 245

NOTE Setting the correlation defaults can save you time if you have multipleimages that require the same insertion point, scale, rotation, and density (page387).
To set the correlation defaults
1 Click Image menu ➤ Options. The Raster Design Options (page 351)dialog box is displayed.
2 Click the Image Defaults tab.
3 Under Insertion Point, type default insertion point coordinates in the Xand Y boxes. The precision of this point depends on the precision valuein the AutoCAD Units Control dialog box.
4 If you want to set an elevation for the frame, then type the elevation inthe Z box.
NOTE This value is useful if you want to establish the elevation of a floorplanimage, for example.
5 In the Scale box, type a default scale. Image scale does not change thescale of the vector drawing.
6 In the Rotation box, type a default rotation angle. The unit ofmeasurement depends on the selected value in the AutoCAD UnitsControl dialog box.
7 Under Density , in the Value box, type a default density. This is usuallythe scanned resolution (page 395). For example, if the majority of yourimages are scanned at 300 dots per inch, type 300 in this box.
8 Under Density, in the Units box, type a default density unit. For example,if the majority of your images are scanned at 300 dots per inch, set Inchesas the default.
9 Under Vertical Units, select either Meters or US Survey Feet.
10 Click OK to accept the defaults.
Quick Reference
Menu
Image ➤ Options
246 | Chapter 10 Configuring Raster Design
Raster Design Toolbar
Command Line
ioptions
Dialog Box
Image Defaults Tab (ProductNameShort Options Dialog Box) (page 351)
Correlation Search PathsThese paths specify the default location of image correlation data.
Correlation files store data about an image insertion point, scale, rotation,and density (page 387). Correlation paths can specify a folder on a local ornetwork drive or a location on the Internet. The read path specifies whereProdNameShort searches when loading correlation information. The writepath specifies where ProdNameShort puts correlation information whenexporting images.
Previous versions of ProdNameShort (CAD Overlay GSX and ESP) createdresource files to store information about an image. ProdNameShort and CADOverlay versions 7.5 and above store this information in the drawing file, andcreate resource files only when you export an image. For more information,see Exporting Images (page 48). If you insert an image with an associatedresource file into another drawing, then ProdNameShort incorporates thecorrelation information from the resource file.
When you insert an image, ProdNameShort looks in the read path to see if aresource file or world file is associated with the image. If so, you can selectthis file as the source of correlation information. If you leave the read pathblank, ProdNameShort searches only the folder where the image was stored.
To set the correlation search paths
1 Click Image menu ➤ Options. The Raster Design Options (page 351)dialog box is displayed.
2 Click the Paths tab.
3 Under Correlation Search Paths, enter a path in the Read Path text box.or click Browse, then choose one of the following:
■ Local, to navigate to a folder on a local or network drive.
Correlation Search Paths | 247
■ Web, to navigate to an http or ftp location.
TIP A quick method to copy a URL to the Read Path text box: Navigate to apage containing a link to the page you want, then right-click and chooseCopy Shortcut on the shortcut menu to copy the URL to the WindowsClipboard. Paste the URL in the Read Path text box by pressing Ctrl+V.
4 Enter a path in the Write Path text box, or click Browse, then choose oneof the following:
■ Local, to navigate to a folder on a local or network drive.
■ Web, to navigate to an http or ftp location.
5 Optionally, select Use Correlation Search Path before using imagedirectory.
NOTE This path is respected when you are inserting images and exportingimages.
6 Optionally, select Search for Correlation Files on the Internet.
NOTE If this check box is not selected, ProdNameShort does not search theInternet for correlation files and ignores any URLs listed in the Read Path.
7 Click OK to exit the dialog box.
Quick Reference
Menu
Image ➤ Options
Raster Design Toolbar
Command Line
ioptions
Dialog Box
Paths Tab (ProductNameShort Options Dialog Box) (page 355)
248 | Chapter 10 Configuring Raster Design

General Vector Separation OptionsThese settings are used in vectorization to specify vector line widths, layerassignments, and the handling of non-continuous lines.
You can use the Width Table to automatically assign layer and polyline widthvalues to the vectors based on the width of the original raster. In this table,you specify how to handle lines of particular width ranges. Lines of a differentwidth are assigned the default values for layer and polyline width. You canalso specify default values for non-continuous entities, such as dashed lines,that override the values specified in the width table.
NOTE Vector Separation settings are not saved with the drawing. You can maintainthe current settings by using the Save As Default button, or by exporting thesettings to a separate file.
To change the General Vector Separation Options
1 Click Image menu ➤ Options. The Raster Design Options (page 351)dialog box is displayed.
2 Click the VTools General tab.
3 Click the Vector Separation button.
4 Click the General (page 373) tab.
5 If you want to assign layer and polyline width values to vectors based onthe width of the underlying raster, then in the Width Table section, selectUse Width Table.
6 To insert a new row in the Width Table, click Insert Below or Insert Above,then enter values for the minimum width (in pixels), maximum width(in pixels), layer, and polyline width.
TIP If you don't know the width of a given raster entity, click the Query Widthbutton, then click the raster entity. The Entity Width Information dialog boxappears and displays the raster entity's width in pixels and in AutoCAD units.If you want to use one of these values, you can use standard Windowstechniques for copying and pasting information from the clipboard. Click OKto return to the Vector Separation dialog box.
7 If you want to assign different values to dashed lines and othernon-continuous entities, then in the Non-Continuous Entities section,select Override Width Table for Non-Continuous Entities. Select defaultLayer and Polyline Width for these entities.
General Vector Separation Options | 249

8 In the Default section, select a default Layer and Polyline Width.
9 If you want to import vector separation settings, click Import. Vectorseparation files have a .vs extension.
10 If you want to export the current vector separation settings, click Export.
11 If you want to make the current vector separation settings the defaultvalues, click Save As Default.
12 Click OK to exit the dialog box.
Quick Reference
Menu
Image ➤ Options
Raster Design Toolbar
Command Line
ioptions
Dialog Box
General Tab (Vector Separation Options Dialog Box) (page 373)
General VTool SettingsThese settings specify the behavior of line, circle, arc, and polyline vectorizationtools.
To change general settings for Line, Circle, Arc, and Polyline tools
1 Click Image menu ➤ Options. The Raster Design Options (page 351)dialog box is displayed.
2 Click the VTools General tab.
3 In the Removal Method section, click one of the following settings:
■ None does not delete the raster as you trace it.
250 | Chapter 10 Configuring Raster Design

■ Rub automatically rubs the underlying raster. This setting uses theRub/ Crop Line Width setting to determine the width of the raster itrubs. For more information, see Rub and Crop Line Width (page 266).
■ REM deletes the underlying raster. However, unlike the Rub setting,this option recognizes raster line width and leaves raster intersectionsintact.
NOTE The 3D Polyline Follower always uses the None option.
4 If you want the line, polyline, and arc tools to stop at vector intersectionsduring one-pick selection, then in the Line, Circle, Arc and PolylineSettings section, select Stop at Vector Intersection. This is useful if muchof a drawing has been vectorized and the vectorization tools can dependon increasing amounts of vector data to make stopping decisions.
5 If you want the line and polyline tools to display a glyph that specifiesthe start point, select Display Start Point Glyph.
6 In the Verification List section, select the type of values to appear in theverification list:
■ Most Recently Used
■ Most Frequently Used
7 Specify the number of values to include in the verification list in theLength box.
8 If you want SmartCorrect to respect current AutoCAD drafting settingssuch as OSNAP, ORTHO, and POLAR, then in the SmartCorrect Settingssection select Respect Drafting Settings.
9 In the Correction Tolerance section, select one of the following options:
■ AutoCAD APERTURE uses the aperture settings from the Drafting tabof the AutoCAD Options dialog box to determine how far (in screenpixels) the resulting vector is allowed to shift in an attempt to respectAutoCAD drafting settings.
■ AutoCAD Units allows you specify how far (in AutoCAD units) theresulting vector is allowed to shift in an attempt to respect AutoCADdrafting settings. If you select this option, enter the number of unitsin the text box.
10 If you want ProdNameShort to round the values for vector entities createdusing one-pick selection, select Round Values. Rounding applies to the
General VTool Settings | 251

length and angle values for lines and polylines, and to the radius valuefor arcs and circles.
11 If Round Values is selected, select one of the following rounding options:
■ AutoCAD Precision (LUPREC/AUPREC) uses the precision value setin the Drawing Units dialog box.
■ Specified Precision uses the precision values you set in the associatedLength and Angle text boxes. Specified Precision rounds to a multipleof the value you entered. For instance, if you specified a lengthprecision of .03, ProdNameShort might round a line to 12.03, 12.06,12.09, and so on.
12 Click OK to exit the dialog box.
Quick Reference
Menu
Image ➤ Options
Raster Design Toolbar
Command Line
ioptions
Dialog Box
VTools General Tab (ProductNameShort Options Dialog Box) (page 362)
Image Detach MethodThis setting specifies whether to detach (page 387) an image from the drawingwhen you erase all frames that reference the image.
To choose an image detach method
1 Click Image menu ➤ Options. The Raster Design Options (page 351)dialog box is displayed.
2 Click the User Preferences tab.
252 | Chapter 10 Configuring Raster Design
3 Under Image Detach Options, select one of the following methods:
■ Ask Before Detach prompts you to before detaching an image.
■ Always Detach automatically detaches an image.
■ Never Detach does not detach an image.
4 Click OK to exit the dialog box.
NOTE If you select the Never Detach option, you can manually detach animage using the AutoCAD IMAGE command.
Quick Reference
Menu
Image ➤ Options
Raster Design Toolbar
Command Line
ioptions
Dialog Box
User Preferences Tab (ProductNameShort Options Dialog Box) (page 358)
Image DefaultsThese settings specify correlation data, density, and vertical units to use ifthese are not provided for an image.
To specify image default settings
1 Click Image menu ➤ Options. The Raster Design Options (page 351)dialog box is displayed.
2 Click the Image Defaults tab.
3 Specify default values for Insertion Point, Scale/Rotation, Density (inpixels per linear unit) and Vertical Units.
Image Defaults | 253

4 Click OK to exit the dialog box.
Quick Reference
Menu
Image ➤ Options
Raster Design Toolbar
Command Line
ioptions
Dialog Box
Image Defaults Tab (ProductNameShort Options Dialog Box) (page 351)
Image Mask OptionsThese settings specify whether masks are enabled, and the behavior of imagesoutside a mask boundary.
To change settings for mask options
1 Click Image menu ➤ Options. The Raster Design Options (page 351)dialog box is displayed.
2 Click the Image Mask tab.
3 Select Enable Mask to enable an existing mask for display.
4 Choose a default behavior for any images outside the image mask:
■ Do Not Affect prevents modifications to images that are outside themask boundary.
■ Hide Image(s) hides the images that are outside the mask boundary.
■ Unload Image(s) unloads from memory any images that are outsidethe mask boundary.
254 | Chapter 10 Configuring Raster Design
NOTE If you select Do Not Affect, any images that were previously unloadedby the mask must be manually reloaded if you want to view them. Any imagesthat were previously hidden by the mask must be manually shown. To showa hidden image, select the image frame, then right-click and click ShowImage.
5 If you select Hide Image(s) or Unload Image(s), you can select Show ImageFrame(s) to show the frames of hidden or unloaded images.
Quick Reference
Menu
Image ➤ Options
Raster Design Toolbar
Command Line
ioptions
Dialog Box
Image Mask Tab (ProductNameShort Options Dialog Box) (page 353)
Image ThumbnailsThis setting specifies whether to create an image thumbnail whenever yousave an image.
Image thumbnails greatly increase the speed at which you can preview imagesin the Raster Design Insert Image dialog box, the Histogram dialog box, andthe AutoCAD Image Adjust dialog box.
Saving an image thumbnail with each image increases the image file size onlyslightly. For more information, see Saving an Image (page 39).
To create thumbnails of images
1 Click Image menu ➤ Options. The Raster Design Options (page 351)dialog box is displayed.
2 Click the Feature Settings tab.
Image Thumbnails | 255

3 In the Thumbnail Option section, select Save Thumbnail with Image.
4 Click OK to exit the dialog box.
NOTE This option is used only with file formats that support embeddedpreviews.
Quick Reference
Menu
Image ➤ Options
Raster Design Toolbar
Command Line
ioptions
Dialog Box
Feature Settings Tab (ProductNameShort Options Dialog Box) (page 352)
Inserting Images From GSX or ESPThese settings specify how to handle images imported from drawings createdby CAD Overlay GSX or CAD Overlay ESP.
ProdNameShort handles images differently than CAD Overlay GSX and ESPdid. With GSX and ESP, you could paste a main image and up to nine referenceimages into your drawing. The main image was given the same filename asyour drawing.
NOTE There is no limit to the number of images you can insert into a drawingwith CAD Overlay versions 7.5 and above.
If you want to open a drawing in ProdNameShort that you created with GSXor ESP, you can enable an AutoPaste feature that locates and automaticallypastes the main image into your current drawing. When ProdNameShortpastes the main image into your drawing, it also pastes all of the referenceimages associated with the main image.
256 | Chapter 10 Configuring Raster Design

ProdNameShort searches along the AutoCAD project files search path for animage filename that matches the name of your drawing (the main image),but you can select which image types (file extensions) you want it to searchfor. For more information about setting the project files search path, see theAutoCAD online Help.
To insert GSX or ESP images into your drawing
1 Click Image menu ➤ Options. The Raster Design Options (page 351)dialog box is displayed.
2 Click the Paths tab.
3 Under AutoPaste, select AutoInsert.
NOTE If you try to open a drawing that you created in GSX or ESP but youdo not enable AutoPaste, then your drawing loads but your images are notdisplayed. To manually insert them, click Image menu ➤ Insert.
4 Select Prompt before AutoInsert if you want ProdNameShort to promptyou to insert the image it locates. Clear this check box if you want toinsert the image automatically without prompting.
5 Specify which file types you want ProdNameShort to search for bychoosing a file extension from the list, then add it to the Extension List.ProdNameShort searches for the image types in the order they appear inthis list. After it locates an image of the type specified, it stops searching.
6 Click OK to accept your changes and exit the dialog box.
NOTE ProdNameShort does not perform an AutoPaste if there are imagereferences already saved in the drawing (for example, if it is a drawingcontaining images you saved using version 7.5 or above of ProdNameShort).
Quick Reference
Menu
Image ➤ Options
Raster Design Toolbar
Inserting Images From GSX or ESP | 257

Command Line
ioptions
Dialog Box
Paths Tab (ProductNameShort Options Dialog Box) (page 355)
Locking Method for Image FilesThis setting is for users on a network to specify whether and how to lock filesthat are in use.
Locking provides write access for the first person that opens the file. Anyoneelse who opens the file can read it but is denied write access until the firstperson closes the file.
An image file is locked when ProdNameShort creates a lock file using the imagebase name with a .l_k extension. The lock file is stored in the same directoryas the image file or in the lock file directory if you specify one. When youinsert an image, ProdNameShort searches the image directory (or the lock filedirectory) to see if a lock file already exists for that image. If a lock file exists,then you are prompted that the file is read-only.
If you store lock files in a lock file directory, all raster image files with thesame base name as the inserted image are locked. For example, if you inserttutor.rlc, a tutor.l_k file is created in the lock directory. This locks the imagethat you inserted and any other files with the base name “tutor.”in anydirectory.
If you do not specify a lock file directory, the lock file is created in the directorywhere the image is saved. In this case, a lock file locks only images in thatdirectory with the same base name.
NOTE For locking to work properly, everyone on the network must use the samelocking method and directory.
To set the file locking method
1 Click Image menu ➤ Options. The Raster Design Options (page 351)dialog box is displayed.
2 Click the Feature Settings tab.
3 Under Locking Settings, select one of the following options:
■ No Locking, if you are not working on a network with other users.
258 | Chapter 10 Configuring Raster Design

■ Lock File, if you are on a network that does not support DOS FileSharing and if you are using more than one platform on the network.
■ OS/Network Locking, if you are on a network that supports DOS FileSharing and you are using more than one platform.
NOTE You cannot lock files on the Internet.
4 If you choose a locking option, you can specify the Lock File Directorywhere lock files will be saved. If you do not specify a directory, lock filesare stored in the same directory as the image file.
5 Click OK.
Quick Reference
Menu
Image ➤ Options
Raster Design Toolbar
Command Line
ioptions
Dialog Box
Feature Settings Tab (ProductNameShort Options Dialog Box) (page 352)
Message Display MethodThis setting specifies how ProdNameShort displays warnings during editingoperations.
To change the Message Display method
1 Click Image menu ➤ Options. The Raster Design Options (page 351)dialog box is displayed.
2 Click the User Preferences tab.
Message Display Method | 259

3 In the Message Display section, click one of these options:
■ No Messages, to prevent ProdNameShort from displaying warningswhile you are editing an image.
■ Command Line, to display warnings on the command line only.
■ Message Box, to display all warnings while you are editing an image.
4 Click OK to exit the dialog box.
Quick Reference
Menu
Image ➤ Options
Raster Design Toolbar
Command Line
ioptions
Dialog Box
User Preferences Tab (ProductNameShort Options Dialog Box) (page 358)
Mouse SettingsThese settings specify the function of mouse buttons when you are usingProdNameShort.
To set the mouse settings
1 Click Image menu ➤ Options. The Raster Design Options (page 351)dialog box is displayed.
2 Click the User Preferences tab.
3 Under Mouse Settings, select Shift + Left Click Image Select if you wantto select an image by pressing shift and clicking your left mouse button.This feature is useful when you are zoomed in on the image and cannotsee the image frame. For more information, see Selecting an Image (page79).
260 | Chapter 10 Configuring Raster Design

4 Click OK to exit the dialog box.
Quick Reference
Menu
Image ➤ Options
Raster Design Toolbar
Command Line
ioptions
Dialog Box
User Preferences Tab (ProductNameShort Options Dialog Box) (page 358)
New Image DefaultsThese setting specify default properties for a new ProdNameShort image.
Setting these defaults can save you time if you have multiple images thatrequire the same properties.
NOTE When you change the units of measurement, these units are applied to theother controls in the Default Image Properties section.
To set the new image defaults
1 Click Image menu ➤ Options. The Raster Design Options (page 351)dialog box is displayed.
2 Click the New Image tab.
3 To change the default physical width of the image in pixels, enter a valuein the Width box in the Default Image Properties section.
4 To change the default physical height of the image in pixels, enter a valuein the Height box.
5 Type a default density (or resolution (page 395)) for new images in theDensity box.
This defines both the horizontal and vertical density.
New Image Defaults | 261

NOTE You should set this value to the density at which your images arescanned.
6 In the Default Color Type section, click a color type for the new image:
■ Bitonal (1-bit), with two colors.
■ Grayscale (8-bit), with 256 shades of gray.
■ Indexed Color (8-bit), with 256 paletted colors.
■ True Color (32-bit), with up to 16.7 million colors.
NOTE Selecting True Color uses more system resources.
7 If you want the New Image dialog box to appear when you create a newimage, select Show New Image Dialog.
NOTE If this check box is not selected, ProdNameShort will default to thecommand line interface when you create a new image.
8 Click OK to accept the changes.
Quick Reference
Menu
Image ➤ Options
Raster Design Toolbar
Command Line
ioptions
Dialog Box
New Image Tab (ProductNameShort Options Dialog Box) (page 354)
QSave PreferenceThis setting specifies whether ProdNameShort prompts you to save the imagesyou edited when you use the AutoCAD QSave command to save a drawing.
262 | Chapter 10 Configuring Raster Design

To set the QSave Preference
1 Click Image menu ➤ Options. The Raster Design Options (page 351)dialog box is displayed.
2 Click the User Preferences tab.
3 If you want to be prompted to save your images when you use theAutoCAD QSave command, select Prompt during QSave.
4 Click OK to exit the dialog box.
Quick Reference
Menu
Image ➤ Options
Raster Design Toolbar
Command Line
ioptions
Dialog Box
User Preferences Tab (ProductNameShort Options Dialog Box) (page 358)
Raster Design Startup OptionsThis setting specifies how ProdNameShort starts up in relation to AutoCAD.
To choose a ProdNameShort startup option
1 Click Image menu ➤ Options. The Raster Design Options (page 351)dialog box is displayed.
2 Click the User Preferences tab.
3 If you want the Image menu to appear each time you run ProdNameShort,select Load Menu on Raster Design Startup.
4 If you want ProdNameShort to start each time you run AutoCAD, selectLoad Raster Design on AutoCAD Startup.
Raster Design Startup Options | 263

5 Click OK to exit the dialog box.
Quick Reference
Menu
Image ➤ Options
Raster Design Toolbar
Command Line
ioptions
Dialog Box
User Preferences Tab (ProductNameShort Options Dialog Box) (page 358)
Raster Entity Detection SettingsThese settings specify the way REM tools and vectorization tools detect andfollow raster entities.
The settings are divided among three categories:
■ Single pick options specify the maximum distance within which a rasterentity can be initially selected.
■ Multi-pick options specify the maximum distance within which raster canbe selected along a line or other selection path.
■ Non-continuous linetype detection settings specify the maximum lengthsof dashes and blanks in a non-continuous or dashed line.
To change the default settings for Raster Entity Detection
1 Click Image menu ➤ Options. The Raster Design Options (page 351)dialog box is displayed.
2 Click the Raster Entity Detection tab.
3 In the Single Pick Options section, enter a value in the Max Jump Length(Pixels) text box, or click Pick to select the jump length from an image.
264 | Chapter 10 Configuring Raster Design

4 Select Stop At Intersections to determine whether ProdNameShort detectssegments or entire primitives.
5 Select Use Raster Pick Gravity check box to define the size of the areaaround the point you pick in which ProdNameShort can search for raster.
6 If you selected Use Raster Pick Gravity, enter a numerical pixel widthvalue in the Pick Aperture (Pixels) text box to define a new aperture size.
7 Under Multi Pick Options, enter a value in the Float Tolerance (Pixels)box.
8 Under Non-Continuous Linetype Detection, enter a value in the MaxDash Length (Pixels) and the Max Blank Length (Pixels) box, or click Pickto select the length from an image.
9 Click OK to exit the dialog box.
Quick Reference
Menu
Image ➤ Options
Raster Design Toolbar
Command Line
ioptions
Dialog Box
Raster Entity Detection Tab (ProductNameShort Options Dialog Box) (page357)
REM SettingsThese settings specify the default color of REM objects, and the way REMobjects are copied to the clipboard.
The default color of REM objects is red. If you define REM objects in color orgrayscale images, only the vector boundary of the object is red. If you defineREM objects in a bitonal image, the entire object is red. Enhanced bitonalregion objects also have a red vector boundary.
REM Settings | 265
To change default settings for REM objects
1 Click Image menu ➤ Options. The Raster Design Options (page 351)dialog box is displayed.
2 Click the REM tab.
3 For Color of REM Objects, click Select to display the color palette.
4 Select a color and click OK.
5 Choose an option in the Clipboard Settings section. These options applywhen you use the REM Copy to Clipboard command (icopyss):
■ Display Capture maintains the display scale and rotation of the objectsin the REM selection set.
■ Native Capture copies the REM selection set data directly from theimage file, disregarding the display scale and rotation.
6 Click OK again to exit the Raster Design Options dialog box.
Any existing REM objects are now the color you selected.
Quick Reference
Menu
Image ➤ Options
Raster Design Toolbar
Command Line
ioptions
Dialog Box
REM Tab (ProductNameShort Options Dialog Box) (page 357)
Rub and Crop Line WidthThis setting specifies the line width to use with the Rub and Crop commands:Circle, Line, Polyline, Arc, and Crop Line.
266 | Chapter 10 Configuring Raster Design

This value is also used if you have Rub selected as your VTools RemovalMethod. As you trace your raster objects, the vectorization tools use therub/crop line width to determine the width of the raster that is rubbed. Formore information, see General VTool Settings (page 250).
Changes that you make to Autorub at the command line update the settingsin the Raster Design Options dialog box:
■ If you turn AutoRub off, None is selected as the VTools Removal Methodin the Raster Design Options dialog box.
■ If you turn AutoRub on, Rub is selected as the VTools Removal Method inthe Raster Design Options dialog box.
■ If you use the AutoRub command at the command line to change therub/crop line width, the value is updated in the Raster Design Optionsdialog box.
NOTE You can type autorub to use the command transparently.
To set the Rub and Crop line width
1 Click Image menu ➤ Options. The Raster Design Options (page 351)dialog box is displayed.
2 Click the Feature Settings tab.
3 Do one of the following:
■ Type a value (in AutoCAD units) in the Rub/Crop Line Width box.
■ Click Pick and then pick two points on your image to define the linewidth.
4 Click OK to exit the dialog box.
Quick Reference
Menu
Image ➤ Options
Raster Design Toolbar
Rub and Crop Line Width | 267

Command Line
ioptions
Dialog Box
Feature Settings Tab (ProductNameShort Options Dialog Box) (page 352)
Remove Under MethodThis setting specifies how the Remove Raster Under Vector tool removes rasterdata during vectorization.
To change the removal method for Raster Under Vector
1 Click Image menu ➤ Options. The Raster Design Options (page 351)dialog box is displayed.
2 Click the Feature Settings tab.
3 In the Removal Method section, select the Rub or REM option.
4 Click OK to exit the dialog box.
Quick Reference
Menu
Image ➤ Options
Raster Design Toolbar
Command Line
ioptions
Dialog Box
Feature Settings Tab (ProductNameShort Options Dialog Box) (page 352)
Vector Merge SettingsThese settings specify the behavior of future vector merges.
268 | Chapter 10 Configuring Raster Design

To change the vector merge defaults
1 Click Image menu ➤ Options. The Raster Design Options (page 351)dialog box is displayed.
2 Click the Vector Merge tab.
3 Under Prompting Options, select one of the following:
■ Select Prompt to Delete Vector if you want to be prompted to deleteall selected vectors after the Vector Merge command is completed.
NOTE Selecting this check box disables the Always Delete Vector and theNever Delete Vector options.
■ Click Always Delete Vector to delete all selected vectors after the vectormerge command is completed.
■ Click Never Delete Vector to preserve selected vectors after the vectormerge command is completed.
4 Under Merge Options, select any of the following options you want toincorporate in future vector merge operations:
■ Expand Image If Necessary, to expand your image to the extents ofthe vector.
■ Respect Display Order, to incorporate your current display order.
NOTE If a vector lies behind the image and Expand Image If Necessary isnot selected, then the vector is not merged into the image unless the imageis transparent. For more information, see Transparency Color of an Image(page 62).
■ Create New Raster, to create a new image rather than merge the vectorsinto an existing image.This is useful if, for instance, you want to transmit your drawinginformation in raster format.
5 Click OK to accept the changes.
Vector Merge Settings | 269
Quick Reference
Menu
Image ➤ Options
Raster Design Toolbar
Command Line
ioptions
Dialog Box
Vector Merge Tab (ProductNameShort Options Dialog Box) (page 359)
VTools Follower SettingsThese settings specify the behavior of follower tools during vectorization.Some settings apply only to the contour follower and the 3D polyline follower.
TIP If you are using vector separation to control the layer and polyline width ofvectors created from the Contour Follower, it is a good idea to use the same valuefor the Elevation Interval and the Minor Interval on the Contour tab of the VectorSeparation Options dialog box. For more information, see Contour VectorSeparation Options (page 244).
To change the VTools Follower Settings
1 Click Image menu ➤ Options. The Raster Design Options (page 351)dialog box is displayed.
2 Click the VTools Follower tab.
3 If you want to change the color ProdNameShort uses to mark the progressof the follower, click Select and choose a new follower color.
4 If you want ProdNameShort to automatically pan to display the currentdecision point on screen, select Pan to Decision Point.
5 If you want ProdNameShort to automatically close polylines and contourobjects where the endpoints are within a tolerance distance, select EndCurrent Polyline If Closed Loop Detected. This setting is useful for closingloops across labels in contour lines.
270 | Chapter 10 Configuring Raster Design

6 If you selected End Current Polyline If Closed Loop Detected, specify thetolerance distance in one of two ways: enter a numeric value, or clickPick and click two points in the drawing. Polylines whose endpoints fallwithin this distance will be automatically closed.
7 If you want to control how ProdNameShort draws the polylines andcontours produced by the follower, select Post Process Points. Optionally,move the Polyline Deviation slider to control how closely ProdNameShortimitates the raster polyline or contour.
■ High deviation creates a polyline with fewer points that is less faithfulto the original raster. Such polylines use less system resources.
■ Low deviation creates a polyline with more points that more closelymatches the raster path. Such polylines use more system resources.
8 In the Contour Settings section, select the type of entity the ContourFollower creates in the Contour Creates list.
NOTE The follower can only create contour objects if ProdNameShort isrunning on Autodesk Land Desktop. If you are running on Autodesk Civil 3D,you can add the contour data to the definition of a TIN surface.
9 In the Elevation list, click one of the following:
■ ELEVATION assigns an elevation value based on the AutoCADELEVATION variable.
■ Zero assigns an elevation value of 0.
■ Preset assigns the value that you specify in the Preset Elevation textbox to all polylines and contour objects created by the ContourFollower.
■ Prompt causes ProdNameShort to prompt you for elevation when thefollower is finished.
■ Use Existing causes ProdNameShort to prompt you to select an existingcontour or polyline to which the elevation value can be matched.
10 If you selected Prompt for Elevation, enter a value in Elevation Interval.ProdNameShort adds or subtracts this amount from the last elevationvalue you entered to create a suggested elevation value.
11 In the 3D Polyline Settings section, enter a value in Elevation Interval.ProdNameShort adds or subtracts this amount from the last elevationvalue you entered to create a suggested elevation value.
VTools Follower Settings | 271

12 If you want the follower to pause only at raster intersections, ignoringother vertices, select Use Raster Impact Points Only.
13 If you want to prevent the follower from pausing at raster speckles, selectIgnore Raster Speckles.
14 If you selected Ignore Raster Speckles, enter a pixel value in the SpeckleSize (Pixels) text box, or click the Pick button to specify a speckle size byclicking a speckle in the image, or by clicking two points to define arectangular window.
15 Click OK to exit the dialog box.
Quick Reference
Menu
Image ➤ Options
Raster Design Toolbar
Command Line
ioptions
Dialog Box
VTools Follower Tab (ProductNameShort Options Dialog Box) (page 360)
272 | Chapter 10 Configuring Raster Design

Troubleshooting andReference Guide
This chapter includes troubleshooting information, and a reference guide to Raster Designmenus, commands, and toolbars.
TroubleshootingIf the information you need cannot be readily found in the AutoCAD RasterDesign User's Guide, the following troubleshooting topics may help you findthe solution you're looking for.
Correcting Image Display Order using REGENIf you find that the image display ordering seems incorrect when you open adrawing, select an image, or use an editing command, then you can use REGENto restore the proper order. The image display order is affected by the followingconditions:
Image Insertion Order
AutoCAD respects image insertion order first. For example, if you insert imagesA, B, C in that order, and then reorder them so that they are arranged as B, C,A, then you need to use REGEN to restore the B, C, A order when you open thedrawing again. This is an optimization feature that AutoCAD applies to thedisplay order of all objects, not just to images.
A
273

Image Editing
When you use an editing command on an image, that image may rise to thetop of the display order. Use the AutoCAD REGEN command to restore theproper display order.
For more information, see Changing the Display Order of Images (page 73).
Raster Snap TroubleshootingIf you set a raster snap setting and you cannot see the snap window, thenmake sure your drawing VPOINT is set to 0,0,1.
If you still cannot see the snap window, then adjust the snap window size ortry zooming into the image. The size of the snap window changes when youchange the zoom level.
When you use raster snapping with AutoCAD OSNAPs, the OSNAPs takepriority. You can press F3 to turn off any running OSNAPs if they areconflicting with the raster snaps.
For more information, see Raster Snapping (page 237).
Plotting Raster ImagesAutoCAD allows you to plot color, grayscale, and bitonal images with colorvector information in either landscape or portrait mode in both paper andmodel space.
For more information, see “Plot Drawings” in the AutoCAD online Help orprinted Users Guide.
Images that are Not EditableThe following table lists the reasons why an image may not be editable andwhat you can do to make it editable.
ThenIf you want to edit the im-age, and the image is
Have the other user close the drawing that con-tains the locked image. For more information,see Locking Method for Image Files (page 258).
locked
274 | Appendix A Troubleshooting and Reference Guide

ThenIf you want to edit the im-age, and the image is
NOTE If the image file is still locked even afterthe other person closed the drawing, then closethe drawing you are working on and reopen it.Or, you could erase the image from your drawingand then reinsert it.
Unlock, thaw, or turn on the layer that the imageis on.
on an AutoCAD layer that islocked, frozen, or invisible
Save the image to a file format that Raster Designcan read and write. For more information, see
in a format that Raster Designcan only read
Saving an Image to Another File Name, Type, orLocation (page 43).
Copy the image from the CD-ROM to a local ornetwork drive you can write to.
stored on a read-only device (forexample, a CD-ROM)
Return the AutoCAD UCS to plan view.in perspective view
Set the status of the file to be read/write.a read only file
To find out why an image is not editable, and what you can do to make iteditable, you can click on the Edit Status dialog box.
Problems Inserting Images from the InternetTo use the Raster Design Internet feature, you must have Internet or Intranetaccess and an Internet browser installed on your system. You must also havecertain components of Microsoft Internet Explorer installed on your system.These components are installed when you select the Full Install installationoption in AutoCAD, or if you select the Internet Tools option during a customAutoCAD installation.
If you connect to the Internet through your company's network, you mayneed to set up a proxy server configuration. Proxy servers act as security barriersby shielding information on your company's network from potential securityrisks due to external Internet access. See the Internet applet in the WindowsControl Panel or contact your network administrator for details about howto configure a proxy server in your network environment.
Problems Inserting Images from the Internet | 275

Sharing Projects with Images from Different LocationsOften, two or more people work on a project together. If the images they'reusing are stored in different locations, problems can occur. For instance, twopeople are sharing a project in which the image is stored on CD while theAutoCAD drawings are stored on their respective hard drives. One person'sCD drive is labeled E, and the other's is labeled H. Each time they send filesback and forth they have to browse to each image's path.
Both users can get around this by setting their project paths to the differentlocations for the images. (To access the project paths, click Tools menu ➤
Options.) If they insert the image using IMAGEATTACH, they can choose toleave the path off the image. When the Raster Design tries to resolve this, itwill search each of the following locations for the filename with extension (ifthere is one). If it is not found, every valid extension is tried:
■ the saved path
■ the current directory
■ the directory of the drawing
■ the AutoCAD “current project” files search paths
Command-Line CommandsThe following table lists Raster Design commands in alphabetic order, withdescriptions and related Help topic links.
Sets the Rub/Crop line width.autorubRelated topic: Rub and Crop Line Width (page 266)
Docks the Image Manager toolspace.docktsRelated topic: Controlling the Image Manager Toolspace(page 65)
Floats the Image Manager toolspace.floattsRelated topic: Controlling the Image Manager Toolspace(page 65)
Hides the Image Manager toolspace.hidetsRelated topic: Controlling the Image Manager Toolspace(page 65)
276 | Appendix A Troubleshooting and Reference Guide

Displays the Raster Design version number, serial number,and name of the registered owner.
iabout
Uses filters to smooth, thin, thicken, separate, or skeletonizebitonal images.
ibfilter
Related topic: Using Bitonal Filters (page 112)
Changes an image's dimensions in the X or Y direction.ibiasRelated topic: Adjusting the Image Bias (page 86)
Captures the current image.icaptureRelated topic: Capturing an Image (page 47)
Clears the selected raster entity manipulation (REM) objects.iclearRelated topic: Clearing REM Objects (page 197)
Clears all REM objects in the current drawing.iclearallRelated topic: Clearing REM Objects (page 197)
Converts selected REM objects to a new raster image.iconvtoimgRelated topic: Converting REM Objects to a New Raster Im-age (page 199)
Makes differences in shading more distinct.iconvolveRelated topic: Reducing Harshness and Noise in an Image(page 105)
Copies a raster entity to the clipboard.icopyssRelated topic: Using REM Copy To Clipboard Command(page 200)
Crops raster data outside a rectangle aligned at any angle,but image frame remains at the angle of the source imageat the time the crop is made.
icropalign
Related topic: Aligned Rectangular Cropping (page 148)
Crops raster data outside a circular region.icropcircRelated topic: Circular Cropping (page 145)
Crops raster data around a diagonal region.icropdiagRelated topic: Diagonal Cropping (page 147)
Crops raster data around a line.icropline
Command-Line Commands | 277
Related topic: Line Cropping (page 145)
Crops raster data outside a polygonal region.icroppolyRelated topic: Polygonal Cropping (page 147)
Crops raster data outside a rectangular region. Image framematches angle of crop.
icroprect
Related topic: Rectangular Cropping (page 146)
Deletes a REM arc primitive.idelarcRelated topic: Removing Raster Entities Using REM Com-mands (page 156)
Deletes a REM circle primitive.idelcircleRelated topic: Removing a REM Circle Primitive (page 159)
Deletes a REM line primitive.idellineRelated topic: Removing a REM Line Primitive (page 158)
Removes a line, arc, or circle using Smart Pick.idelsmartRelated topic: Removing Raster Entities Using REM Com-mands (page 156)
Changes an image's density.idensityRelated topic: Changing Image Density (page 115)
Changes an images color depth.idepthRelated topic: Setting the Color Depth for an Image (page116)
Matches the rotation of an image to a reference image orvector.
ideskew
Related topic: Deskewing an Image (page 83)
Removes speckles from an image.idespeckleRelated topic: Removing Speckles from an Image (page 84)
Moves an image in reference to an image or vector.idisplaceRelated topic: Correlating an Image After Insertion (page28)
Embeds one or more images in the current drawing.iembedRelated topic: Embedding Images in a Drawing (page 42)
278 | Appendix A Troubleshooting and Reference Guide

Erases the selected image.ieraseinsertionRelated topic: Erasing an Image (page 74)
Saves an image by exporting it.iexportRelated topic: Exporting Images (page 48)
Changes the image frame visibility.iframeRelated topic: Changing the Image Frame Visibility (page242)
Opens Raster Design Help.ihelp
Hides the selected image(s) from view. To reverse thiscommand, use ishowimage.
ihideimage
Related topic: Showing and Hiding Images (page 72)
Hides the selected image.ihideinsertionRelated topic: Showing and Hiding Images (page 72)
Adjusts the brightness and contrast of image(s).ihistogramRelated topic: Reversing the Light and Dark Shades in anImage (page 88)
Merges images.iimergeRelated topic: Merging Images (page 160)
Inserts an image.iinsertRelated topic: Inserting Images (page 9)
Reverses the light and dark tones in an image.iinvertRelated topic: Reversing the Light and Dark Shades in anImage (page 88)
Draws a line that is one pixel wide through raster data.iknifeRelated topic: Separating Raster Linework Using Knife (page201)
Opens the Image Manager toolspace.imanageRelated topic: Controlling the Image Manager Toolspace(page 65)
Creates a new image mask.imaskRelated topic: Creating a New Mask (page 137)
Command-Line Commands | 279

Changes the image mask properties for the new mask.imaskeditRelated topic: Changing an Existing Mask (page 138)
Converts a mask to an image clip.imaskconvertRelated topic: Converting a Mask to Image Clips (page 143)
Aligns points on an image with those on another image ordrawing.
imatch
Related topic: Matching Image Points (page 28)
Converts selected REM objects into pixels in a specified im-age.
imergetoimg
Related topic: Merging REM Objects into an Image (page198)
Flips the image along the horizontal or vertical axis.imirrorRelated topic: Mirroring an Image (page 88)
Creates a new image.inewRelated topic: Creating New Images (page 20)
Configures Raster Design.ioptionsRelated topic: Setting the Options (page 244)
Shows or hides a column in the list window.ipalRelated topic: Using the Palette Manager (page 118)
Converts a vector entity (line, polyline, arc, or circle) to aREM primitive.
iprimfromvec
Related topic: Defining a REM Primitive From Existing Vectors(page 185)
Removes all unused color maps from the drawing.ipurgecmRelated topic: Assigning a Color Map to an Image (page 18)
Turns the Quick Bar on and off.iqbarRelated topic: Changing the Quick Bar Visibility (page 241)
Opens the Raster Data Query dialog box.iqueryRelated topic: Displaying Point Data (page 71)
Specifies settings for text recognition.irecsetup
280 | Appendix A Troubleshooting and Reference Guide

Related topic: Entering Settings for Text Recognition (page230)
Converts raster text in a table to AutoCAD text.irectableRelated topic: Recognizing and Converting Text (page 232)
Converts raster text to AutoCAD text.irectextRelated topic: Recognizing and Converting Text (page 232)
Uses raster entity manipulation (REM) refine mode to changethe size and shape of a REM region or primitive object.
irefinemode
Related topic: Resizing a REM Object (page 189)
Defines a REM region from an existing vector object.iregfromvecRelated topic: Defining a Region From an Existing VectorObject (page 174)
Removes pixels or raster entities from a defined REM region.iremoveRelated topic: Using REM to Delete Raster Data (page 195)
Removes raster data under existing vector geometry.irmvexistingRelated topic: Remove Raster Using Existing Vector Geometry(page 155)
Stretches an image in one or more directions to align it withanother image.
irsheet
Related topic: Rubbersheeting an Image (page 31)
Rubs a raster arc.irubarcRelated topic: Rubbing a Raster Arc (page 150)
Removes raster data within a circular region.irubcircRelated topic: Rubbing Raster Data Within a Circular Region(page 152)
Rubs a raster circle.irubcircleRelated topic: Rubbing a Raster Circle (page 151)
Removes raster data within a diagonal region.irubdiagRelated topic: Rubbing Raster Data Within a Diagonal Region(page 153)
Rubs a raster line.irubline
Command-Line Commands | 281

Related topic: Rubbing a Raster Line (page 149)
Rubs multiple line segments.irubplineRelated topic: Rubbing Multiple Line Segments (page 151)
Removes raster data within a polygonal region.irubpolyRelated topic: Rubbing Raster Data Within a Polygonal Re-gion (page 154)
Removes raster data within a rectangular region.irubrectRelated topic: Rubbing Raster Data Within a RectangularRegion (page 155)
Converts a raster arc entity to an arc primitive.isarcRelated topic: Defining a REM Arc Primitive (page 183)
Saves an image without saving the drawing.isaveRelated topic: Saving an Image (page 39)
Provides options for saving an image to a different name,file type, or location.
isaveas
Related topic: Saving an Image to Another File Name, Type,or Location (page 43)
Changes the scale of an image to match the scale of anotherimage.
iscale
Related topic: Scaling an Image (page 30)
Convert a raster circle entity to a circle primitive.iscircleRelated topic: Defining a REM Circle Primitive (page 181)
Selects all pixels within a defined circular region.iscircregRelated topic: Defining a REM Circular Region (page 172)
Selects all pixels within a specified diagonal (parallelogram)region.
isdiagreg
Related topic: Defining a REM Diagonal Region (page 171)
Selects complete raster entities within a bitonal region.isebrconRelated topic: Defining REM Enhanced Bitonal Regions (page176)
Selects complete raster entities within a bitonal region.isebrsmart
282 | Appendix A Troubleshooting and Reference Guide

Related topic: Defining REM Enhanced Bitonal Regions (page176)
Selects all raster entity manipulation (REM) objects in animage.
iselectall
Related topic: Editing REM Objects (page 187)
Selects all the insertions.iselectallinsertionsRelated topic: Selecting an Image (page 79)
Displays an image that was hidden.ishowimageRelated topic: Showing and Hiding Images (page 72)
Shows the selected image.ishowinsertionRelated topic: Showing and Hiding Images (page 72)
Converts a raster line entity to a line primitive.islineRelated topic: Defining a REM Line Primitive (page 180)
Smooths the raster linework of REM objects.ismoothRelated topic: Smoothing REM Linework (page 194)
Specifies raster snap settings.isnapRelated topic: Raster Snapping (page 237)
Selects all pixels within a defined polygonal region.ispolyregRelated topic: Defining a REM Polygonal Region (page 170)
Selects all pixels within a specified rectangular region.isrectregRelated topic: Defining a REM Rectangular Region (page 169)
Converts a raster entity to the most applicable primitivetype: line, arc, or circle.
issmart
Related topic: Defining REM Primitive Objects (page 178)
Opens the Touchup toolbar.itouchupRelated topic: Touching Up an Image (page 89)
Turns the transparency on and off for REM objects.itransparentRelated topic: Using REM Transparency (page 200)
Un-embeds one or more images from the current drawing,asking you to specify where to save them.
iunembed
Command-Line Commands | 283

Related topic: Embedding Images in a Drawing (page 42)
Merges vectors into raster image.ivmergeRelated topic: Merging Vectors into a Raster Image (page161)
Edits vector separation options.ivseparationRelated topic: General Vector Separation Options (page 249)
Exports the correlation data for an image to a world file.iworldoutRelated topic: Exporting a World File (page 52)
Zooms to the selected image.izoomtoinsertionRelated topic: Zooming to an Image (page 67)
Selects an unused color for the transparency color.rbackgroundRelated topic: Unused Color for Transparent Color (page63)
Selects raster pen widths for vector merge.rpensRelated topic: Selecting Pen Widths for Vector Merge (page162)
Creates a vector arc to match or replace a raster arc.varcRelated topic: Vectorizing Raster Arcs (page 215)
Creates a vector circle to match or replace a raster circle.vcircleRelated topic: Vectorizing Raster Circles (page 213)
Creates a 3D polylinevf3dpolyRelated topic: Using the 3D Polyline Follower (page 223)
Converts a raster contour to a vector.vfcontourRelated topic: Using the Contour Follower (page 220)
Converts a raster polyline to a vector.vfplineRelated topic: Following Polylines (page 217)
Converts raster lines to vector lines or polylines.vlineRelated topic: Vectorizing Raster Lines and Polylines (page207)
Creates a block of multiline vector text.vmtext
284 | Appendix A Troubleshooting and Reference Guide

Related topic: Creating Multiline Vector Text (page 228)
Converts raster lines to vector lines or polylines.vplineRelated topic: Vectorizing Raster Lines and Polylines (page207)
Draws a vector rectangle to match or replace a raster rect-angle.
vrect
Related topic: Vectorizing Raster Rectangles (page 212)
Creates a line of vector text.vtextRelated topic: Creating Single-Line Vector Text (page 226)
AutoCAD Commands for ImagesYou can use standard AutoCAD commands to manage image frames. Whenyou select a frame, you create an AutoCAD selection set that you canmanipulate using any AutoCAD editing command, such as COPY, MOVE, orROTATE.
When an AutoCAD command prompts you to select an object to edit, youcan use any of the standard AutoCAD selection methods to select one or moreimage frames. When you select an image frame, grip(s) (page 390) are displayedon the image. Select one of the grips and right-click to display the AutoCADshortcut menu, on which you can select a command. Or, you can use the gripediting commands to edit the image.
NOTE To select a command on the Raster Design shortcut menu, select an image(but do not select a grip) and then right-click.
AutoCAD also includes the following commands that you can use with RasterDesign to adjust the display of your images:
■ IMAGE. Attach, detach, load, unload, and save paths of images.
■ IMAGEADJUST. Display the Image Adjust dialog box to modify the imagebrightness, contrast, and fade display qualities.
■ IMAGEATTACH. Display the Image Attach dialog box, which you can useto insert an image.
■ IMAGECLIP. Clip an image boundary to any polygonal shape. For moreinformation, see Clipping an Image (page 142).
AutoCAD Commands for Images | 285
■ IMAGEQUALITY. Specify whether to display the image in draft or highquality.
■ IMAGEFRAME. Turn image frames off and on.
■ TRANSPARENCY. Turn transparency off and on for an image.
For more information about AutoCAD commands, see the AutoCAD Help.
Image MenuThe following table lists the commands on the Raster Design Image menu,with descriptions and links to related dialog boxes or Help topics. This menuis only available when using the Map Classic Workspace.
Displays the New Image (page 342) dialog box.New
Displays the Insert Image (page 338) dialog box that is usedto insert images. See Inserting Images (page 9)
Insert
Saves an image without saving the drawing. See Saving anImage (page 39)
Save
Saves an image and allows you to change some attributes.See Saving an Image to Another File Name, Type, or Location(page 43)
Save As
Displays a submenu of commands used to export an imageor a world file. See Exporting Images (page 48).
Export
Displays the Image Manage toolspace that you use to accessand manage image data. See Controlling the Image ManagerToolspace (page 65).
Manage
Captures the current image. See Capturing an Image (page47)
Capture
Displays a submenu of commands used to adjust an imageby matching, moving, scaling, or rubbersheeting. See Cor-relating an Image After Insertion (page 28)
Correlate
286 | Appendix A Troubleshooting and Reference Guide

Displays a submenu of commands used to clean up imagesand repair the effects of scanning mistakes and other imper-fections. See Cleaning Up Images (page 82)
Cleanup
Displays a submenu of commands used to enhance the ap-pearance of your image or convert an image to a differentimage type. See Image Processing (page 91)
Image Processing
Displays a submenu of commands used to define and ma-nipulate raster objects. See Defining REM Region Objects(page 168)
Raster Entity Manip-ulation
Displays a submenu of commands used to create, edit, andconvert image masks. See Masking Images (page 136)
Mask
Displays a submenu of commands used to crop images.Options are provided for cropping a line, a circular region,
Crop
a rectangular region and a polygonal region. See CroppingImages (page 144)
Displays a submenu of commands used to rub (remove) araster line, multiple line segments, circles, arcs, or within a
Remove
polygon, rectangle or diagonal region. See Removing (Rub-bing) Images (page 149)
Displays a submenu of commands used to merge images,merge vectors with raster data and select raster pen width.See Merging Objects (page 160).
Merge
Displays a submenu of commands used to convert rasterentities to vector. See Vectorizing Raster Geometry (page206).
Vectorization Tools
Displays a submenu of commands used to convert rastertext to vector text. See Recognizing and Converting Text(page 232)
Text Recognition
Displays the Raster Snap tab where you can set the snappingmode. See Raster Snapping (page 237)
Raster Snap
Changes the visibility of the image frame. See Changing theImage Frame Visibility (page 242)
Toggle Frames
Image Menu | 287

Changes the visibility of the Quick Bar. See Changing theQuick Bar Visibility (page 241)
Toggle Quick Bar
Displays the Raster Design Options (page 351) dialog boxused to Configure Raster Design.
Options
Opens the Raster Design home page on the Internet if youhave an Internet connection and browser.
Raster DesignHome Page
Displays the Raster Design Help.Help
Displays Raster Design product and licensing information.About RasterDesign
ToolbarsRaster Design includes a number of toolbars. These toolbars are only availablewhen using the Map Classic Workspace. To see the complete list of toolbarsand to open any of them, right-click on an open toolbar and use the dropdownmenu. This section describes the following toolbars:
■ Raster Design Toolbar
■ Raster Entity Manipulation Toolbar
■ Raster Design Quick Bar
Raster Design ToolbarThis toolbar is the largest one in Raster Design, and includes many drop-downmenus of icons. This toolbar is only available when using the Map ClassicWorkspace. The following table shows the toolbar icons and their relatedcommands and procedures.
Related ProcedureCommand-LineCommand
ToolbarIcon
Creating New Images (page 20)inew
Inserting Images (page 9)iinsert
288 | Appendix A Troubleshooting and Reference Guide

Related ProcedureCommand-LineCommand
ToolbarIcon
Saving an Image (page 39)Save/Export
Saving an Image (page 39)isave
Saving an Image (page 39)isaveas
Exporting Images (page 48)iexport
Exporting a World File (page 52)iworldout
Capturing an Image (page 47)icapture
Correlating Images (page 21)Correlate Tools
Matching Image Points (page 28)imatch
Correlating an Image After Insertion (page28)
idisplace
Scaling an Image (page 30)iscale
Rubbersheeting an Image (page 31)irsheet
Controlling the Image Manager Toolspace(page 65)
imanage
Cleaning Up Images (page 82)Cleanup Tools
Deskewing an Image (page 83)ideskew
Raster Design Toolbar | 289

Related ProcedureCommand-LineCommand
ToolbarIcon
Removing Speckles from an Image (page 84)idespeckle
Adjusting the Image Bias (page 86)ibias
Reversing the Light and Dark Shades in anImage (page 88)
iinvert
Mirroring an Image (page 88)imirror
Touching Up an Image (page 89)itouchup
Image Processing (page 91)Image Processing Tools
Adjusting Images with the Histogram (page92)
ihistogram
Convolving an Image (page 105)iconvolve
Using Bitonal Filters (page 112)ibfilter
Changing Image Density (page 115)idensity
Setting the Color Depth for an Image (page116)
idepth
Using the Palette Manager (page 118)ipal
Masking Images (page 136)Mask Tools
Creating a New Mask (page 137)imask
290 | Appendix A Troubleshooting and Reference Guide

Related ProcedureCommand-LineCommand
ToolbarIcon
Converting a Mask to Image Clips (page 143)imaskconvert
Changing an Existing Mask (page 138)imaskedit
Cropping Images (page 144)Crop Tools
Line Cropping (page 145)icropline
Circular Cropping (page 145)icropcirc
Rectangular Cropping (page 146)icroprect
Polygonal Cropping (page 147)icropdiag
Polygonal Cropping (page 147)icroppoly
Removing (Rubbing) Images (page 149)Remove Tools
Rubbing a Raster Line (page 149)irubline
Rubbing a Raster Circle (page 151)irubcircle
Rubbing a Raster Arc (page 150)irubarc
Rubbing Multiple Line Segments (page 151)irubpline
Rubbing Raster Data Within a Circular Region(page 152)
irubcirc
Raster Design Toolbar | 291
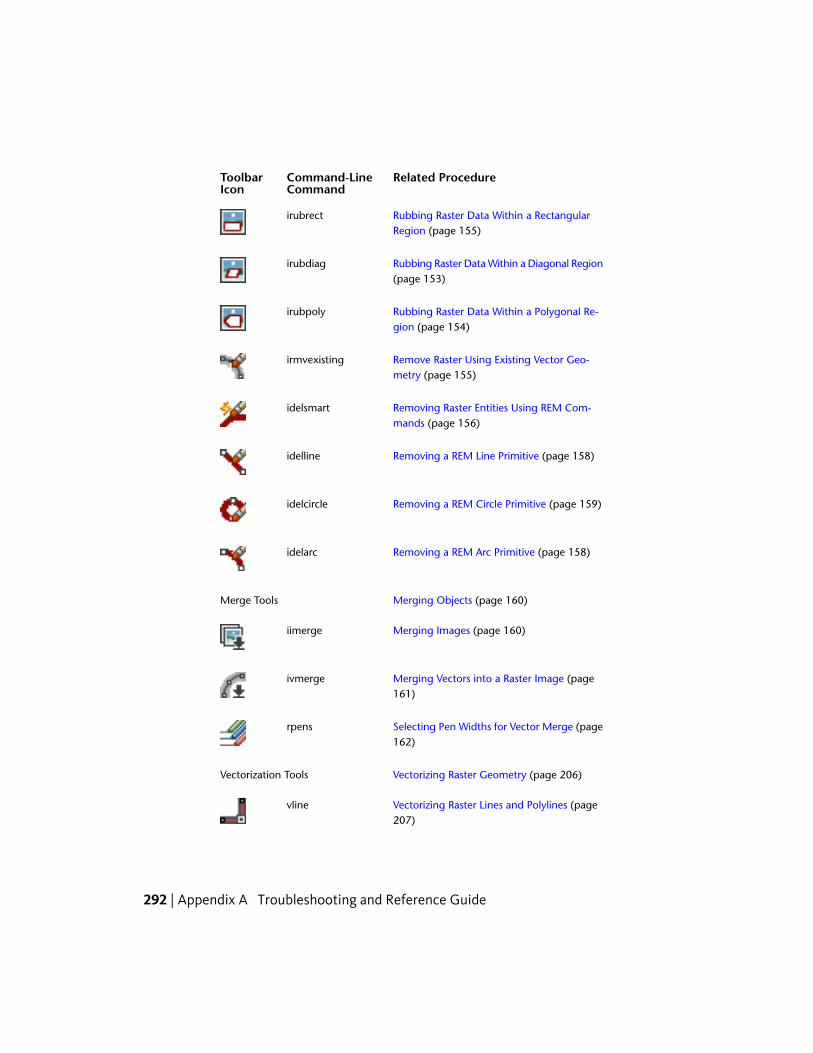
Related ProcedureCommand-LineCommand
ToolbarIcon
Rubbing Raster Data Within a RectangularRegion (page 155)
irubrect
Rubbing Raster Data Within a Diagonal Region(page 153)
irubdiag
Rubbing Raster Data Within a Polygonal Re-gion (page 154)
irubpoly
Remove Raster Using Existing Vector Geo-metry (page 155)
irmvexisting
Removing Raster Entities Using REM Com-mands (page 156)
idelsmart
Removing a REM Line Primitive (page 158)idelline
Removing a REM Circle Primitive (page 159)idelcircle
Removing a REM Arc Primitive (page 158)idelarc
Merging Objects (page 160)Merge Tools
Merging Images (page 160)iimerge
Merging Vectors into a Raster Image (page161)
ivmerge
Selecting Pen Widths for Vector Merge (page162)
rpens
Vectorizing Raster Geometry (page 206)Vectorization Tools
Vectorizing Raster Lines and Polylines (page207)
vline
292 | Appendix A Troubleshooting and Reference Guide

Related ProcedureCommand-LineCommand
ToolbarIcon
Vectorizing Raster Lines and Polylines (page207)
vpline
Vectorizing Raster Rectangles (page 212)vrect
Vectorizing Raster Circles (page 213)vcircle
Vectorizing Raster Arcs (page 215)varc
Creating Single-Line Vector Text (page 226)vtext
Creating Multiline Vector Text (page 228)vmtext
Following Polylines (page 217)vfpline
Using the Contour Follower (page 220)vfcontour
Using the 3D Polyline Follower (page 223)vf3dpoly
Vectorizing Raster Text (page 225)Recognize Text Tools
Recognizing and Converting Text (page 232)irectext
Recognizing and Converting Text (page 232)irectable
Entering Settings for Text Recognition (page230)
irecsetup
Raster Design Toolbar | 293

Related ProcedureCommand-LineCommand
ToolbarIcon
Raster Snapping (page 237)isnap
Changing the Image Frame Visibility (page242)
iframe
Changing the Quick Bar Visibility (page 241)iqbar
Setting the Options (page 244)ioptions
Accessing the ProductNameShort Home Page(page 4)
No related procedure; opens main page ofRaster Design Help
ihelp
Raster Entity Manipulation ToolbarsThese toolbars are only available when using the Map Classic Workspace. Formore information about raster entity manipulation, see Manipulating REMObjects (page 187).
Raster Entity Manipulation Toolbar
Related ProcedureCommand-LineCommand
ToolbarIcon
Defining a REM Polygonal Region (page 170)ispolyreg
smart window (page 397)isebrsmart, w
Defining REM Primitive Objects (page 178)issmart
294 | Appendix A Troubleshooting and Reference Guide

Related ProcedureCommand-LineCommand
ToolbarIcon
Clearing REM Objects (page 197)iclear
Clearing REM Objects (page 197)iclearall
Editing REM Objects (page 187)iselectall
Resizing a REM Object (page 189)irefinemode
Using REM to Delete Raster Data (page 195)iremove
Merging REM Objects into an Image (page198)
imergetoimg
Converting REM Objects to a New Raster Im-age (page 199)
iconvtoimg
Using REM Transparency (page 200)itransparent
Smoothing REM Linework (page 194)ismooth
Using REM Copy To Clipboard Command(page 200)
icopyss
Separating Raster Linework Using Knife (page201)
iknife
REM Regions Toolbar
Related ProcedureCommand-LineCommand
ToolbarIcon
Defining REM Region Objects (page 168)REM Region Tools
Raster Entity Manipulation Toolbars | 295

Related ProcedureCommand-LineCommand
ToolbarIcon
Defining a REM Polygonal Region (page 170)ispolyreg
Defining a REM Rectangular Region (page 169)isrectreg
Defining a REM Diagonal Region (page 171)isdiagreg
Defining a REM Circular Region (page 172)iscircreg
Defining a Region From an Existing VectorObject (page 174)
iregfromvec
REM Enhanced Bitonal Regions Toolbar
Related ProcedureCommand-LineCommand
ToolbarIcon
Defining REM Enhanced Bitonal Regions (page176)
REM Enhanced Bitonal RegionTools
smart window (page 397)isebrsmart, w
smart crossing windowisebrsmart, c
smart window polygonisebrsmart, wp
smart crossing polygonisebrsmart, cp
smart fence (page 397)isebrsmart, f
connected entity (page 385)isebrcon, e
296 | Appendix A Troubleshooting and Reference Guide

Related ProcedureCommand-LineCommand
ToolbarIcon
connected window (page 386)isebrcon, w
connected window polygonisebrcon, wp
connected crossing polygonisebrcon, cp
connected fence (page 385)isebrcon, f
REM Primitives Toolbar
Related ProcedureCommand-LineCommand
ToolbarIcon
Defining REM Primitive Objects (page 178)REM Primitive Tools
Defining REM Primitive Objects (page 178)issmart
Defining a REM Line Primitive (page 180)isline
Defining a REM Circle Primitive (page 181)iscircle
Defining a REM Arc Primitive (page 183)isarc
Defining a REM Primitive From Existing Vec-tors (page 185)
iprimfromvec
Raster Entity Manipulation Toolbars | 297
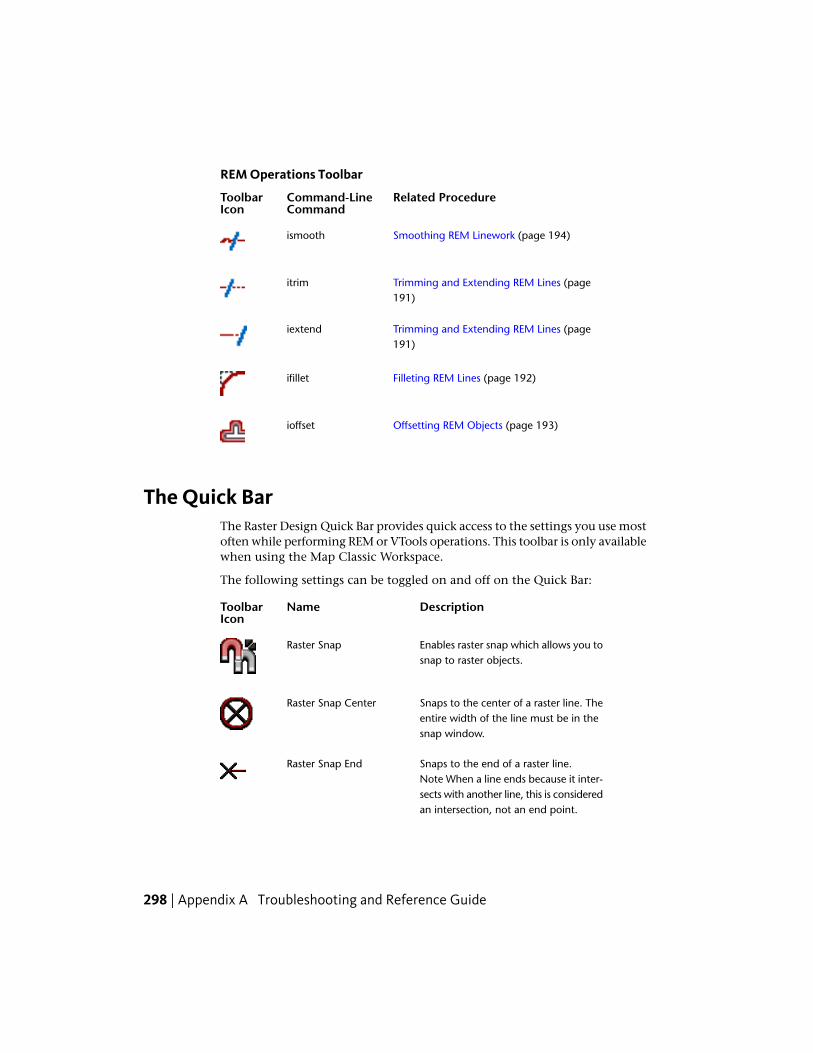
REM Operations Toolbar
Related ProcedureCommand-LineCommand
ToolbarIcon
Smoothing REM Linework (page 194)ismooth
Trimming and Extending REM Lines (page191)
itrim
Trimming and Extending REM Lines (page191)
iextend
Filleting REM Lines (page 192)ifillet
Offsetting REM Objects (page 193)ioffset
The Quick BarThe Raster Design Quick Bar provides quick access to the settings you use mostoften while performing REM or VTools operations. This toolbar is only availablewhen using the Map Classic Workspace.
The following settings can be toggled on and off on the Quick Bar:
DescriptionNameToolbarIcon
Enables raster snap which allows you tosnap to raster objects.
Raster Snap
Snaps to the center of a raster line. Theentire width of the line must be in thesnap window.
Raster Snap Center
Snaps to the end of a raster line.Raster Snap EndNote When a line ends because it inter-sects with another line, this is consideredan intersection, not an end point.
298 | Appendix A Troubleshooting and Reference Guide

DescriptionNameToolbarIcon
Snaps to the intersection of two rasterlines.
Raster Snap Corner
Snaps to the intersection of 3 or moreraster lines. The entire intersection mustbe in the snap window.
Raster Snap Intersection
Snaps to the edge of a raster line. Anypart of the raster line can be in the snapwindow.
Raster Snap Edge
When using one of the follower tools,such as the polyline follower or the
Stop at Raster Intersec-tions
contour follower, this setting causes thefollower to stop at all raster intersec-tions.
When using one of the follower tools,such as the polyline follower or the
Stop at Vector Intersec-tions
contour follower, this setting causes thefollower to stop at all vector intersec-tions.
For information on turning the Quick Bar on or off, see Changing the QuickBar Visibility (page 241).
The Quick Bar | 299

300

Raster Design Dialog Boxes
Use the following links to access information about the AutoCAD Raster Design dialog boxes.
About AutoCAD Raster Design BoxThis dialog box displays information about AutoCAD Raster Design.
Copyright information and product information is displayed. Productinformation includes the version number and service pack, serial number, licensetype and expiration date, and the text of the license agreement. You can savethe product information as a text file.
Assign Multispectral Band Dialog BoxUse this dialog box to select a single band from a multispectral set to display asa grayscale image.
Use the dropdown list to select the data band.
Band Assignment Color Map Dialog BoxUse this dialog box to create or edit a color map for a multispectral image.
Use the lists for Red, Green, and Blue to specify a data band to display with eachcolor channel.
If you want to turn off a color channel, clear the check box for that color.
If you do not want to display the image upon insertion, clear the Insert IntoDisplay check box.
B
301

Related procedures:
■ Assigning a Color Map to an Image (page 18)
Bitonal Filters Dialog BoxUse this dialog box to access the different filter types.
You can use these filters in conjunction with other cleanup options, such asDespeckle and Deskew.
Filter Type
Smooth
Removes unnecessary pixels from the edges of raster objects, fills holes inraster lines, and removes speckles from the raster image.
Thin
Trims raster objects by one pixel (per pass) in the directions you specify.
Thicken
Thickens the edges of raster objects by one pixel (per pass) in the directionsyou specify.
Separate
Separates raster lines that are partially merged to prevent Raster Design fromconverting them into one thick line.
Skeletonize
Thins all raster data to a thickness of one pixel.
Number of Passes
Specifies the number of times the filter runs. For example, a pass value of3 is equivalent to running the filter 3 times.
Directions
Horizontal
Specifies that the filter follows in a horizontal direction.
Vertical
Specifies that the filter follows in a vertical direction.
Diagonal
Specifies that the filter follows in a diagonal direction.
302 | Appendix B Raster Design Dialog Boxes

Related procedures:
■ Using Bitonal Filters (page 112)
Change Density Dialog BoxUse this dialog box to change the pixel density of an image or change theresampling method.
Current Settings
Displays existing pixel density, pixel size, and image dimensions
New Settings
Density
Specifies the pixel density (pixels/inch) and pixel size (inches/pixel). Youcan change either one of these values, and it automatically changes theother value as well as the image dimensions.
Resampling Method
Select the method to use for resampling image data when changing imagedensity:bicubic (page 382)bilinear (page 382)Lanczos (page 391)Mitchell (page 392)nearest neighbor (page 393)
Related procedures:
■ Changing Image Density (page 115)
Choose a New Directory Dialog BoxUse this dialog box to specify a different directory path to the image.
You may want to do this if you know the location of a more suitable copy ofthe image. The location of the current image is specified as Active Path in theitem view of Image Manager.
Look In
Specifies the current directory path to the image. If you want to change it,use the arrow beside this field, in combination with the file list in the Namecolumn, to navigate to a different directory.
Change Density Dialog Box | 303
Back
Returns to the previous folder.
Up One Level
Navigates up one level in the directory tree.
Search The Web
Displays the AutoCAD Web browser, with which you can specify an Internetlocation.
Delete
Deletes the selected file.
Create New Folder
Creates a new, unnamed folder.
Views
Specifies how files are displayed.
Tools
Provides options for finding files, adding or modifying an FTP site, or savinga shortcut to the current folder.
Places List
Displays shortcut icons to locations such as the desktop, FTP, andBuzzsaw.com.
Name
Specifies the directories and files within the directory in the Look In field.
Choose a Resource File Directory Dialog BoxUse this dialog box to specify a default directory for image correlation data.
It is recommended that you specify the same default directory for both theread path and the write path. These paths are specified on the Paths tab (page355)of the Raster Design Options dialog box.
Look In
Specifies the default directory for image correlation data. If you want tochange it, use the arrow beside this field, in combination with the file listin the Name column, to navigate to a different directory.
Back
Returns to the previous folder.
304 | Appendix B Raster Design Dialog Boxes

Up One Level
Navigates up one level in the directory tree.
Search The Web
Displays the AutoCAD Web browser, with which you can specify an Internetlocation.
Delete
Deletes the selected file.
Create New Folder
Creates a new, unnamed folder.
Views
Specifies how files are displayed.
Tools
Provides options for finding files, adding or modifying an FTP site, or savinga shortcut to the current folder.
Places List
Displays shortcut icons to locations such as the desktop, FTP, andBuzzsaw.com.
Name
Specifies the directories and files within the directory in the Look In field.
Related procedures:
■ Correlation Search Paths (page 247)
Coordinate System Assignment Dialog BoxUse this dialog box to specify a coordinate system for an exported GeoTIFFimage data file.
If the image was inserted with GeoTIFF correlation and no coordinatetransformation, a default GeoTIFF code is displayed. Otherwise, you can choosewhether or not to assign a coordinate system to the image.
If you want to specify no coordinate system, leave the Code field blank.
If Raster Design is running on AutoCAD Map, and a coordinate system isspecified within the Map drawing, the applicable code and description aredisplayed to assist you in identifying the comparable GeoTIFF code.
Coordinate System Assignment Dialog Box | 305

File Horizontal Coordinate System
Code
The GeoTIFF code that identifies a coordinate system for the image.
Select
Opens the Select Coordinate System (page 368) dialog box where you canselect a code by name, based on the region where it is used.
Properties
Opens the GeoTIFF Coordinate System Properties (page 315) dialog box todisplay the detailed properties of the coordinate system specified by theGeoTIFF code.
Name
Specifies the name of the coordinate system referenced by the GeoTIFFcode.
Area of Use
Specifies the geographic region in which the coordinate system is used.
Citation
Specifies additional details about the coordinate system. You can add noteshere.
File Vertical Datum
This section is displayed only if you are exporting a digital elevation model(DEM).
Code
Specifies the datum for elevation values in the DEM file.
Vertical Units
Specifies Feet or Meters as the unit of vertical measure. The current settingin the DEM is shown here. You can convert the exported file to the otherunit by changing this setting.
Drawing Coordinate System
Code
The code used by AutoCAD Map 3D to identify the coordinate system forthe drawing.
Properties
Displays additional technical details about the coordinate system.
306 | Appendix B Raster Design Dialog Boxes

Description
Specifies basic information about the coordinate system.
Data Organization Dialog BoxUse this dialog box to specify how to organize the data in an exported image.
Click Monolithic for small images, and either Tiled or Stripped for large images.
Despeckle Dialog BoxUse this dialog box to clean up a bitonal image by removing stray pixels, oftencalled “speckles.”
In this dialog box, use AutoCAD units to specify the size of the speckles youwant to remove.
Despeckle Options
Speckle Size
Specifies the speckle size (in AutoCAD units) you want to remove. Whendetermining the best size to use, note that a size too large may remove partsof text, such as periods or the dots of the letter “i”.
Pick
Pick two points to draw a window around a speckle that is the largest sizeyou want to remove.
Related procedures:
■ Removing Speckles from an Image (page 84)
Display Manager Raster Layer Capture Dialog BoxUse this dialog box in AutoCAD Map 3D to capture image data from a layerin Display Manager.
In this dialog box, you can specify whether to capture the source data or thestylized version.
What to Capture
Specifies whether to capture the Stylized Display data as shown on thescreen, or the Source Data, without stylization.
Data Organization Dialog Box | 307

Area for Capture Defined By
Specifies how the capture extents are defined:
■ Display – the extents of the current display
■ Layer Extents – the full extents of the layer in Display Manager includingall available images
■ Window – the extents will be defined by a window that you draw onthe screen
Capture Resolution
Display
Specifies that the capture will have the same resolution as the currentdisplay.
Source
Specifies that the capture will use the resolution, units, and scale of thesource image. This option is unavailable if the layer includes images ofdifferent resolutions, or if the source has no set resolution.
Custom
Specifies that you will enter numeric resolution data in one of the boxes tothe right.
Coordinate Transform
Specifies the type of transformation:
■ Affine – the same correlation as displayed in AutoCAD Map 3D.
■ True – this option produces a more accurate result if coordinatetransformation is performed in AutoCAD Map 3D; otherwise, producesthe same results as Affine.
■ None – the correlation is the same as when using Raster Design QuickInsert with the source image.
Related procedures:
■ Capturing an Image (page 47)
Drafting Settings Dialog BoxUse this dialog box to set controls for Raster Snap, Object Snap, Polar Tracking,Snap and Grid, and AutoCAD Options.
308 | Appendix B Raster Design Dialog Boxes
The Raster Snap (page 309) tab is specific to Raster Design. Three other tabs(Object Snap, Polar Tracking, Snap and Grid) are AutoCAD standards and linkto the AutoCAD Help system.
The Options button opens the AutoCAD Options dialog box where the Draftingtab lets you set the AutoSnap Marker Size and Aperture Size. All controls inthis dialog box are explained in the AutoCAD Help system.
Raster Snap Tab (Drafting Settings Dialog Box)Use this tab to turn Raster Snap on or off and to control its behavior.
You can use the raster snap modes to help you trace a bitonal raster entitywith the vectorization tools, to help you select raster objects for rubbing andcropping, and to help you select raster objects for Raster Entity Manipulation.
Raster Snap Modes
Snap modes determine where your cursor will snap to as you move it aroundthe image. If you choose more than one snap mode, then the crosshairs snapto the closest snap points. When the crosshairs snap to a point you want toselect, pick the point.
Center
Snaps to the center of a raster line. The entire width of the line must be inthe aperture (snap window).
End
Snaps to the end of a raster line.
NOTE When a line ends where it intersects another line, this is considered anintersection, not an end point.
Corner
Snaps to the intersection of two lines.
Intersection
Snaps to the intersection of three or more raster lines. The entire intersectionmust be in the snap window.
Edge
Snaps to the edge of a raster line. Any part of the raster line can be in thesnap window.
Raster Snap Tab (Drafting Settings Dialog Box) | 309
Preferences
Show Aperture
Displays the aperture (page 381) while using raster snap.
Aperture Size
Specifies a size for the aperture in pixels. The maximum size is 300 pixels.Where raster entities are close together, a large aperture can make it difficultto select specific entities when several entities are inside the aperture.
NOTE Aperture is defined in image pixels, not screen pixels, so the size of theaperture changes with the zoom level. Therefore, if you are at the extents of animage and the aperture is 10 pixels, the window may appear small. However,if you zoom in, the same aperture appears larger.
Raster Snap Overrides
When Raster Snap is active, it takes priority over any cursor control modeselected here.
Snap
Raster Snap overrides the AutoCAD SNAP command.
Polar Tracking
Raster Snap overrides the AutoCAD Polar Tracking feature.
Ortho
Raster Snap overrides the AutoCAD ORTHO command.
Options
Displays the Drafting tab on the AutoCAD Options dialog box. In this dialogbox, you can define your AutoSnap Marker Size and your Aperture Size.
See AutoCAD Help for further information about the AutoCAD Options dialogbox.
Related procedures:
■ Raster Snapping (page 237)
Edit Status Dialog BoxUse this dialog box to see any restrictions on how an image can be edited andsaved.
310 | Appendix B Raster Design Dialog Boxes
If you select an image that is not editable or that you cannot save to disk, thenthe Edit Status dialog box is displayed.
Edit Status Options
Image Name
Lists the name(s) of the image(s) you selected.
Indicates that you can edit the image and the edits can be saved tothe image file.
Indicates that you can edit the image, but the edits cannot be savedto the original image file.You need to save the image to another filename in order to save your edits.For more information, see Saving an Image to Another File Name, Type, orLocation (page 43).
Indicates that you cannot edit the image. You can click theInformation>> button to find out how you can edit the image.
Indicates that you cannot edit or save the image. Click theInformation>> button to find out how to edit and save the image.
Image Status
Describes why you can or cannot edit the image.
Information>>
Displays instructions for editing or saving the image.
Encoding Method Dialog BoxUse this dialog box to specify how to encode and compress an exported image.
A compressed file requires less storage space and less transmission time whensending across a network. Depending on file type, different encoding optionscan be presented here, including “uncompressed”. Click on each method tosee a description of it.
Export Dialog BoxUse this dialog box to save a file and control the location, format, and name.
Encoding Method Dialog Box | 311
Exporting is the only way to save some file types, such as multispectral imagedata and digital elevation models (DEM). If you are exporting multispectraldata, the dialog box is titled Multispectral Export, and the export process saveseach band file as a separate GeoTIFF image.
Save In
Specifies the folder where the exported file is saved.
Back
Returns to the previous folder.
Up One Level
Navigates up one level in the directory tree.
Search the Web
Displays the AutoCAD Web browser, where you can specify an Internetlocation and select drawing content to display in the AutoCAD DesignCenter palette.
Delete
Deletes the selected file.
Create New Folder
Creates a new, unnamed folder.
Views Menu
Switches between List, Detail, and Thumbnails views.
Tools Menu
Finds files, adds or modifies FTP sites, or adds a shortcut to the currentfolder in the Favorites folder.
Places List
Displays shortcut icons to locations such as the desktop and the Favoritesfolder.
File Name/Base Name
Specifies the name of the exported file.This field is called Base Name on the Multispectral Export dialog.
Files of Type
Specifies the file format of the exported file.
Related procedures:
■ Exporting Images (page 48)
312 | Appendix B Raster Design Dialog Boxes
Export Options Dialog BoxUse this dialog box to control the format and metadata of an exported image.
When you export an image, you can create a resource file or a world file forthe image. These correlation files store insertion point, scale, rotation, anddensity (page 387) information for the image.
You can use the resource file option to share images with other people usingRaster Design, or to use the image in another drawing. You can use the worldfile option to create a world file (which is an ASCII file you can view usingNotepad) for use in Raster Design or other software programs.
Maintain Drawing Link To Image
Selected: The exported image replaces the original image in the drawing.Cleared: Saves the exported image to disk and keep the original image inthe drawing.
Image Rotation Handling
Burn Rotation Into Image
Saves the current image alignment and resets the rotation value to 0.
Include Rotation In Correlation
Saves the current image alignment as a rotation value.
Output Without Rotation
Saves no rotation value. This option is selected and unchangeable if theimage is not rotated in the drawing.
Correlation
Select Correlation Output Type(s)
Specifies one or more types of correlation files to create. You can chooseResource File to create a resource file (page 395). You can also choose WorldFile to save a world file (page 400). Both Resource files and World files aresaved to the path you specify in the Raster Design Options (page 351)dialogbox. If no correlation search path is designated, Raster Design uses the folderwhere the image is stored.In two cases, an option here is preset and unchangeable. If you are exportinga multispectral image, GeoTIFF is specified. If you are exporting a DEM inDEM format, DEM File is specified.
Related procedures:
■ Correlation Output Types (page 54)
Export Options Dialog Box | 313

Export Palette Dialog BoxUse this dialog box to save your changes to the current palette for use withanother image.
Export Options
Save In
Specifies the folder where the exported palette is saved.
Back
Returns to the previous folder.
Up One Level
Navigates up one level in the directory tree.
Search The Web
Displays the AutoCAD Web browser, where you can specify an Internetlocation to save the palette file.
Delete
Deletes the selected file.
Create New Folder
Creates a new, unnamed folder.
Views Menu
Switches between List and Detail views.
Tools Menu
Adds or modifies an FTP site or adds a shortcut to the current folder in theFavorites folder.
Places List
Displays shortcut icons to locations such as the desktop, FTP, Buzzsaw.com,and so on.
File Name
Specifies the name of the exported palette file.
Files Of Type
Specifies the file format of the exported file.
Palette Title
Adds a title to palette file header.
314 | Appendix B Raster Design Dialog Boxes
Related procedures:
■ Exporting an Image Palette (page 128)
GeoTIFF Coordinate System Properties DialogBox
Use this dialog box to see detailed properties of the GeoTIFF coordinate systemspecified in the Coordinate System Assignment dialog box.
The Projection properties are in one of two formats, depending on whetherthe coordinate system type is geographic or projected.
Grid Parameters Dialog BoxUse this dialog box when rubbersheeting to establish a grid of destinationpoints, to which you match source points.
Once these control points are established, the image is transformed so thatthe points align as closely as possible.
NOTE When you pick points in the drawing, you can press Enter to return to theGrid Parameters dialog box.
Points
Rows
Specifies the number of rows to place in the grid.
Columns
Specifies the number of columns to place in the grid.
Total
Displays the total number of points in the grid.
Grid
X Origin
Specifies the X coordinate of the grid origin.
Y Origin
Specifies the Y coordinate of the grid origin.
GeoTIFF Coordinate System Properties Dialog Box | 315
Pick
Specifies the grid origin directly in the drawing.
Cell
X Size
Specifies the distance between columns.
Y Size
Specifies the distance between rows.
Pick
Specifies the cell size by clicking two points directly in the drawing.
Preview
Displays a preview of the grid in the drawing.
Add Points
Creates a grid of destinations according to the values you specify bymatching source points to destination points.
Related procedures:
■ Rubbersheeting an Image (page 31)
Histogram Dialog BoxUse this dialog box to adjust image quality or to convert images to grayscaleor bitonal format.
Brightness/Contrast Tab (Histogram Dialog Box)Use this tab to adjust the brightness and contrast of color and grayscale images.
Brightness
You can move the slider to the right to increase the brightness or the leftto decrease brightness.In color images, increasing brightness causes colors to become lighter shades.In grayscale images, increasing brightness causes more grays to becomewhite.In color images, decreasing brightness causes colors to become darker. Ingrayscale images, decreasing brightness causes more grays to become black.
316 | Appendix B Raster Design Dialog Boxes

Contrast
You can move the slider to the right to decrease the tonal gradation or tothe left to increase the tonal gradation between the highlights, midtones,and shadows in an image.When contrast is increased to an extreme in a grayscale image, the shadesof gray can be polarized to just black and white. In a color image, an extremeincrease in contrast causes the selected color channel to become moreprominent. For example, if the selected color channel is red, then moreshades of red appear in the image.
RGB
Specifies the color channel to change in a color image. For a grayscale image,you can change only RGB, which represents the gray channel.
Index
Displays an index for a shade of the color channel that is currently selected.When you place your pointer over a bar in the histogram, the Index valuedisplays the intensity of the shade that the bar represents (0 to 255).
Freq
Display a frequency value for a shade of the color channel that is currentlyselected.When you place your pointer over a bar in the histogram, the Freq valuedisplays the number of pixels in the image that are the shade that the barrepresents.If you selected a grayscale image, then this value represents the number ofpixels that are the shade that corresponds to the bar.If you selected a color image, and you choose a color channel, then thefrequency value represents the number of pixels that are the shade of theselected color channel.
Apply Changes To
■ Entire Image. Applies the changes to the selected image.
■ Sub-Region. Applies the changes to the sub-region only.
Sub-Region Options
Displays palette options for sub-regions associated with an Index Color (8-bit)(page 391) image:
■ Retain Current Palette. Applies your changes to the sub-region bymapping to the closest colors from the current palette. This optionmaintains the current palette and does not affect pixels outside theselected region.
Brightness/Contrast Tab (Histogram Dialog Box) | 317

■ Rebuild Palette With All Colors. Creates a new palette to bestaccommodate all colors in the entire image. Because this image changesthe palette, pixels inside and outside the sub-region may be affected bythis option.
■ Rebuild Palette With New Colors. Also creates a new palette, but thisoption guarantees that colors in the sub-region are included in the paletteby giving preference to those pixels over pixels outside the sub-region.Because this image changes the palette, pixels outside the sub-regionmay be affected by this option.
Apply
Changes the color values in the image file and generates a new histogramthat reflects the changes.
Reset Controls
Resets the brightness and contrast on all of the color channels to zero.
NOTE If you have already clicked Apply, clicking Reset Controls does not undoyour changes. To undo your changes, exit the dialog box and use the UNDOcommand.
Preview
Displays a preview of the image showing the modifications.Click an image name to view the preview for that image. Histogram changesapply to all images you have selected, not just to the image that is currentlypreviewed.This preview does not show any display-only adjustments you may havemade to the image using the AutoCAD IMAGEADJUST command. If youapply changes to the image using the Histogram, then all display-onlyadjustments are reset to the defaults.
Related procedures:
■ Adjusting Images with the Histogram (page 92)
Equalize Tab (Histogram Dialog Box)Use this tab to maximize the details in an image that has a large percentageof pixels that are approximately the same color. Equalization changes thedarkest pixels to black and the lightest pixels to white and then reassigns the
318 | Appendix B Raster Design Dialog Boxes
remaining pixels to use all of the colors in between. This is also known as anon-linear contrast stretch.
You can equalize a grayscale image or a color image. When you equalize acolor image, you have the option of selecting which color channel you wantto equalize. For example, if you have an image that is composed of mostlyred shades, then you can select the red channel and equalize only that channel,spreading out the red values so there is greater contrast.
Equalize Tab Options
Index
Displays the intensity of each shade on the histogram (0 to 255). For agrayscale image, all channels have the same values. If you select the Red,Green, or Blue channel when you are equalizing a color image, the indexnumber is the intensity of that color within a pixel.
Freq
Displays the number of pixels within an image of a selected Index value.
Apply Changes To
■ Entire Image. Applies the changes to the selected image.
■ Sub-Region. Applies the changes to the sub-region only.
Sub-Region Options
Contains palette options for sub-regions associated with an Index Color(8-bit) (page 391)
■ Retain Current Palette. Applies your changes to the sub-region bymapping to the closest colors from the current palette. This optionmaintains the current palette and does not affect pixels outside theselected region.
■ Rebuild Palette With All Colors. Creates a new palette to bestaccommodate all colors in the entire image. Because this image changesthe palette, pixels inside and outside the sub-region may be affected bythis option.
■ Rebuild Palette With New Colors. Also creates a new palette, but thisoption guarantees that colors in the sub-region are included in the paletteby giving preference to those pixels over pixels outside the sub-region.Because this image changes the palette, pixels outside the sub-regionmay be affected by this option.
Equalize Tab (Histogram Dialog Box) | 319

Apply
Equalizes the image and creates a new histogram that reflects the changes.
RGB
Specifies the color image. You can select the Red, Green, or Blue channel,or the combined RGB channel. For a grayscale image, you can only selectthe RGB channel.
Preview
Displays a preview of the image showing the modifications.Click an image name to view the preview for that image. Histogram changesapply to all images you have selected, not just to the image that is currentlypreviewed.This preview does not show any display-only adjustments you may havemade to the image using the AutoCAD IMAGEADJUST command. If youapply changes to the image using the Histogram command, then alldisplay-only adjustments are reset to the defaults.
Related procedures:
■ Maximizing Details in an Image (page 96)
Threshold Tab (Histogram Dialog Box)Use this tab to convert a grayscale or color image to a simpler black and whitebitonal image. This operation can be used to isolate features in an image. Forexample, you can isolate the contour lines from a grayscale scan of a USGSmap.
After the grayscale or color image is converted to a bitonal image, you can usethe vectorization tools to convert the raster objects to vectors.
Threshold
Displays which pixels are black and which pixels are white. After you movethe slider, all pixels to the left of the slider become black and all pixels tothe right of the slider become white.
Apply
Converts the selected grayscale or color image to a black and white bitonalimage.
Preview
Displays a preview of the image showing the modifications.
320 | Appendix B Raster Design Dialog Boxes

Click an image name to view the preview for that image. Histogram changesapply to all images you have selected, not just to the image that is currentlypreviewed.This preview does not show any display-only adjustments you may havemade to the image using the AutoCAD IMAGEADJUST command. If youapply changes to the image using the Histogram, then all display-onlyadjustments are reset to the defaults.
Related procedures:
■ Converting a Grayscale or Color Image to Bitonal (page 100)
Color to Grayscale Tab (Histogram Dialog Box)Use this tab to convert a color image to an 8-bit grayscale image. This is usefulif you want to reduce the amount of disk space the image requires. Byconverting a color image to grayscale, you can also take advantage of thesmoothing filters (page 398) or sharpening filters (page 396) to work on the imagedetails.
RGB
Specify a channel from this list for the conversion value. You can selectRGB, or you can select the Red, Green, or Blue channel.If you select RGB, then the values for red, green, and blue components ofeach pixel in the image are added together and divided by three to achievethe grayscale value.If you select Red, Green, or Blue, then the Color to Grayscale operation usesthe value for just that channel to determine the grayscale value.
Apply
Converts the selected color image(s) to grayscale.
Preview
Displays a preview of the image showing the modifications.Click an image name to view the preview for that image. Histogram changesapply to all images you have selected, not just to the image that is currentlypreviewed.This preview does not show any display-only adjustments you may havemade to the image using the AutoCAD IMAGEADJUST command. If youapply changes to the image using the Histogram, then all display-onlyadjustments are reset to the defaults.
Color to Grayscale Tab (Histogram Dialog Box) | 321

Related procedures:
■ Converting a Color Image to Grayscale (page 98)
Tonal Adjustment Tab (Histogram Dialog Box)Use this tab to increase the detail in one part of the contrast curve withoutchanging the detail in other parts.
RGB
Specifies the Red, Green, or Blue channel, or the combined RGB channel.For a grayscale image, you can only select the RGB channel.
Vertical Scale slider
Zooms in on the histogram. As you move the slider upward, the scale isincreased so that low frequency values become more visible and the highestfrequency values become truncated by the top of the window.
Contrast Curve Window
Displays the contrast curve. If you are using a fitted curve or piecewise linearcurve, you can click and drag the curve's points and segments to edit thecurve. You can also right-click to control the appearance of the grid, importand export curves, or reset the values. You can right-click on a point todelete the point.
Select Curve Type
Specifies the contrast curve representation in three ways:
■ Gamma correction curves result in an exponential curve. It is definedby either specifying the single exponent (gamma) value or using aninteractive slider.
■ Fitted curves are drawn smoothly through points you specify. Pointscan be added or removed from the curve, or dragged to modify the shapeof the curve.
■ Piecewise Linear curves are constructed of points you add or modify.Each segment between points is a straight line instead of a curve.
Black
Specify a value in the text box, or move the black clipping slider, to adjustthe point below which color values are displayed as black.
322 | Appendix B Raster Design Dialog Boxes

Gamma
Specifies the gamma value for the curve. The maximum value of 10 is theequivalent of moving the Gamma slider to the far left. The minimum valueof 0.1 is the equivalent of moving the Gamma slider to the far right.
White
Specify a value in the text box, or move the white clipping slider, to adjustthe point above which color values are displayed as white.
Import
Imports a curve as a Gamma Point List (*.gpl) file.
Export
Exports a curve as a Gamma Point List (*.gpl) file.
Preview
Displays a preview of the image showing the modifications.Click an image name to view the preview for that image. Histogram changesapply to all images you have selected, not just to the image that is currentlypreviewed.This preview does not show any display-only adjustments you may havemade to the image using the AutoCAD IMAGEADJUST command. If youapply changes to the image using the Histogram, then all display-onlyadjustments are reset to the defaults.
Apply
Adjusts the contrast curve for the image and creates a new histogram thatreflects the changes.
Apply Changes To
■ Entire Image. Applies the changes to the selected image.
■ Sub-Region. Applies the changes to the sub-region only.
Sub-Region Options
Contains palette options for sub-regions associated with an Index Color(8-bit) (page 391)
■ Retain Current Palette. Applies your changes to the sub-region bymapping to the closest colors from the current palette. This optionmaintains the current palette and does not affect pixels outside theselected region.
■ Rebuild Palette With All Colors. Creates a new palette to bestaccommodate all colors in the entire image. Because this image changes
Tonal Adjustment Tab (Histogram Dialog Box) | 323

the palette, pixels inside and outside the sub-region may be affected bythis option.
■ Rebuild Palette With New Colors. Also creates a new palette, but thisoption guarantees that colors in the sub-region are included in the paletteby giving preference to those pixels over pixels outside the sub-region.Because this image changes the palette, pixels outside the sub-regionmay be affected by this option.
Related procedures:
■ Making Tonal Adjustments to an Image (page 101)
Image Data Properties Dialog BoxUse this dialog box to review and edit the properties of an image datadefinition, band group, or data band, depending on which object type youhave selected.
For an image data definition, you can edit the reference name if it is a RasterDesign custom image type (single-band integer, floating-point digital elevationmodel, or multiband multispectral).
For a data band group, you can edit the name of the band group.
For an individual data band, you cannot edit any of the data.
For multispectral bands that use 16- or 32-bit integer data, the original datais converted to 8-bit format for display purposes. Conversion uses the mostsignificant bits (MSB) bit-mapping method, which discards the three leastsignificant bits.
Image Filters Dialog BoxUse this dialog box to improve the appearance of grayscale images bysmoothing or sharpening the detail.
Raster Design provides smoothing filters (page 398) and sharpening filters (page396).
Image Filters Options
Collapse All
Collapses the expanded list of filters.
324 | Appendix B Raster Design Dialog Boxes

Description
Describes the selected filter.
Expand All
Expands the list of filters.
Run Filter
Performs the filter operation on your image using the selected filter.
Select a Filter
Selects the filter when you select the box.
Related procedures:
■ Convolving an Image (page 105)
Image Insertion Dialog BoxUse this dialog box to properly correlate (align) an image by specifying theinsertion point, scale, and rotation.
Assign Color Map Tab (Image Insertion Dialog Box)Use this tab to assign a color map to the image and to indicate whether todisplay the image.
Two versions of this tab are available: a Palette Color Map tab for digitalelevation models (DEM), and a Band Assignment Color Map tab formultispectral images. Raster Design automatically displays the right one forthe image file.
Palette Color Map
Color Map Name
On the drop-down list, click the name of the color map you want to usefor the image.
Clicking one of the following three buttons takes you to the Palette ColorMap Definition Dialog Box (page 345) to configure the color map:
Click to create a new color map.
Image Insertion Dialog Box | 325

Click to copy the selected color map; this is a good way to create a newcolor map based on an existing one.
Click to edit the selected color map.
Insert Into Display
Clear this check box if you do not want to display the image.
Band Assignment Color Map
Use the lists for Red, Green, and Blue to specify a data band to display witheach color channel.
If you want to turn off a color channel, clear the check box for that color.
If you do not want to display the image, clear the Insert Into Display checkbox.
Related procedures:
■ Assigning a Color Map to an Image (page 18)
Source Tab (Image Insertion Dialog Box)Use this tab to pick a source of correlation data for the image.
Correlation Source
When you select a correlation source from the list, the correlation valuesand other data on this tab is updated from the source.
NOTE Asterisks (*) are displayed beside numeric values that are the defaultvalues assigned in the Raster Design Options dialog box.
Depending on image type, up to four sources can be used:
■ Image File. Correlation data can be saved as part of the image file if thefile type is RLC, IG4, IGS, GeoTags in GeoTIFF, or HDR File in SPOT.
■ Default. Refers to values set in the ProductNameShort Options DialogBox (page 351).
326 | Appendix B Raster Design Dialog Boxes
■ Resource File. A file created by the Raster Design Export operation orprevious versions of Raster Design. Resource files have a .RES fileextension.
■ World File. A file created by the Raster Design Export operation for allimage formats, or by other applications. World files have different fileextensions, depending on file type.
Correlation Values
Displays the X and Y coordinates of the insertion point (bottom left corner),rotation angle, and scale of the image as recorded in the correlation source.
Density
Displays the pixel density of the image.
Units
Displays the linear units of measure for the image.
Coordinate System
Displays the coordinate system used in the image, if applicable.
Image File Name
Displays the coordinate system used in the image, if applicable.
Correlation File Name
Displays the coordinate system used in the image, if applicable.
Modify Tab (Image Insertion Dialog Box)Use this tab to change correlation values for this image insertion, withoutmodifying the values stored in the original correlation file.
Correlation Values
You can change the coordinates of the insertion point if you want to movebottom left corner of the image.To rotate the image, enter an angle of clockwise rotation, using the format0d 00’ 00’.To scale the image, enter the scaling factor. Use a number larger than 1 toenlarge the image, a number between 1 and 0 to reduce the image.
Density
Displays the pixel density for the image units. For example, if you changethe image units to meters, the pixel density is displayed in pixels per meter.
Modify Tab (Image Insertion Dialog Box) | 327

Units
Displays the units of measure for the image. Image units are for horizontalmeasure; vertical units are for elevations, either US Survey Feet or Meters.If vertical units are not supplied by the image, this value defaults to theunit specified on Image Defaults Tab (ProductNameShort Options DialogBox) (page 351).To avoid image distortion, this unit should match the unit used to capturethe image. For example, if an image was scanned at a certain dots per inch(dpi) setting, the image units should remain as inch.
Insertion Tab (Image Insertion Dialog Box)Use this tab if you are applying a coordinate system transformation and wantto change the insertion point, rotation, or scale of the image, or want to changethe size and color of the image frame.
Insertion Point
Specifies the insertion point in current AutoCAD units after any unitconversions or coordinate transforms have been applied. If a new insertionpoint is assigned with Pick <, these coordinates are shown here.
Rotation
Specifies the rotation in current AutoCAD units after any coordinatetransform has been applied. Change this value by typing, pasting, or byassigning a new rotation value with Pick <.
Scale
Specifies the scale after any coordinate transform has been applied. Changethis value by typing, pasting, or by assigning a new value with Pick <.
Color
Specifies the color of the image frame (and for bitonal images, theforeground color). Usually the color of the current layer.When you insert a bitonal image, Raster Design first looks for the foregroundcolor in the correlation source. If it cannot find color information, theforeground color defaults to current color.
Pick <
Allows you to define a frame for the image you are inserting. You can definethe frame size and rotation by drawing or by typing values.
Related procedures:
■ Adjusting the Image Frame Before Insertion (page 27)
328 | Appendix B Raster Design Dialog Boxes
Transform Tab (Image Insertion Dialog Box)This tab is displayed only if Raster Design is installed on an Autodeskgeographic application such as AutoCAD Map or AutoCAD Land Desktop.
Use this tab to transform the coordinate system of an image to match thecoordinate system used in an AutoCAD Map drawing. In most cases, the systemwill select the correct code and related values for you.
Enter Code
Enter the coordinate system code, if available. Doing this updates theCategory and Coordinate System lists to identify the coordinate systemspecified by the code. After a code is entered, you can also click Propertiesto see more details about the coordinate system.
Select Category From List
Displays the general category for the coordinate system, such as UTM orLat Longs.
Coordinate Systems in Category
Displays the specific coordinate system for the image.
Transform To Drawing’s Coordinate System
Select this option to transform the image to the coordinate system used inthe drawing, which is displayed here for reference.
Transform Type
Select one of three options:
■ True (pixel by pixel): produces the most accurate results.
■ 4-Point Rubbersheet: approximate transformation, most accurate nearthe control points.
■ 3-Point Affine: replicates the transformation performed on non-editabledata types.
OK
Verifies the transformation and inserts the transformed image into thedrawing.
Apply
Verifies the transformation and displays a preview of the transformed image.
Transform Tab (Image Insertion Dialog Box) | 329
Image Manager ToolspaceUse this toolspace to manage multiple image insertions, color maps, andrelated data.
When you select an image or other object, its properties appear in the itemview at the bottom of the toolspace.
Opening the toolspace
Raster Design Toolbar:
Main menu: Click Image ➤ Manage.
Command-line commands
imanage to open the toolspace
hidets to close the toolspace
dockts to dock the toolspace on the left side of your screen
floatts to move the toolspace from a docked position to a floating window
Using the auto-hide setting
If you turn auto-hide on, the toolspace automatically expands when youmouse over it and contracts to just a vertical bar when you mouse away fromit. This is convenient when you are working in a drawing window but wantthe toolspace readily available.
Click to turn auto-hide on.
Click to turn auto-hide off.
Setting toolspace properties
You can set several toolspace properties on a menu. For example, you candisable the docking feature, control the transparency of the toolspace, andturn auto-hide on or off.
Click to see the Properties menu.
Management toolbar
This is a series of buttons across the top of the toolspace.
330 | Appendix B Raster Design Dialog Boxes

Click to collapse the tree view, showing only the drawing.
Click to expand the tree view, showing all objects in the hierarchy
Click to toggle between image preview and a tabular item view in thesecondary pane of the Image Insertions view
See also:
■ Controlling the Image Manager Toolspace (page 65)
Image Insertions View (Image Manager Toolspace)Use this view to manage inserted images and their color maps.
As shown in the following figure, the tree view displays two object types:
Image insertion
Color map
If you add two or more insertions of the same image, digits are appended tothe image name, such as View:1, View:2.
Right-click on the drawing to insert another image or refresh the display.Insert opens the Insert Image (page 338) dialog box.
Right-click on an image insertion to see a menu with the following options:
■ Properties. Shows the AutoCAD properties of the insertion.
■ Edit Color Map. Opens the dialog box for editing the color map for thisinsertion, such as: Select Color for a bitonal image, Image Adjust for agrayscale or color image.
Image Insertions View (Image Manager Toolspace) | 331

Oyher options include: Palette Assignment Color Map (page 345) dialogbox for a DEM image or Band Assignment Color Map Dialog Box (page301) dialog box for a multispectral image.
■ Zoom To. Zooms your display to show the image at full extents.
■ Hide/Show. A toggle control that hides or shows the image.
■ Erase. Erases the insertion and its color map. For more information, seeerase (page 389).
■ Write. For eligible image types, displays a sub-menu where you can saveor export the image.
■ Move Forward, Move Back, Bring To Front, Send To Back. Moves the imagewithin the display order if the drawing contains multiple images. You canalso do this directly in the tree by clicking an image name and draggingit up or down the tree.
■ Refresh - rebuilds the tree to show any recent changes.
Right-click on a color map to edit it or refresh the display.
Item View
This secondary pane displays metadata for the object selected in the tree view.For some objects, you see a simple properties table. When you select a drawing,you see a multi-column table with an entry for each inserted image. You canchange the displayed columns and their positions in this table. For moreinformation, see Modifying the Item View Layout (page 65).
Image Data View (Image Manager Toolspace)Use this view to work with image data definitions. This view is especiallyuseful for creating new insertions and managing the display and analysis ofcomplex raster data.
The tree view can display six object types:
Image data definition
Band group
Band group metadata
332 | Appendix B Raster Design Dialog Boxes

Data band
Color map
Image insertion
As shown in the figure, each data definition includes one or more band groups(examples: Truecolor and Bitonal) with subordinate bands. At the same levelas the band groups are color maps (examples: RGB and BIN). Image insertionsare placed subordinate to the color maps that define them. The location ofthe image insertion on the tree is a major difference between the ImageInsertions view and the Image Data view.
Image Data Definition
Defines the source for one or more images inserted in the drawing. Right-clicka data definition to see a menu with the following options:
■ Properties. Opens the Image Data Properties (page 324) dialog box to showbasic information about the data definition.
■ New Insertion. Creates a new insertion of the image, based on the datadefinition. This insertion method offers you more options than by usingthe Image Insertion (page 325)dialog box.For AutoCAD image data definitions (bitonal, grayscale, index color, ortrue color), the new insertion works like a quick insert, without furtherconfiguration.
For single-band floating-point (DEM) data definitions, the PaletteAssignment Color Map (page 345) dialog box opens for you to choose acolor map.
Image Data View (Image Manager Toolspace) | 333
For single-band integer (16- or 32-bit) data definitions, a submenu allowsyou to choose either a grayscale or palette color insertion. Choosing palettecolor opens the Palette Assignment Color Map dialog box.
For multispectral data definitions, a submenu allows you to choose agrayscale, palette color, or false color insertion. Choosing grayscale opensthe Assign Multispectral Band (page 301) dialog box. Choosing palette coloropens the New Palette Color Insertion (page 344) dialog box. Choosing falsecolor opens the Band Assignment Color Map (page 301) dialog box.
■ Detach. Completely removes the image and its data definition from thedrawing and the toolspace tree.
■ Reload. Loads and redisplays an image that was previously unloaded fromthe drawing
■ Unload. Removes an image from the display, but leaves the image framevisible, and leaves the image icon on the toolspace tree.
■ Browse Path. Opens the Insert Image (page 338) dialog box to show youthe location of the source file for the image definition, also known as theactive path. If necessary, you can navigate to a different source file andopen it.
■ Save Path. Saves the current browse path (Active Path in item view) as thesaved path, which is where the image data definition is saved.
■ Clear Path. Deletes the saved path. Typically you do this in order to useBrowse Path to create a new active path, or to save the drawing without asaved path. In the latter case, when the drawing is reopened, Raster Designsearches for the image using the prescribed search order set in AutoCADOptions dialog box. (To access the AutoCAD Options dialog box, clickTools menu ➤ Options.)
■ Refresh. Updates the toolspace tree to show any recent changes.
Band Group
Right-click a band group to see the Image Data Properties (page 324) dialogbox.
Data Band
Right-click a data band to see the Image Data Properties (page 324) dialog box.
Band Group Metadata
Conditional object, present only for multispectral image data.
334 | Appendix B Raster Design Dialog Boxes

Color Map
Right-click a color map to see a menu with the following options:
■ Edit Color Map. Opens the dialog box for editing the color map for thisinsertion, such as: Select Color for a bitonal image, Image Adjust for agrayscale or color image.
Other options include:Palette Assignment Color Map (page 345) dialog boxfor a DEM image, or Band Assignment Color Map (page 301) dialog box fora multispectral image.
■ New Insertion. Inserts a new instance of the image, using the current colormap.
■ Refresh. Updates the toolspace tree to show any recent changes.
Image Insertion
Right-click an image insertion to see a menu with the following options:
■ Zoom To. Zooms your display to show the image at full extents.
■ Hide/Show. A toggle control that hides or shows the image.
■ Erase. Erases the insertion. For more information, see erase (page 389).
■ Refresh. Updates the toolspace tree to show any recent changes.
Image Data Definition Metadata
Conditional item. If present, it identifies the source file for the image metadata.Metadata is displayed in the item view.
Image Select Dialog BoxUse this dialog box when you select more than one image in a drawing.
Image Select Options
List of Images
Lists all images in the drawing. Each image that is currently selected ishighlighted. Click an image name to select or deselect it.
Select All
Selects all the images in your drawing.
Image Select Dialog Box | 335

Select None
Removes all selected images from the selection set.
Import Data Dialog BoxUse this dialog box to import files such control points and gamma point lists.
Import Options
Look In
Specifies the folder where the file is saved.
Back
Returns to the previous folder.
Up One Level
Navigates up one level in the directory tree.
Search The Web
Displays the AutoCAD Web browser, with which you can specify an Internetlocation and select drawing content for display in the AutoCAD DesignCenter palette.
Delete
Deletes the selected file.
Create New Folder
Creates a new, unnamed folder.
Views
Specifies how files are displayed.
Tools
Provides options for finding files, adding or modifying an FTP site, or savinga shortcut to the current folder.
Places List
Displays shortcut icons to locations such as the desktop, FTP, Buzzsaw.com,and so on.
File Name
Specifies the name of the file.
Files Of Type
Specifies the file format of the file to import.
336 | Appendix B Raster Design Dialog Boxes

Import Palette Dialog BoxUse this dialog box to apply a saved palette (*.pf) to the current image.
Look In
Specifies the folder or directory that contains the palette.
Back
Returns to the previous folder.
Up One Level
Navigates up one level in the directory tree.
Search The Web
Displays the AutoCAD Web browser, where you can specify an Internetlocation for the palette file.
Delete
Deletes the selected file.
Create New Folder
Creates a new, unnamed folder.
Views
Specifies how palette files are displayed.
Tools
Provides options for finding files, adding or modifying an FTP site, or savinga shortcut to the current folder.
Places List
Displays shortcut icons to locations such as the desktop, FTP, Buzzsaw.com,and so on.
File name
Specifies the palette file to insert.
Files Of Type
Displays the list of available palette formats. Choose the type of file thatyou want to display in the File name list.
Import Palette Dialog Box | 337

Palette Application
Substitute
Replaces the current palette with the imported palette. Indexed colors arenot changed, they are simply mapped to the new colors in the importedpalette.
Match
Replaces the current palette with the imported palette by re-mapping theindexed colors to the closest colors in the imported palette.
Dither
Replaces the current palette with the imported palette by re-mapping theindexed colors to the closest colors in the imported palette. Unlike matching,dithering can have different results when an indexed color from the originalimage is equally similar to two or more colors from the imported palette.In this case, a pixel which once displayed a single color might be representedas a group of pixels displaying the target colors.
Related procedures:
■ Importing an Image Palette (page 125)
Insert Image Dialog BoxUse this dialog box to select one or more images to insert into a drawing.
You can view information about an image and preview the image before youinsert it.
NOTE If the AutoCAD FILEDIA variable is set to <0>, this dialog box does notdisplay, and you can type on the command line the name of the image that youwant to insert.
Look In
Specifies the folder or directory that contains the image.
Back
Returns to the previous folder.
Up One Level
Navigates up one level in the directory tree.
338 | Appendix B Raster Design Dialog Boxes

Search The Web
Displays the AutoCAD Web browser, with which you can specify an Internetlocation and select drawing content for display in the AutoCAD DesignCenter palette.
Delete
Deletes the selected file.
Create New Folder
Creates a new, unnamed folder.
Views
Specifies how files are displayed.
Tools
Provides options for finding files, adding or modifying an FTP site, or savinga shortcut to the current folder.
Places List
Displays shortcut icons to locations such as the desktop, FTP, Buzzsaw.com,and so on.
File Name
Specifies the image to insert.
Files Of Type
Displays the list of available supported image types (page 399). Choose thetype of file that you want to display in the File Name list.
Insert Options
Quick Insert
Inserts the image with no other decisions required. Correlation data (ifrequired) is taken from the image file, a separate file, or default values areused.
Insertion Wizard
Inserts the image after walking you through a sequence of steps to supplyand review correlation data. This is the default correlation method.
Insertion Dialog
Inserts the image after presenting you with the correlation data to review.This option is similar to the Insertion Wizard, but without the sequence.You can review and edit data in any order on separate tabs of a dialog box.
Insert Image Dialog Box | 339
Show Frames Only
Displays only the frame (page 389) of the image you insert.
Zoom To Image(s)
Zooms to the extents of the image(s) you insert after correlation.
Treat As Multispectral
If two or more images are selected for insertion, this option verifies thatthey share the same image format, coordinate system, extents, and units.If they meet this criteria, the images can be handled as a multispectraldataset.
Multi-frame Options
These options are available only when a multi-frame image is selected forinsertion.
Insert First Frame
Inserts the first frame in the multi-frame set.
Insert All Frames
Inserts all of the frames in the multi-frame set.
Select Frames
Opens the Multi-frame Select Dialog Box (page 341), where you can selectwhich frames to insert.
Related procedures:
■ Inserting Local Images Using the Insert Image Dialog Box (page 10)
Median Filter Dialog BoxUse this dialog box to remove visual “noise” or speckles from a grayscaleimage.
This filter adjusts the shade of gray for each pixel to create smoother transitionsbetween shades and eliminate speckles. Enter an odd integer from 3 to 25 tospecify the area to be evaluated around each pixel. A setting of 3 evaluates 8pixels, processes an image very quickly, and retains most sharpness. A highersetting evaluates a larger area, takes more time, and produces a more blurryimage.
340 | Appendix B Raster Design Dialog Boxes

Related procedures:
■ Median Filter (page 106)
Mirror Dialog BoxUse this dialog box to choose the vertical or horizontal axis about which tomirror or flip an image.
IMPORTANT The axes for mirror operations are always relative to the image. Ifthe image has been rotated or repositioned in the drawing, the mirror axes arealso moved, so they may not appear horizontal or vertical in the display.
Top To Bottom
Mirrors the object about the horizontal axis of the image.
Side To Side
Mirrors the object about the vertical axis of the image.
Related procedures:
■ Mirroring an Image (page 88)
Multi-frame Select Dialog BoxUse this dialog box to specify which image frames to insert from a multi-frameset.
Left pane
Click the frames to be inserted or clear check boxes for frames that you donot want inserted.
Select All
Selects all the frames.
Clear All
Clears the check boxes for all frames.
Treat As Multispectral
Select this option if the selected frames are part of a multispectral set,intended to be viewed together with a band assignment color map.
Mirror Dialog Box | 341

Hide Information
Closes the Information pane.
Hide Preview
Closes the Preview pane.
Preview
Displays thumbnail images of each frame in the set. You can review theimages here and select the ones to be inserted. To review images, use thescroll bar or the keyboard arrow keys. To select images, use the mouse. Usethe Shift key with the mouse to select a range of images; use the Ctrl keywith the mouse to select several non-adjacent images.
Information
Displays metadata about the image set, such as image type, depth, density,width, and height.
New Image Dialog BoxUse this dialog box to define the properties of the image that you want tocreate.
AutoCAD Properties
X, Y, and Z Coordinates
Specifies the X, Y, and Z AutoCAD coordinates that define the lower-leftcorner of the new image.
Scale
Specifies a numeric scaling factor for the new image.
Rotation
Specifies a rotation for the new image.
Pick <
Draws a frame for the image you want to create. This automatically sets theX,Y, and Z values, scale, and rotation of your new image.
Color Type
Bitonal (1-bit)
Limits your image to two colors.
Grayscale (8-bit)
Limits your image to 256 shades of gray.
342 | Appendix B Raster Design Dialog Boxes

Indexed Color (8-bit)
Limits your image to 256 different colors.
True Color (32-bit)
Limits your image to 16.7 million colors.
NOTE True Color uses more system resources.
Image Properties
Width
Displays the physical width of the image in pixels and the current units.You can use the list to choose other units of measurement.
Height
Displays the physical height of the image in pixels and the current unitsYou can use the list to choose other units of measurement.
Density
Specifies a density (or resolution (page 395)) for the image. This defines boththe horizontal and vertical density.
NOTE You should set this to the density value at which your images are scanned.
Show This Dialog
Uses the command line interface for future new images instead of thisdialog.
Related procedures:
■ Creating New Images (page 20)
New Image Mask Dialog BoxUse this dialog box to control what happens to image data outside the maskboundary.
Enable Mask
Enables an existing mask for display. Enabling allows you to view the imageclip as defined by the image mask.
New Image Mask Dialog Box | 343
Image(s) Outside The Image Mask
Do Not Affect
Specifies that the images outside the mask boundary are not modified.
Hide Image(s)
Hides the images that are outside the mask boundary.
Unload Images
Unloads from memory the images that are outside the mask boundary.
Show Image Frame(s)
Specifies the visibility of image frames. If you choose Hide Image(s) orUnload Image(s), then you can select this check box to show the hiddenor unloaded frames.
Define Image Mask
Rectangle
Draws a rectangular mask.
Polygon
Draws a polygonal mask.
NOTE Use the Options dialog box to specify the default mask properties.
Related procedures:
■ Masking Images (page 136)
New Palette Color Insertion Dialog BoxUse this dialog box to select a data band from a multispectral set and a colormap to use for that band.
Band Association
Click the band to display.
Color Map Name
On the drop-down list, click the color map you want to use for the image.
Clicking one of the following three buttons takes you to the Palette ColorMap Definition (page 345) dialog box to configure the color map:
344 | Appendix B Raster Design Dialog Boxes
Click to create a new color map.
Click to copy the selected color map; this is a good way to create a newcolor map based on an existing one.
Click to edit the selected color map.
Palette Assignment Color Map Dialog BoxUse this dialog box to edit the color map of a digital elevation model (DEM)or other single-band image.
Color Map Name
On the list, click the color map you want to use for the image.
Clicking one of the following three buttons takes you to the Palette ColorMap Definition (page 345) dialog box to configure the color map:
Click to create a new color map.
Click to copy the selected color map; this is a good way to create a newcolor map based on an existing one.
Click to edit the selected color map.
Insert Into Display
Clear this check box if you do not want to display the image.
Palette Color Map Definition Dialog BoxUse this dialog box to review and edit attributes for a palette color map, usedwith digital elevation models (DEM).
Palette Assignment Color Map Dialog Box | 345

Data Interpretation
Select the type of data to display about the surface:
■ Height (Feet). Land elevation in feet
■ Height (Meters). Land elevation in meters
■ Value. Land elevation in other units, or other data in the file
■ Slope (Percent). Ground slope expressed as a percentage
■ Slope (Angle). Ground slope expressed as an angle
■ Aspect. Direction of ground slope
Value Distribution
This setting controls how the colors in the Range Table are distributed acrossthe range of data values: Parametric or Custom.
NOTE A parametric distribution automatically adapts to the range of values inthe file being displayed; a custom distribution uses fixed data values, regardlessof the range of values in the file. This difference is important if you want to savethe color map and use it on multiple data files.
If you want Raster Design to automatically set the ranges, choose Parametric,then one of these three options:
■ Equal
Each color represents an equal range of values, regardless of how manyactual data points occupy that range for a given source file.
■ Standard Deviation
Six ranges are created, and the spread of each one is set to the standarddeviation for the data. The upper limit of the third range is the arithmeticmean value. If the data has a normal distribution, the third and fourthranges embrace about 68% of the data values; the second through fifthranges embrace about 95% of the values.
■ Quantile
Each range represents an equal number of data points in the source file.Where readings are clustered around a narrow range of values, colors inthat range have a small range spread; where readings are sparse, the rangespread is large.
346 | Appendix B Raster Design Dialog Boxes

If you want to manually set the range spreads, click Custom. You can alsostart by clicking Parametric to generate an initial set of ranges, then editindividual range values in the Range Table. When you start editing, theValue Distribution is reset to Custom.
Palette
The name of the current palette is displayed. An asterisk (*) before the nameindicates that you have edited the palette in the Range Table.Click Import to import an existing palette.Click Export to export a palette; this option is available only after you havefinished defining a color map.
Display Enhancements
You can use these effects to change the appearance of the displayed surface.Select Hillshade if you want to cast light across the surface from thenorthwest direction, creating shadows around the hills and valleys.Set a Vertical Exaggeration level (1 to 99) if you want to make the elevationchanges more extreme and intensify the hillshading.Select Blend if you want to create a smooth transition between colors inthe display.
Range Table
This table shows the details of color ranges and accepts a wide range of editsto the number of ranges, range values, colors and visibility.
Index
This column provides a reference number for each color, with 0 for thelowest value range. An asterisk (*) indicates the highest assigned range andthe place where a new range is added.Use the Index column to highlight entire rows of the table for editing. Byadding or deleting rows, you can set the number of ranges for the colormap. When one or more rows are selected, you can right-click to insertrows, combine rows, or change their visibility.
Range Upper Value
This column shows the upper limit of data values for each range. You canedit the numbers, but they must remain in the correct sequence in relationto adjacent ranges. You can right-click in this column to delete, cut, copy,and paste one or more upper range values without affecting the othercolumns.
Range Spread
This column shows the size of the range, or the difference between therange upper value in the current row and the one above. You can right-click
Palette Color Map Definition Dialog Box | 347

in this column to edit values in the same way as in the range upper valuecolumn.
Color
Use this column to change the color assigned to each range. Double-clicka single color to change it on the AutoCAD Select Color dialog.You can select one or more colors in this column, the right-click to cut,copy, paste, or assign a single color to the group.
Palette Information Dialog BoxThis dialog box displays general information about the current image and itspalette of colors or shades of gray.
Palette Manager Dialog BoxUse this dialog box to manipulate individual colors and entire palettes for8-bit images.
Palette menu
Import
Imports a saved palette (*.pf).
Export
Displays the Export Palette dialog box, where you specify a name and saveyour changes to the current palette.
Information
Displays information about the current palette.
View menu
Show Unused
Displays or hides the “X” marks that indicate which colors in the paletteare unused.
Show Transparent
Displays or hides the “+” marks that indicate which colors in the paletteare transparent.
RGB
Displays the Red, Green, and Blue (RGB) values on the status bar for theselected color.
348 | Appendix B Raster Design Dialog Boxes
HSL
Displays the Hue, Saturation, and Luminosity (HSL) values on the statusbar for the selected color.
Sort By
Specifies a sorting method for the color table and list view.
Select Color
Specifies a color (or colors) directly from the image.
Color Table
Specifies colors in the selection set. The color table is represented as a 32X8grid of colors. You can select colors by clicking directly, or clicking anddragging. You can also right-click a selected color, then click Clear Selectionto remove the current colors from the selection set, or click Invert Selectionto select everything except the color you clicked.
Change
Replaces the selected color with a new color.
Combine
Condenses the selected colors into a single color.
Set Transparent
Specifies the selected color as transparent.
Compress
Removes duplicate entries from the palette. All unused entries that resultfrom a compress operation are assigned a RGB value of 0,0,0.
Convert To Color
Converts a grayscale image to an image with a palette that consists of graytones.
Reset
Restores the palette to the original state or to the state after the last Apply.
List View
Displays a table in which you can view and sort each color entry in thepalette. Click on a column heading to sort the table by that column. Clickagain to reverse the sort order. Right-click on a column heading, then clickthe column names to show or hide the corresponding columns.
Image Transparency
Specifies whether the transparency property is on or off in the image.
Palette Manager Dialog Box | 349
Apply
Saves your changes to the image palette without exiting the Palette Managerdialog box.
Related procedures:
■ Manipulating the Color Table (page 118)
■ Importing and Exporting Image Palettes (page 125)
■ Controlling Palette Views (page 131)
Raster Data Query Dialog BoxUse this dialog box to display pixel data values at the cursor location over animage.
This dialog box can be floated or docked in the left pane of the main window,similar to the Image Manager.
Coordinate System
When running on AutoCAD Map, specifies the coordinate system of theimage, or “Not Set” if no coordinate system is assigned.
Choose Transform
Opens the Select Global Coordinate System Dialog Box (page 369) whereyou can select a coordinate system for the image.
Cursor Tracking
Specifies the X, Y location of the cursor. These are usually AutoCAD Worldcoordinates, unless a coordinate transformation arrangement exists betweenthe drawing coordinate system and the working coordinate system.
Move Cursor to Coordinates
Sends the cursor to the coordinates specified in Cursor Tracking. Right-clickfor additional options.
Image Data
Image Name
Specifies the name of the current image insertion.
350 | Appendix B Raster Design Dialog Boxes

Select Image
Queries a different image. Right-click for additional options.
Pixel Display Color
Specifies the displayed color values of the pixel under the cursor.
Pixel Data Value
Specifies other data values of the pixel under the cursor. Values depend onimage type. For example, 0-255 for an indexed color or grayscale image. Ifthe image is in 32-bit floating point format with a palette color map, thedata here can be elevation, slope, or aspect, depending on the color map.
Related procedures:
■ Displaying Point Data (page 71)
Raster Design Options Dialog BoxUse this dialog box to configure the behavior of many features in Raster Design.
The dialog box consists of the following tabs:
Image Defaults Tab (Raster Design Options Dialog Box)Use this tab to set correlation defaults. The values set on this tab are used onthe Source tab of the Image Insertion dialog box and wizard. For moreinformation, see Correlating Images (page 21). You can correlate (page 386)the image data that is stored in the image file header, in a resource file, or inthe drawing file. However, some images may not have any correlation data.For those cases, you can specify default correlation data.
NOTE Setting the correlation defaults can save you time if you have multipleimages that require the same insertion point, scale, rotation, and density.
Insertion Point
Specifies default X, Y, and Z AutoCAD coordinates to define the lower-leftcorner of images.
Scale
Specifies a default numeric scaling factor for images.
Raster Design Options Dialog Box | 351

Rotation
Specifies a default angular rotation for images.
Density
Specifies the default image density value (or resolution (page 395)), typicallyin dots per inch or per centimeter. For more information, see ChangingImage Density (page 115). You should set the value to the most commondensity value at which your images are scanned.If you insert images that include density value and density unit information,then these defaults are not used.
Vertical Units
Specifies the default unit of measure for elevations. Select either US SurveyFeet, or Meters.
Feature Settings Tab (Raster Design Options Dialog Box)Use this tab to configure global settings for the drawing, such as the methodof locking image files, the width for the rub and crop lines, and the VToolsrub setting. You can also control mouse button actions.
Locking Settings
No Locking
Choose this option only if you are not working in a network environmentor if it is unlikely that two people would access the same image at the sametime from a network drive.
Lock File
Choose this option if you are using a network that does not support DOSFile Sharing or if you are using more than one platform on the network.This option creates a lock file that denies write access to the image file untilit is closed. This file is not locked by your operating system.With this method of file locking, if a lock file is present and your systemfails, then you will have to delete the lock file manually. Lock files have an.l_k extension and the same base name as the image. Lock files are eitherin the same directory as the image file or in the specified lock directory.For more information, seeLocking Method for Image Files (page 258).
NOTE You cannot lock files on the Internet.
352 | Appendix B Raster Design Dialog Boxes

OS/Network Locking
Choose this option if you are on a network that supports DOS File Sharing.This option creates a lock file that is marked as locked by your operatingsystem or network software. This file denies write access to the image fileuntil the file is closed. With this method, if a lock file is present and yoursystem fails, then the lock file is released by the network when you restartyour computer.
Lock File Directory
Specifies a directory to store lock files in.
Removal Method
Rub
Rubs the raster objects beneath the vector when you use Remove tools.
REM
Deletes the raster objects beneath the vector when you use Remove tools.
Display Option On Shortcut Menu
Makes the Remove Under Existing feature available from the shortcut menu.
Rub/Crop Line Width
Specifies a line width, in AutoCAD units, to be used for rub lines and croplines. Or, you can click Pick and then pick two points on your raster imageto define the line width.
NOTE You can also use the Autorub command to specify the Rub/Crop linewidth. For more information, see Rub and Crop Line Width (page 266).
Thumbnail Options
Instructs Raster Design to create thumbnails of your images when you savethe image. Thumbnails are displayed much more quickly in image previewsthan if Raster Design has to read in the entire image file. This option onlyworks for image formats that support thumbnails, such as TIFF, TARGA,and FLIC files. For more information, see Image Thumbnails (page 255).
Image Mask Tab (Raster Design Options Dialog Box)Use this tab to control the properties for a future mask. This includes enablingand disabling the mask, determining how the mask affects the images in thedrawing, and defining the mask boundary.
Image Mask Tab (Raster Design Options Dialog Box) | 353

NOTE Setting the Image Mask defaults can save you time if you have multiplemasks that require the same properties.
Enable Mask
Enables an existing mask for display. You can view the image clip as definedby the image mask.
Image(s) outside the Image Mask
Do Not Affect
Ignores the images that are outside the mask boundary.
Hide Image(s)
Hides the images that are outside the mask boundary.
Unload Image(s)
Unloads from memory the images that are outside the mask boundary.
Show Image Frame(s)
Shows the frames of the images that are hidden or unloaded.
New Image Tab (Raster Design Options Dialog Box)Use this tab to control the properties for a new image. This includes definingimage properties and setting a default color type.
NOTE Setting New Image defaults can save you time if you have multiple imagesthat require the same properties.
Width
Displays the default physical width of the image in pixels and the currentunits. You can use the drop down arrow to choose other units ofmeasurement.
Height
Displays the default physical height of the image in pixels and the currentunits. You can use the drop down arrow to choose other units ofmeasurement.
Density
Specifies the default density (or resolution (page 395)) for the new image(s)in pixels per linear unit (example: 300 pixels per inch). You can use themenu to choose other units of measurement.
354 | Appendix B Raster Design Dialog Boxes

NOTE You should set this value to the density at which your images are scanned.
Default Color Type
Bitonal (1-bit)
Sets a default for an image that consists of only two colors.
Grayscale (8-bit)
Sets a default for an image that contains 256 shades of gray.
Indexed Color (8-bit)
Sets a default color from the AutoCAD palette for an image that contains256 different colors.
True Color (32-bit)
Sets a default for an image that contains up to 16.7 million colors.
NOTE Selecting True Color uses more system resources.
Dialog Options
Show New Image Dialog
Sets default access to the command line interface, when the check box iscleared.
Paths Tab (Raster Design Options Dialog Box)Use this tab to set the correlation search paths and to select an AutoPasteoption for inserting images from Raster Design GSX or Raster Design ESP.
Correlation Search Paths
Read Path
Specifies the default directory to search for a resource file (page 395) or worldfile (page 400) for an inserted image. This directory can be on a local ornetwork drive, or at an Internet location. Click Browse ➤ Local to openthe Choose a Resource File Directory Dialog Box (page 304), where you cannavigate to and select a directory.
Write Path
Specifies the default directory in which to save or export resource files andworld files. The possibilities for the location and the means of setting it arethe same as for Read Path.
Paths Tab (Raster Design Options Dialog Box) | 355

Use Correlation Search Path Before Using Image Directory
Instructs Raster Design to search for resource files using the read path forcorrelation before searching the image path stored in the drawing.
Search For Correlation Files On The Internet
Instructs Raster Design to search the Internet for associated correlation files.
AutoPaste (ESP and GSX Compatibility)
Use these options only if you are upgrading to Raster Design from CAD OverlayESP or GSX.
AutoInsert
Instructs Raster Design to automatically insert images into a drawing thatyou created with ESP or GSX. For more information, see Inserting ImagesFrom GSX or ESP (page 256).
AutoReplace
Instructs Raster Design to search for an image sharing the same base nameas the drawing. If found, this new image is inserted using the same insertionpoint, scale and rotation as the original reference. Raster Designautomatically updates the saved image path.For instance, in order to create a new version of a drawing-image hybridpair (example.dwg and example.tif), both the drawing and the correspondingimage may be renamed so they share new base names (example1.dwg andexample1.tif). When the new drawing is opened, the image cannot be foundbecause the drawing still references the old image (example.tif). IfAutoReplace is enabled, the new image (example1.tif) is found and replacesthe old image in the drawing.
Prompt Before AutoInsert
Instructs Raster Design to prompt you when it locates the image, beforeinsertion.
Extension List
Lists the extensions Raster Design searches for when it searches for theimage. Raster Design searches for images in the order that they appear inthis list.
< Add
Adds your image type choice to the Extensions List.
356 | Appendix B Raster Design Dialog Boxes
REM Tab (Raster Design Options Dialog Box)Use this tab to choose settings for REM commands. For more information, seeREM Settings (page 265).
Color Of REM Objects
Specifies the REM object default color, the color of all REM objects.If you change this setting and REM objects are already defined, REM objectschange accordingly.
Clipboard Settings
Display Capture
Instructs the Copy to Clipboard command (icopyss) to maintain the displayscale and rotation of the objects in the REM selection set.
Native Capture
Instructs the Copy to Clipboard command to copy the REM selection setdata directly from the image file, disregarding the display scale and rotation.
Raster Entity Detection Tab (Raster Design OptionsDialog Box)
Use this tab to determine how REM and vectorization tools detect rasterentities. For more information see Raster Entity Detection Settings (page 264).
Single Pick Options
Max Jump Length (Pixels)
Specifies the distance Raster Design can jump to extend a raster entity whenselecting entities for the Smart option and one-picks for lines, circles, arcs,and polylines. Click Pick< to select the jump length directly from an image.
Stop At Intersections
Specifies whether REM and vectorization tools detect segments or entireprimitives.
Use Raster Pick Gravity
Specifies whether to select raster that is within a pick aperture around thecursor.When pick gravity is active, if you select a point that is not exactly on raster,Raster Design looks for the specified number of aperture pixels in eachdirection to find raster.
REM Tab (Raster Design Options Dialog Box) | 357

Pick Aperture (Pixels)
Specifies the size of the aperture for pick gravity. Enter a numerical pixelwidth to define a new aperture size.
Multi-Pick Options
Float Tolerance (Pixels)
Specifies the maximum pixel distance between raster and vector for theraster to be selected. The distance between the vector being followed andthe underlying raster is constantly tested to ensure the raster falls withinthe float tolerance. For example, if your REM primitive arc selection isfurther from the raster at one endpoint than the float tolerance allows, onlythat portion of the raster within the float tolerance is selected.
Non-Continuous Linetype Detection
Max Dash Length (Pixels)
Specifies the maximum length of dash segments for Raster Design to consideran entity as a non-continuous line.Click Pick < to select the dash length directly from an image.
Max Blank Length (Pixels)
Specifies the maximum distance between dashes for Raster Design toconsider an entity as a non-continuous line.Click Pick < to select the blank length directly from an image.
User Preferences Tab (Raster Design Options DialogBox)
Use this tab to configure global settings for the drawing, such as the displayquality of images, how frames are displayed, drawing units, and so on.
Image Detach Options
Ask Before Detach
Prompts you to detach an image if it is not referenced by any frames in thedrawing.
Always Detach
Automatically detaches an image if its frame is erased.
Never Detach
Retains an attached image, even if the frame is erased.
358 | Appendix B Raster Design Dialog Boxes

Message Display
No Messages
Prevents Raster Design from displaying warnings while editing an image.
Command Line
Displays warnings on the command line only.
Message Box
Displays all warnings while you are editing an image.
Mouse Settings
Shift + Left-Click Image Select
Enables you to select images by placing your cursor over them and holdingthe Shift key down while clicking your left mouse button. This feature isuseful when you are zoomed in to the image and cannot see the imageframe. For more information, see Selecting an Image (page 79).
NOTE When you activate Shift+ Left-Click Image Select here, it overrides theAutoCAD Shift+ Left-Click to deselect entities for pickfirst and grip editing.
QSAVE Preference
Prompt during QSAVE
Prompts you to save your images when you type QSAVE at the commandline.
Startup Options
Load Menu on Raster Design Startup
Instructs the Image menu to appear each time you run Raster Design.
Vector Merge Tab (Raster Design Options Dialog Box)Use this tab to set the behavior for future vector merge operations.
Prompting Options
Prompt To Delete Vector
Prompts you to delete all selected vectors after vector merge has completed.
NOTE This option disables the Always Delete Vector and the Never DeleteVector options.
Vector Merge Tab (Raster Design Options Dialog Box) | 359

Always Delete Vector
Deletes all selected vectors after vector merge has completed.
Never Delete Vector
Preserves all selected vectors after vector merge has completed.
Expand Image If Necessary
Expands your image to the extents of the vector.
Respect Display Order
Incorporates your current display order.
NOTE If a vector lies behind the image and the Expand Image If Necessary boxis not checked then the vector is not merged into the image unless the imageis transparent. For more information, see Controlling the Display of TransparentColors (page 132).
VTools Follower Tab (Raster Design Options Dialog Box)Use this tab to control the behavior of the follower tools used for vectorization.
Follower Color
Displays the current color used to mark the progress of the follower. Clickthe Select button to display the color palette.
Pan To Decision Point
Pans automatically to ensure that the current decision point is always onscreen.
End Current Polyline If Closed Loop Detected
Closes polylines and contour objects automatically when the endpoints arewithin the tolerance distance. This setting is useful for closing across labelsin contour lines.
Close Tolerance In Pixels
Specifies the distance between endpoints within which polylines will beautomatically closed.Use the Pick button to select the distance directly from an image.
Post Process Points
Specifies how Raster Design draws the polylines and contours produced bythe follower.Move the slider to control how closely Raster Design imitates the rasterpolyline or contour.
360 | Appendix B Raster Design Dialog Boxes

High deviation creates a polyline with fewer points that is less faithful tothe original raster. Polylines with fewer points require less memory.Low deviation creates a polyline with more points that more closely matchesthe raster path. Polylines with more points require more memory.
Contour Settings
Contour Creates
Specifies the type of entity the Contour Follower creates.
NOTE The follower can only create contour objects if Raster Design is runningon AutoCAD Land Desktop.
Elevation
Specifies one of the following:
■ ELEVATION assigns an elevation value based on the AutoCADELEVATION variable.
■ Zero assigns an elevation value of 0.
■ Preset assigns the value that you specify in the Preset Elevation text boxto all polylines and contour objects created by the Contour Follower.
■ Prompt causes Raster Design to prompt you for elevation when thefollower is finished.
■ Use Existing causes Raster Design to prompt you to select an existingcontour or polyline to which the elevation value can be matched.
Elevation Interval
Specifies the amount Raster Design adds or subtracts from the last elevationvalue you entered to create a suggested elevation value.
3D Polyline Settings
Elevation Interval
Specifies the amount Raster Design adds or subtracts from the last elevationvalue you entered to create a suggested elevation value.
Use Raster Impact Points Only
Instructs the follower to pause only at a raster impact point (page 395),ignoring other vertices.
Ignore Raster Speckles
Prevents the follower from pausing at raster impact points involving rasterspeckles.
VTools Follower Tab (Raster Design Options Dialog Box) | 361

Speckle Size (Pixels)
Specifies the maximum speckle size to ignore.Click the Pick button to select a speckle or speckle size directly from theimage.
VTools General Tab (Raster Design Options Dialog Box)Use this tab to control the general behavior of vectorization tools.
Removal Method
None
Leaves the raster as you trace it.
Rub
Rubs the underlying raster automatically. This setting uses the Rub/CropLine Width setting to determine the width of the raster it rubs. For moreinformation, see Rub and Crop Line Width (page 266).
REM
Deletes the underlying raster. However, unlike the Rub setting, this optionrecognizes raster line width and leaves raster intersections intact
Vector Separation
Specifies values such as layer and polyline width to vectors based on theunderlying raster. For more information, see General Vector SeparationOptions (page 249) and Contour Vector Separation Options (page 244).
Line, Circle, Arc and Polyline Settings
Stop At Vector Intersection
Instructs vline, vpline, and varc to stop at vector intersections duringone-pick selection. This is useful if much of a drawing has been vectorizedand the VTools must now depend on increasing amounts of vector data tomake stopping decisions.
Display Start Point Glyph
Instructs vline and vpline commands to display a glyph that specifies thestart point.
Verification List
Most Recently Used
Populates the verification list with recently used values.
362 | Appendix B Raster Design Dialog Boxes

Most Frequently Used
Populates the verification list with frequently used values.
Length
Specifies the number of values to include in the verification list.
SmartCorrect Settings
Respect Drafting Settings
Instructs SmartCorrect to adhere to current AutoCAD drafting settings suchas OSNAP, ORTHO, POLAR, and so on, for the Line and Polyline tools.
Correction Tolerance
AutoCAD APERTURE
Specifies the aperture settings from the Drafting Tab of the AutoCAD Optionsdialog box to determine how far (in screen pixels) the resulting vector isallowed to shift in an attempt to respect AutoCAD drafting settings.
AutoCAD Units
Specifies how far (in AutoCAD units) the resulting vector is allowed to shiftin an attempt to respect AutoCAD drafting settings. If you select this option,enter the number of units in the text box.
Round Values
Rounds the values for vector entities created using one-pick selection forthe Line, Polyline, Circle, and Arc tools. Rounding applies to the lengthand angle values for lines and polylines, and to the radius value for arcsand circles.
AutoCAD Precision (LUPREC/AUPREC)
Specifies the AutoCAD precision value that you set on the Units tab of theDrawing Setup dialog box. AutoCAD Precision rounds to the number ofdecimal places you specify.
Specified Precision
Specifies the precision values you set in the associated Length and Angletext boxes. Specified Precision rounds to a multiple of the value you entered.For instance, if you specified a length precision of .03, Raster Design mightround a line to 12.03, 12.06, 12.09, and so on.
Raster Pen Settings Dialog BoxUse this dialog box to control the thickness of vector lines when you mergethem into the image.
Raster Pen Settings Dialog Box | 363

Thicknesses are assigned according to the specified entity color.
Color Index Column
Lists color index and width of the raster pens.
Width Column
Displays the selected pen width.
Pick <
Defines the pen width by selecting a distance from the AutoCAD screen.
Units
Pixels
Defines pen width in pixels.
AutoCAD
Defines pen width in AutoCAD units.
Use Fixed Width
Assigns the specified pen width to all raster pens.
Related procedures:
■ Merging Vectors into a Raster Image (page 161)
Recognition Character Sets Dialog BoxUse this dialog box to choose character sets for text recognition operations.
A Character Set is a group of 256 characters used by a specific language.
You can select multiple character sets, but each additional character setincreases the number of possible characters the recognition engine searchesfor. Doing this slows the recognition process and increases the possibility oferrors.
Related procedures:
■ Vectorizing Raster Text (page 225)
Rubbersheet - Set Control Points Dialog BoxUse this dialog box to set the locations of control points for use in arubbersheeting operation.
364 | Appendix B Raster Design Dialog Boxes
Method
Use this area to select the rubbersheeting method that best suits your image.After setting the control points, you can switch from one method to the otherand preview the results before making a final decision.
Triangular
Specifies the use of the triangular method.
Polynomial
Specifies the use of the polynomial method.
Degree
Used only with the polynomial method, to specify the polynomial degree,which affects the accuracy of the rubbersheet operation.
Control Point Table
ID
Specifies the control point number.
Error
Used only with the polynomial method, to specify the distance from theintended to the actual destination point after the rubbersheet operation.This distance is also known as the root-mean-square (RMS) error for thecontrol point.
Source Point
Specifies the coordinates of the source point in the image.
Destination Point
Specifies the coordinates of the intended destination point, after therubbersheet operation.
Total RMS Error
Displays the total root-mean-square error for the set of control points.
Buttons
Add Points <
Click to add pairs of source and destination points.
Grid Points
Click to open the Grid Parameters Dialog Box (page 315) and create a gridto use in the rubbersheeting operation.
Rubbersheet - Set Control Points Dialog Box | 365

Delete
When a row is selected in the Control Point Table, click to delete the row.
Repick <
When a row is selected in the Control Point Table, click to repick a pair ofpoints.
Zoom To <
When a row is selected in the Control Point Table, click to zoom in to thevicinity of the pair of control points.
Preview
Click to preview the effects of a rubbersheet operation using the currentsettings.
Import
Click to import a set of control points, saved in a text (.txt) file.
Export
Click to export the existing points from the Control Point Table to anexternal text file.
Auto Zoom
Specifies that the drawing window automatically zooms in to the vicinityof a particular pair of control points when they are selected in a repickoperation.
Related procedures:
■ Rubbersheeting an Image (page 31)
Save As Dialog BoxUse this dialog box to save an image; in the process you can change the filename, format, and location.
Save As Options
Save In
Specifies the folder to store the saved image.
Back
Returns to the previous folder.
366 | Appendix B Raster Design Dialog Boxes

Up One Level
Navigates up one level in the directory tree.
Search The Web
Displays the AutoCAD Web browser, where you can specify an Internetlocation and select drawing content for display in the AutoCAD DesignCenter palette.
Delete
Deletes the selected file.
Create New Folder
Creates a new, unnamed folder.
Views
Specifies how files are displayed.
Tools
Provides options for finding files, adding or modifying an FTP site, or savinga shortcut to the current folder.
Places List
Displays shortcut icons to locations such as the Desktop, FTP sites, andBuzzsaw.com.
File Name
Specifies the name of the saved image.
Save As Type
Specifies the format of the saved file.
Select a Lock File Directory Dialog BoxUse this dialog box to specify a directory for image lock files.
IMPORTANT The use of a single directory for lock files affects how files are editedanywhere on the network, and requires all users to use the same directory setting.For more information, see Help topic Locking Method for Image Files (page 258).
Look In
Specifies the current directory for image lock files. If you want to changeit, use the arrow beside this field, in combination with the file list in theName column, to navigate to a different directory. If you delete the entryhere, each lock file will be stored in the same directory as the image it locks.
Select a Lock File Directory Dialog Box | 367
Back
Returns to the previous folder.
Up One Level
Navigates up one level in the directory tree.
Search The Web
Displays the AutoCAD Web browser, with which you can specify an Internetlocation.
Delete
Deletes the selected file.
Create New Folder
Creates a new, unnamed folder.
Views
Specifies how files are displayed.
Tools
Provides options for finding files, adding or modifying an FTP site, or savinga shortcut to the current folder.
Places List
Displays shortcut icons to locations such as the desktop, FTP, andBuzzsaw.com.
Name
Specifies the directories and files within the directory in the Look In field.
Select Coordinate System (Export) Dialog BoxUse this dialog box to select a GeoTIFF coordinate system for an exportedimage, or to specify no coordinate system.
Drawing Coordinate System
Specifies the coordinate system used in the drawing that references theimage.
Select GeoTIFF System
Specifies the available GeoTIFF coordinate systems in three categories:
■ None. Click to specify no coordinate system.
■ Geographic. Click to see the complete list of geographic coordinatesystems.
368 | Appendix B Raster Design Dialog Boxes

■ Projected. Click to see the complete list of projected coordinate systems.
Code
Specifies the GeoTIFF code for the selected coordinate system.
Area Of Use
Specifies the region of the world where the selected coordinate system isused.
Select Coordinate System (Insert) Dialog BoxUse this dialog box to select a coordinate system for an image during theinsertion process.
Category
Specifies the type of coordinate system used in the image. Select the nation,state, UTM datum, Lat/Long, or other suitable category.
Coordinate Systems In Category
Specifies the available coordinate systems in the category.
Properties
Click to see detailed properties of the selected coordinate system and itsprojection.
Select Global Coordinate System Dialog BoxUse this dialog box to select a coordinate system for an image.
Category
Specifies the type of coordinate system used in the image. Select the nation,state, UTM datum, Lat/Long, or other suitable category.
Coordinate Systems In Category
Specifies the available coordinate systems in the category.
Properties
Click to see detailed properties of the selected coordinate system and itsprojection.
Select Working Coordinate System Dialog BoxUse this dialog box to select or clear a working coordinate system for an image.
Select Coordinate System (Insert) Dialog Box | 369

Category
Specifies the type of coordinate system used in the image. Select the nation,state, UTM datum, Lat/Long, or None.
Coordinate Systems In Category
Specifies the available coordinate systems in the category.
Properties
Click to see detailed properties of the selected coordinate system and itsprojection.
Target Color Dialog BoxUse this dialog box to select a new color for Change and Combine operations.
Palette
Displays a list of standard palettes. This list box is not available for Combineoperations.
Color Table
Specifies a color from the color table that is represented as a 32X8 grid ofcolors. You can select a new color by clicking one of the colors from thecolor table.
Custom Color
Creates a custom color in the Select Custom Color dialog box. This buttonis not available for Combine operations.
Related procedures:
■ Manipulating the Color Table (page 118)
Temporary File Location Dialog BoxUse this dialog box to select a storage location for Raster Design temporaryswap files.
Standard Windows controls across the top of the dialog and down the leftside provide several ways to navigate to a storage location on local networksor the Web.
Look In
Displays the current storage location. Click the arrow to select a differentlocation on a local or network drive.
370 | Appendix B Raster Design Dialog Boxes

Text Recognition Setup Dialog BoxUse this dialog box to configure the settings for text recognition operations.
INPUT
Text Format
Machine Printed
Specifies if the text to recognize was created by a computer or other machine.
Hand Printed
Specifies if the text to recognize was created by hand.
Selection Shape
Specifies the shape you use to outline the text for recognition, eitherrectangular or polygonal. The shape you choose also defines the area that iserased when you place the new text in the drawing.
Dictionaries
Spelling
Activates spell check during the recognition process.
Spelling Language
Specify a language to use when checking spelling during the recognitionprocess.
AutoCAD Custom
Specifies using the current AutoCAD user dictionary in the recognitionprocess. You can use a combination of the language dictionary and thecurrent AutoCAD custom dictionary, or they can be used independently.
Language Character Set
Specifies the character set(s) to use during the recognition process. Acharacter set is a group of 256 characters used by a specific language.
NOTE You can select multiple character sets, but each additional character setincreases the number of possible characters the recognition engine searches for.Doing this slows the recognition process and increases the possibility of errors.
Recognize
Specifies the types of text that the text recognition engine must recognize inthe current passage: one or more of Uppercase, Lowercase, Numbers,
Text Recognition Setup Dialog Box | 371

Punctuation, and Miscellaneous. If you clear a check box, the recognitionengine does not attempt to display characters of that class.
AUTOCAD OUTPUT
Output Type
The first two settings specify whether the new text is created as regularAutoCAD text or multiline text (Mtext). The Recognize Table operation placesall recognized text in the drawing as AutoCAD text.
AutoCAD Style
Specifies an AutoCAD style for the text entity. By default the AutoCAD stylereflects the last style used with the Recognize Text or Recognize Tableoperation.
Text Height
Automatic
Specifies that the text entity height will be close to the original raster textheight.
Style Height
Specifies that the text entity height is defined by the AutoCAD text style.
Specified Height
Specifies a text height. The value you enter for the specified height is appliedto all text entities for the session or until you specify a new height.
Removal Method
None
Displays the vector text over the original text.
Rub
Removes the original text in the drawing and replaces it with the new vectortext.
VERIFICATION DISPLAY
Specifies whether bold, italic, and underlined formatting in the recognizedtext is displayed in the Verify Text or Verify Table window. Selected formatsare ignored in the display. For example, if the area of text you are workingwith has Italic formatting that you want the recognition engine to ignore,then select the Italic check box.
372 | Appendix B Raster Design Dialog Boxes

NOTE By default Italic and Underline are selected, but not Bold, because therecognition engine tends to incorrectly recognize text in engineering drawings asbold. Formatting options are also available in the Verify Text or Verify Table window.
Enable Verifier
If selected, displays the original raster text in a small window above the textthat is being verified in Edit pane of the Verify Text window. Click in theVerifier window to close it.
Reset
Restores the default values in the Text Recognition Setup dialog box.
Related procedures:
■ Entering Settings for Text Recognition (page 230)
Transparency Color Dialog BoxUse this dialog box to change the transparency color for a grayscale or colorimage.
Click Select, then click the color in the image that you want to designate asthe new transparency color (page 399).
Related procedures:
■ Transparency Color of an Image (page 62)
■ Unused Color for Transparent Color (page 63)
Vector Separation Options Dialog BoxUse this dialog box to control how vectorization tools assign line widths andlayers to vectors as they are created.
You can access the Vector Separation dialog box from the VTools General tabof the Raster Design Options dialog box.
General Tab (Vector Separation Options Dialog Box)Use this tab to automatically assign layer and polyline width values to thevectors created by vectorization tools based on the pixel width of the
Transparency Color Dialog Box | 373

underlying raster. For more information, see General Vector Separation Options(page 249).
Width Table
Use Width Table
Assigns layer and polyline width values to vectors based on the width ofthe underlying raster.
Insert Below
Inserts a new row below the selected row in the Width Table.
Insert Above
Inserts a new row above the selected row in the Width Table.
Delete
Deletes the selected row in the Width Table.
Query Width
Displays the width of an entity you select in pixels and AutoCAD units.
Non-Continuous Entities
Override Width Table For Non-Continuous Entities
Overrides the Width Table and assign default values to non-continuouslines.
Layer
Assigns a default layer value to non-continuous lines.
Polyline Width
Assigns a default polyline width value to non-continuous lines.
Default
Layer
Assigns a default layer value to entities that do not fall into ranges specifiedin the Width Table.
Polyline Width
Specifies a default polyline width value to entities that do not fall intoranges specified in the Width Table.
Import
Imports vector separation settings. Vector separation files have a .vsextension.
374 | Appendix B Raster Design Dialog Boxes

Export
Exports vector separation settings. Vector separation files have a .vsextension.
Save As Default
Assigns the current vector separation settings the default values. TheDefault.vs file is stored in your CO2000I folder if Raster Design is installedlocally. If Raster Design is installed as a network deployment, the Default.vsfile is stored in your local config folder.
Contour Tab (Vector Separation Options Dialog Box)Use this tab to automatically assign layer and polyline width values to thevectors created by vectorization tools based on their elevation. For moreinformation, see Contour Vector Separation Options (page 244).
Separate Contours By Elevation
Assigns layer and polyline width values to contours based on their elevation.
Interval Separation Information
Use AutoCAD Land Development Desktop's Settings
Uses the settings in AutoCAD Land Development Desktop for minor andmajor layers and intervals.
Minor
Interval
Specifies the elevation interval for minor contours. Raster Design willautomatically assign vector contours whose elevation is a multiple of thisvalue to the layer and polyline width that you specify.
Layer
Specifies a default layer for minor contours.
Polyline Width
Specifies a default polyline width for minor contours.
Major
Interval
Specifies the elevation interval for major contours. Raster Design willautomatically assign vector contours whose elevation is a multiple of thisvalue to the layer and polyline width that you specify.
Contour Tab (Vector Separation Options Dialog Box) | 375

Layer
Specifies a default layer for major contours.
Polyline Width
Specifies a default polyline width for major contours.
Import
Imports vector separation settings. Vector separation files have a .vsextension.
Export
Exports vector separation settings. Vector separation files have a .vsextension.
Save As Default
Makes the current vector separation settings the default values. TheDefault.vs file is stored in your CO2000I folder if Raster Design is installedlocally. If Raster Design is installed as a network deployment, the Default.vsfile is stored in your local config folder.
Verify Text/Table Dialog BoxUse this dialog box in text recognition operations to examine the source textand control the format of the output text. The dialog is called Verify Text orVerify Table, depending on which option was selected.
Viewer Pane Controls
Zooms in so the text fills the width of the view window and there is nohorizontal scroll bar.
Zooms in so the text fills the height of the view window and there is novertical scroll bar.
Zooms in so the text is completely contained in the corresponding pane atthe greatest zoom possible.
376 | Appendix B Raster Design Dialog Boxes
Zooms in to expand the recognized raster text in the pane by a factor of25%. The text may be zoomed in to a maximum factor of 300%.
Zooms out to shrink the recognized raster text in the pane by a factor of25%. The raster may be zoomed out to a maximum factor of 25%.
Prints the data from the pane.
Editor Pane Controls
Zooms in so the text fills the width of the view window and there is nohorizontal scroll bar.
Zooms in so the text fills the height of the pane and there is no verticalscroll bar.
Zooms in so the text is completely contained in the pane at the greatestzoom possible.
Zooms in to expand the recognized raster text in the pane by a factor of25%. The text may be zoomed in to a maximum factor of 300%.
Zooms out to shrink the recognized raster text in the pane by a factor of25%. The raster may be zoomed out to a maximum factor of 25%.
Applies bold formatting to the selected text in the Editor pane.
Verify Text/Table Dialog Box | 377

Applies italic formatting to the selected text in the Editor pane.
Applies underline formatting to the selected text in the Editor pane.
Specifies the display of non-printing characters such as Tab and Space.
Reverses the last editing action.
Prints the data from the pane.
Recognition and Output Controls
Suspect Word
Displays the unrecognized word.
Rejected Character
Displays unrecognized characters or artifacts.
Change To
Specifies a replacement for the suspect word or rejected character from thedrop-down list.
Find Next
Moves to the next suspect word or rejected character.
Replace
Replaces the suspect word or rejected character with the selection in theChange To box.
Add To Dictionary
Adds the suspect word or rejected character to the to the Recognitiondictionary.
AutoCAD Style
Specifies an AutoCAD style.
378 | Appendix B Raster Design Dialog Boxes

Output To
Specifies the conversion of the raster text as either AutoCAD Text orAutoCAD MText.
Justify
Specifies the text alignment as right, left, or center.
Setup
Displays the Text Recognition Setup dialog box.
Export
Exports the text in the Edit pane for use in another application.
Related procedures:
■ Using the Verify Text Window (page 234)
VText Edit Dialog BoxUse this dialog box to enter and edit vector text.
Type the text string to be added, then press OK to insert it at the point youpreviously specified.
To edit existing vector text in the drawing, double-click the text. It appearsin this dialog box, where you can change it as required.
VText Edit Dialog Box | 379

380
Glossary
3-point affine transform A type of coordinate transformation that can beapplied to images upon insertion. This option replicates the transform usedon non-editable data types. This type of transform is a translate, rotate,independent x-y scale transform without sheer.
4-point rubbersheet transform A type of coordinate transformation that canbe applied to images upon insertion. This option provides an approximatetransformation that is most accurate in the vicinity of the reference points,but contains some distortion in other regions of the image.
access key The key that corresponds to an underlined letter on a menu,command, or dialog box.
active path The location from which the current image file is actually beingloaded. It can be a local path, a network path, or an Internet address.
Always Detach An option in the Raster Design Options dialog box. If youerase the image frames, this option automatically detaches the images.
aperture The square region, centered on the cursor crosshairs, where entityselection can occur when raster snap mode is active; also known as the snapwindow. You can also specify minimum and maximum pixel widths to snapto. See also snap window.
apparent intersection The point where two entities would intersect if one,or both, were extended.
aspect ratio The ratio of an image height to its width. See also bias.
attach When you insert an image into a frame, the image is attached to thedrawing. You can use the AutoCAD IMAGEATTACH command to attach animage, or you can use the ProdNameShort iinsert command to attach animage. Attaching and inserting refer to the same process.
AutoInsert A ProdNameShort option for automatically inserting images in adrawing created with CAD Overlay ESP or GSX, which are earlier versions ofProdNameShort.
Glossary | 381

AutoReplace A ProdNameShort option that replaces the image path of apreviously inserted image by matching the drawing name.
Autorub A ProdNameShort command that removes raster objects as you tracethem with the vectorization tools. This option uses the Rub/Crop line widthto determine the width of the raster that is removed.
base point A point used for relative distance and angle when moving, copying,or rotating objects. Example: On the image, select the base point that youwant to move to the destination point.
bias The ratio of image width to image height, also called aspect ratio. Youcan change the bias of an image by using the ProdNameShort ibias command.
bicubic A pixel resampling method that computes the value for a new pixelbased on interpolation of the values in a 4x4 block of surrounding pixels. Thismethod provides a good compromise between accuracy and speed for mostimages.
bilinear A pixel resampling method that computes the value for a new pixelbased on linear interpolation of the values in a 2x2 block of surroundingpixels.
binary image See bitonal image.
bitmap (BMP) An image format. It can be compressed or uncompressed.Uncompressed BMP files contain raw data on a boundary of 4 bytes per raster.Compressed files are similar to the run length encoded PCX files, with minorvariations. Only 4- and 8-bit files can be compressed.
bitonal image A two-color, 1-bit image, usually a line drawing such as afloorplan or parcel map. This image type is also called binary. The backgroundcolor of a bitonal image can be transparent or solid. The foreground color canbe any color.
blank distance The distance between dashes in a dashed line.
blurring In ProdNameShort, a method for evenly weighing all pixels in thekernel, including the target. This filter, while similar to Low Pass #2, givesslightly brighter results.
blurring artifacts A loss of image detail that can occur with image compressionand resampling techniques. The symptoms include excessive smoothnesswhere different colors meet, color bleeding, and a loss of color texture.
boundary See frame, image frame.
382 | Glossary
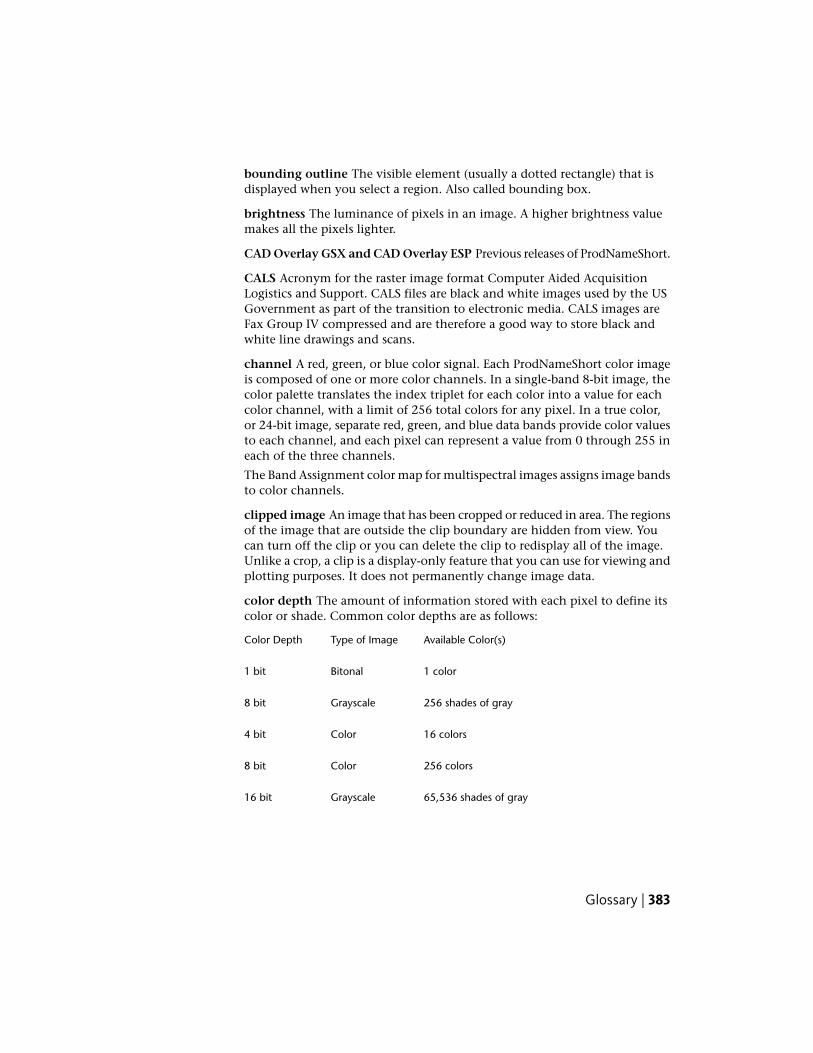
bounding outline The visible element (usually a dotted rectangle) that isdisplayed when you select a region. Also called bounding box.
brightness The luminance of pixels in an image. A higher brightness valuemakes all the pixels lighter.
CAD Overlay GSX and CAD Overlay ESP Previous releases of ProdNameShort.
CALS Acronym for the raster image format Computer Aided AcquisitionLogistics and Support. CALS files are black and white images used by the USGovernment as part of the transition to electronic media. CALS images areFax Group IV compressed and are therefore a good way to store black andwhite line drawings and scans.
channel A red, green, or blue color signal. Each ProdNameShort color imageis composed of one or more color channels. In a single-band 8-bit image, thecolor palette translates the index triplet for each color into a value for eachcolor channel, with a limit of 256 total colors for any pixel. In a true color,or 24-bit image, separate red, green, and blue data bands provide color valuesto each channel, and each pixel can represent a value from 0 through 255 ineach of the three channels.
The Band Assignment color map for multispectral images assigns image bandsto color channels.
clipped image An image that has been cropped or reduced in area. The regionsof the image that are outside the clip boundary are hidden from view. Youcan turn off the clip or you can delete the clip to redisplay all of the image.Unlike a crop, a clip is a display-only feature that you can use for viewing andplotting purposes. It does not permanently change image data.
color depth The amount of information stored with each pixel to define itscolor or shade. Common color depths are as follows:
Available Color(s)Type of ImageColor Depth
1 colorBitonal1 bit
256 shades of grayGrayscale8 bit
16 colorsColor4 bit
256 colorsColor8 bit
65,536 shades of grayGrayscale16 bit
Glossary | 383
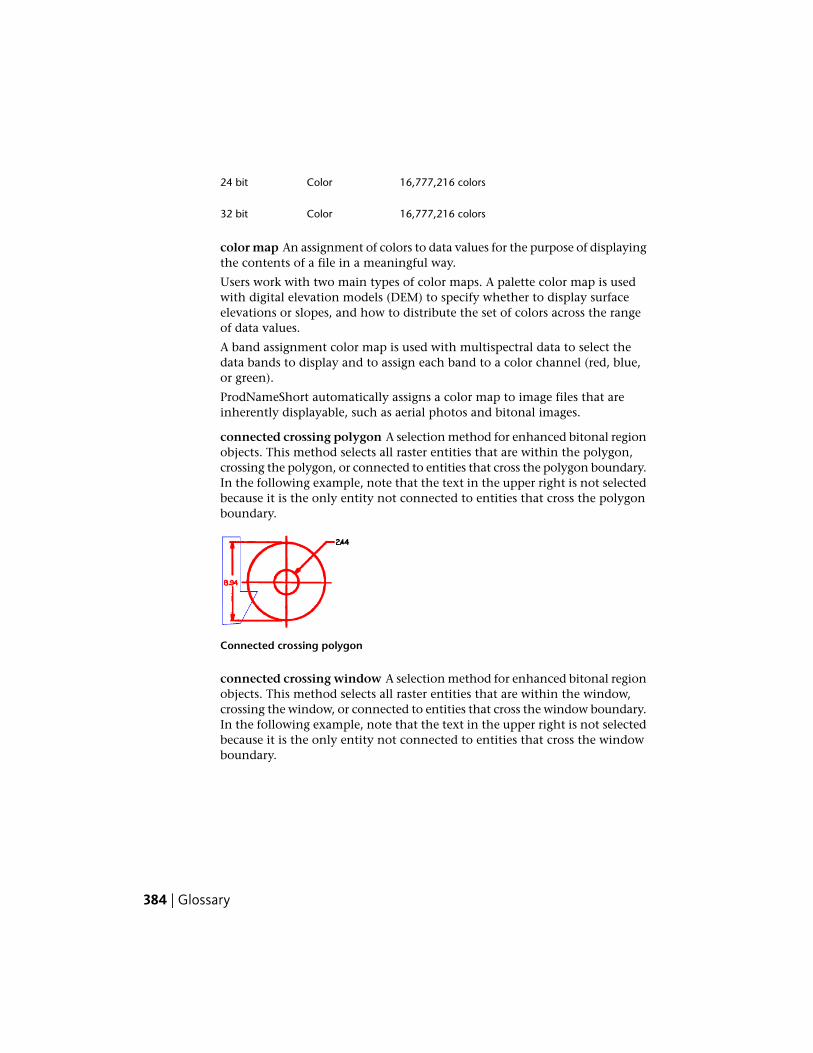
16,777,216 colorsColor24 bit
16,777,216 colorsColor32 bit
color map An assignment of colors to data values for the purpose of displayingthe contents of a file in a meaningful way.
Users work with two main types of color maps. A palette color map is usedwith digital elevation models (DEM) to specify whether to display surfaceelevations or slopes, and how to distribute the set of colors across the rangeof data values.
A band assignment color map is used with multispectral data to select thedata bands to display and to assign each band to a color channel (red, blue,or green).
ProdNameShort automatically assigns a color map to image files that areinherently displayable, such as aerial photos and bitonal images.
connected crossing polygon A selection method for enhanced bitonal regionobjects. This method selects all raster entities that are within the polygon,crossing the polygon, or connected to entities that cross the polygon boundary.In the following example, note that the text in the upper right is not selectedbecause it is the only entity not connected to entities that cross the polygonboundary.
Connected crossing polygon
connected crossing window A selection method for enhanced bitonal regionobjects. This method selects all raster entities that are within the window,crossing the window, or connected to entities that cross the window boundary.In the following example, note that the text in the upper right is not selectedbecause it is the only entity not connected to entities that cross the windowboundary.
384 | Glossary

Connected crossing window
connected entity 1. An entity that is connected to an entity that is selectedor otherwise referenced.
2. A selection method for enhanced bitonal region objects. This method selectsa specified entity and all other entities connected to it. In the followingexample, note that a single click on the arrow in the upper right selects theentire connected structure except the two text entities, which are notconnected to any other entity.
Connected entity
connected fence A selection method for enhanced bitonal region objects.This method selects all raster entities that are connected to an entity thattouches the selection line (fence) you draw. Entities enclosed by the fence butnot touching it are not selected. In the following example, the two text blocksare not selected because they do not touch the fence and are not connectedto any entities that touch the fence.
Connected fence
Glossary | 385

connected window A selection method for enhanced bitonal region objects.This method selects only those raster entities that are entirely within thewindow you define and are not connected to any entity that extends outsidethe window. In the following example, note that the arrows are not selectedbecause they are connected to lines that extend outside the window.
Connected window
connected window polygon A selection method for enhanced bitonal regionobjects. This method selects only those raster entities that are entirely withinthe polygon you define and are not connected to any entity that extendsoutside the polygon. In the following example, note that the arrows are notselected because they are connected to lines that extend outside the polygon.
Connected window polygon
continuous tone A shaded image, sometimes called halftone in traditionalprinting.
convolve filter A type of image processing filter that can be used with grayscaleimages for various operations, such as smoothing or sharpening the imagedetails.
copylast An option that is available when vectorizing text. It displays theVText Edit dialog box, which contains the last text string you placed in thedrawing. You can edit the text string if needed, and then click OK and pickan insertion point for the copy.
correlate The process of positioning an image within the AutoCAD coordinatesystem so that the image dimensions and coordinates match AutoCAD unitsand coordinates.
386 | Glossary

crop A selected area of a raster image. Pixel data outside the crop is deleted.The image frame size is adjusted automatically. A crop permanently alters animage.
data organization The method of organizing the image data when the imageis saved. The data organization can be stripped, tiled, or monolithic.
datum A reference point, line, or surface.
decrement To decrease by one.
DEM Digital elevation model. A format for recording land elevations in adigital file. A regular grid of survey points is created over the surface, and theelevation of each point is recorded as a floating-point number.
density The number of dots per linear unit at which an image is scanned orcreated. The more dots per unit, the higher the density and clarity of detail.Also called resolution or pixel density. See also DPI.
density units The linear units on which the image density is based. Example:Inches are the density units of an image that was scanned at 300 dots perinch.
density value The number of dots per unit that make up the image density.Example: An image scanned at 300 dots per inch has a density value of 300.
deskew To rotate a raster image, usually for the purpose of aligning itorthogonally with the AutoCAD coordinate system.
destination point The location to which you move an image. To move animage, you must pick a source point and a destination point.
detach To completely remove an image from a drawing. To reverse a detachoperation, you must insert the image from its source. Operations similar todetach but less permanent are erase, unload, and hide.
displace To move an image from a source point to a destination point.
display The visual output device and its technology, such as a CRT-baseddisplay, a flat-panel display, or the graphics portion of your monitor.
display order The order in which images are displayed in AutoCAD. Thissequence determines which images are above or below other images, andaffects image visibility.
dither The process of using a pattern of solid dots to simulate more colorsthan are actually available.
donut A circle with a specified linewidth.
Glossary | 387

DOQ Digital orthophoto quadrangle raster image format, used for aerial photosthat are processed to remove distortion. A typical DOQ represents one quarterof a USGS topographic map at 1:24 000 scale.
DPI Dots per inch. A measure of image density. See also resolution, density,PPI.
Draft An option in the Raster Design Options dialog box that does not ditherthe pixels. This setting is recommended for bitonal images.
drawing image A raster file of a drawing, a photograph, a map, or a satelliteimage that you can edit, manipulate, and manage using ProdNameShort.
drawing unit The unit on which an AutoCAD drawing is based. Example: Acommon Imperial drawing unit is inches. A common Metric drawing unit ismeters.
DTED Digital Terrain Elevation Data. A grid-based file of elevation points.This format was developed by the U.S. National Imagery and Mapping Agency(NIMA).
ECW Enhanced Compressed Wavelet. A highly-compressed multiresolutionimage format from ER Mapper, Inc.
edge enhancement filters Filters that improve the quality of an image byextracting individual elements, such as boundaries and property lines. Youcan also use these filters for object extraction or object recognition byhigher-level algorithms.
EISA Extended Industry Standard Architecture
embed To store a raster image in a drawing, rather than as a file external tothe drawing. Embedded images can be viewed in an AutoCAD-basedapplication only if the application is installed with AutoCAD Raster Designor the Object Enabler for AutoCAD Raster Design.
Enable Mask A ProdNameShort option on the Image Mask Properties tab thatenables an existing mask for display. Enabling allows you to view the imageclip as defined by the image mask.
encoding Compression method that is applied to an image when the imageis saved. An encoding method can compress the image file to save disk space.
enhanced bitonal region object A type of raster entity manipulation (REM)object that includes several lines, arcs, or circles within a bitonal raster image.For illustrated definitions of the types of enhanced bitonal region objects, see“connected” and “smart” in this Glossary.
388 | Glossary
equalization A function that brings out details in an image. Equalizationchanges the darkest pixels in an image to black and the lightest pixels to white,then reassigns the remaining pixels to use all of the colors in between. Alsocalled non-linear contrast stretch.
erase To remove an image insertion from a drawing. This operation removesthe image and frame from the drawing, removes the insertion object and itscolor map from the toolspace, but leaves an unreferenced data definition inthe image data view. The color map is not erased from the image data view ifit is used by other insertions. To reverse an erase operation, do a new insertionfrom the data definition object. Whether an erased image is also detacheddepends on how the Image Detach Options are set on the User Preferencestab of the Raster Design Options dialog box. See also detach.
ESRI Grid An image format used in ESRI GIS products. This format is availablein ASCII and binary versions.
Export A ProdNameShort operation for saving an image to another file formatand writing out correlation data for the image. The correlation data storesinsertion point, scale, rotation, and density information for the image. Whenyou export an image, you can save the correlation data to a resource file, aworld file, or to the image file. The type of correlation data you can createdepends on the type of image being exported.
fillet A rounded corner where two lines meet. ProdNameShort can apply filletsof specified radius to line intersections in bitonal images.
filter An editing tool that can be used to adjust the appearance of an image.Example: The Invert filter reverses light and dark areas on an image. Alsocalled editing filter.
FLIC Acronym for the image format Animator FLIC.
follower A vectorization tool that traces raster lines in a bitonal image andcreates vectors that AutoCAD recognizes as individual objects.
foreground color The color of the raster objects in a bitonal image. The othercolor in the image is the background color.
frame A rectangular vector object that encloses an image. You can select theimage frame by clicking it, or by using any AutoCAD selection method. Theimage frame is an AutoCAD object that you can assign to a layer, reposition,or scale, using standard AutoCAD methods. A frame can become an irregularshape if the image is cropped or clipped. See also image frame.
freq value In a histogram image, the frequency value of a color or shade ofgray: the number of pixels that use the indicated tone.
Glossary | 389

Gap Width A setting that defines the maximum gap (from 0 to 10 pixels) thatProdNameShort can ignore as it follows a raster line, polyline, or contour.ProdNameShort ignores any gap that is equal to or smaller than the GapWidth. This setting is useful for scanned images that have many disconnectedraster lines or in which pixels are missing as a result of imperfect scans.
geo-referenced image An image that references real-world coordinates in itscorrelation source. Example: Geo-referenced images include GeoSPOT, GeoTIFF,and images that use world files as their correlation source.
GeoSPOT An image format from SPOT Image Corporation that supportsgeoreferencing information.
GeoTIFF A type of tagged image file format (TIFF) that supports geo-referencinginformation.
GIF Graphics Interchange Format. A raster image format created byCompuserve.
GIS (Geographic Information Systems) Computerized decision supportsystems that integrate spatially referenced data. These systems capture, store,retrieve, analyze, and display such data.
global coordinate system A method for defining points on the earth in aCartesian coordinate system, taking into account the curvature of the earth'ssurface.
gradient directional edge enhancement filters Filters that improve thequality of the line where an object begins or ends by extracting individualelements. These filters use the vector sum of the three coordinate variables X,Y, and Z, taking into account their direction in space. You can use the gradientdirectional edge enhancements filters in any one of the eight compassdirections. Use of these filters results in a black background with white outlinesof the objects in the image.
grayscale image An image usually created by a scanner in which continuoustones are represented as uniform shades of gray. Each pixel uses eight bits ofinformation, producing 256 shades of gray.
grip(s) Small boxes displayed at various points on a selected object that canbe used to edit the object. Select a grip and then specify a grip editing function.
hide To remove an image from the display while retaining it in active memory.The image frame remains visible. To reverse a hide operation, select the imageframe or the toolspace object, then right-click and select Show. See also detach.
high pass filters A means for enhancing the edges of images. Images that donot appear clear may also be sharpened by high pass filtering.
390 | Glossary

histogram A bar graph that shows the number of pixels for each color in theselected image or images. An aid for image editing operations.
hybrid A type of drawing that includes both raster and vector data.
IG4 Acronym for the image format Group 4 data with IST headers.
IGS Acronym for the image format Image Systems Gray Scale.
image A graphic that is composed of raster data. See also drawing image.
image format The method in which an image was created and saved, suchas bitmap, CALS, RLC, or GIF. Some image formats, such as PICT, are read-only.
image frame A frame that encloses each image you insert (also called aboundary). If you select an image frame, grips appear and hatch marks aredrawn over the image to indicate that you have selected it. See also frame.
Image Properties The properties of color, layer, and frame linetype settingsof each image.
image selection A collection of data treated by ProdNameShort as a unit.Example: When you select an image by clicking its frame, the image movesto the top of the display order, obscuring any vectors that intersect with it.
image unit The unit at which an image was scanned or created. Example: Ifyou scan an image at 300 dots per inch, the image unit is inches.
Index Color (8-bit) An image type that contains up to 256 colors.
index value The numeric identifier (0 to 255) of a color or shade of gray.These values are used in the Histogram and the Palette Manager.
invert A filter used to reverse position, order, or relationship. Example: Youcan invert the image to create a positive image. Use the Invert filter to reversethe dark and light areas of an image.
JFIF - JPEG Acronyms for image formats created by Joint Photographics ExpertGroup. JFIF is JPEG File Interchange Format. It uses a compression schemethat gives preference to compression rather than data preservation. Best suitedfor 24 bit images.
JPEG 2000 An advanced raster image format from Joint Photographics ExpertGroup, featuring options for lossless compression, wavelet compression,incremental decompression, and support for up to 48-bit color.
Lanczos A pixel resampling method that computes the value for a new pixelby interpolating the value of a 6x6 block of surrounding pixels.
Glossary | 391

Landsat FAST L7A A multispectral image format used by Landsat 7 satellite,which was launched in 1999.
layout Management of images, to determine how they are displayed and inwhat order they are listed in the Image Management dialog box.
linetype The display style of a line, such as continuous or dashed.
low pass filter A means of extracting individual elements in areas where pixelintensities change rapidly, thereby reducing high-frequency detail. The effectis a slightly blurred image.
LZW A file compression algorithm, commonly used with TIFF and GIF files.
Maintain Drawing Link A ProdNameShort export option that, if selected,overrides the image you selected to export.
mask An object used to display and plot a subset of the images in yourdrawing. A mask clips the images inside the mask boundary and hides orunloads the images completely outside the mask boundary. The mask boundaryis an AutoCAD object that you can move, stretch, scale, and erase, like anyother AutoCAD object.
median filter A convolving filter that removes random visual speckles froman image by changing each pixel value to match the average value of theneighboring pixels.
merge commands ProdNameShort commands used to merge images, mergevectors into raster images, and select raster pen widths.
merge images To group two or more images into a single image file.
mirror To create a new version of an existing object by reflecting it in relationto a line or plane. Example: Scanning software might mirror a drawing, oryou might scan the back of a drawing by mistake. You can correct theseproblems by mirroring the image.
Mitchell A pixel resampling method that uses a cubic spline technique. It iswidely considered to provide a good compromise between ringing and blurringartifacts on most images. See also blurring artifacts, ringing artifacts.
monolithic Encoding method for TIFF files. Saves image data in one piece,and may result in slower processing time. See also data organization.
multiframe image data An image type that includes multiple related imageswithin a single file. Each image is in a separate frame, and the images areusually related. For example, they could represent a series of drawings, pagesfrom a document, an animation sequence.
392 | Glossary

Or they could represent a multispectral image set. Common multiframe fileformats include GeoTIFF and NITF.
multispectral image data Data recorded in the form of multiple bands. Eachband records the values in a specific range of the spectrum, such as infrared,visible, or ultraviolet. Data gathered by satellites is typically provided inmultispectral format. A band assignment color map is used to create false colorimages from these bands. The color map can be configured to highlight surfacefeatures, such as vegetation and water.
native capture Copies a REM object using the image data directly from theimage file, ignoring display scale and rotation of objects. Used only for theREM Copy To Clipboard command.
nearest neighbor A pixel resampling method that assigns to a new pixel thevalue of the closest pixel in the original image. This is the fastest resamplingmethod, but it produces the crudest results.
Never Detach An option in the Raster Design Options dialog box that doesnot detach an image even if all image frames that reference the image areerased from the drawing.
NITF National Imaging Transmission Format. This multiframe image formatis commonly used by US federal agencies and NATO.
node In v, a link end point that can be represented as a block or point object.Example: You can force the line follower to ignore the intermediate nodesand draw a single straight line between the start and end points of a line.
noise Random pixels that can result from poorly scanned images.
non-georeferenced image An image that does not include real-worldcoordinate information.
non-linear contrast stretch See equalization.
non-orthogonal image A graphic representation that intersects or lies atangles other than right angles. Also called non-ortho image.
ortho-corrected image An image that is corrected so all pixels represent theirtrue locations on the face of the earth, making directions and distancesaccurate. Errors resulting from parallax, lens distortion, and other causes arecorrected.
orthogonal Intersecting or lying at right angles (0, 90, 180, or 270 degrees).
palette The range of up to 256 colors used in an 8-bit image.
Glossary | 393

parallax The apparent displacement of position of an object, caused by a shiftin the point of observation.
PCX A simple run-length encoded image format.
Pick < A ProdNameShort device for selecting points on the screen.
PICT An image format created by Apple Computer.
pixel A single dot on the screen. Pixels are the building blocks of raster images,and are individually assigned different colors or shades of gray. Image pixelsize varies depending on the resolution of the image. A 2X2 pixel in a 400 dpiimage is one quarter the area of a 2X2 pixel in a 200 dpi image.
pixel size Image density expressed as the area of a pixel, typically used withaerial photography and satellite imagery.
PNG Portable Network Graphics. A raster image format.
positive image An image in which the light and shade areas correspond tothe original image.
PPI Pixels per inch. Also called dpi, or dots per inch. See also DPI.
projection Data devised by cartographers and mathematicians to depictthree-dimensional shapes (like the earth) on two-dimensional surfaces withknown distortion.
quad sheet A device for reducing image file size. Many maps are broken upinto quadrants, which are square and are called quad sheets. When a groupof quad sheets is inserted into a drawing, the drawing is considered to be tiled.
QuickBird TIFF A multispectral image format produced by DigitalGlobe fromits QuickBird satellite.
raster data A series of dots, or pixels that form an image. This type of data isproduced when you scan a paper drawing, a blueprint, or a photograph. Araster image is composed of pixels.
raster entity A series of contiguous pixels that form a single entity such as aline, rectangle, or circle. ProdNameShort can recognize such entities and createvector entities or regions that can be more easily edited than the rasteroriginals.
raster entity manipulation (REM) An object-oriented method of editingraster entities in bitonal, color, and grayscale images. REM handles rasterentities much like vector objects. There are three types of REM objects: regionobjects, enhanced bitonal region objects, and primitive objects.
394 | Glossary
raster impact point The point where a vector polyline intersects a rasterentity.
raster object A distinct line, circle, or arc in a bitonal raster image. Rasterobjects can be vectorized or edited using raster entity manipulation.
raster pen A ProdNameShort tool that allows thickening of vector objectswhen you merge them into the image. Thicknesses are assigned according tothe specified entity color.
raster snap A setting that automatically places the cursor at the end, center,corner, intersection, or edge points on a bitonal raster entity. If you choosemore than one snap mode, then the crosshairs snap to the closest of thepossible snap points.
resolution The number of dots per unit at which an image is scanned orcreated. Example: An image scanned at 600 dots/inch (dpi) has a higherresolution than one scanned at 300 dpi.
resource file A file used by ProdNameShort to store image correlation datasuch as insertion point location, scale, and rotation. Resource files have a .resextension. They can be created by the Export command and can be read onlyby ProdNameShort. See also world file.
RFT Revisable form text.
RGB Red-green-blue color channels.
ringing artifacts A loss of image detail that can occur with image compressionand resampling techniques. The symptoms include ripples or similarinterference along edges where two dissimilar colors meet. The sharpness ofthe edges is degraded.
RLC Run-Length Coding raster image format. ProdNameShort can read RLC1and RLC2. RLC 1 is a plain RLC with no header. RLC2 is an RLC1 with ISTheaders. See also run-length coding.
RLC2 Run-Length Coding raster image format with IST headers. See alsorun-length coding.
rotation angle The angle at which an image is being revolved about its axis.
RTF Rich text format
rub To remove a line or area from an image with a ProdNameShort Rubcommand (e.g., irubline, irubarc). A rub changes the pixels in a selected areato the transparency color. When transparency is turned on for the image, therubbed area becomes transparent. Rub permanently alters your image.
Glossary | 395

rubbersheet To match points in an image to known reference points in acoordinate system by warping the image using a triangular or polynomialtransformation.
run-length coding A data compression method that replaces a run or sequenceof identical data units (such as pixels) with a single unit and the length of therun.
saved path The image file name saved in the drawing. It can be a simple filename, a local path, a network path, or an Internet address.
scale The defined dimensional relationship between units of linearmeasurement on the earth’s surface and those on a map or aerial photo.
scaling A method of proportionally changing the size of a raster image inreference to existing raster or vector entities without rotating it.
shading The use of marking made within outlines to suggestthree-dimensionality, shadow, or degrees of light and dark in a picture ordrawing. Example: You can use the sharpening filters on grayscale images tomake differences in shading more distinct. It may be necessary to usesharpening filters to extract the highest amount of useful data from a low-resolution scan.
sharpening filters A device for enhancing details in images. Sharpening filters,with the exception of the matched filters, use spatial filtering with a 3x3-pixelkernel.
Show Image Frame(s) An option on the Image Mask tab of the Raster DesignOptions dialog box. Shows the frames of the images that are hidden orunloaded.
SID (MrSID) Multiresolution Seamless Image Database. A highly-compressedimage format from LizardTech, Inc.
Single Image Optimization A ProdNameShort feature that automaticallyselects your image when you run a ProdNameShort command that requiresan image to be selected. You are prompted to select an image only if you areworking with multiple images.
smart crossing polygon A selection method for enhanced bitonal regionobjects. This method selects all raster entities that lie within or cross into thepolygon you draw. If any part of the entity crosses the polygon boundary, theentire entity is selected. In the following example, note that the horizontallines and the circle are selected because they cross the polygon boundary.
396 | Glossary

Smart crossing polygon
smart crossing window A selection method for enhanced bitonal regionobjects. This method selects all raster entities that lie within or cross into therectangular window that you draw. If any part of the entity crosses the windowboundary, the entire entity is selected. In the following example, note thattwo horizontal lines that cross the window boundary are selected.
Smart crossing window
smart fence A selection method for enhanced bitonal region objects. Thismethod selects all raster entities that touch a selection polyline (fence) thatyou draw. Entities enclosed by the fence but not touching it are not selected.In the following example, the text 8.94 is not selected because it does nottouch the fence.
Smart fence
smart window A selection method for enhanced bitonal region objects. Thismethod selects only the raster entities that lie entirely within the rectangularselection window. In the following example, the arrow and number within
Glossary | 397
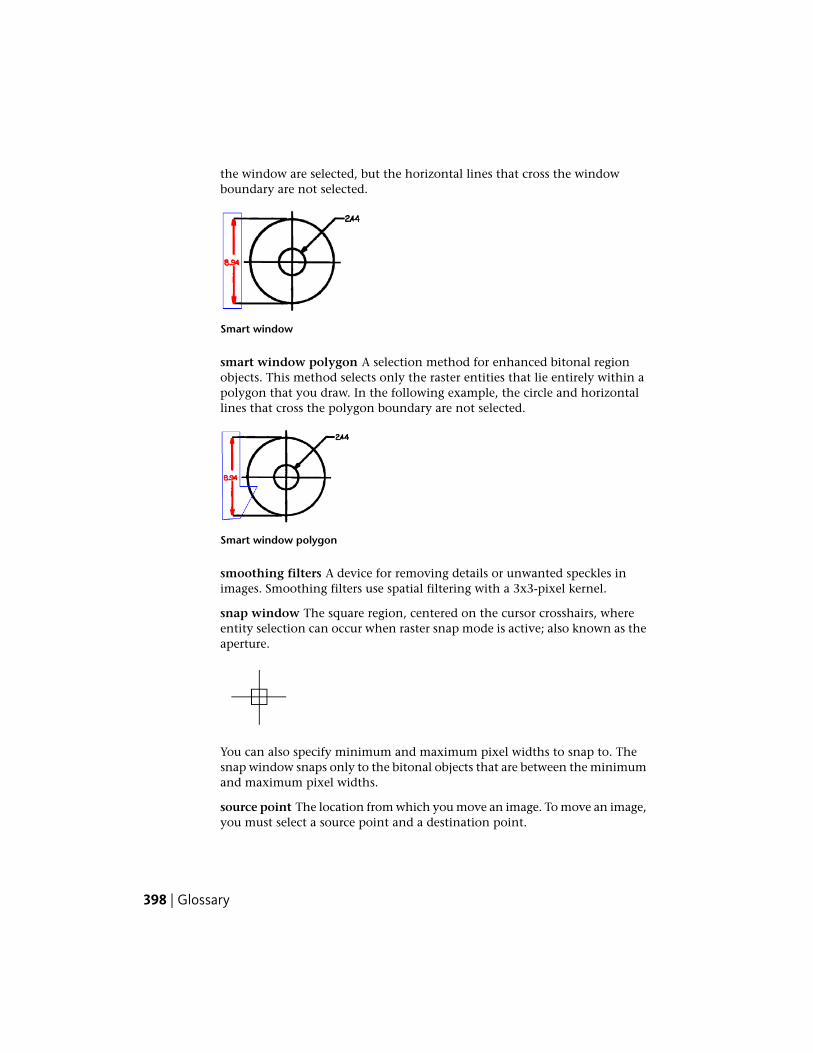
the window are selected, but the horizontal lines that cross the windowboundary are not selected.
Smart window
smart window polygon A selection method for enhanced bitonal regionobjects. This method selects only the raster entities that lie entirely within apolygon that you draw. In the following example, the circle and horizontallines that cross the polygon boundary are not selected.
Smart window polygon
smoothing filters A device for removing details or unwanted speckles inimages. Smoothing filters use spatial filtering with a 3x3-pixel kernel.
snap window The square region, centered on the cursor crosshairs, whereentity selection can occur when raster snap mode is active; also known as theaperture.
You can also specify minimum and maximum pixel widths to snap to. Thesnap window snaps only to the bitonal objects that are between the minimumand maximum pixel widths.
source point The location from which you move an image. To move an image,you must select a source point and a destination point.
398 | Glossary
spatial resolution Image density expressed in pixels per unit, typically usedwith scanned images.
speckle An unwanted random spot in an image. Speckles or stray pixels canoften appear in an image when you scan drawings or blueprints that are dirtyor wrinkled. You can remove speckles from your bitonal images by using theDespeckle filter.
stripped Encoding method for TIFF files. Breaks up image data into strips forquicker processing. See also data organization.
supported image types ProdNameShort supports bitonal, grayscale, and upto 24-bit color images, along with digital elevation models (DEM), multispectralimagery, and generic integer data in 16- and 32-bit format.
supported image types ProdNameShort supports bitonal, grayscale, and upto 24-bit color images, and generic integer data in 16- and 32-bit format.
TARGA A raster image format created by Truevision Inc. Usually 16-bit or24-bit true color. Can be 8-bit grayscale or simple run-length coded.
Threshold A ProdNameShort operation for converting color or grayscaleimages to bitonal format. Within the range of grayscale values in an image,the threshold marks the upper limit of black pixel values and the lower limitof white pixel values. ProdNameShort can set the threshold valueautomatically, but you can manually adjust it before conversion, using theThreshold tab of the Histogram dialog box.
thumbnail A miniature representation or preview of an image. Thumbnailsare used in the ProdNameShort Insert Image dialog box, the Histogram dialogbox, and the AutoCAD Image Adjust dialog box.
TIFF Acronym for the tagged image file format.
tiled Encoding method for TIFF files. Breaks the image data into rectangular,tiled regions for quicker processing. See also data organization, quad sheet.
toggle To switch between two options of an electronic device, usually bypressing a single button. Example: The ProdNameShort Toggle commandchanges the visibility of the image frame.
transparency color A selected color that is transparent in a grayscale or colorimage. If transparency is turned on for the image, all pixels of the transparencycolor become transparent. Any time you use a Rub command, the color of therubbed area is changed to the transparency color.
true color (24-bit) image An image that can contain up to 16.7 million colors.This image type is composed from three 8-bit data bands: red, green, and blue.
Glossary | 399

true coordinate transform A type of coordinate transformation that can beapplied to images upon insertion. This option applies to each pixel of theimage, and produces the most accurate results. See also 3-point affine transformand 4-point rubbersheet transform.
unembed To remove an embedded image from a drawing. The unembeddedimage must be saved as an independent file. See also embed.
unload To remove image data from the display and the working memory ofa drawing. The image frame remains visible, and the image object remains inthe Image Manager toolspace tree. To reverse an unload operation, do a reload.See also detach.
vector A mathematical object with precise direction and length, but withoutspecific location. Vector data is stored as XYZ coordinates that form points,lines, areas, and volumes.
vectorize Converting a bitonal raster image to vector data. You can use theProdNameShort vectorization tools to vectorize a raster image. See also follower,VTools.
VTools ProdNameShort vectorization tools used to manually convert bitonalraster arcs, circles, lines, or rectangles to equivalent vector objects.
VTools Removal A setting on the VTools General tab of the Raster DesignOptions dialog box that controls what happens to the underlying raster entitywhen vectorization tools are used to vectorize the raster entity. Dependingon the Removal Method setting you choose, the raster entity can be rubbedor REM deleted.
wavelet Multiple resolution image files compressed to a small fraction of theiroriginal size.
world file A file that stores correlation information for an image, consistingof scale, rotation, and insertion point. World files can be created by the Exportcommand to correlate an image in another graphics application. The worldfile is in ASCII format that you can view using Notepad. World files are savedin the folder where the image is located. Their extensions vary, depending onfile type, but always end in w. Examples:
■ BMP - bpw
■ GIF - gfw
■ IG4 - i4w
■ TIFF - tfw
400 | Glossary
X Y and Z coordinates Any of a set of numbers used to specify the locationof a point on a line, on a surface, or in space.
Glossary | 401

402

Index
.pf (palette file) 125exporting 128
3-point affine transform 254-point rubbersheet transform 25
A
active path 75arc
convert raster to vector 215rub 150
assign coordinate system, dialog box 305AutoCAD image objects 6AutoPaste command 256AutoRub command 266
B
bias 86binary image. See bitonal image. 61bitonal filters, types 302bitonal filters, using 112bitonal image
change foreground color 61convert raster entities to vector 203despeckle 84mirror 88touch up 89
black and white images 100blurring filter 108boundary 81brightness and contrast adjustment 92
C
CAD Overlayimporting images to Raster
Design 256program history 7
capture image 47change display qualities 285circle, rub 151circular 152circular, crop raster data 145circular, rub 152circular,region objects 172cleanup
bias 86deskew 83despeckle 84invert light and dark shades 88mirror 88overview 82touchup 89
clear path 76–77clear REM objects 197COGO Points 82color
between merged images 62change foreground 61REM objects 265rub and crop 62
color depth 116color image
brightness and contrast 92convert to black and white 100convert to grayscale 98mirror 88reverse light and dark shades 88transparency color 62
commandsAutoCAD 285command line 276Raster Design 276REM toolbar 295–298toolbar 294Vtools 203
compressing,image palette 118, 123configure
CAD Overlay image importing 256correlation defaults 245
403 | Index

correlation search paths 247default image settings 253file locking method 258frame display 59image detach method 252image display quality 58image mask behavior 254mask settings 139message display method 259mouse settings 260new image default properties 261polyline/contour follower 270QSave 262raster entity detection 264raster removal method 268REM objects 265resource file directory 247rub/crop line width 266startup 263thumbnails 255vector merge 268vector separation, contours 244vector separation, general 249vectorization tools 250
contour 219–220contour,convert raster to vector 220contour,from raster 220control points,rubbersheeting 31convert
raster to vector 203arc 215circle 213contour 220line 206pline 207, 217polyline 207, 217rectangle 212text 225
REM objects to raster image 199convolve filters, overview 105coordinate system assignment 305Copy to Clipboard command 200copying,images to clipboard 66correlate 21, 83, 245
image default settings 22Insertion Wizard 23
matching angle 83matching points 28options 21scale 30set defaults 245, 351
correlationduring insertion 21exporting world files 52methods 28rubbersheeting 31
cropcircular region 145color 62diagonal region 147line 145line width 266polygonal region 147–148raster data 145rectangular region 146
curvefitted 101gamma 101piecewise linear 101
D
default image settings 253defaults 351
correlation 245image 351mask 353
density 115and image scale 115default 245units 115value 115
deskew, overview 82despeckle 84detach 74detach image options 252details in images 96diagonal,crop 147diagonal,rub 153Dialogs 301directory 258
correlation files 247
404 | Index

lock files 258reading correlation files 247resource files 247
Display Manager layer capture 47, 307display order,changing 73distortion
correcting 86drafting settings, dialog box 308Dynamic Input, and vectorization 205dynamic input, for vectorization 204DYNMODE settings, and
vectorization 205
E
edge enhancements filters 110gradient directional 111Laplacian 110matched filter 111shift and difference 110
editbias 86cleanup commands 82despeckle 82invert 82
edit mode menu 187edit raster using REM objects 187edit status, dialog box 310editing
pixel touchup 89editing filters
bitonal 112brightness and contrast 92color images 98convolve 105–106despeckle 84grayscale 98grayscale to black and white 100harshness and noise 105light and dark shades 88maximizing details 96mirror an image 88
editing non-REM images 167embed image 42enhanced bitonal region objects 166,
176
erase image 74erase image, options 252export image 48
FTP site 51World File 52
export options, dialog box 313Export Palette dialog box 118exporting 52
F
favorites 18FDO data 47feature settings in Raster Design 352file formats (supported) 5file locking 258file locking,method 258FILEDIA variable 16filters
adjust black and white edges 110bitonal 112blurring 108despeckle 84enhance black and white edges 110enhance edges 109gradient edges 111high pass 109low pass 108make edge transitions 110matched filter 111mirror 88noisy images 111reduce high-frequency detail 108reduce visual noise 105sharpen 109shift and difference 110
filters,edge enhancement 110frame
adjust for inserting image 27bring to front of image 59changing linetype 61definition and purpose 81send behind image 59turn off and on 59
FTP siteexport image to 51
Index | 405

inserting images from 14save an image to 45
G
geo-referencing 21gradient directional edge enhancements
filters 111grayscale
converting to color 118, 130grayscale image
convert to black and white 100from color image 98mirror 88reduce harshness and noise 105
grid,rubbersheeting 31
H
hiding images 72high pass filters 109histogram
adjusting images 92black and white 100brightness and contrast 92color to grayscale image 98contrast 101contrast curve 101grayscale 98grayscale to black and white 100maximizing details 96tonal adjustments 92, 101
histogram settings, dialog box 316
I
ibias command 86icapture command 47iconfig command 115icons 294
REM 295–298iconvolve 106iconvolve command 105icropcirc command 145icropdiag command 147
icropline command 145icroppoly command 147–148icroprect command 146ideskew command 83idespeckle command 84iembed command 42iexport command 48iframe command 242iimerge command 160iinsert command 16image 16, 28
boundary 81capture 47correlation methods 28density 115embed 42erase and detach options 252file size 115filters 105insert 9insertion dialog box 325move 28path problems 276preview 11resampling methods 303scale 28transform 25units 115
image default settings 253image density, change 303image detach options 252image display
brightness and contrast 92cleanup 82color to grayscale 98color transparency 62display properties 58high or draft display quality 58maximizing details 96mirror 88order problems 273problems 273reduce harshness and noise 105reverse light and dark shades 88smoothing 105turn frame off and on 242
406 | Index

image display,enhance edges 110image filters,bitonal 112image formats (supported) 5image management
active path 75bitonal filters 112change layers 60, 167copying to clipboard 66detaching 74display order 73erase images 74histogram 92insertions 67layout of dialog box 65REM 165saved path 76showing and hiding 72unloading 75zoom to 67
Image Manager, controls 330image mask options 254Image menu description 286image palette
changing colors 118combining colors 120compressing 123converting to color 130custom colors 118displaying color values 131displaying information 129displaying transparency values 132displaying unused values 131exporting 125, 128importing 125manipulating 118overview 118pick color 122removing duplicate entries 123resetting 124selecting colors from the image 122transparent color 121
image portability 6image processing 91image properties,changing 57image selection 335IMAGEADJUST command 92, 285
IMAGEATTACH command 285imageclip command 142IMAGECLIP command 285IMAGEFRAME command 286IMAGEQUALITY command 286imask command 138–139imatch command 28ImgAttributes 57, 165imirror command 88Import Palette dialog box 118importing CAD Overlay images 256inew command 20insert image 10, 14
adjust frame 27correlation 21dialog box options 303–304, 338,
367from an FTP site 14Insertion Wizard 23Quick Insert 22using command line 16
insertion point,default 245insertions
changing display order 73managing 67showing and hiding 72zoom to 67
installation requirements 5Internet
access Raster Design home page 4browsing files 242opening an image file 12problems inserting images from 275shortcuts to Favorites 18
invert light and dark shades 88irubarc command 150irubcircle command 151irubdiag command 153irubline command 149irubpline command 151irubpoly command 154irubrect command 155isave command 39iunembed command 42
Index | 407

K
K frame,turn off and on 242
L
Laplacian edge enhancements filters 110layer,move image to different 60, 167line
convert raster to vector 206crop 145rub 149
locking images 258low pass filters 108
M
Map 3D image capture 47mask
change existing 138change properties 139convert mask to clips 143create 138defaults 353editing 140enable/disable 141hide images 139remove 143unload images 139using command line 138
match 28matched edge enhancement filters 111median filter 106merge images 160merge objects 160
REM 198select pen widths 162vectors into raster image 161
message display method 259mirror 88
dialog box options 341overview 82
modifying images 79mouse buttons 260move an image 29Multi Pick Options 264
N
new features in Raster Design 1new image default properties 261noise reduction 105Non-Continuous Linetype
Detection 264
O
objects associated with images 166OCR
AutoCAD output settings 230character set 230dictionary 230input settings 230language 230setup 230text 232verification display settings 230
optical character recognition, dialog boxcontrols 371
optionscorrelation defaults 245correlation search paths 247default image settings 253dialog box 351image detach method 252image mask behavior 254importing CAD Overlay images 256locking images 258message display method 259mouse buttons 260new image default properties 261polyline/contour follower 270QSave 262raster entity detection 264raster removal method 268REM objects 265rub/crop line width 266startup 263thumbnail images 255user preferences 358vector merge 268vector separation, contours 244vector separation, general 249
408 | Index

vectorization tools 250order of images (restoring) 273
P
palettechanging colors 118combining colors 120compressing 123converting to color 130displaying color values 131displaying information 129displaying transparent colors 132displaying unused colors 131editing 118, 122exporting 125, 128importing 125removing duplicate entries 123resetting 124selecting colors from the image 122transparent color 121
palette fileexporting 128importing 125
Palette Manager, overview 118path problems with images 276paths
correlation search 247read 247resource files 247, 355write 247
pixel data display 71plot raster images 274point data query 71point selection with snaps 309polygonal
crop raster data 147–148region object 170rub 154
polyline3D 223convert raster to vector 207rub 151
polynomial rubbersheeting 31preview image 11preview rubbersheet 33
primitive objects 166changing linetypes 186defining 178from existing vector 185REM circle 181REM line 180remove 156smart pick 184
problemsediting images 274image display order 273image paths 276inserting Internet images 275raster snap 274
propertiesdisplay 58image frame 61layer 60, 167
Q
QSave preferences 262Quick Bar 298Quick Insert option 22
R
raster datacropping 144modifying with REM objects 187
raster data query 71dialog 350
Raster Designhome page on Web 4installing 5new features 1program history 7user preferences 358viewing information about 5
Raster Design image objects 6Raster Design Object Enabler 7Raster Design options, setting 244, 351raster entity conversion to vector 203
arc 215line 206polyline 207
Index | 409

text 225raster entity detection settings 264raster entity manipulation. See REM 165raster image,plotting 274raster pens
pen widths for vector merge 162settings 363
raster removal 155raster snap
modes 238options 309toggle QuickBar 241troubleshooting 274
rbackground command 62read-only files 274recognizing text 232
AutoCAD output settings 230character set 230dictionary 230input settings 230language 230setup 230verification display settings 230
rectangularcrop raster data 146region object 169rub 155
refine mode 189REGEN command 273region objects
association with images 166circular region 172defining 176from existing vector 174polygonal region 170rectangular region 169remove subsections 175
REMdefining primitive objects 178delete raster data 156editing non-REM images 167object editing 191operations 191settings 357
REM objectsand transparency 200
association with image 166change color 265characteristics 166clearing 197converting to new raster image 199copying to clipboard 200delete raster data 195edit mode menu 187edit raster images 187manipulating 187merge into an image 198outside image 195refine mode 189resizing 189separate raster linework 201smooth raster linework 194
removediagonal region 153except raster line 145image 74outside a circular region 145outside a diagonal region 147outside a polygonal region 147–148outside a rectangular region 146polygonal region 154raster arc 150, 158raster circle 151–152, 159raster data with REM 195raster entities using Smart Pick 157raster line 149, 158raster line segments 151raster under vector 155, 268rectangular region 155unwanted borders 145, 147–148
resetting image palette 124resource file 48resource file directory 247reverse light and dark shades 88RMS error,rubbersheeting 31rotate image 28, 83rounding 250rpens 162rub
arc 150circle 151color 62
410 | Index

diagonal region 153irubcirc command 152line 149line width 266pline 151polygonal region 154rectangular region 155
rubbersheeting 31rubbersheeting, dialog box controls 364rubbing raster data 149
S
saveto an FTP site 45, 51to new file name, type, or
location 45, 49save image 39saveclip (see export) 48saved path 76scale 30, 115
default 245match points 28
select image 79select images options 335settings for REM commands 357shift and difference filters 110shortcut menu 260shortcuts to Favorites 18showing images 72single image optimization 98Single Pick Options 264smart pick
to define a primitive 184to remove a primitive 157
SmartCorrect 205, 250Smooth command 194smoothing filters
low pass 105median 105
snap modes 238snap modes on Quick Bar 241snap settings 309snap,troubleshooting 274speckles
remove 84
specify size 84startup options 263stretching an image 31system requirements for installation 5
T
text converted to vector 225text recognition 232
AutoCAD output settings 230character set 230dictionary 230input settings 230language 230setup 230verification display settings 230
text recognition, dialog box controls 371thumbnails 255toggle,raster snap 241tonal adjustments,histogram 92, 101toolbar commands 294
REM 295–298toolbars
access to 288overview 288
touchup bitonal images 89transform types 25Transform,rubbersheeting 31transparency
AutoCAD commands 285change color 62designating unused colors 62grayscale 62
transparent color,image palette 121triangular rubbersheeting 31true coordinate transform 25
U
UNDO command 81unload 75user preferences 358
Index | 411

V
varc command 215vcircle command 213vector merge options 359
raster pen widths 162vector merge settings 268vector separation options
contours 244general 249
vector separation, dialog boxcontrols 373
vector,merge into raster image 161vectorization, and Dynamic Input
prompts 205vectorize
raster arc 215raster circle 213raster contour 220raster entities, overview 203raster line 207raster polyline 207, 217, 219raster rectangle 212raster text 225
verification list 250verify text/table, dialog box controls 376vf3dpoly 223vfcontour 219–220vfcontour settings 270vfpline 217vfpline settings 270visual noise reduction 105vline command 206
Vline,SmartCorrect 205vmtext command 225vpline command 207vrect command 212vtext command 225Vtools
follower 217, 220follower settings 270SmartCorrect 205varc 215vcircle 213vf3dpoly 223vfcontour 220vline 206vmtext 225vpline 207vrect 212vtext 225
VTools 203vfpline 217
W
world file 48, 52world wide web 4, 12
Raster Design home page 4set location for browsing files 242shortcuts to Favorites 18
Z
zooming to images 67
412 | Index