user manual revision 2 - electro industrieselectroind.com/pdf/aireports2.02revised.pdf · aireports...
TRANSCRIPT

AiREPORTS 2.0for use with
Nexus Communicator
Electro Industries/GaugeTech
User ManualRevision 2.02
March 14, 2002Doc # E132-7-01-202
1800 Shames DriveWestbury, New York 11590
Tel: 516-334-0870 Fax: 516-338-4741E-mail:[email protected] www.electroind.com
“The Leader in Web Accessed Power Monitoring”
AiReports for Nexus CommunicatorUser ManualRevision 2.02
Published by:Electro Industries/GaugeTech1800 Shames DriveWestbury, NY 11590
All rights reserved. No part of thispublication may be reproduced ortransmitted in any form or by anymeans, electronic or mechanical,including photocopying, recording,or information storage or retrievalsystems or any future forms ofduplication, for any purpose otherthan the purchaser’s use, without theexpressed written permission ofElectro Industries/GaugeTech.
© 2002Electro Industries/GaugeTech
Printed in the United States ofAmerica.
Electro Industries/GaugeTech Doc # E132-7-01-202 I

Electro Industries/GaugeTech Doc # E132-7-01-202 II
Customer Service and SupportCustomer support is available 9:00 am to 4:30 pm, eastern standard time, Monday through Friday.Please have the model, serial number and a detailed problem description available. If the problem concerns a particular reading, please have all meter readings available. When returning any merchandiseto EIG, a return authorization number is required. DO NOT RETURN ANY PRODUCT WITHOUTA RETURN AUTHORIZATION NUMBER. For customer or technical assistance, phone 516-334-0870 or fax 516-338-4741.
Limited WarrantyElectro Industries/GaugeTech warrants that (a) the SOFTWARE will perform substantially in accordancewith the accompanying written materials for a period of ninety (90) days from the date of receipt and (b)any Electro Industries/GaugeTech hardware accompanying the SOFTWARE will be free from defects inmaterials and workmanship under normal use and service for a period of one (1) year from the date ofreceipt. Any implied warranties on the SOFTWARE and Electro Industries/GaugeTech hardware arelimited to ninety (90) days and one (1) year, respectively. Some states/jurisdictions do not allow limitations on the duration of an implied warranty, so the above limitation may not apply to you. Toexercise this warranty, fax or call the customer-service department above.
Customer RemediesElectro Industries/GaugeTech and its suppliers’ entire liability and your exclusive remedy shall be, atElectro Industries’ option, either (a) return of the price paid, or (b) repair or replacement of the SOFTWARE or hardware that does not meet this Limited Warranty and which is returned to ElectroIndustries with a copy of your receipt. This Limited Warranty is void if failure of the SOFTWARE orhardware has resulted from accident, abuse or misapplication. Any replacement SOFTWARE or hardware will be warranted for the remainder of the original warranty period or thirty (30) days,whichever is longer.
No Other WarrantiesTo the maximum extent permitted by applicable law, Electro Industries/GaugeTech and its suppliers disclaim all other warranties, either express or implied, including, but not limited to implied warranties of merchantability and fitness for a particular purpose, withregard to the SOFTWARE, the accompanying written materials and any accompanyinghardware. This Limited Warranty gives you specific legal rights. You may have otherswhich vary from state/jurisdiction to state/jurisdiction.
No Liability for Consequential DamagesTo the maximum extent permitted by applicable law, in no event shall Electro Industries/GaugeTech or its suppliers be liable for any damages whatsoever (including withoutlimitation, special, incidential, consequential or indirect damages for personal injury, lossof business profits, business interruption, loss of business information or any otherpecuniary loss) arising out of the use or inability to use this product, even if ElectroIndustries/Gauge Tech has been advised of the possibility of such damages. In any case,Electro Industries/GaugeTech and its suppliers’ entire liabilty under any provision of thisagreement shall be limited to the amount actually paid by you for the SOFTWARE and/orElectro Industries hardware. Because some states/jurisdictions do not allow the exclusionor limitation of liability for consequential or incidental damages, the above limitation maynot apply to you.
Electro Industries/GaugeTech Doc # E132-7-01-202 III
License AgreementKreiss Johnson Technologies licenses Ai*Power/AiReports Software to the purchaser for use on a singlepersonal computer. This product may not be transferred to another company without written permissionfrom Kreiss Johnson Technologies, Inc. Since Ai*Power/AiReports uses artificial intelligence tools thatare based on heuristic and rule of thumb methodologies, the user acknowledges that Kreiss JohnsonTechnologies, Inc. will not be held responsible for direct or indirect damages incurred by the use of thisprogram. By opening the diskette package, the purchaser agrees to the terms of this agreement.
Ownership, Title and Copy RestrictionsAs the Licensee, you own the physical media on which the software is originally or subsequently recorded. The software is owned by Kreiss Johnson Technologies, Inc. and is protected by United Satescopyright laws and internal treaty provisions. The SOFTWARE PRODUCT and documentation are provided with RESTRICTED RIGHTS. As the Licensee, you may physically transfer the software fromone computer to another provided that there is NO POSSIBILITY of the software being used by morethan one person or on more than one computer at a time. You may not electronically transfer the software from one computer to another over a network. You may not distribute copies of the softwareor accompanying written materials to others. You may not modify, adapt, translate, decompile, disassemble or create derivative works based on the software. You may not use Ai*Power/AiReports toanalyze power monitors outside of your facility. You may not use this version of Ai*Power/AiReportsas a service for the analysis of data from monitors outside of your facility. Contact Electro Industries/GaugeTech and/or Kreiss Johnson Technologies, Inc. for alternative licensing arrangements.
General ProvisionsIf any provision of this Warranty and/or License Agreement is invalid or unenforceable, the remainderwill remain valid and enforceable according to its terms. This Warranty and/or License Agreement constitutes the complete and exclusive agreement of the parties and supersedes any other agreement ordiscussions between Electro Industries/Gauge Tech, Kreiss Johnson Technologies, Inc. and the userregarding the software or any other items included with this package. If any remedy provided is determined to have failed of its essential purpose, all limitations of liability and exclusions of damagesset forth in the the Limited Warranty shall remain in effect. Electro Industries/GaugeTech and KreissJohnson reserve all rights not specifically granted in this statement.
DisclaimerThe information presented in this publication has been carefully checked for reliability; however, noresponsibility is assumed for inaccuracies. The information contained in this document is subject tochange without notice.
Table of Contents
Chapter 1: Introduction to AiREPORTS 2.0Introduction . . . . . . . . . . . . . . . . . . . . . . . . . . . . . . . 1-1
1.1: Outline for Using AiREPORTS . . . . . . . . . . . . . . . . . . . . . . . 1-2
Chapter 2: Installation2.1: AiREPORTS Versions . . . . . . . . . . . . . . . . . . . . . . . . . . . 2-12.2: Minimum Installation Requirements . . . . . . . . . . . . . . . . . . . . . 2-12.3: Installing AiREPORTS 2.0 for Windows 9x, NT, 2000 . . . . . . . . . . . . . 2-12.4: For a Single-Computer License . . . . . . . . . . . . . . . . . . . . . . . 2-22.5: For a Multi-Computer License . . . . . . . . . . . . . . . . . . . . . . . 2-22.6: Channel Setup . . . . . . . . . . . . . . . . . . . . . . . . . . . . . . 2-3
Chapter 3: Retrieve and Convert Logs3.1: Retrieve and Convert Logs . . . . . . . . . . . . . . . . . . . . . . . . . 3-13.2: Manually Reset Logs . . . . . . . . . . . . . . . . . . . . . . . . . . . 3-2
Chapter 4: Selections from the Log Viewer4.1: Access the EIG Log Viewer . . . . . . . . . . . . . . . . . . . . . . . . 4-14.2: To Access AiREPORTS . . . . . . . . . . . . . . . . . . . . . . . . . . 4-24.3: To Change Log Viewer Selections . . . . . . . . . . . . . . . . . . . . . . 4-24.4: PQDIF Converter . . . . . . . . . . . . . . . . . . . . . . . . . . . . . 4-4
Chapter 5: AiREPORTS Sections5.1: Section 1 - Site Summary . . . . . . . . . . . . . . . . . . . . . . . . . 5-15.2: Section 2 - Severe Events . . . . . . . . . . . . . . . . . . . . . . . . . 5-35.3: Section 3 - Statistics . . . . . . . . . . . . . . . . . . . . . . . . . . . . 5-35.4: Section 4 - Frame Analysis . . . . . . . . . . . . . . . . . . . . . . . . . 5-45.5: Section 5 - Power Analysis . . . . . . . . . . . . . . . . . . . . . . . . . 5-55.6: Section 6 - Run Summary . . . . . . . . . . . . . . . . . . . . . . . . . 5-6
Chapter 6: AiREPORTS Toolbars6.1: Icon Toolbar . . . . . . . . . . . . . . . . . . . . . . . . . . . . . . . 6-16.2: Menu Toolbar . . . . . . . . . . . . . . . . . . . . . . . . . . . . . . 6-6
Electro Industries/GaugeTech Doc # E132-7-01-202 IV
Chapter 1Introduction to AiREPORTS 2.0
Electro Industries, in conjunction with Kreiss Johnson Technologies, the leader in power quality analysissoftware, introduces a quantum leap in power quality reporting technology, AiREPORTS 2.0.
This unequaled power quality software package not only provides a comprehensive report on the statusof the equipment being monitored, but it also uses artificial intelligence to diagnose a PQ problem orevent and provide the possible cause of the problem. Accuracy is generally as high as 80%. Having thisadvanced diagnostic tool at your fingertips will cut endless hours of engineering analysis.
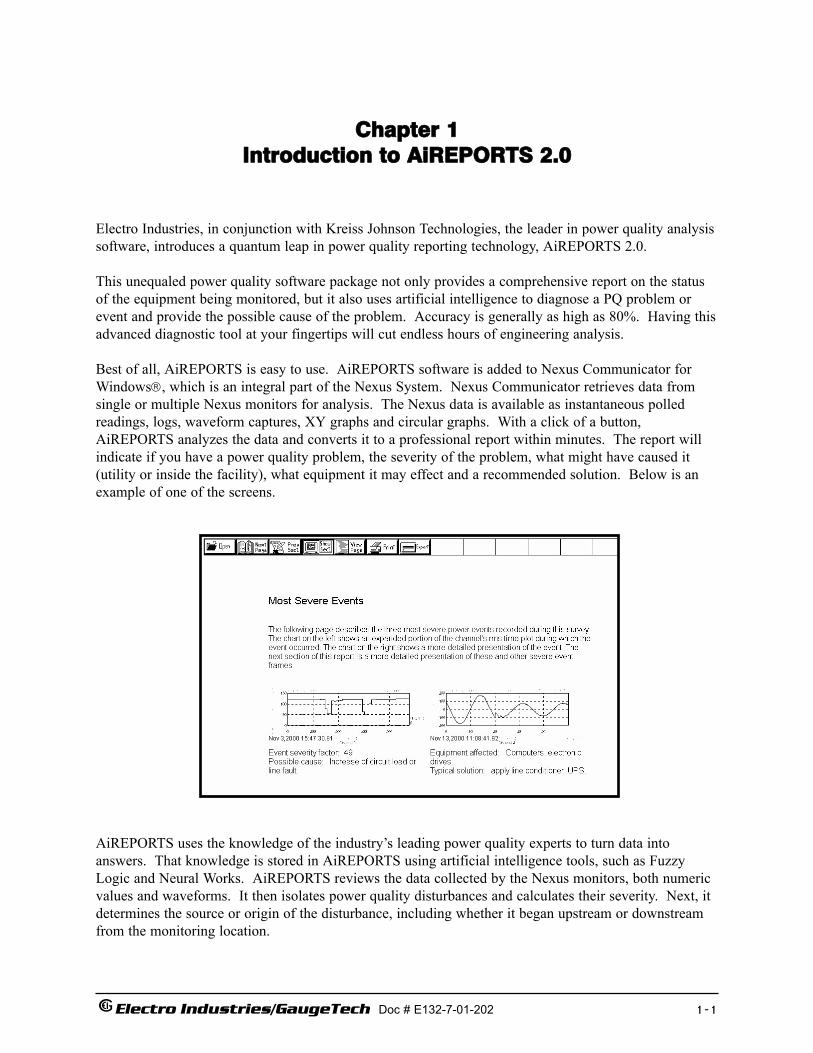
Best of all, AiREPORTS is easy to use. AiREPORTS software is added to Nexus Communicator forWindows, which is an integral part of the Nexus System. Nexus Communicator retrieves data from single or multiple Nexus monitors for analysis. The Nexus data is available as instantaneous polledreadings, logs, waveform captures, XY graphs and circular graphs. With a click of a button,AiREPORTS analyzes the data and converts it to a professional report within minutes. The report willindicate if you have a power quality problem, the severity of the problem, what might have caused it(utility or inside the facility), what equipment it may effect and a recommended solution. Below is anexample of one of the screens.
AiREPORTS uses the knowledge of the industry’s leading power quality experts to turn data intoanswers. That knowledge is stored in AiREPORTS using artificial intelligence tools, such as FuzzyLogic and Neural Works. AiREPORTS reviews the data collected by the Nexus monitors, both numericvalues and waveforms. It then isolates power quality disturbances and calculates their severity. Next, itdetermines the source or origin of the disturbance, including whether it began upstream or downstreamfrom the monitoring location.
Electro Industries/GaugeTech Doc # E132-7-01-202 1-1

Based upon the analysis and using its embedded knowledge, AiREPORTS provides an industry-acceptedsolution for the problem. Examples of the embedded knowledge are voltage waveform patterns of motorstarts and capacitor switching. Knowledge is also embedded as a “rule”. An example of an embeddedrule is, “If a major current increase is recorded during a sag, the origin of the sag is downstream from themonitoring location”. With hundreds of waveform patterns and rules, the AiREPORTS user truly has astaff of experts behind him.
Once the detailed report is generated, you can print the report, transmit it to a colleague, modify thereport with your favorite word processing software and/or export the file using RTF or PDF format.You can also save waveform data in PQDIF format for use with other data management and analysissoftware (see section 4.4).
NOTE: The user must set up the Nexus to collect waveform data SIMULTANEOUSLY ON ALLCHANNELS when a power quality event occurs (see section 2.4 for details).
1.1: Outline for Using AiREPORTS
1. Install AiREPORTS for Nexus Communicator 2.0 software on your computer and Set Up Channels (Chapter 2);
2. Retrieve and Convert Logs and Manually Reset Logs (Chapter 3);
3. Selections from the Log Viewer (Chapter 4);
4. AiREPORTS Sections (Chapter 5);
5. AiREPORTS Toolbars (Chapter 6);
NOTE: Please note again that artificial intelligence (such as Fuzzy Logic and Neural Works) yields anaccuracy as high as 80%. It will be wrong some of the time.
Electro Industries/GaugeTech Doc # E132-7-01-202 1-2

Chapter 2Installation
2.1: AiREPORTS Versions
AiREPORTS is available in 50Hz and 60Hz versions. It is important that you know the frequency ofyour system so that you have ordered the right version. U.S. systems are usually 60 Hz. Europeansystems are usually 50Hz. If you have any questions, contact our Customer Service Department forclarification at 516-334-0870.
2.2: Minimum Installation Requirements
In order for AiREPORTS to be compatible with your system, the following are the MinimumRequirements for installation:
• Nexus Communicator 2.0
• Adobe Acrobat 4.0 (or higher)
• High Speed Computer
• Windows 95, 98, NT, 2000 (or higher)
2.3: Installing AiREPORTS 2.0 for Windows 9x, NT and 2000
1. Start Microsoft Windows 9x, NT or 2000.
2. Put the AiREPORTS CD in your computer’s CD drive. Make sure all other running applicationsare closed before proceding with the installation.
3. Click the Start button. Then, select Run.
4. Select a file from the CD drive or locate the appropriate file on your computer (see sections 2.4 and2.5 below).
5. Click OK to continue.
6. When installation is complete, click OK.
7. A screen may appear that says, You must Restart your computer now. Click Yes or No.Windows will update your systems settings. You’re ready to use AiREPORTS.
Electro Industries/GaugeTech Doc # E132-7-01-202 2-1
2.4: For a Single-CComputer License:
In the text box (after Open) type:
50Hz: [CD drive letter]:\AiReports_Setup_50Hz_1C_X.Exe [Enter]
60Hz: [CD drive letter]:\AiReports_Setup_60Hz_1C_X.Exe [Enter]
X = version number
2.5: For a Multi-CComputer License:
In the text box (after Open) type:
50Hz: [CD drive letter]:\AiReports_Setup_50Hz_MC_X.Exe [Enter]
60Hz: [CD drive letter]:\AiReports_Setup_60Hz_MC_X.Exe [Enter]
X = version number
NOTE: Installation instructions may differ slightly. Simply follow the instructions provided.
Electro Industries/GaugeTech Doc # E132-7-01-202 2-2
2.6: Channel Setup
The user must set up the Nexus to collect waveform data SIMULTANEOUSLY ON ALL CHANNELS when a power quality event occurs.
To accomplish this, follow the steps below:
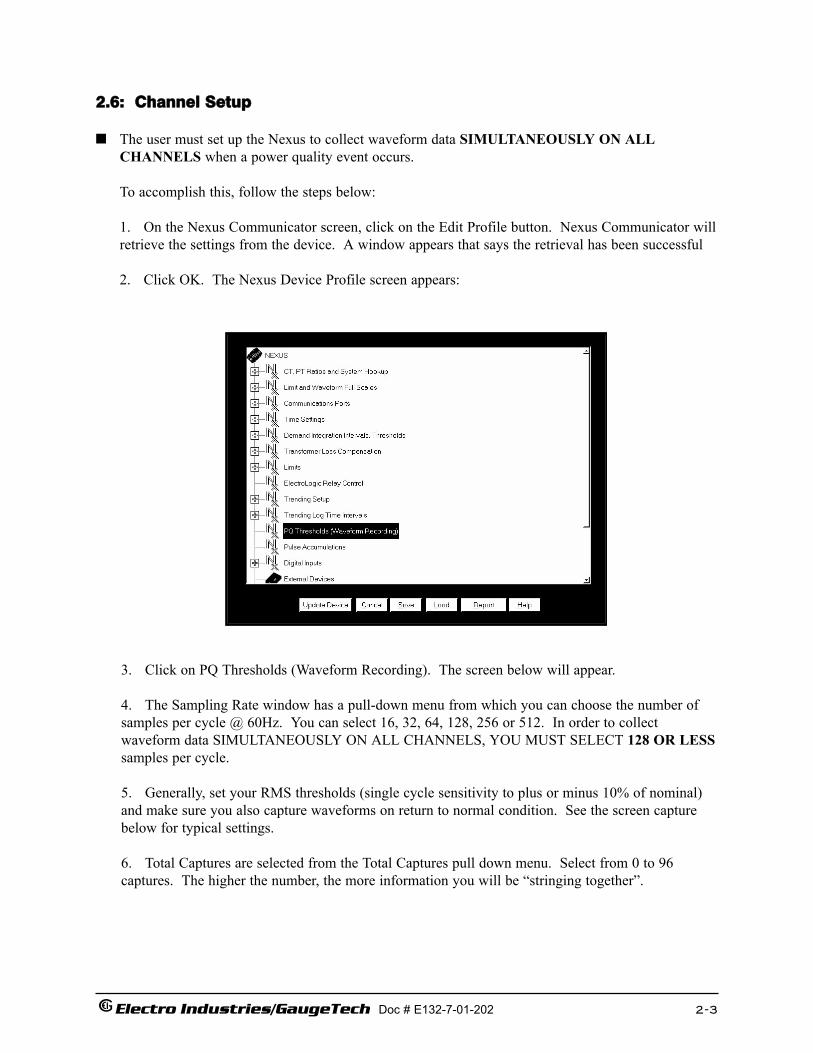
1. On the Nexus Communicator screen, click on the Edit Profile button. Nexus Communicator willretrieve the settings from the device. A window appears that says the retrieval has been successful
2. Click OK. The Nexus Device Profile screen appears:
Electro Industries/GaugeTech Doc # E132-7-01-202 2-3
3. Click on PQ Thresholds (Waveform Recording). The screen below will appear.
4. The Sampling Rate window has a pull-down menu from which you can choose the number ofsamples per cycle @ 60Hz. You can select 16, 32, 64, 128, 256 or 512. In order to collect waveform data SIMULTANEOUSLY ON ALL CHANNELS, YOU MUST SELECT 128 OR LESSsamples per cycle.
5. Generally, set your RMS thresholds (single cycle sensitivity to plus or minus 10% of nominal)and make sure you also capture waveforms on return to normal condition. See the screen capturebelow for typical settings.
6. Total Captures are selected from the Total Captures pull down menu. Select from 0 to 96 captures. The higher the number, the more information you will be “stringing together”.
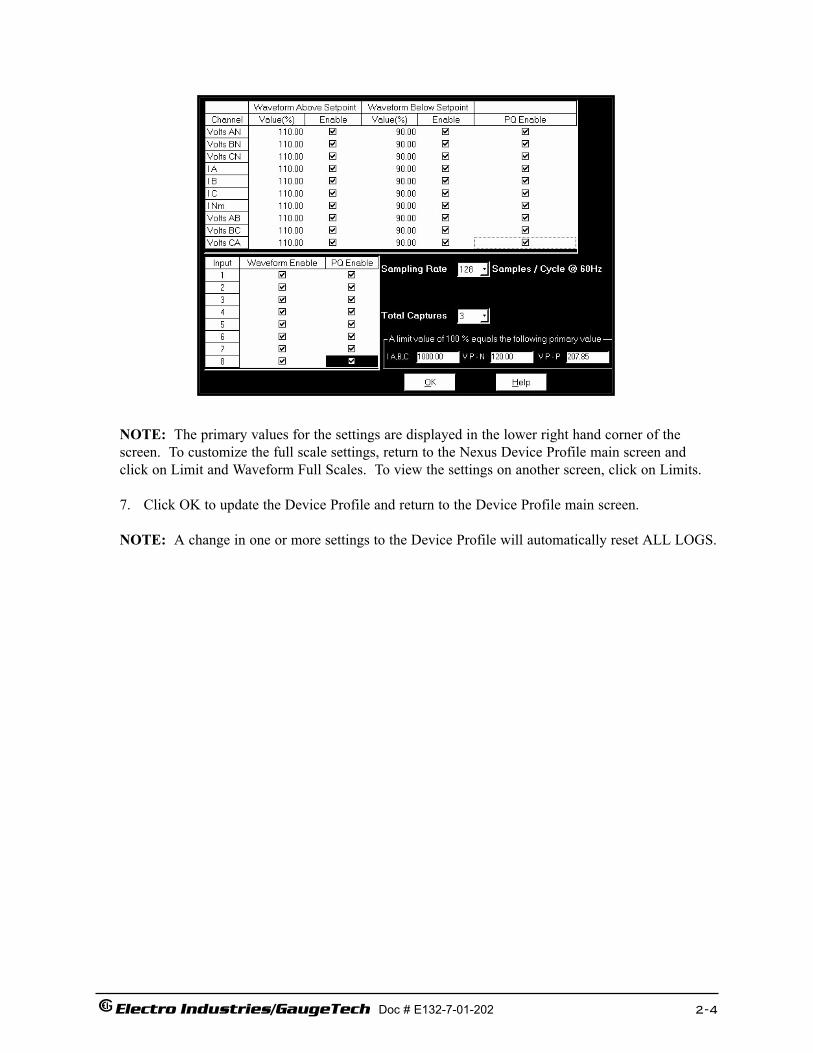
NOTE: The primary values for the settings are displayed in the lower right hand corner of thescreen. To customize the full scale settings, return to the Nexus Device Profile main screen andclick on Limit and Waveform Full Scales. To view the settings on another screen, click on Limits.
7. Click OK to update the Device Profile and return to the Device Profile main screen.
NOTE: A change in one or more settings to the Device Profile will automatically reset ALL LOGS.
Electro Industries/GaugeTech Doc # E132-7-01-202 2-4
Chapter 3Retrieve and Convert Logs
3.1: Retrieve and Convert Logs
To retrieve logs from the Nexus Monitor and convert them for viewing and analysis:
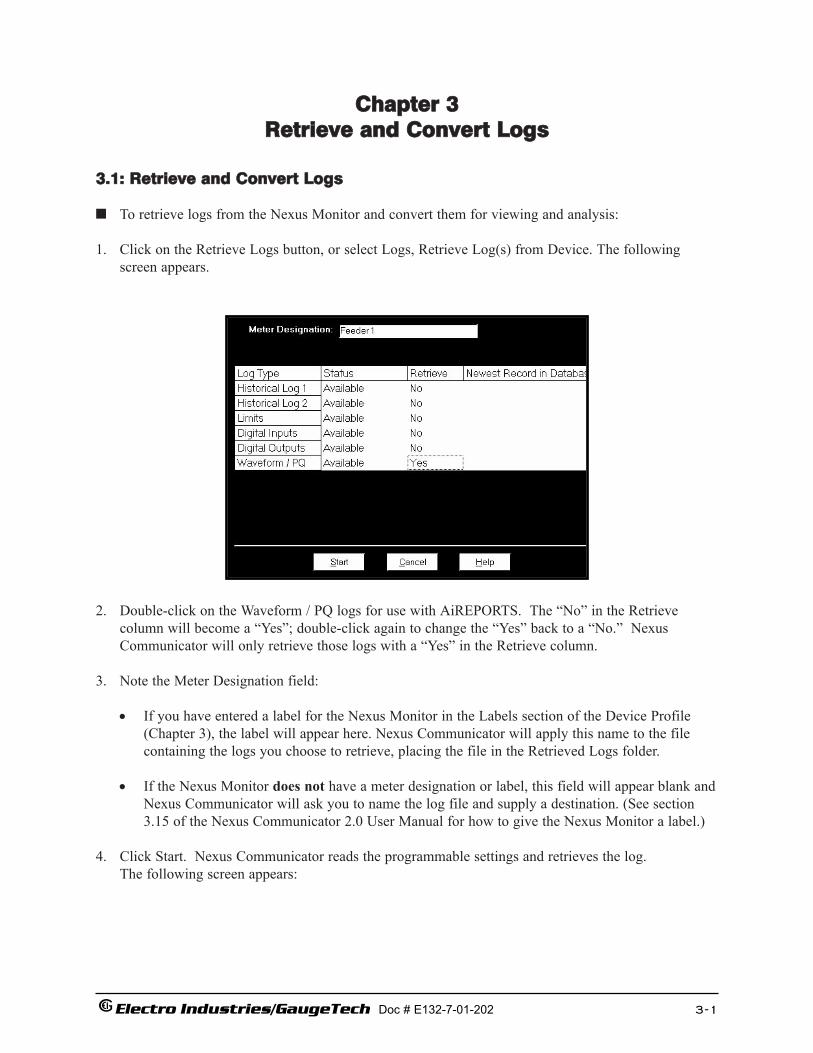
1. Click on the Retrieve Logs button, or select Logs, Retrieve Log(s) from Device. The followingscreen appears.
2. Double-click on the Waveform / PQ logs for use with AiREPORTS. The “No” in the Retrieve column will become a “Yes”; double-click again to change the “Yes” back to a “No.” NexusCommunicator will only retrieve those logs with a “Yes” in the Retrieve column.
3. Note the Meter Designation field:
• If you have entered a label for the Nexus Monitor in the Labels section of the Device Profile(Chapter 3), the label will appear here. Nexus Communicator will apply this name to the filecontaining the logs you choose to retrieve, placing the file in the Retrieved Logs folder.
• If the Nexus Monitor does not have a meter designation or label, this field will appear blank andNexus Communicator will ask you to name the log file and supply a destination. (See section3.15 of the Nexus Communicator 2.0 User Manual for how to give the Nexus Monitor a label.)
4. Click Start. Nexus Communicator reads the programmable settings and retrieves the log. The following screen appears:
Electro Industries/GaugeTech Doc # E132-7-01-202 3-1

5. After Nexus Communicator has retrieved the log, it converts the data. The log converter applicationruns automatically.
6. Nexus Communicator then runs Log Viewer. (See sections 5.5–5.15 of the Nexus 2.0 CommunicatorUser Manual for information on using Log Viewer.)
Note: Retrieve logs as often as you like. Each time you retrieve a log file, Nexus Communicatorappends only the newest records and captures to the existing database. These “partial downloads” arelisted in Log Viewer’s Database Status screen (see section 5.12 of the Nexus 2.0 Communicator UserManual). Snapshots, or partial downloads, must be a time frame within the database dates.Otherwise, there is no data from which to retrieve the snapshot.
3.2: Manually Reset Logs
Logs automatically reset whenever a change in one or more settings is made to the Device Profile.On some occasions, you may wish to manually reset the logs. Follow these simple steps:
1. Select Reset Nexus Information from the Tools Menu. The following screen appears.
2. Click in the box beside the Reset All Logs. Click OK.
Electro Industries/GaugeTech Doc # E132-7-01-202 3-2
Chapter 4Selections from the Log Viewer
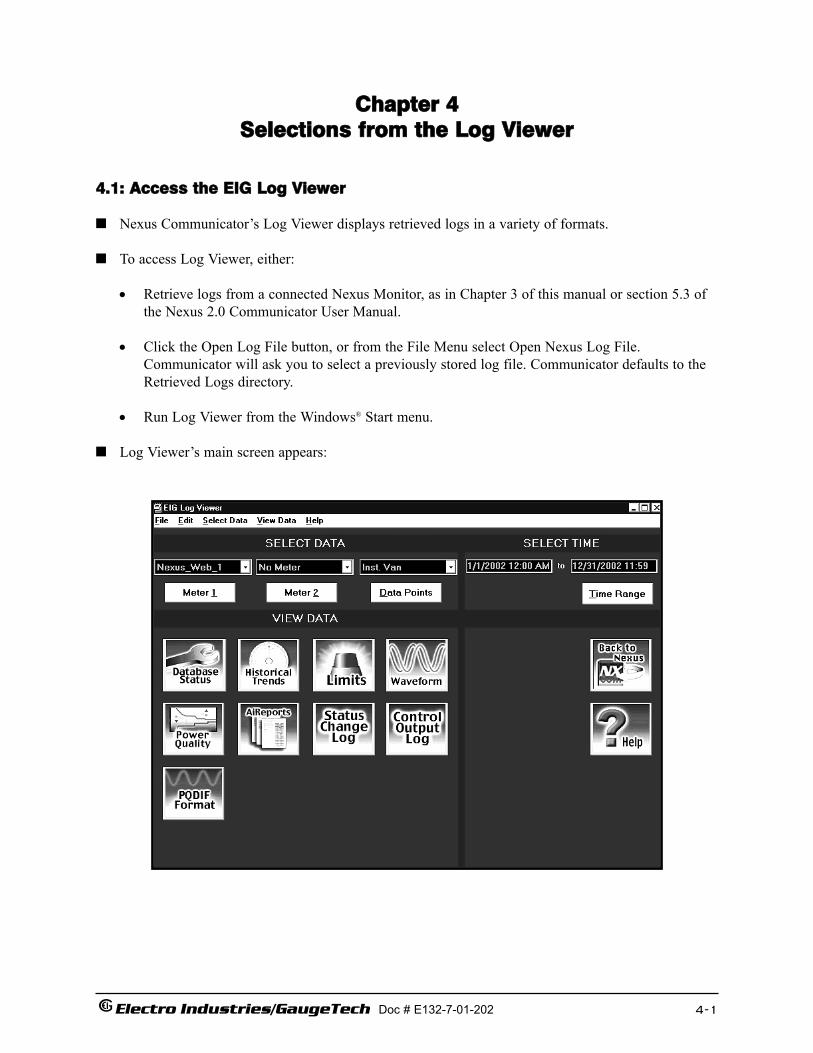
4.1: Access the EIG Log Viewer
Nexus Communicator’s Log Viewer displays retrieved logs in a variety of formats.
To access Log Viewer, either:
• Retrieve logs from a connected Nexus Monitor, as in Chapter 3 of this manual or section 5.3 ofthe Nexus 2.0 Communicator User Manual.
• Click the Open Log File button, or from the File Menu select Open Nexus Log File.Communicator will ask you to select a previously stored log file. Communicator defaults to theRetrieved Logs directory.
• Run Log Viewer from the Windows® Start menu.
Log Viewer’s main screen appears:
Electro Industries/GaugeTech Doc # E132-7-01-202 4-1
4.2: To Access AiREPORTS
Click on the AiREPORTS button of the EIG Log Viewer. AiREPORTS will automatically generatea report based on the Data Selected and the Time Range indicated at the top of the Log Viewer. Ifyou want to change those selections, follow the steps below in section 4.3.
A small Progress Indicator Ai*Power screen will appear at the bottom of your screen. It will indicate that AiREPORTS is converting waveforms, sorting waveforms, analyzing data and compiling a report. In a few moments the Site Summary screen will appear. Chapter 5 details thereport sections. Chapter 6 details the Toolbars that facilitate editing, printing and exporting.
4.3: To Change Log Viewer Selections
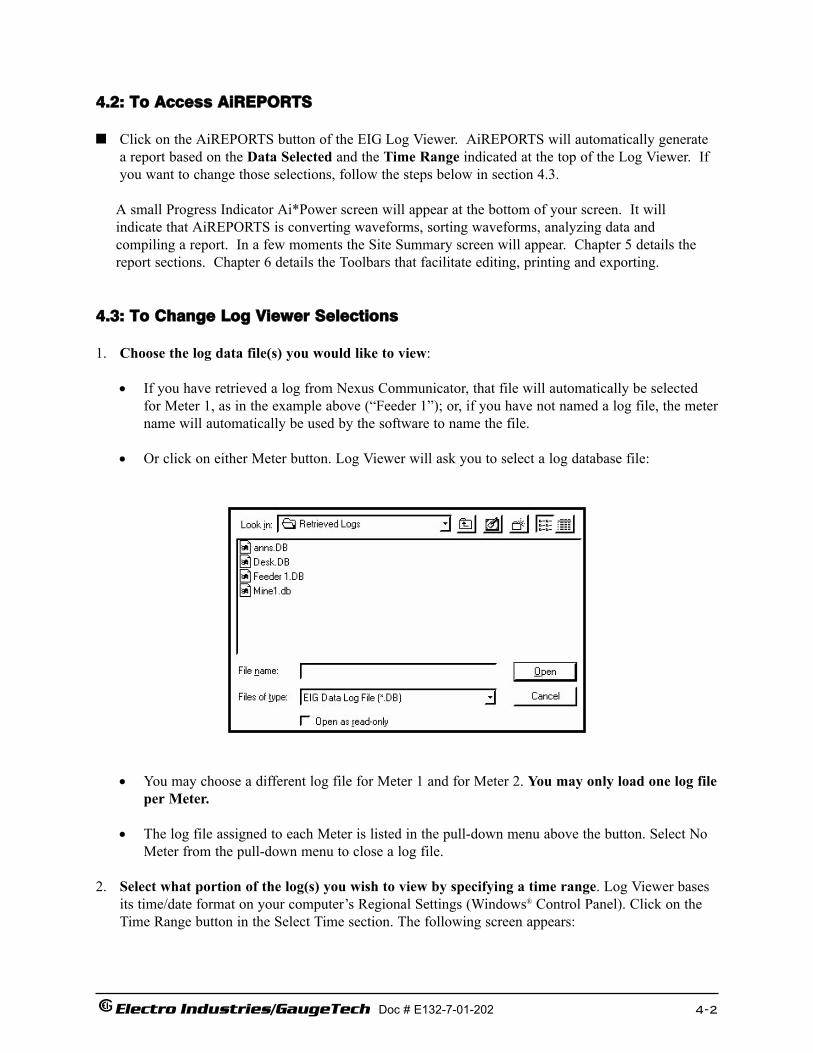
1. Choose the log data file(s) you would like to view:
• If you have retrieved a log from Nexus Communicator, that file will automatically be selectedfor Meter 1, as in the example above (“Feeder 1”); or, if you have not named a log file, the metername will automatically be used by the software to name the file.
• Or click on either Meter button. Log Viewer will ask you to select a log database file:
• You may choose a different log file for Meter 1 and for Meter 2. You may only load one log fileper Meter.
• The log file assigned to each Meter is listed in the pull-down menu above the button. Select NoMeter from the pull-down menu to close a log file.
2. Select what portion of the log(s) you wish to view by specifying a time range. Log Viewer basesits time/date format on your computer’s Regional Settings (Windows® Control Panel). Click on theTime Range button in the Select Time section. The following screen appears:
Electro Industries/GaugeTech Doc # E132-7-01-202 4-2
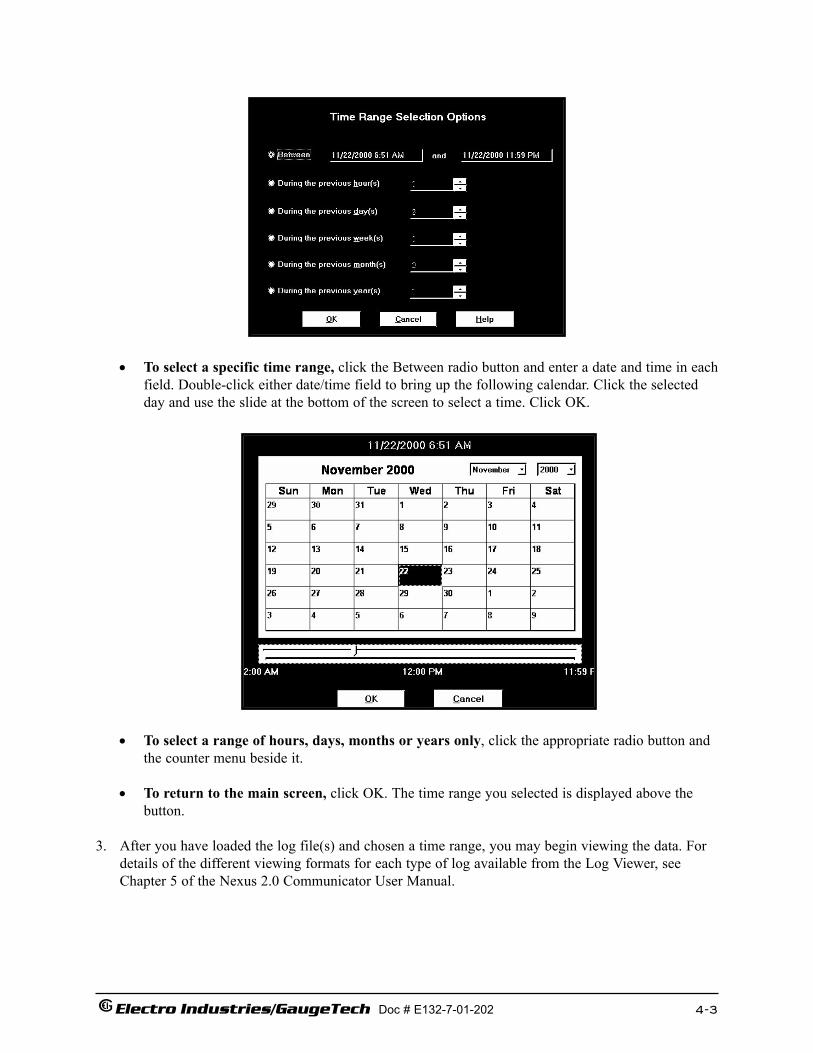
• To select a specific time range, click the Between radio button and enter a date and time in eachfield. Double-click either date/time field to bring up the following calendar. Click the selectedday and use the slide at the bottom of the screen to select a time. Click OK.
• To select a range of hours, days, months or years only, click the appropriate radio button andthe counter menu beside it.
• To return to the main screen, click OK. The time range you selected is displayed above thebutton.
3. After you have loaded the log file(s) and chosen a time range, you may begin viewing the data. Fordetails of the different viewing formats for each type of log available from the Log Viewer, seeChapter 5 of the Nexus 2.0 Communicator User Manual.
Electro Industries/GaugeTech Doc # E132-7-01-202 4-3
Electro Industries/GaugeTech Doc # E132-7-01-202 4-4
4.4: PQDIF Converter
The latest release of AiReports includes a new useful feature, PQDIF Converter. Power QualityData Interchange Format (PQDIF) is a tagged, compressible binary file format which offers a platform-neutral, flexible means of exchanging power quality data between instruments and data management and analysis software. PQDIF is currently under adoption by EPRI as the standard file format for power quality data and under consideration by IEEE as its standard file format.
Using the PQDIF Export Feature with Log Viewer.
• System Requirements: Installation of AiReports with NEXAIPWR.DII file version 2.1.0.8 or higher. PQDIF Viewer Program optional.
• Meters Supported: Electro Industries Nexus Series.
• If the Operation:1. Use the Meter 1 button, select a DB file with waveform data.2. Select a Time Range.3. Press the “PQDIF Format” button.4. Select a PQDIF file name (*.PQD) to which you will export data. 5. Click OK. PQDIF exports the waveform data and converts it to PQDIF format.
Chapter 5AiREPORTS Sections
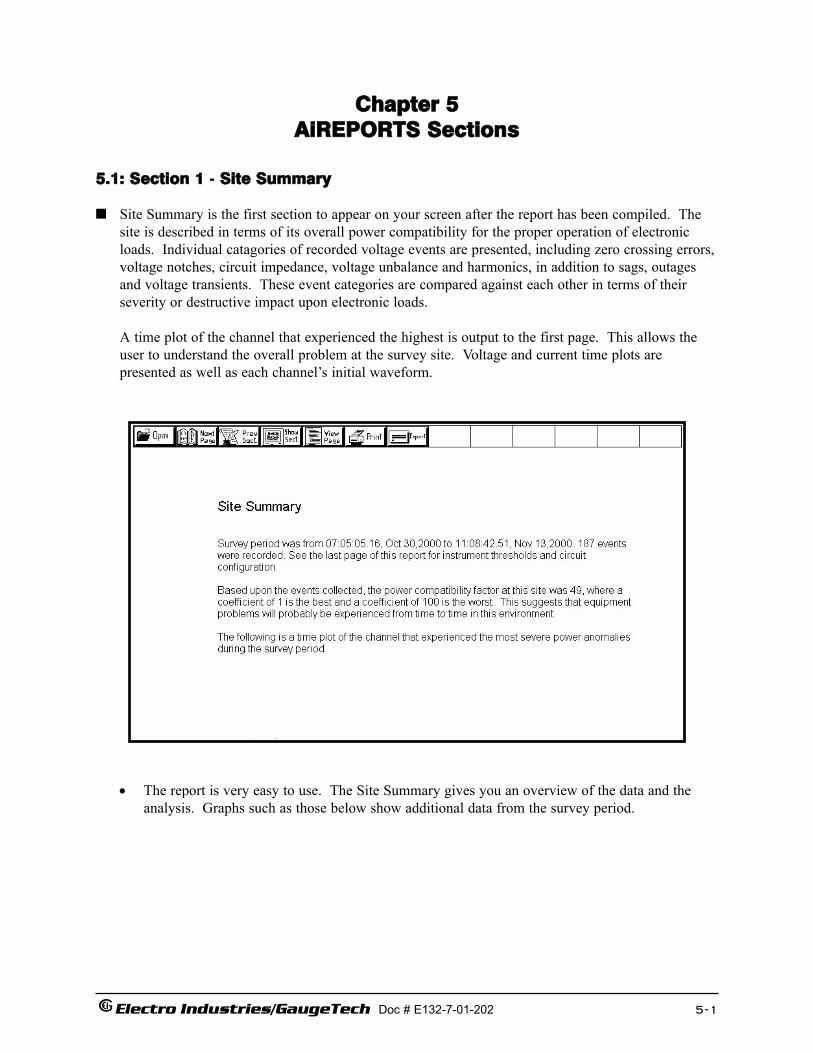
5.1: Section 1 - Site Summary
Site Summary is the first section to appear on your screen after the report has been compiled. Thesite is described in terms of its overall power compatibility for the proper operation of electronicloads. Individual catagories of recorded voltage events are presented, including zero crossing errors,voltage notches, circuit impedance, voltage unbalance and harmonics, in addition to sags, outagesand voltage transients. These event categories are compared against each other in terms of theirseverity or destructive impact upon electronic loads.
A time plot of the channel that experienced the highest is output to the first page. This allows theuser to understand the overall problem at the survey site. Voltage and current time plots are presented as well as each channel’s initial waveform.
• The report is very easy to use. The Site Summary gives you an overview of the data and theanalysis. Graphs such as those below show additional data from the survey period.
Electro Industries/GaugeTech Doc # E132-7-01-202 5-1
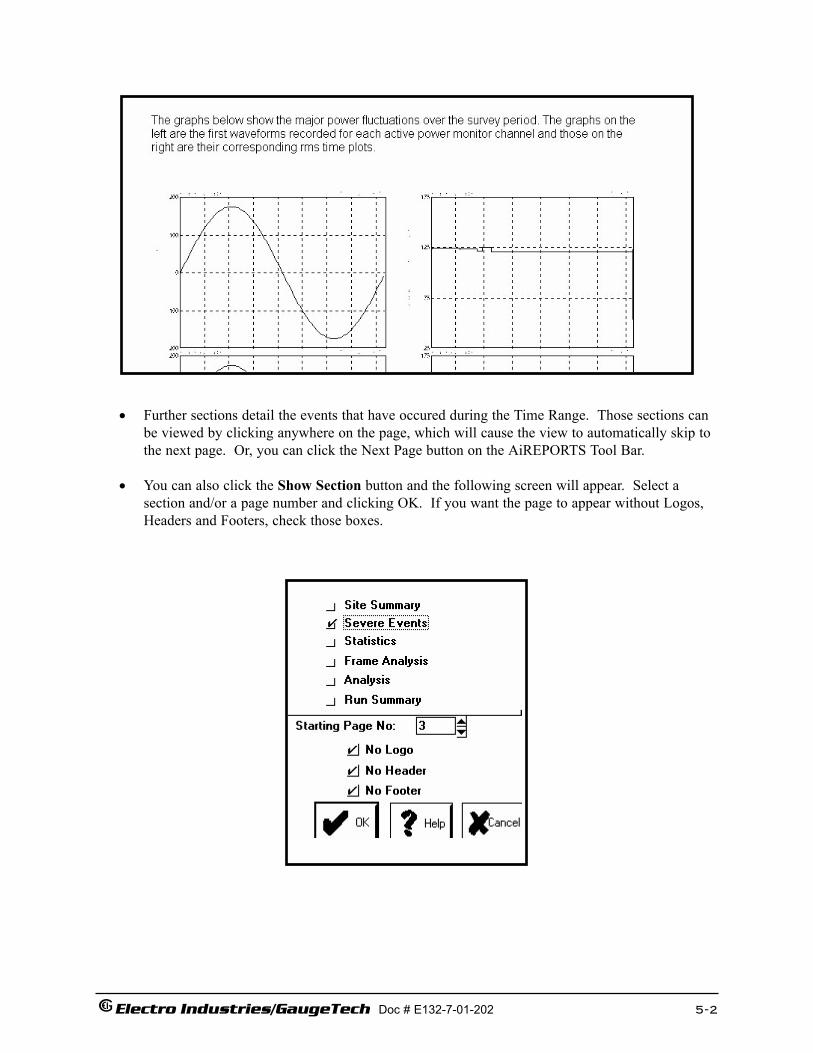
• Further sections detail the events that have occured during the Time Range. Those sections canbe viewed by clicking anywhere on the page, which will cause the view to automatically skip tothe next page. Or, you can click the Next Page button on the AiREPORTS Tool Bar.
• You can also click the Show Section button and the following screen will appear. Select a section and/or a page number and clicking OK. If you want the page to appear without Logos,Headers and Footers, check those boxes.
Electro Industries/GaugeTech Doc # E132-7-01-202 5-2
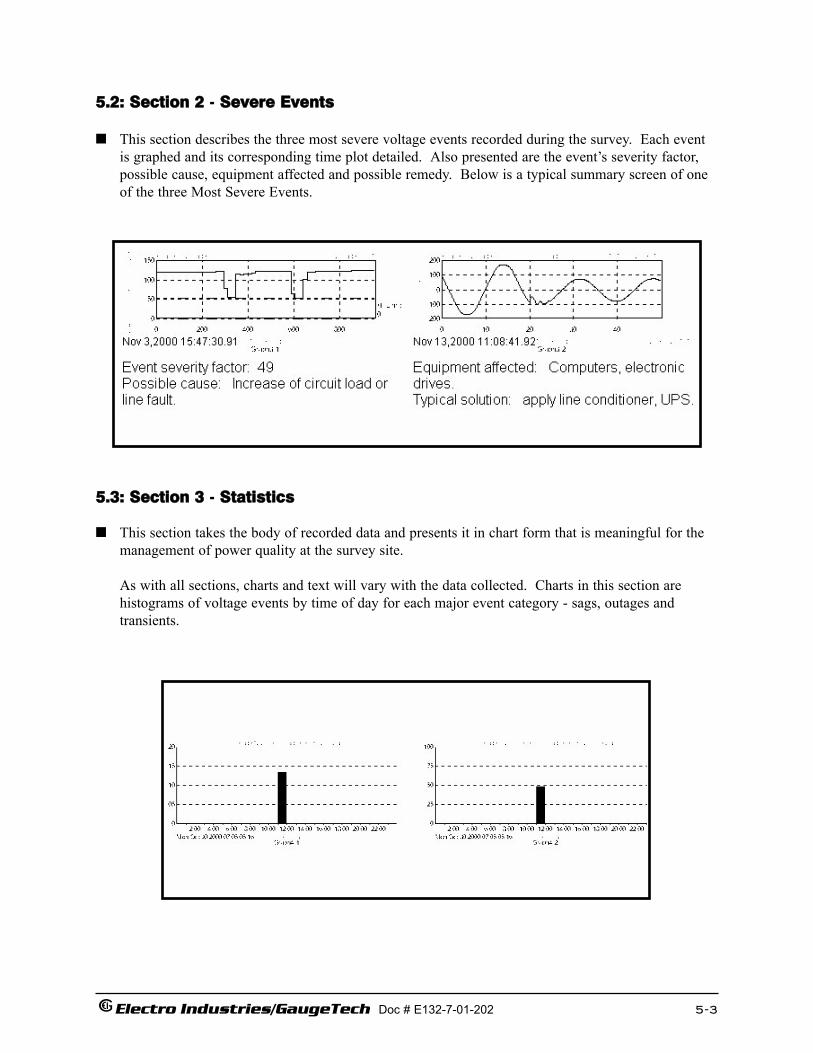
5.2: Section 2 - Severe Events
This section describes the three most severe voltage events recorded during the survey. Each eventis graphed and its corresponding time plot detailed. Also presented are the event’s severity factor,possible cause, equipment affected and possible remedy. Below is a typical summary screen of oneof the three Most Severe Events.
5.3: Section 3 - Statistics
This section takes the body of recorded data and presents it in chart form that is meaningful for themanagement of power quality at the survey site.
As with all sections, charts and text will vary with the data collected. Charts in this section are histograms of voltage events by time of day for each major event category - sags, outages and transients.
Electro Industries/GaugeTech Doc # E132-7-01-202 5-3
If the survey duration were greater than twenty four hours, a graph showing “average” frequency ofoccurence by time of day would be presented. Each of the histograms would have a correspondinghistogram showing, instread of frequency of occurence, the severity factor by time of day. This allows the user to determine the time of day when events occur most frequently and when they are most destructive.
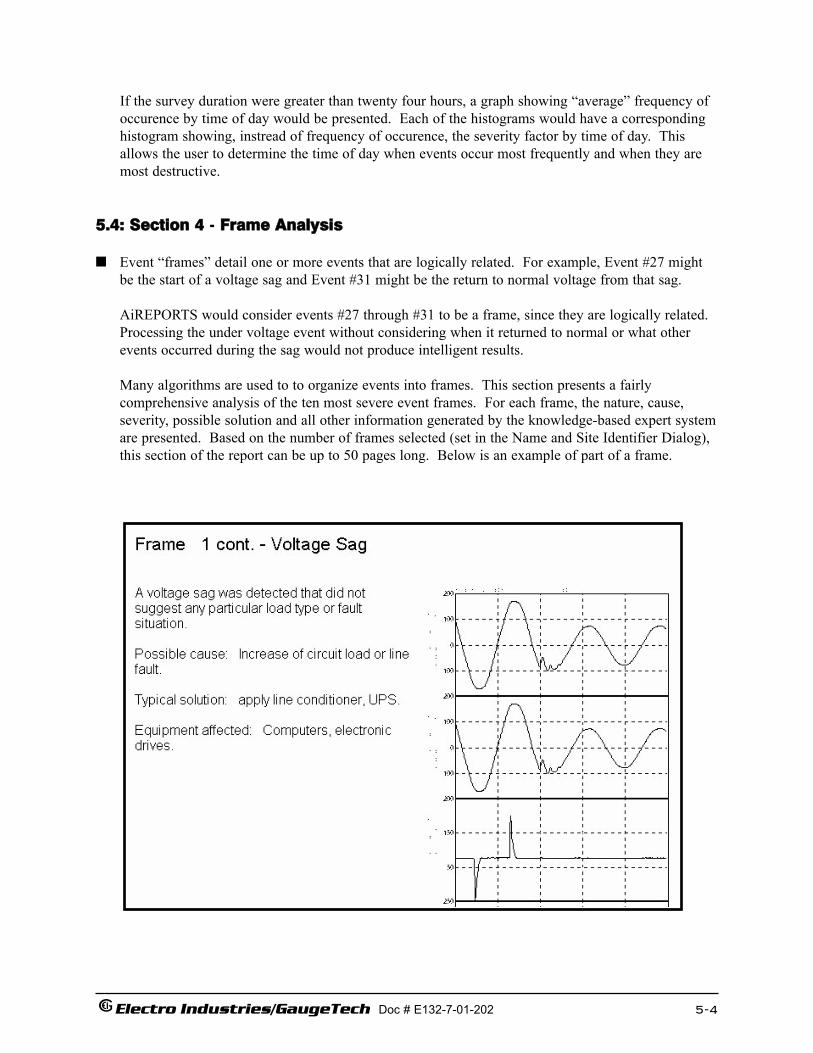
5.4: Section 4 - Frame Analysis
Event “frames” detail one or more events that are logically related. For example, Event #27 mightbe the start of a voltage sag and Event #31 might be the return to normal voltage from that sag.
AiREPORTS would consider events #27 through #31 to be a frame, since they are logically related.Processing the under voltage event without considering when it returned to normal or what otherevents occurred during the sag would not produce intelligent results.
Many algorithms are used to to organize events into frames. This section presents a fairly comprehensive analysis of the ten most severe event frames. For each frame, the nature, cause,severity, possible solution and all other information generated by the knowledge-based expert systemare presented. Based on the number of frames selected (set in the Name and Site Identifier Dialog),this section of the report can be up to 50 pages long. Below is an example of part of a frame.
Electro Industries/GaugeTech Doc # E132-7-01-202 5-4

5.5: Section 5 - Power Analysis
Section Three focuses on the analysis of classical power disturbances such as voltage sags, outages and transients. This section focuses on the presentation and analysis of other power parameterssuch as voltage unbalance, circuit impedance, harmonics, zero crossing errors and voltage notches.The following is a example of such an analysis:
Electro Industries/GaugeTech Doc # E132-7-01-202 5-5
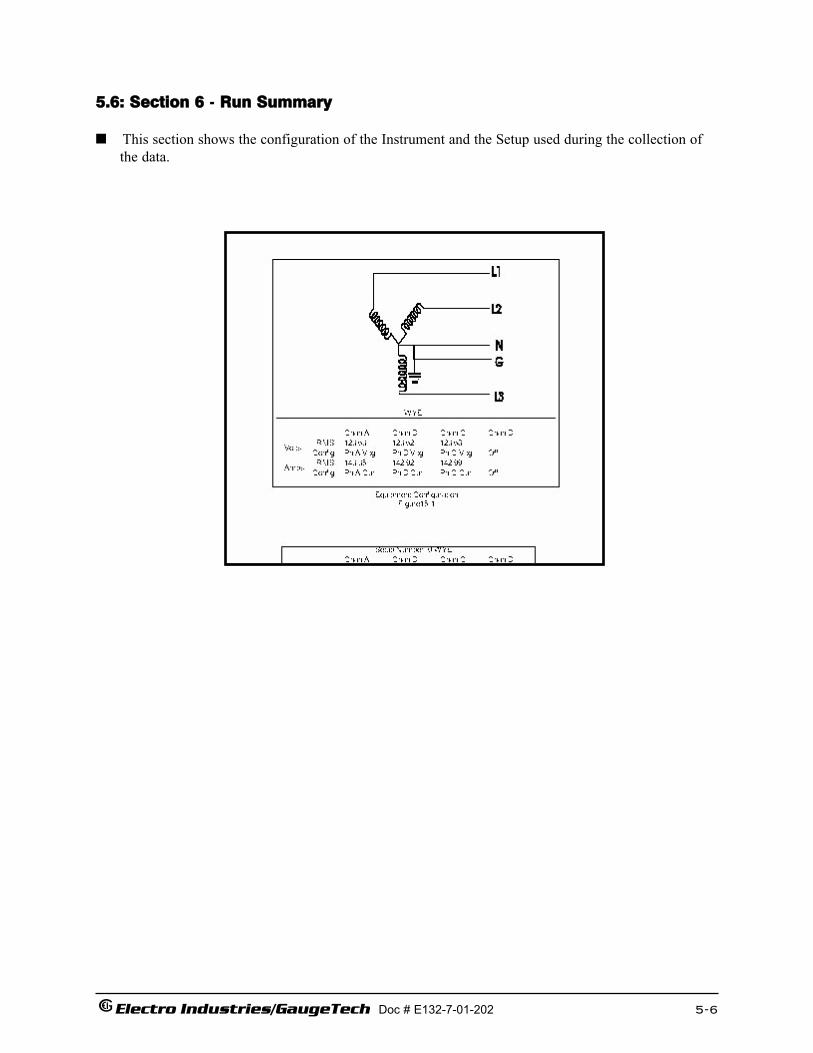
5.6: Section 6 - Run Summary
This section shows the configuration of the Instrument and the Setup used during the collection ofthe data.
Electro Industries/GaugeTech Doc # E132-7-01-202 5-6
Chapter 6AiREPORTS Toolbars
At the top of every AiREPORTS screen there is an Icon Tool Bar (also known as a Button or SpeedBar) which contains 7 buttons marked Open, Next Page, Previous Section, View Page, Print andExport. In addition, on the Menu Bar at the top of the window are the menu buttons File, Edit,Report, View and Help. All of the functions and their access methods are detailed below.
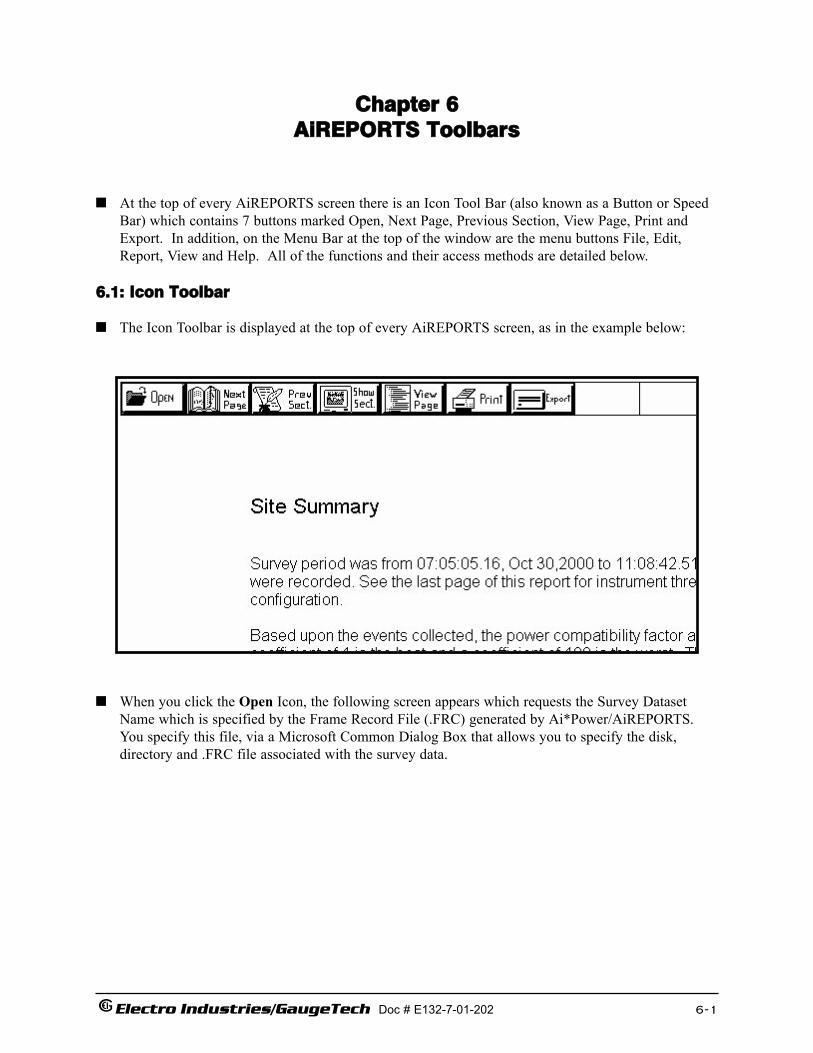
6.1: Icon Toolbar
The Icon Toolbar is displayed at the top of every AiREPORTS screen, as in the example below:
When you click the Open Icon, the following screen appears which requests the Survey DatasetName which is specified by the Frame Record File (.FRC) generated by Ai*Power/AiREPORTS.You specify this file, via a Microsoft Common Dialog Box that allows you to specify the disk, directory and .FRC file associated with the survey data.
Electro Industries/GaugeTech Doc # E132-7-01-202 6-1
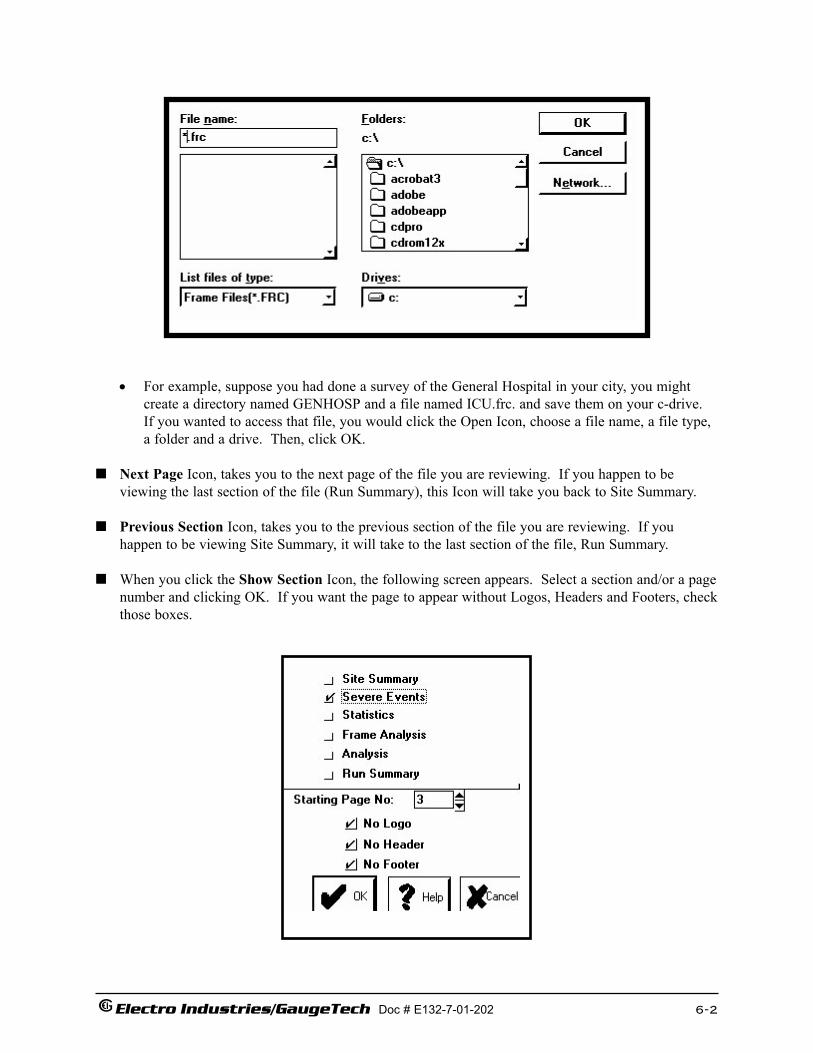
• For example, suppose you had done a survey of the General Hospital in your city, you mightcreate a directory named GENHOSP and a file named ICU.frc. and save them on your c-drive.If you wanted to access that file, you would click the Open Icon, choose a file name, a file type,a folder and a drive. Then, click OK.
Next Page Icon, takes you to the next page of the file you are reviewing. If you happen to be viewing the last section of the file (Run Summary), this Icon will take you back to Site Summary.
Previous Section Icon, takes you to the previous section of the file you are reviewing. If you happen to be viewing Site Summary, it will take to the last section of the file, Run Summary.
When you click the Show Section Icon, the following screen appears. Select a section and/or a pagenumber and clicking OK. If you want the page to appear without Logos, Headers and Footers, checkthose boxes.
Electro Industries/GaugeTech Doc # E132-7-01-202 6-2
Electro Industries/GaugeTech Doc # E132-7-01-202 6-3
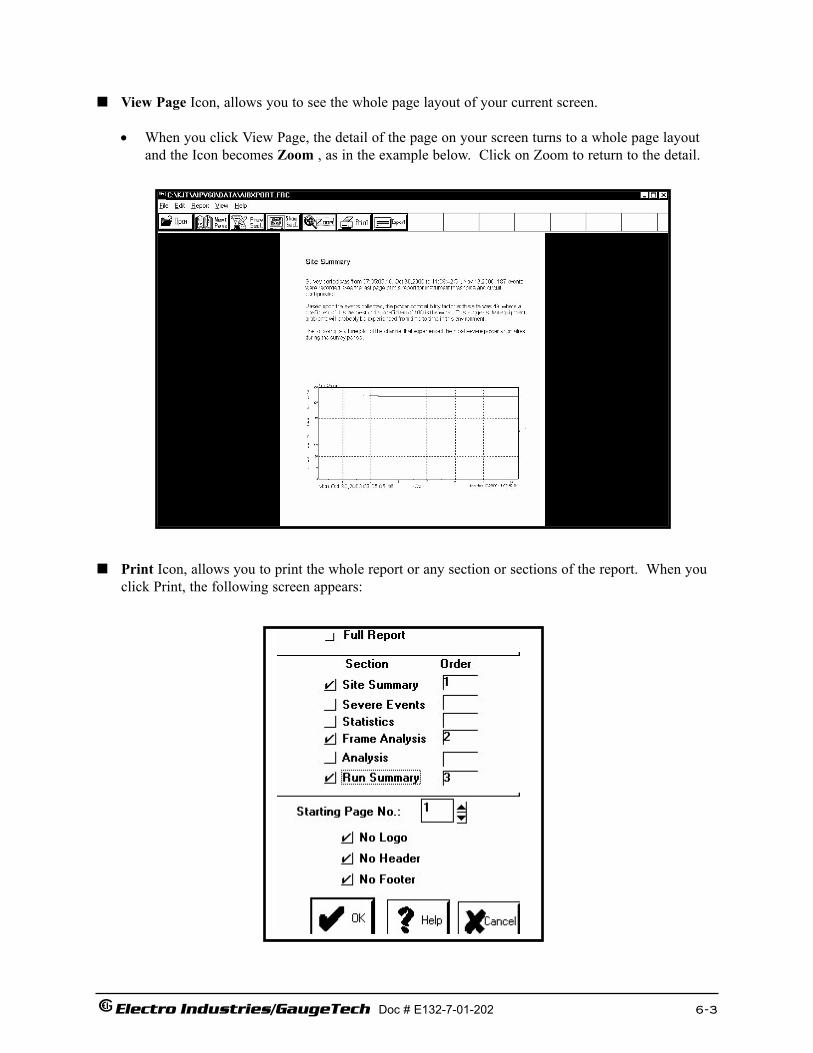
View Page Icon, allows you to see the whole page layout of your current screen.
• When you click View Page, the detail of the page on your screen turns to a whole page layoutand the Icon becomes Zoom , as in the example below. Click on Zoom to return to the detail.
Print Icon, allows you to print the whole report or any section or sections of the report. When youclick Print, the following screen appears:

Electro Industries/GaugeTech Doc # E132-7-01-202 6-4
• Check the box in front of Full Report (default screen) or check the box or boxes in front of thesections you wish to include in the print run. The order boxes behind each section will displayorder numbers, when they are selected. Select a page number, if it should be different from theone shown. If you do not want Logos, Headers and Footers, check those boxes. Click OK.
Export Icon allows you to export the whole report or any section or sections of the report. Whenyou click Export, the following screen appears:
• Check the box by Full Report (default screen) or check the box(es) in front of the sections you wish to export. Select a page number, if it should be different from the one shown. If you donot want Logos, Headers and Footers, check those boxes. Click OK. The following appears:
Electro Industries/GaugeTech Doc # E132-7-01-202 6-5
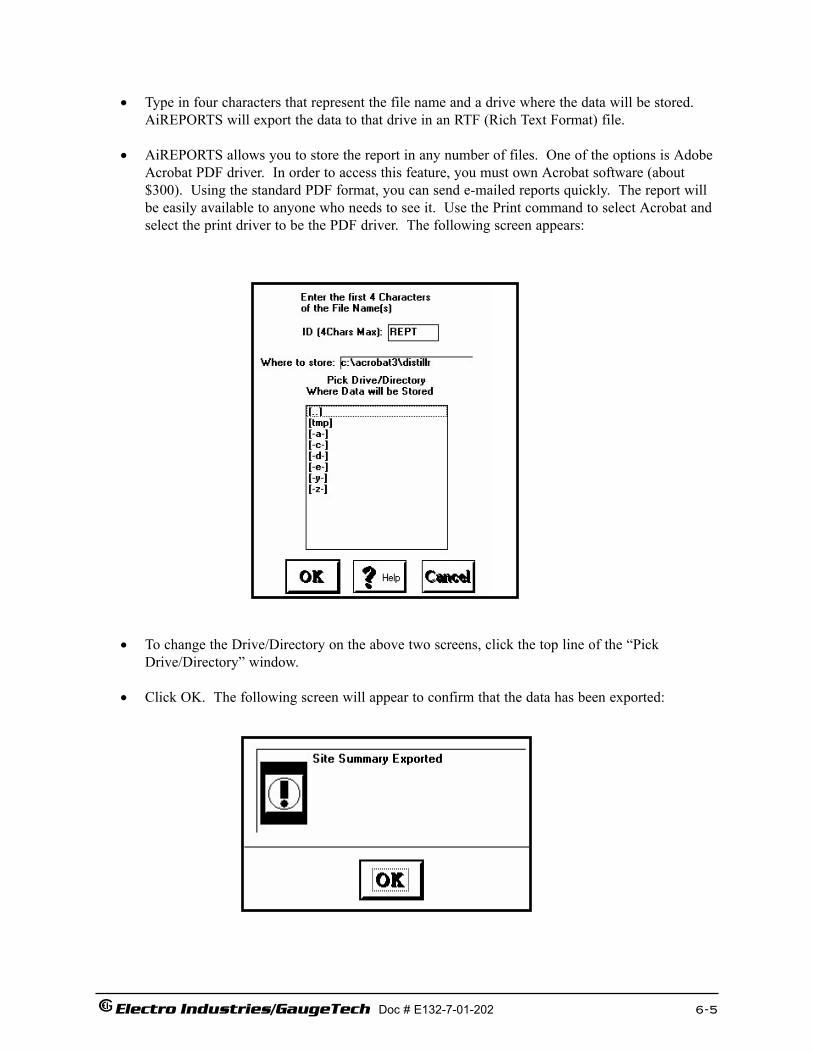
• Type in four characters that represent the file name and a drive where the data will be stored. AiREPORTS will export the data to that drive in an RTF (Rich Text Format) file.
• AiREPORTS allows you to store the report in any number of files. One of the options is AdobeAcrobat PDF driver. In order to access this feature, you must own Acrobat software (about $300). Using the standard PDF format, you can send e-mailed reports quickly. The report will be easily available to anyone who needs to see it. Use the Print command to select Acrobat and select the print driver to be the PDF driver. The following screen appears:
• To change the Drive/Directory on the above two screens, click the top line of the “Pick Drive/Directory” window.
• Click OK. The following screen will appear to confirm that the data has been exported:
Electro Industries/GaugeTech Doc # E132-7-01-202 6-6
6.2: Menu Toolbar
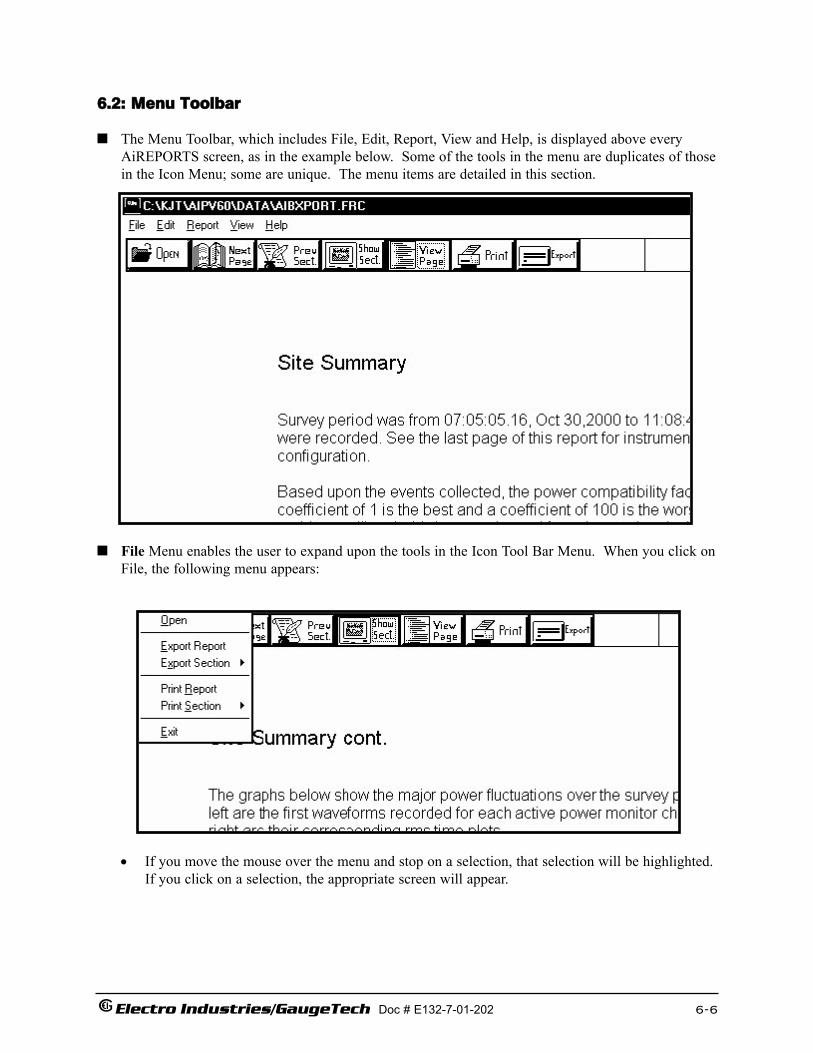
The Menu Toolbar, which includes File, Edit, Report, View and Help, is displayed above everyAiREPORTS screen, as in the example below. Some of the tools in the menu are duplicates of thosein the Icon Menu; some are unique. The menu items are detailed in this section.
File Menu enables the user to expand upon the tools in the Icon Tool Bar Menu. When you click onFile, the following menu appears:
• If you move the mouse over the menu and stop on a selection, that selection will be highlighted.If you click on a selection, the appropriate screen will appear.
Electro Industries/GaugeTech Doc # E132-7-01-202 6-7
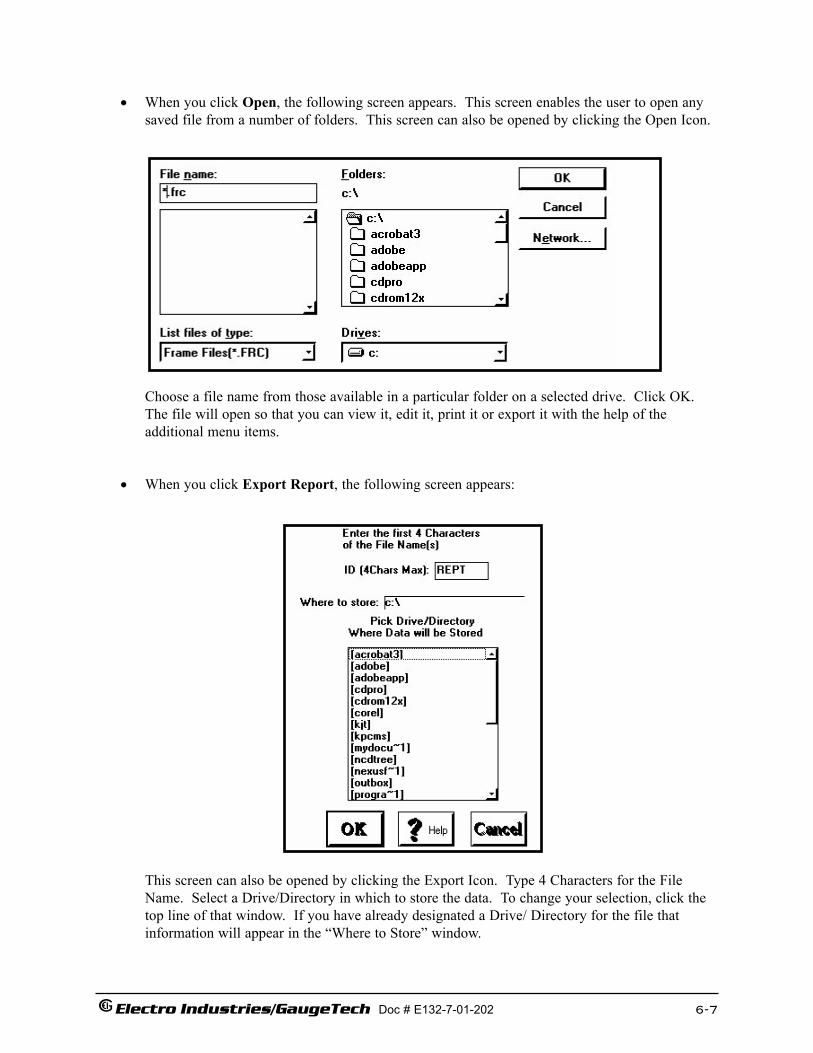
• When you click Open, the following screen appears. This screen enables the user to open any saved file from a number of folders. This screen can also be opened by clicking the Open Icon.
Choose a file name from those available in a particular folder on a selected drive. Click OK. The file will open so that you can view it, edit it, print it or export it with the help of the additional menu items.
• When you click Export Report, the following screen appears:
This screen can also be opened by clicking the Export Icon. Type 4 Characters for the File Name. Select a Drive/Directory in which to store the data. To change your selection, click the top line of that window. If you have already designated a Drive/ Directory for the file that information will appear in the “Where to Store” window.
Electro Industries/GaugeTech Doc # E132-7-01-202 6-8
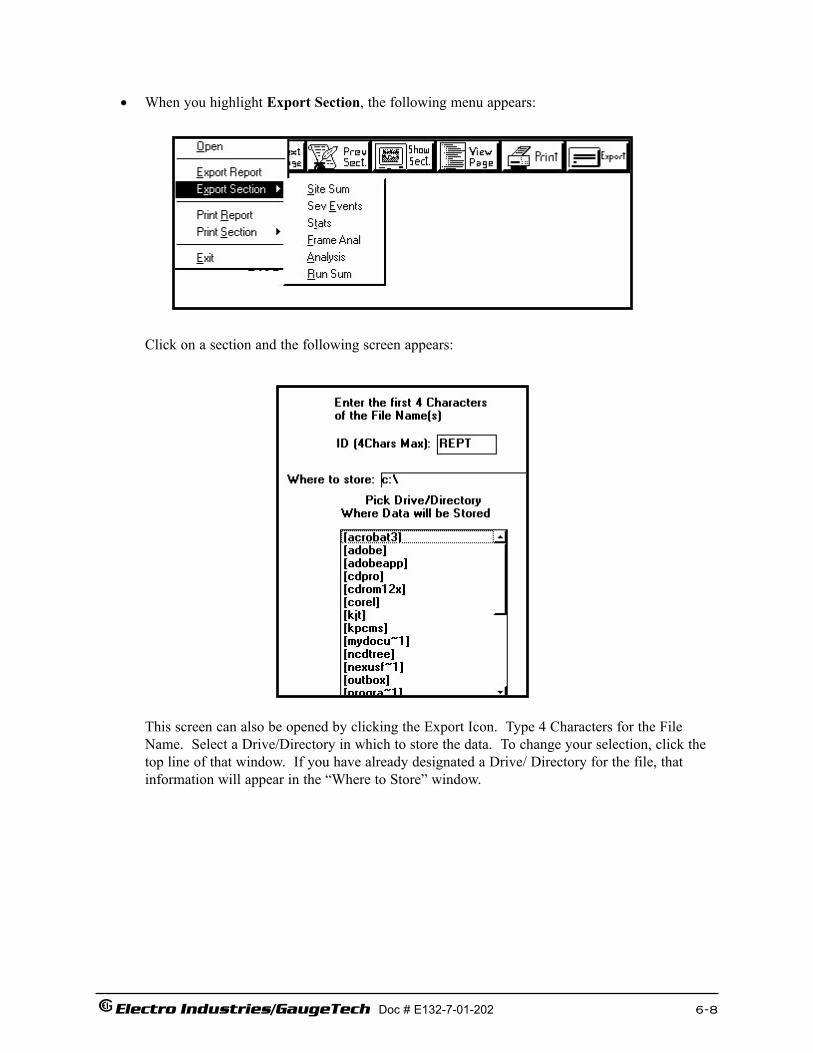
• When you highlight Export Section, the following menu appears:
Click on a section and the following screen appears:
This screen can also be opened by clicking the Export Icon. Type 4 Characters for the File Name. Select a Drive/Directory in which to store the data. To change your selection, click the top line of that window. If you have already designated a Drive/ Directory for the file, that information will appear in the “Where to Store” window.
Electro Industries/GaugeTech Doc # E132-7-01-202 6-9
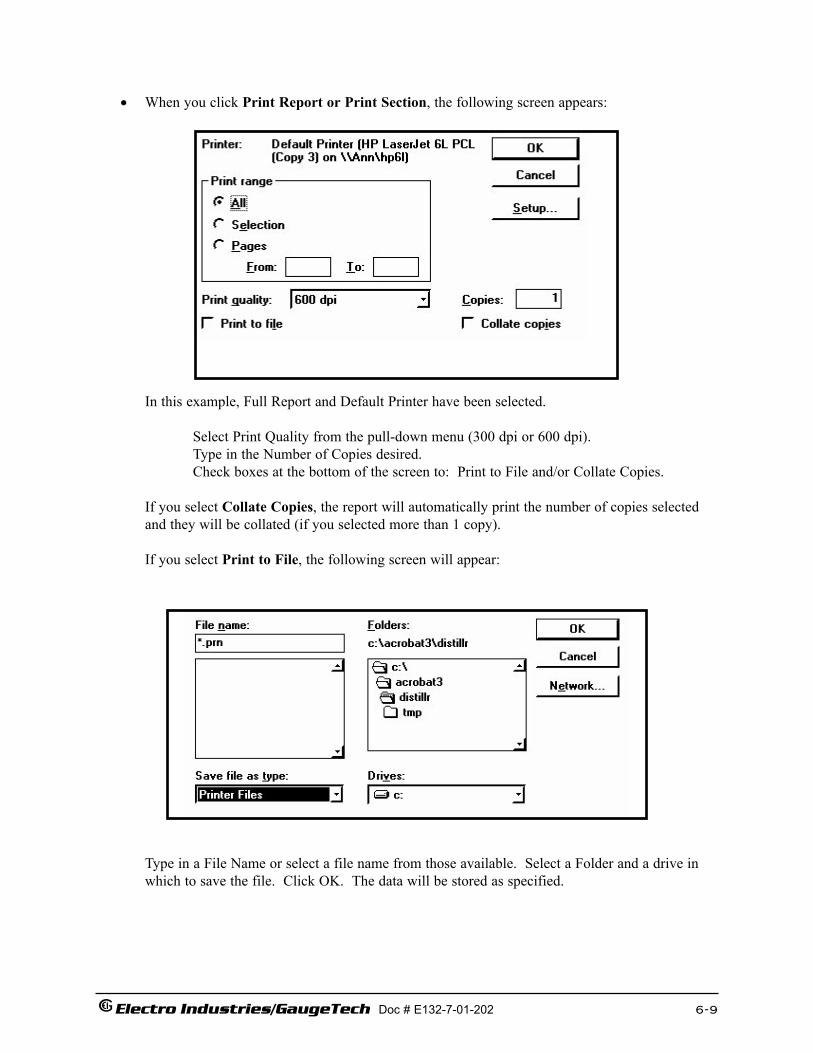
• When you click Print Report or Print Section, the following screen appears:
In this example, Full Report and Default Printer have been selected.
Select Print Quality from the pull-down menu (300 dpi or 600 dpi).Type in the Number of Copies desired.Check boxes at the bottom of the screen to: Print to File and/or Collate Copies.
If you select Collate Copies, the report will automatically print the number of copies selected and they will be collated (if you selected more than 1 copy).
If you select Print to File, the following screen will appear:
Type in a File Name or select a file name from those available. Select a Folder and a drive in which to save the file. Click OK. The data will be stored as specified.
Electro Industries/GaugeTech Doc # E132-7-01-202 6-10
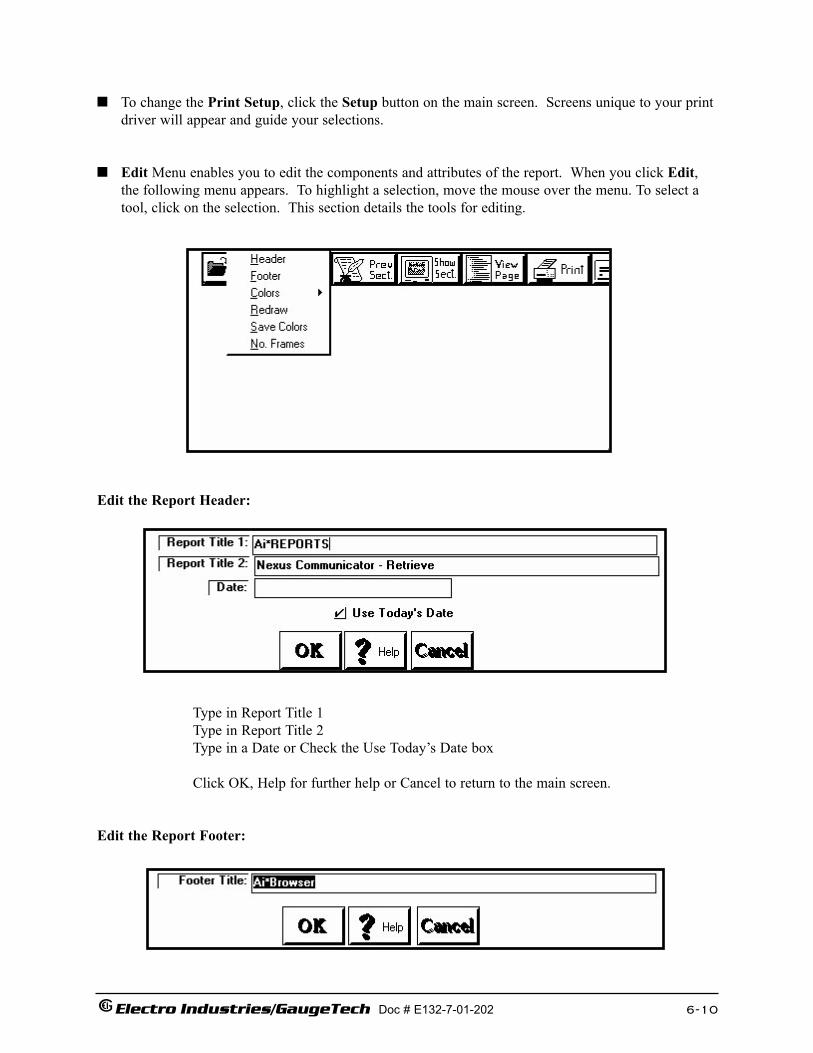
To change the Print Setup, click the Setup button on the main screen. Screens unique to your printdriver will appear and guide your selections.
Edit Menu enables you to edit the components and attributes of the report. When you click Edit,the following menu appears. To highlight a selection, move the mouse over the menu. To select atool, click on the selection. This section details the tools for editing.
Edit the Report Header:
Type in Report Title 1Type in Report Title 2Type in a Date or Check the Use Today’s Date box
Click OK, Help for further help or Cancel to return to the main screen.
Edit the Report Footer:
Electro Industries/GaugeTech Doc # E132-7-01-202 6-11
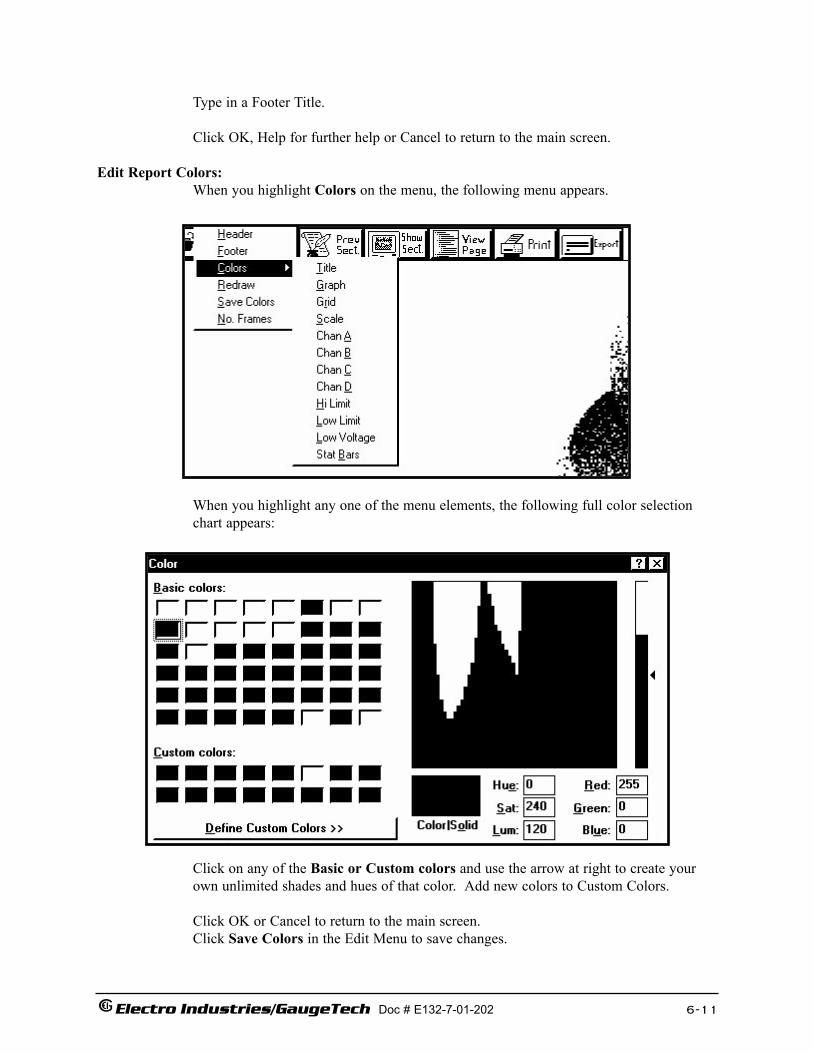
Type in a Footer Title.
Click OK, Help for further help or Cancel to return to the main screen.
Edit Report Colors:When you highlight Colors on the menu, the following menu appears.
When you highlight any one of the menu elements, the following full color selection chart appears:
Click on any of the Basic or Custom colors and use the arrow at right to create your own unlimited shades and hues of that color. Add new colors to Custom Colors.
Click OK or Cancel to return to the main screen. Click Save Colors in the Edit Menu to save changes.
Redraw is simply a Refresh button for the program.
Save Colors saves the Custom Colors you have selected in the Edit Colors feature.
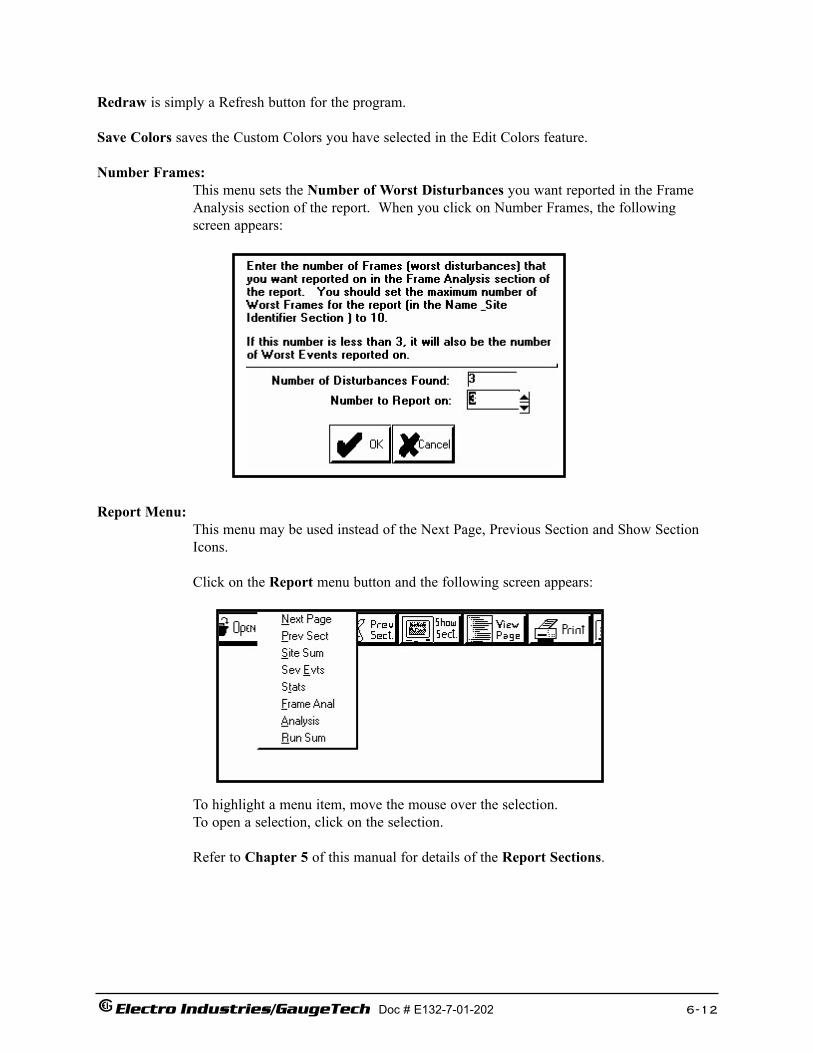
Number Frames:This menu sets the Number of Worst Disturbances you want reported in the Frame Analysis section of the report. When you click on Number Frames, the following screen appears:
Electro Industries/GaugeTech Doc # E132-7-01-202 6-12
Report Menu:This menu may be used instead of the Next Page, Previous Section and Show Section Icons.
Click on the Report menu button and the following screen appears:
To highlight a menu item, move the mouse over the selection. To open a selection, click on the selection.
Refer to Chapter 5 of this manual for details of the Report Sections.
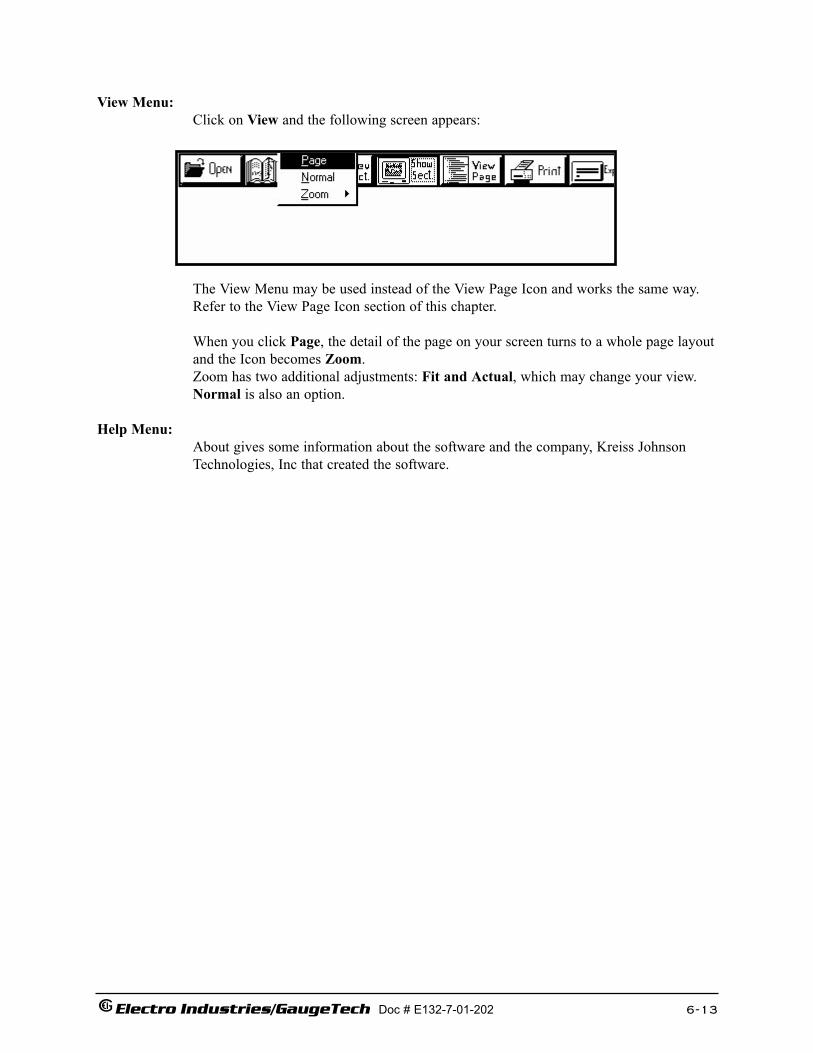
View Menu:Click on View and the following screen appears:
Electro Industries/GaugeTech Doc # E132-7-01-202 6-13
The View Menu may be used instead of the View Page Icon and works the same way. Refer to the View Page Icon section of this chapter.
When you click Page, the detail of the page on your screen turns to a whole page layoutand the Icon becomes Zoom. Zoom has two additional adjustments: Fit and Actual, which may change your view.Normal is also an option.
Help Menu:About gives some information about the software and the company, Kreiss Johnson Technologies, Inc that created the software.