user bulletin #2 - applied biosystems bulletin #2 abi p rism 7700 sequence detection system ......
TRANSCRIPT

User Bulletin #2ABI PRISM 7700 Sequence Detection System
December 11, 1997 (updated 10/2001)
SUBJECT: Relative Quantitation of Gene Expression
Introduction Amplification of an endogenous control may be performed to standardize the amount of sample RNA or DNA added to a reaction. For the quantitation of gene expression, researchers have used ß-actin, glyceraldehyde-3-phosphate dehydrogenase (GAPDH), ribosomal RNA (rRNA), or other RNAs as this endogenous control.
Relative quantitation with data from the ABI PRISM® 7700 Sequence Detection System (using version 1.6 software) can be performed using the standard curve method or the comparative method.
The availability of distinguishable reporter dyes for the ABI PRISM 7700 Sequence Detection System makes it possible to amplify and detect the target amplicon and the endogenous control amplicon in the same tube (multiplex polymerase chain reaction [PCR]).
Contents This user bulletin describes the following:
� How to use data from amplifications run in separate tubes to illustrate relative quantitation of a target message normalized with an endogenous control. The basic mechanics and mathematics of relative quantitation are presented.
� How the target and endogenous controls can be amplified in the same tube and compared with results of the separate-tube method.
Topic See page
Relative Quantitation of Gene Expression 1
Standard Curve Method (Separate Tubes) 3
Comparative CT Method (Separate Tubes) 11
Multiplex PCR (Same Tube) 16
Summary 24
Methods 25
cDNA Synthesis 25
c-myc and GAPDH Amplified in Separate Tubes 27
Limiting Primer Determination 30
c-myc and GAPDH Amplified in the Same Tube 32
Standard Deviation Calculation Using the Standard Curve Method 34
Standard Deviation Calculation Using the Comparative Method 35

Terms Defined The following definitions are assumed in this description of relative quantitation.
Controls/Terms Definitions
Standard A sample of known concentration used to construct a standard curve.
Reference A passive or active signal used to normalize experimental results. Endogenous and exogenous controls are examples of active references. Active reference means the signal is generated as the result of PCR amplification. The active reference has its own set of primers and probe.
� Endogenous control – This is an RNA or DNA that is present in each experimental sample as isolated. By using an endogenous control as an active reference, you can normalize quantitation of a messenger RNA (mRNA) target for differences in the amount of total RNA added to each reaction.
� Exogenous control – This is a characterized RNA or DNA spiked into each sample at a known concentration. An exogenous active reference is usually an in vitro construct that can be used as an internal positive control (IPC) to distinguish true target negatives from PCR inhibition. An exogenous reference can also be used to normalize for differences in efficiency of sample extraction or complementary DNA (cDNA) synthesis by reverse transcriptase.
Whether or not an active reference is used, it is important to use a passive reference containing the dye ROX in order to normalize for non-PCR-related fluctuations in fluorescence signal.
Calibrator A sample used as the basis for comparative results.
Page 2 of 36 User Bulletin #2: ABI PRISM 7700 Sequence Detection System
Standard Curve Method (Separate Tubes)
Absolute StandardCurve
It is possible to use the ABI PRISM 7700 Sequence Detector data to obtain absolute quantitation, but it requires that the absolute quantities of the standard be known by some independent means. Plasmid DNA or in vitro transcribed RNA are commonly used to prepare absolute standards. Concentration is measured by A260 and converted to the number of copies using the molecular weight of the DNA or RNA.
The following critical points must be considered for the proper use of absolute standard curves:
� It is important that the DNA or RNA be a single, pure species. For example, plasmid DNA prepared from E. coli often is contaminated with RNA, which increases the A260 measurement and inflates the copy number determined for the plasmid.
� Accurate pipetting is required because the standards must be diluted over several orders of magnitude. Plasmid DNA or in vitro transcribed RNA must be concentrated in order to measure an accurate A260 value. This concentrated DNA or RNA must then be diluted 106–1012 -fold to be at a concentration similar to the target in biological samples.
� The stability of the diluted standards must be considered, especially for RNA. Divide diluted standards into small aliquots, store at -80°C, and thaw only once before use. An example of the effort required to generate trustworthy standards is provided by Collins et al. (Anal. Biochem. 226:120-129, 1995), who report on the steps they used in developing an absolute RNA standard for viral quantitation.
� It is generally not possible to use DNA as a standard for absolute quantitation of RNA because there is no control for the efficiency of the reverse transcription step.
Relative StandardCurve
It is easy to prepare standard curves for relative quantitation because quantity is expressed relative to some basis sample, such as the calibrator. For all experimental samples, target quantity is determined from the standard curve and divided by the target quantity of the calibrator. Thus, the calibrator becomes the 1× sample, and all other quantities are expressed as an n-fold difference relative to the calibrator. As an example, in a study of drug effects on expression, the untreated control would be an appropriate calibrator.
Because the sample quantity is divided by the calibrator quantity, the unit from the standard curve drops out. Thus, all that is required of the standards is that their relative dilutions be known. For relative quantitation, this means any stock RNA or DNA containing the appropriate target can be used to prepare standards.
The following critical points must be considered for the proper use of relative standard curves:
� It is important that stock RNA or DNA be accurately diluted, but the units used to express this dilution are irrelevant. If two-fold dilutions of a total RNA preparation from a control cell line are used to construct a standard curve, the units could be the dilution values 1, 0.5, 0.25, 0.125, and so on. By using the same stock RNA or DNA to prepare standard curves for multiple plates, the relative quantities determined can be compared across the plates.
� It is possible to use a DNA standard curve for relative quantitation of RNA. Doing this requires the assumption that the reverse transcription efficiency of the target
User Bulletin #2: ABI PRISM 7700 Sequence Detection System Page 3 of 36

is the same in all samples, but the exact value of this efficiency need not be known.
� For quantitation normalized to an endogenous control, standard curves are prepared for both the target and the endogenous reference. For each experimental sample, the amount of target and endogenous reference is determined from the appropriate standard curve. Then, the target amount is divided by the endogenous reference amount to obtain a normalized target value.
Again, one of the experimental samples is the calibrator, or 1× sample. Each of the normalized target values is divided by the calibrator normalized target value to generate the relative expression levels.
Relative StandardCurve Example
To illustrate the use of standard curves for relative quantitation, the following example is used: the target is human c-myc mRNA and the endogenous control is human GAPDH mRNA. See the “Methods” section on page 25 for details. Specific instructions for using the standard curve method are in “Constructing a Relative Standard Curve” on page 7.
Plate Setup
Figure 1 shows the plate setup for the relative quantitation of the c-myc mRNA where the target and endogenous reference are amplified in separate tubes. Rows A–D contain c-myc-specific primers and a FAM-labeled c-myc probe. Figure 2 on page 5 shows the plate setup for GAPDH mRNA. Rows E–H contain GAPDH-specific primers and a JOE-labeled probe (TaqMan® GAPDH Control Reagents, P/N 402869).
Dilutions of a cDNA sample prepared from Raji total RNA are used to construct standard curves for the c-myc and the GAPDH amplifications. The unknown samples are cDNA prepared from total RNA isolated from human brain, kidney, liver, and lung.
Figure 1. Plate setup for relative quantitation of the c-myc mRNA on FAM layer
Page 4 of 36 User Bulletin #2: ABI PRISM 7700 Sequence Detection System

Figure 2. Plate setup for GAPDH mRNA
Setting Thresholds
After performing the PCR, choose separate thresholds on the FAM and JOE layers (Figures 3 and 4 on page 6) by performing the following steps.
Step Action
1 Select Analyze from the Analysis menu.
2 Examine the semi-log view of the amplification plots.
3 Adjust the default baseline setting to accommodate the earliest amplification plot.
4 Select a threshold above the noise close to the baseline but still in the linear region of the semi-log plot. Click and drag the threshold line to set the threshold.
User Bulletin #2: ABI PRISM 7700 Sequence Detection System Page 5 of 36

Figure 3. Set the threshold on the FAM layer by examining the semi-log view of the amplification plot. Note that the baseline setting has been adjusted to stop at cycle 22.
Figure 4. Set the threshold on the JOE layer by examining the semi-log view of the amplification plot. Note that the baseline setting has been adjusted to stop at cycle 16.
Page 6 of 36 User Bulletin #2: ABI PRISM 7700 Sequence Detection System

Constructing a Relative Standard Curve
The ABI PRISM 7700 Sequence Detection System (version 1.6 software) is not designed to construct two standard curves on the same plate. To analyze this experiment, Results are exported to an Excel spreadsheet by choosing the Export option in the File menu. The exported file contains columns with the sample well number, sample description, standard deviation of the baseline, ∆Rn, and CT. The FAM information is reported first with the JOE information in the rows under the FAM data. The important parameter for quantitation is the CT.
Set up three columns as shown below listing the input amount for the standard curve samples, the log of this input amount, and the CT value.
Perform the following steps in Excel to construct a standard curve from your data.
Step Action
1 Select the log input and CT data as shown below.
2 Using the Excel Chart Wizard, draw an XY (scatter) plot on the work sheet with the log input amount as the X values and CT as the Y values.
Note The plotted graph shows the data points in a graphical view.
3 Click one of the data points that appears in graphical view to select it.
4 Open the Insert menu and select Trendline to plot a line through the data point.
5 Go to the Type page and select Linear regression.
6 Go to the Options page and select the boxes for Display Equation on Chart and Display R-squared Value on Chart.
7 Compare your chart to Figure 5 on page 8.
User Bulletin #2: ABI PRISM 7700 Sequence Detection System Page 7 of 36

Figure 5. The standard curve for the amplification of the c-myc target detected using a FAM-labeled probe.
Calculating the Input Amount
Perform the following steps to calculate the input amount for unknown samples.
Step Action
1 For the line shown in Figure 5, calculate the log input amount by entering the following formula in one cell of the work sheet:
= ([cell containing CT value] –b)/m
b = y-intercept of standard curve line
m = slope of standard curve line
Note In Figure 5, b = 25.712 and m = -3.385 for the equation y = mx + b.
2 Calculate the input amount by entering the following formula in an adjacent cell:
= 10^ [cell containing log input amount]
Note The units of the calculated amount are the same as the units used to construct the standard curve, which are nanograms of Total Raji RNA. If it is calculated that an unknown has 0.23 ng of Total Raji RNA, then the sample contains the same amount of c-myc mRNA found in 0.23 ng of the Raji Control RNA.
3 Repeat the steps to construct a standard curve for the endogenous reference using the CT values determined with the JOE-labeled GAPDH probe. Refer to Table 1 on page 10.
4 Because c-myc and GAPDH are amplified in separate tubes, average the c-myc and GAPDH values separately.
5 Divide the amount of c-myc by the amount of GAPDH to determine the normalized amount of c-myc (c-mycN).
Page 8 of 36 User Bulletin #2: ABI PRISM 7700 Sequence Detection System
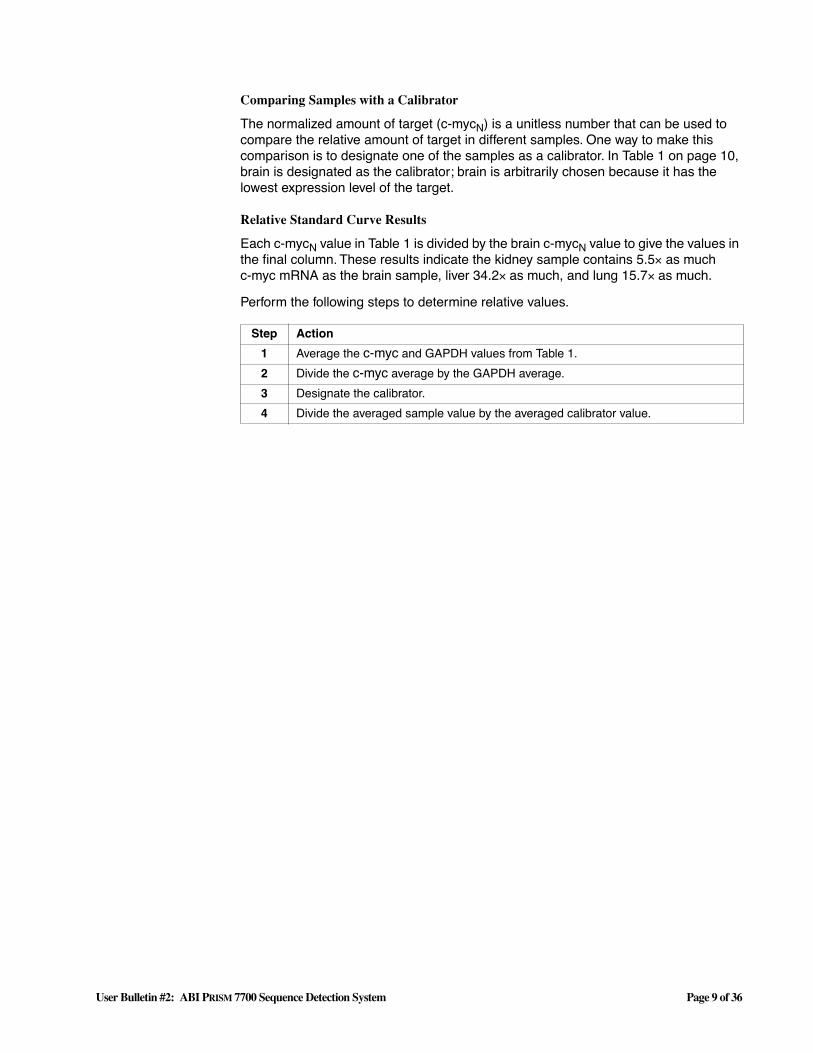
Comparing Samples with a Calibrator
The normalized amount of target (c-mycN) is a unitless number that can be used to compare the relative amount of target in different samples. One way to make this comparison is to designate one of the samples as a calibrator. In Table 1 on page 10, brain is designated as the calibrator; brain is arbitrarily chosen because it has the lowest expression level of the target.
Relative Standard Curve Results
Each c-mycN value in Table 1 is divided by the brain c-mycN value to give the values in the final column. These results indicate the kidney sample contains 5.5× as much c-myc mRNA as the brain sample, liver 34.2× as much, and lung 15.7× as much.
Perform the following steps to determine relative values.
Step Action
1 Average the c-myc and GAPDH values from Table 1.
2 Divide the c-myc average by the GAPDH average.
3 Designate the calibrator.
4 Divide the averaged sample value by the averaged calibrator value.
User Bulletin #2: ABI PRISM 7700 Sequence Detection System Page 9 of 36

Table 1. Amounts of c-myc and GAPDH in Human Brain, Kidney, Liver, and Lung
Tissuec-myc
ng Total Raji RNAGAPDH
ng Total Raji RNAc-mycN
Norm. to GAPDHac-mycN
Rel. to Brainb
Brain 0.033 0.51
0.043 0.56
0.036 0.59
0.043 0.53
0.039 0.51
0.040 0.52
Average 0.039±0.004 0.54±0.034 0.07±0.008 1.0±0.12
Kidney 0.40 0.96
0.41 1.06
0.41 1.05
0.39 1.07
0.42 1.06
0.43 0.96
Average 0.41±0.016 1.02±0.052 0.40±0.025 5.5±0.35
Liver 0.67 0.29
0.66 0.28
0.70 0.28
0.76 0.29
0.70 0.26
0.68 0.27
Average 0.70±0.036 0.28±0.013 2.49±0.173 34.2±2.37
Lung 0.97 0.82
0.92 0.88
0.86 0.78
0.89 0.77
0.94 0.79
0.97 0.80
Average 0.93±0.044 0.81±0.041 1.15±0.079 15.7±1.09
a. The c-mycN value is determined by dividing the average c-myc value by the average GAPDH value. The standard deviation of the quotient is calculated from the standard deviations of the c-myc and GAPDH values. See “Standard Deviation Calculation Using the Standard Curve Method” on page 34.
b. The calculation of c-mycN relative to brain involves division by the calibrator value. This is division by an arbitrary constant, so the cv of this result is the same as the cv for c-mycN.
Page 10 of 36 User Bulletin #2: ABI PRISM 7700 Sequence Detection System

Comparative CT Method (Separate Tubes)
Similar to StandardCurve Method
The comparative CT method is similar to the standard curve method, except it uses arithmetic formulas to achieve the same result for relative quantitation.
Note It is possible to eliminate the use of standard curves for relative quantitation as long as a validation experiment is performed. See “Validation Experiment” on page 14.
Arithmetic Formulas The amount of target, normalized to an endogenous reference and relative to a calibrator, is given by:
2 –∆∆CT
Derivation of the Formula
The equation that describes the exponential amplification of PCR is:
where:
The threshold cycle (CT) indicates the fractional cycle number at which the amount of amplified target reaches a fixed threshold. Thus,
where:
Xn = number of target molecules at cycle n
Xo = initial number of target molecules
EX = efficiency of target amplification
n = number of cycles
XT = threshold number of target molecules
CT,X = threshold cycle for target amplification
KX = constant
Xn Xo 1( EX )+× n=
XT Xo 1( EX )+× CT X, KX==
User Bulletin #2: ABI PRISM 7700 Sequence Detection System Page 11 of 36

A similar equation for the endogenous reference reaction is:
where:
Dividing XT by RT gives the following expression:
The exact values of XT and RT depend on a number of factors, including:
� Reporter dye used in the probe
� Sequence context effects on the fluorescence properties of the probe
� Efficiency of probe cleavage
� Purity of the probe
� Setting of the fluorescence threshold.
Therefore, the constant K does not have to be equal to one.
Assuming efficiencies of the target and the reference are the same:
EX = ER = E,
or
where:
RT = threshold number of reference molecules
Ro = initial number of reference molecules
ER = efficiency of reference amplification
CT, R = threshold cycle for reference amplification
KR = constant
XN = Xo/Ro, the normalized amount of target
∆CT = CT,X - CT,R, the difference in threshold cycles for target and reference
RT Ro 1( ER )+× CT R, KR==
XT
RT-------
Xo 1( EX )CT X,+×
Ro 1( ER )CT R,+×
--------------------------------------------KX
KR------- K===
Xo
Ro------ 1( E ) K=
CT X, C– T R,+×
XN 1( E )CT∆
+× K=
Page 12 of 36 User Bulletin #2: ABI PRISM 7700 Sequence Detection System

Rearranging gives the following expression:
The final step is to divide the XN for any sample q by the XN for the calibrator (cb):
where:
For amplicons designed and optimized according to Applied Biosystems guidelines (amplicon size < 150 bp), the efficiency is close to one. Therefore, the amount of target, normalized to an endogenous reference and relative to a calibrator, is given by:
2 –∆∆CT
Relative Efficiency ofTarget andReference
For the ∆∆CT calculation to be valid, the efficiency of the target amplification and the efficiency of the reference amplification must be approximately equal. A sensitive method for assessing if two amplicons have the same efficiency is to look at how ∆CT varies with template dilution. The standard curves for c-myc and GAPDH used in the previous section provide the necessary data. Table 2 shows the average CT value for c-myc and GAPDH at different input amounts.
Figure 6 on page 14 shows a plot of log input amount versus ∆CT. If the efficiencies of the two amplicons are approximately equal, the plot of log input amount versus ∆CT has a slope of approximately zero.
∆∆CT = ∆CT,q – ∆CT,cb
XN K 1 E+( )CT∆–
×=
XN q,
XN cb,-------------- K 1( E )
CT q,∆–+×
K 1( E )CT cb,∆–
+×-------------------------------------------- 1(= E )
CT∆∆–+= =
Table 2. Average CT Value for c-myc and GAPDH at Different Input Amounts
Input Amountng Total RNA
c-mycAverage CT
GAPDHAverage CT
∆∆∆∆CTc-myc – GAPDH
1.0 25.59±0.04 22.64±0.03 2.95±0.05
0.5 26.77±0.09 23.73±0.05 3.04±0.10
0.2 28.14±0.05 25.12±0.10 3.02±0.11
0.1 29.18±0.13 26.16±0.02 3.01±0.13
0.05 30.14±0.03 27.17±0.06 2.97±0.07
0.02 31.44±0.16 28.62±0.10 2.82±0.19
0.01 32.42±0.12 29.45±0.08 2.97±0.14
User Bulletin #2: ABI PRISM 7700 Sequence Detection System Page 13 of 36

ValidationExperiment
Before using the ∆∆CT method for quantitation, perform a validation experiment like that in Figure 6 to demonstrate that efficiencies of target and reference are approximately equal. The absolute value of the slope of log input amount vs. ∆CT should be < 0.1. The slope in Figure 6 is 0.0492, which passes this test. Once this is proven, you can use the ∆∆CT calculation for the relative quantitation of target without running standard curves on the same plate.
If the efficiencies of the two systems are not equal, perform quantitation using the standard curve method. Alternatively, new primers can be designed and synthesized for the less efficient system to try to boost efficiency.
Figure 6. Plot of log input amount versus ∆CT
Page 14 of 36 User Bulletin #2: ABI PRISM 7700 Sequence Detection System

Comparative CTResults
The CT data used to determine the amounts of c-myc and GAPDH mRNA shown in Table 1 on page 10 are used to illustrate the ∆∆CT calculation. Table 3 shows the average CT results for the human brain, kidney, liver, and lung samples and how these CTs are manipulated to determine ∆CT, ∆∆CT, and the relative amount of c-myc mRNA. The results are comparable to the relative c-myc levels determined using the standard curve method.
Table 3. Relative Quantitation Using the Comparative CT Method
Tissuec-myc
Average CT
GAPDHAverage CT
∆∆∆∆CTc-myc–GAPDHa
a. The ∆CT value is determined by subtracting the average GAPDH CT value from the average c-myc CT value. The standard deviation of the difference is calculated from the standard deviations of the c-myc and GAPDH values. See “Standard Deviation Calculation Using the Comparative Method” on page 35.
∆∆∆∆∆∆∆∆CT∆∆∆∆CT–∆∆∆∆CT, Brain
b
b. The calculation of ∆∆CT involves subtraction by the ∆CT calibrator value. This is subtraction of an arbitrary constant, so the standard deviation of ∆∆CT is the same as the standard deviation of the ∆CT value.
c-mycNRel. to Brainc
c. The range given for c-mycN relative to brain is determined by evaluating the expression: 2 –∆∆CT
with ∆∆CT + s and ∆∆CT – s, where s = the standard deviation of the ∆∆CT value.
Brain 30.49±0.15 23.63±0.09 6.86±0.17 0.00±0.17 1.0(0.9–1.1)
Kidney 27.03±0.06 22.66±0.08 4.37±0.10 –2.50±0.10 5.6(5.3–6.0)
Liver 26.25±0.07 24.60±0.07 1.65±0.10 –5.21±0.10 37.0 (34.5–39.7)
Lung 25.83±0.07 23.01±0.07 2.81±0.10 –4.05±0.10 16.5 (15.4–17.7)
User Bulletin #2: ABI PRISM 7700 Sequence Detection System Page 15 of 36

Multiplex PCR (Same Tube)
Overview Multiplex PCR is the use of more than one primer pair in the same tube. You can use this method in relative quantitation where one primer pair amplifies the target and another primer pair amplifies the endogenous reference in the same tube. You can perform a multiplex reaction for both the standard curve method and the comparative method.
Dyes Available forTaqMan Probes
The availability of multiple reporter dyes for TaqMan® probes makes it possible to detect amplification of more than one target in the same tube. The reporter dyes currently recommended for probes are 6-FAM, TET, and JOE. These dyes are distinguishable from one another because they have different emission wavelength maxima:
� 6-FAM, λmax = 518 nm
� TET, λmax = 538 nm
� JOE, λmax = 554 nm
Multicomponenting The ABI PRISM 7700 Sequence Detection System software uses a process called multicomponenting to distinguish reporter dyes, the quencher dye TAMRA (λmax = 582 nm), and the passive reference dye ROX (λmax = 610 nm). Multicomponenting is a mathematical algorithm that uses pure dye reference spectra to calculate the contribution of each dye to a complex experimental spectrum.
AccurateQuantitation
Because of experimental variation in measuring both the reference spectra and the sample spectra, multicomponenting introduces some error into the determination of each dye’s contribution. The degree of error depends on how well the various dyes are spectrally resolved. The greater the spectral overlap between two dyes, the greater the error. Thus, for the most accurate quantitation using two probes in one tube, use the reporter dyes that have the largest difference in emission maximum: 6-FAM and JOE.
The TaqMan GAPDH Control Reagents (P/N 402869) provide a JOE-labeled probe for human GAPDH mRNA. Therefore, when using GAPDH as an endogenous reference, label the probe for the target mRNA with 6-FAM.
AvoidingCompetition in
Reactions
Reactions to amplify two different segments in the same tube share common reagents. If the two segments have different initial copy numbers, it is possible for the more abundant species to use up these common reagents, impairing amplification of the rarer species. For accurate quantitation, it is important that the two reactions do not compete. Competition can be avoided by limiting the concentration of primers used in the amplification reactions.
Page 16 of 36 User Bulletin #2: ABI PRISM 7700 Sequence Detection System

Limiting PrimerConcept
Figure 7 shows PCR amplifications with decreasing concentrations of primers. At 120 and 80 nM, the amplification plots are similar, indicating that the reactions are not limited by the amount of primers. The remaining plots show that the more dilute the primers, the lower the plateau fluorescence level at the end of the reaction. This demonstrates that a lower primer concentration limits the reaction, forcing it to plateau at a lower level of product.
Figure 7. PCR amplifications with decreasing primer concentrations
In terms of kinetic analysis, however, all the reactions except 4 nM have the same CT value. The strategy for performing two independent reactions in the same tube is to adjust the primer concentrations such that accurate CTs are obtained, but soon after that, the exhaustion of primers defines the end of the reaction. In this way, amplification of the majority species is stopped before it can limit the common reactants available for amplification of the minority species.
Considering Relative Abundance of the Target and Reference
In applying the limiting primer concept to target and endogenous reference amplification, the relative abundance of the two species must be considered. For quantitation of gene expression, it is possible to use rRNA as an endogenous reference. The concentration of rRNA in total RNA is always greater than the concentration of any target mRNA. Therefore, in multiplex reactions amplifying both target and rRNA, only the concentrations of the rRNA primers need to be limited. For c-myc and GAPDH, it is not known if the abundance of one RNA is always greater than the other in the tissues and cell lines that might be examined. For amplifying c-myc and GAPDH in the same tube, limiting primer concentrations need to be defined for both amplicons.
Defining Limiting Primer Concentrations
Define limiting primer concentrations by running a matrix of forward and reverse primer concentrations. The desired concentrations are those that show a reduction in ∆Rn but little effect on CT. Figure 8 on page 18 and Figure 9 on page 19 show the results when GAPDH is amplified using all combinations of forward and reverse primers at 80, 40, 30, and 20 nM.
User Bulletin #2: ABI PRISM 7700 Sequence Detection System Page 17 of 36

Figure 8. GAPDH amplified using all combinations of forward and reverse primers
The CT results in Figure 8 show that the CT value using 30 nM each primer is the same as 80 nM each primer. Figure 9 shows that the ∆Rn at 30 nM each primer is reduced relative to more concentrated primers. Thus, by amplifying GAPDH with 30 nM each primer, accurate CTs are obtained, but the GAPDH reaction is shut down before it affects amplification of a less abundant species. In order to provide a margin for error, a concentration of 40 nM each GAPDH primer is used in the “Multiplex PCR Example” on page 19.
Page 18 of 36 User Bulletin #2: ABI PRISM 7700 Sequence Detection System
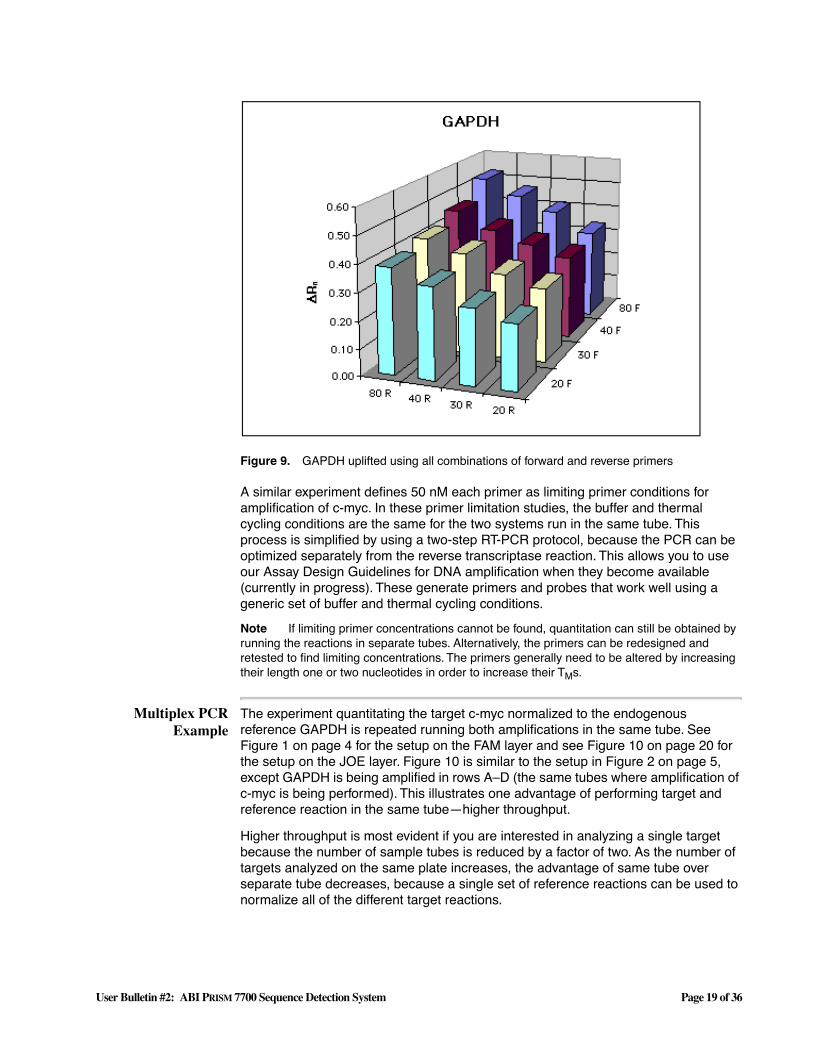
Figure 9. GAPDH uplifted using all combinations of forward and reverse primers
A similar experiment defines 50 nM each primer as limiting primer conditions for amplification of c-myc. In these primer limitation studies, the buffer and thermal cycling conditions are the same for the two systems run in the same tube. This process is simplified by using a two-step RT-PCR protocol, because the PCR can be optimized separately from the reverse transcriptase reaction. This allows you to use our Assay Design Guidelines for DNA amplification when they become available (currently in progress). These generate primers and probes that work well using a generic set of buffer and thermal cycling conditions.
Note If limiting primer concentrations cannot be found, quantitation can still be obtained by running the reactions in separate tubes. Alternatively, the primers can be redesigned and retested to find limiting concentrations. The primers generally need to be altered by increasing their length one or two nucleotides in order to increase their TMs.
Multiplex PCRExample
The experiment quantitating the target c-myc normalized to the endogenous reference GAPDH is repeated running both amplifications in the same tube. See Figure 1 on page 4 for the setup on the FAM layer and see Figure 10 on page 20 for the setup on the JOE layer. Figure 10 is similar to the setup in Figure 2 on page 5, except GAPDH is being amplified in rows A–D (the same tubes where amplification of c-myc is being performed). This illustrates one advantage of performing target and reference reaction in the same tube—higher throughput.
Higher throughput is most evident if you are interested in analyzing a single target because the number of sample tubes is reduced by a factor of two. As the number of targets analyzed on the same plate increases, the advantage of same tube over separate tube decreases, because a single set of reference reactions can be used to normalize all of the different target reactions.
User Bulletin #2: ABI PRISM 7700 Sequence Detection System Page 19 of 36

Figure 10. Plate setup for relative quantitation of the c-myc mRNA on JOE layer
Spectral Compensation Feature
When analyzing data that have two reporters in the same tube, use the special software feature called Spectral Compensation. This is an enhancement of the multicomponenting algorithm because it provides improved well-to-well spectral resolution for multi-reporter applications. However, it can also be a liability because it increases noise of the fluorescence measurements.
With multiple reporter dyes in the same tube, Spectral Compensation should be turned on because accurate separation of dye signals is more important than increased precision. When one reporter dye is used in a tube, Spectral Compensation should be left off in order to benefit from the improved precision.
Page 20 of 36 User Bulletin #2: ABI PRISM 7700 Sequence Detection System

Perform the following steps to access Spectral Compensation.
Data Handling
After the analysis is performed, setting the baselines and thresholds, exporting the data to Excel, and drawing standard curves in Excel are exactly the same as in the separate tube example. For both the standard curve and ∆∆CT method, the only difference between same-tube and separate-tube analysis is how replicates are averaged.
Multiplex PCR Results (Standard Curve Method)
Table 4 on page 22 shows the results of the same-tube experiment using the standard curve method. Both the c-myc and GAPDH amounts are determined from a single tube where the amount of sample added must be the same for the two determinations. In another tube, the amount of sample added can be different because of pipetting errors. Therefore, for data obtained in the same tube, it makes sense to divide the target amount by the reference amount for that tube before averaging data from replicate samples. This is illustrated in Table 4 where c-mycN is determined separately for each well and these values are averaged for the six replicates.
Step Action
1 Under Diagnostics in the Instruments menu, select the Advanced Options dialog box.
2 To analyze more than one reporter dye in the same tube, check the box marked Use Spectral Compensation for Real Time.
3 Click OK.
Note Ignore the warning message if the only change made is to turn Spectral Compensation on or off.
User Bulletin #2: ABI PRISM 7700 Sequence Detection System Page 21 of 36

Multiplex PCR Results (Comparative CT Method)
Table 5 on page 23 shows the ∆∆CT calculations for the same-tube experiment. Because c-myc and GAPDH data are being obtained from the same tube, calculations are carried out individually for each well before averaging.
Table 4. Relative Quantitation Using Multiplex Reactions (Same Tube) with the Standard Curve Method
Tissuec-myc
ng Total Raji RNAGAPDH
ng Total Raji RNAc-mycN
Norm. to GAPDHc-mycN
Rel. to Brain
Brain 0.031 0.618 0.05
0.038 0.532 0.07
0.032 0.521 0.06
0.038 0.550 0.07
0.032 0.577 0.06
0.037 0.532 0.07
Average 0.06±0.008 1.0±0.14
Kidney 0.365 0.049 0.35
0.338 1.035 0.33
0.423 1.042 0.41
0.334 1.086 0.31
0.334 1.021 0.33
0.372 1.139 0.33
Average 0.34±0.035 5.4±0.55
Liver 0.477 0.255 1.87
0.471 0.228 2.06
0.535 0.258 2.07
0.589 0.241 2.44
0.539 0.264 2.04
0.465 0.227 2.05
Average 2.09±0.186 33.3±2.97
Lung 0.853 0.085 0.97
0.900 0.084 0.88
0.956 0.082 1.00
0.900 0.093 0.87
0.996 0.112 0.87
0.859 0.090 0.84
Average 0.90±0.062 14.4±0.99
Page 22 of 36 User Bulletin #2: ABI PRISM 7700 Sequence Detection System

Table 5. Relative Quantitation Using Multiplex Reactions (Same Tube) with the Comparative (∆∆CT) Method
Tissue c-myc CT GAPDH CT
∆∆∆∆CTc-myc - GAPDH
∆∆∆∆∆∆∆∆CT∆∆∆∆CT - Avg. ∆∆∆∆CT,
Brainc-mycN
Rel. to Brain
Brain 32.38 25.07 7.31
32.08 25.29 6.79
32.35 25.32 7.03
32.08 25.24 6.84
32.34 25.17 7.17
32.13 25.29 6.84
Average 6.93±0.16 0.00±0.16 1.0(09–1.1)
Kidney 28.73 24.30 4.43
28.84 24.32 4.52
28.51 24.31 4.20
28.86 24.25 4.61
28.86 24.34 4.52
28.70 24.18 4.52
Average 4.47±0.14 –2.47±0.14 5.5(5.0–6.1)
Liver 28.33 26.36 1.97
28.35 26.52 1.83
28.16 26.34 1.82
28.02 26.44 1.58
28.15 26.31 1.84
28.37 26.53 1.84
Average 1.81±0.13 –5.12±0.13 34.8 (31.9–38.0)
Lung 27.47 24.55 2.92
27.39 24.33 3.06
27.30 24.43 2.87
27.39 24.32 3.07
27.24 24.18 3.06
27.46 24.34 3.12
Average 3.02±0.10 –3.92±0.10 15.1 (14.1–16.2)
User Bulletin #2: ABI PRISM 7700 Sequence Detection System Page 23 of 36

Summary
Figure 11 shows a comparison of the four different methods used to determine the relative quantity of c-myc mRNA. Whether the analysis is done in one or two tubes or with the standard curve or comparative CT methods, there are no significant differences in the results.
Figure 11. Comparison of four methods for relative quantitation
Determining WhichMethod to Use
The decision of which protocol to use for relative quantitation does not depend on which method gives the best results. All methods can give equivalent results.
Running the target and endogenous control amplifications in separate tubes and using the standard curve method of analysis requires the least amount of optimization and validation.
To use the comparative CT method, a validation experiment must be run to show that the efficiencies of the target and endogenous control amplifications are approximately equal. The advantage of using the comparative CT method is that the need for a standard curve is eliminated. This increases throughput because wells no longer need to be used for the standard curve samples. It also eliminates the adverse effect of any dilution errors made in creating the standard curve samples.
To amplify the target and endogenous control in the same tube, limiting primer concentrations must be identified and shown not to affect CT values. By running the two reactions in the same tube, throughput is increased and the effects of pipetting errors are reduced. A drawback of using the multiplex PCR is that it does introduce some errors into the final results due to multicomponenting.
Page 24 of 36 User Bulletin #2: ABI PRISM 7700 Sequence Detection System

Methods
Introduction This section contains the detailed protocols used to generate the data reported in this User Bulletin.
cDNA Synthesis
Sources Human brain, kidney, liver, and lung total RNA are from Clontech, which provides total RNA as an ethanol precipitate. Raji total RNA at 50 ng/µL is from the TaqMan® GAPDH Control Reagents Kit (P/N 402869).
The reagents (other than H2O) for preparing the following Master Mixes are from the TaqMan® Reverse Transcription Reagents Kit (P/N N808-0234).
Master MixPreparation
For each Master Mix, make enough reagent for six samples. This includes one extra reaction volume to accommodate reagent losses during pipetting.
+RT Master Mix
ComponentsVolume
(µL)Concentration in Final
Reaction
DEPC H2O 111
10× TaqMan® RT buffer 60 1×
25 mM MgCl2 132 5.5 mM
deoxyNTPs mixture (2.5 mM each dNTP) 120 500 µM each dNTP
50 µM Random Hexamers 30 2.5 µM
RNase Inhibitor (20 U/µL) 12 0.4 U/µL
MultiScribe™ Reverse Transcriptase (50 U/µL) 15 1.25 U/µL
-RT Master Mix
ComponentsVolume
(µL)Concentration in Final
Reaction
DEPC H2O 126
10× TaqMan RT buffer 60 1×
25 mM MgCl2 132 5.5 mM
deoxyNTPs mixture (2.5 mM each dNTP) 120 500 µM each dNTP
50 µM Random Hexamers 30 2.5 µM
RNase Inhibitor (20 U/µL) 12 0.4 U/µL
User Bulletin #2: ABI PRISM 7700 Sequence Detection System Page 25 of 36

Preparation ofTissue RNA
Perform the following steps for each tissue RNA listed in the Master Mix tables on page 25.
Procedure for cDNASynthesis
Perform the following steps for cDNA synthesis. Samples prepared using this procedure are stable at 4˚C for at least one month.
Note The designated concentration of each sample is 10 ng cDNA/µL, which means 1 µL of sample contains the cDNA obtained from 10 ng total RNA.
Step Action
1 Vigorously vortex the RNA suspension.
2 Transfer 40 µL to a microcentrifuge tube and centrifuge for 10 minutes at 14,000 rpm.
3 Discard the supernatant of each sample and allow the RNA pellet to air dry.
4 Dissolve each RNA sample in 200 µL of DEPC H2O (Ambion) and keep on ice.
Step Action
1 For each total RNA sample (human brain, kidney, liver, lung, and Raji), transfer 20 µL (1 µg) to each of two MicroAmp® tubes (10 tubes total).
2 Add 80 µL of +RT Master Mix to five tubes.
3 Add 80 µL of -RT Master Mix to five tubes.
Note The -RT control reactions are important for assessing how much contaminating genomic DNA is present in each total RNA sample.
4 Incubate the reactions in the GeneAmp® PCR System 9600 at:
� 25˚C, 10 minutes
� 48˚C, 30 minutes
� 95˚C, 5 minutes
5 Add 2 µL of 0.5 M EDTA to each reaction. Store the cDNA samples at 4˚C for one month.
Page 26 of 36 User Bulletin #2: ABI PRISM 7700 Sequence Detection System

c-myc and GAPDH Amplified in Separate Tubes
Sources The primers (P/N 450005, 450004, or 450021) and TaqMan® probe (P/N 450003, 450024, or 450025) used to amplify and detect c-myc are from the Custom Oligonucleotide Synthesis Service of Applied Biosystems. The sequences are given below.
c-myc Forward Primer TCAAGAGGTGCCACGTCTCCc-myc Reverse Primer TCTTGGCAGCAGGATAGTCCTTc-myc Probe FAM-CAGCACAACTACGCAGCGCCTCC-TAMRA
The primers and probe used to amplify and detect GAPDH are from the TaqMan GAPDH Control Reagents Kit (P/N 402869). The sequences are given below.
GAPDH Forward Primer GAAGGTGAAGGTCGGAGTCGAPDH Reverse Primer GAAGATGGTGATGGGATTTCGAPDH Probe JOE-CAAGCTTCCCGTTCTCAGCC-TAMRA
Except for primers, probes, H2O, and gelatin, the reagents for preparing the following Master Mixes are from the TaqMan® PCR Core Reagent Kit (P/N N808-0228).
Master MixPreparation
For each Master Mix, make enough reagent for 60 samples. This includes 12 extra reaction volumes to accommodate reagent losses during pipetting.
c-myc Master Mix
ComponentsVolume
(µL)Concentration in Final
Reaction
H2O 1658.5
10× TaqMan buffer A 300 1×
25 mM MgCl2 660 5.5 mM
2% gelatin (Sigma G1393) 75 0.05%
10 mM dATP 60 200 µM
10 mM dCTP 60 200 µM
10 mM dGTP 60 200 µM
20 mM dUTP 60 400 µM
168 µM c-myc Probe 1.8 100 nM
252 µM c-myc Forward Primer 2.4 200 nM
257 µM c-myc Reverse Primer 2.3 200 nM
AmpErase® UNG 30 0.01 U/µL
AmpliTaq Gold™ 30 0.05 U/µL
User Bulletin #2: ABI PRISM 7700 Sequence Detection System Page 27 of 36

Procedure Follow this procedure to amplify the target and reference in separate tubes.
GAPDH Master Mix
ComponentsVolume
(µL)Concentration in Final
Reaction
H2O 1385
10× TaqMan buffer A 300 1×
25 mM MgCl2 660 5.5 mM
2% gelatin 75 0.05%
10 mM dATP 60 200 µM
10 mM dCTP 60 200 µM
10 mM dGTP 60 200 µM
20 mM dUTP 60 400 µM
5 µM GAPDH Probe 60 100 nM
10 µM GAPDH Forward Primer 60 200 nM
10 µM GAPDH Reverse Primer 60 200 nM
AmpErase UNG 30 0.01 U/µL
AmpliTaq Gold 30 0.05 U/µL
Step Action
1 Prepare dilutions of Raji cDNAs in order to construct standard curves. (Prepare 50 ng/µL of yeast RNA by diluting 5 mg/mL of yeast RNA [Ambion] 1:100 in DEPC H2O.)
2 Set up the PCR tray for the reactions amplifying c-myc.
2 µL 10 ng/µL Raji cDNA + 18 µL 50 ng/µL yeast RNA ⇒ 1 ng/µL
10 µL 1 ng/µL Raji cDNA + 10 µL 50 ng/µL yeast RNA ⇒ 0.5 ng/µL
8 µL 0.5 ng/µL Raji cDNA + 12 µL 50 ng/µL yeast RNA ⇒ 0.2 ng/µL
10 µL 0.2 ng/µL Raji cDNA + 10 µL 50 ng/µL yeast RNA ⇒ 0.1 ng/µL
10 µL 0.1 ng/µL Raji cDNA + 10 µL 50 ng/µL yeast RNA ⇒ 0.05 ng/µL
8 µL 0.05 ng/µL Raji cDNA + 12 µL 50 ng/µL yeast RNA ⇒ 0.02 ng/µL
10 µL 0.02 ng/µL Raji cDNA + 10 µL 50 ng/µL yeast RNA ⇒ 0.01 ng/µL
175 µL c-myc Master Mix + 3.5 µL 50 ng/µL yeast RNA ⇒ 50 µL to A1-3
175 µL c-myc Master Mix + 3.5 µL 1 ng/µL Raji cDNA ⇒ 50 µL to A4-6
175 µL c-myc Master Mix + 3.5 µL 0.5 ng/µL Raji cDNA ⇒ 50 µL to A7-9
175 µL c-myc Master Mix + 3.5 µL 0.2 ng/µL Raji cDNA ⇒ 50 µL to A10-12
175 µL c-myc Master Mix + 3.5 µL 0.1 ng/µL Raji cDNA ⇒ 50 µL to B1-3
175 µL c-myc Master Mix + 3.5 µL 0.05 ng/µL Raji cDNA ⇒ 50 µL to B4-6
175 µL c-myc Master Mix + 3.5 µL 0.02 ng/µL Raji cDNA ⇒ 50 µL to B7-9
175 µL c-myc Master Mix + 3.5 µL 0.01 ng/µL Raji cDNA ⇒ 50 µL to B10-12
325 µL c-myc Master Mix + 6.5 µL 10 ng/µL brain cDNA ⇒ 50 µL to C1-6
325 µL c-myc Master Mix + 6.5 µL 10 ng/µL kidney cDNA ⇒ 50 µL to C7-12
325 µL c-myc Master Mix + 6.5 µL 10 ng/µL liver cDNA ⇒ 50 µL to D1-6
325 µL c-myc Master Mix + 6.5 µL 10 ng/µL lung cDNA ⇒ 50 µL to D7-12
Page 28 of 36 User Bulletin #2: ABI PRISM 7700 Sequence Detection System

3 Set up the PCR tray for the reactions amplifying GAPDH.
4 Set up the thermal cycling conditions for the ABI PRISM® 7700 Sequence Detector:
� 50˚C, 2 minutes
� 95˚C, 10 minutes
Then set up 40 cycles of the following:
� 95˚C, 15 seconds
� 60˚C, 1 minute
Step Action
175 µL GAPDH Master Mix + 3.5 µL 50 ng/µL yeast RNA ⇒ 50 µL to E1-3
175 µL GAPDH Master Mix + 3.5 µL 1 ng/µL Raji cDNA ⇒ 50 µL to E4-6
175 µL GAPDH Master Mix + 3.5 µL 0.5 ng/µL Raji cDNA ⇒ 50 µL to E7-9
175 µL GAPDH Master Mix + 3.5 µL 0.2 ng/µL Raji cDNA ⇒ 50 µL to E10-12
175 µL GAPDH Master Mix + 3.5 µL 0.1 ng/µL Raji cDNA ⇒ 50 µL to F1-3
175 µL GAPDH Master Mix + 3.5 µL 0.05 ng/µL Raji cDNA ⇒ 50 µL to F4-6
175 µL GAPDH Master Mix + 3.5 µL 0.02 ng/µL Raji cDNA ⇒ 50 µL to F7-9
175 µL GAPDH Master Mix + 3.5 µL 0.01 ng/µL Raji cDNA ⇒ 50 µL to F10-12
325 µL GAPDH Master Mix + 6.5 µL 10 ng/µL brain cDNA ⇒ 50 µL to G1-6
325 µL GAPDH Master Mix + 6.5 µL 10 ng/µL kidney cDNA ⇒ 50 µL to G7-12
325 µL GAPDH Master Mix + 6.5 µL 10 ng/µL liver cDNA ⇒ 50 µL to H1-6
325 µL GAPDH Master Mix + 6.5 µL 10 ng/µL lung cDNA ⇒ 50 µL to H7-12
User Bulletin #2: ABI PRISM 7700 Sequence Detection System Page 29 of 36

Limiting Primer Determination
Master MixPreparation
For each Master Mix, make enough reagent for 76 samples. This includes 16 extra reaction volumes to accommodate reagent losses during pipetting.
Procedure Follow this procedure to limit primers.
Master Mix
ComponentsVolume
(µL)Concentration in Final
Reaction
H2O 1271.1
10× TaqMan buffer A 380 1×
25 mM MgCl2 836 5.5 mM
2% gelatin (Sigma G1393) 95 0.05%
10 mM dATP 76 200 µM
10 mM dCTP 76 200 µM
10 mM dGTP 76 200 µM
20 mM dUTP 76 400 µM
5 µM GAPDH Probe 76 100 nM
AmpErase UNG 38 0.01 U/µL
AmpliTaq Gold 38 0.05 U/µL
10 ng/µL Raji cDNA 1.9 0.25 ng per rxn
Step Action
1 Prepare a separate dilution series for each of the forward and reverse GAPDH primers.
2 Add to wells in the PCR tray:
� 5 µL of 800 nM GAPDH Forward Primer to A1–12
� 5 µL of 600 nM GAPDH Forward Primer to B1–12
� 5 µL of 500 nM GAPDH Forward Primer to C1–12
� 5 µL of 400 nM GAPDH Forward Primer to D1–12
� 5 µL of 300 nM GAPDH Forward Primer to E1–12
� 5 µL of 200 nM GAPDH Forward Primer to F1–12
32 µL 10 µM Primer + 368 µL H2O ⇒ 800 nM
75 µL 800 nM Primer + 25 µL H2O ⇒ 600 nM
62.5 µL 800 nM Primer + 37.5 µL H2O ⇒ 500 nM
50 µL 800 nM Primer + 50 µL H2O ⇒ 400 nM
37.5 µL 800 nM Primer + 62.5 µL H2O ⇒ 300 nM
25 µL 800 nM Primer + 75 µL H2O ⇒ 200 nM
Page 30 of 36 User Bulletin #2: ABI PRISM 7700 Sequence Detection System

Note In Figure 8 on page 18 and Figure 9 on page 19, only the 20-, 30-, 40-, and 80-nM results are shown.
3 Add to wells in the PCR tray:
� 5 µL of 800 nM GAPDH Reverse Primer to 1,2A–F
� 5 µL of 600 nM GAPDH Reverse Primer to 3,4A–F
� 5 µL of 500 nM GAPDH Reverse Primer to 5,6A–F
� 5 µL of 400 nM GAPDH Reverse Primer to 7,8A–F
� 5 µL of 300 nM GAPDH Reverse Primer to 9,10A–F
� 5 µL of 200 nM GAPDH Reverse Primer to 11,12A–F
4 Add 40 µL of Master Mix to each reaction tube.
5 Set up the thermal cycling conditions for the ABI PRISM 7700 Sequence Detector:
� 50˚C, 2 minutes
� 95˚C, 10 minutes
Then set up 40 cycles of the following:
� 95˚C, 15 seconds
� 60˚C, 1 minute
Step Action
User Bulletin #2: ABI PRISM 7700 Sequence Detection System Page 31 of 36

c-myc and GAPDH Amplified in the Same Tube
Master MixPreparation
For each Master Mix, make enough reagent for 60 samples. This includes 12 extra reaction volumes to accommodate reagent losses during pipetting.
Procedure Follow this procedure to amplify the target and reference in the same tube.
Master Mix
ComponentsVolume
(µL)Concentration in Final
Reaction
H2O 1549.2
10× TaqMan buffer A 300 1×
25 mM MgCl2 660 5.5 mM
2% gelatin (Sigma G1393) 75 0.05%
10 mM dATP 60 200 µM
10 mM dCTP 60 200 µM
10 mM dGTP 60 200 µM
20 mM dUTP 60 400 µM
168 µM c-myc Probe 1.8 100 nM
10 µM c-myc Forward Primer 15 50 nM
10 µM c-myc Reverse Primer 15 50 nM
5 µM GAPDH Probe 60 100 nM
10 µM GAPDH Forward Primer 12 40 nM
10 µM GAPDH Reverse Primer 12 40 nM
AmpErase UNG 30 0.01 U/µL
AmpliTaq Gold 30 0.05 U/µL
Step Action
1 Prepare dilutions of Raji cDNA for the standard curves as in the Separate Tube experiment.
2 Set up the PCR tray:
175 µL Master Mix + 3.5 µL 50 ng/µL yeast RNA ⇒ 50 µL to A1-3
175 µL Master Mix + 3.5 µL 1 ng/µL Raji cDNA ⇒ 50 µL to A4-6
175 µL Master Mix + 3.5 µL 0.5 ng/µL Raji cDNA ⇒ 50 µL to A7-9
175 µL Master Mix + 3.5 µL 0.2 ng/µL Raji cDNA ⇒ 50 µL to A10-12
175 µL Master Mix + 3.5 µL 0.1 ng/µL Raji cDNA ⇒ 50 µL to B1-3
175 µL Master Mix + 3.5 µL 0.05 ng/µL Raji cDNA ⇒ 50 µL to B4-6
175 µL Master Mix + 3.5 µL 0.02 ng/µL Raji cDNA ⇒ 50 µL to B7-9
175 µL Master Mix + 3.5 µL 0.01 ng/µL Raji cDNA ⇒ 50 µL to B10-12
325 µL Master Mix + 6.5 µL 10 ng/µL brain cDNA ⇒ 50 µL to C1-6
325 µL Master Mix + 6.5 µL 10 ng/µL kidney cDNA ⇒ 50 µL to C7-12
325 µL Master Mix + 6.5 µL 10 ng/µL liver cDNA ⇒ 50 µL to D1-6
325 µL Master Mix + 6.5 µL 10 ng/µL lung cDNA ⇒ 50 µL to D7-12
Page 32 of 36 User Bulletin #2: ABI PRISM 7700 Sequence Detection System

3 Set up the thermal cycling conditions for the ABI PRISM 7700 Sequence Detector:
� 50˚C, 2 minutes
� 95˚C, 10 minutes
Then set up 40 cycles of the following:
� 95˚C, 15 seconds
� 60˚C, 1 minute
Step Action
User Bulletin #2: ABI PRISM 7700 Sequence Detection System Page 33 of 36

Standard Deviation Calculation Using the Standard Curve Method
Formula The c-mycN value is determined by dividing the average c-myc value by the average GAPDH value. The standard deviation of the quotient is calculated from the standard deviations of the c-myc and GAPDH values using the following formula:
where:
As an example, from Table 1 on page 10 (brain sample):
and
since
cv cv12
cv22+=
cv sX---- stddev
meanvalue-----------------------------= =
cv10.0040.039-------------=
cv20.0340.54-------------=
cv0.0040.039-------------
2 0.034
0.54-------------
2
+ 0.12==
cv sX----=
s cv( ) X( )=
s 0.12( ) 0.07( )=
s 0.008=
Page 34 of 36 User Bulletin #2: ABI PRISM 7700 Sequence Detection System

Standard Deviation Calculation Using the Comparative Method
Formula The ∆CT value is determined by subtracting the average GAPDH CT value from the average c-myc CT value. The standard deviation of the difference is calculated from the standard deviations of the c-myc and GAPDH values using the following formula:
where:
s = std dev
As an example, from Table 3 on page 15 (brain sample):
and
s s12
s22
+=
s1 0.15=
s2 0.09=
s 0.15( )2
0.09( )2
+ 0.17==
User Bulletin #2: ABI PRISM 7700 Sequence Detection System Page 35 of 36

© Copyright 2001. Applied Biosystems. All rights reserved.
For Research Use Only. Not for use in diagnostic procedures.
The PCR process is covered by Roche Molecular Systems, Inc. and F. Hoffmann-La Roche Ltd.
ABI andMultiScribe are trademarks of Applera Corporation or its subsidiaries in the U.S. and certain other countries.
ABI PRISM and its design, Applied Biosystems and MicroAmp are registered trademarks of Applera Corporation or its subsidiaries in the U.S. and certain other countries.
AmpErase, AmpliTaq, AmpliTaq Gold, GeneAmp, and TaqMan are registered trademarks of Roche Molecular Systems.
P/N 4303859B, Stock No. 777802-002