usepa & nyc gowanus canal ri/fs meeting october 6, 2011
TRANSCRIPT

1
M E E T I N G S U M M A R Y USEPA & NYC Gowanus Canal RI/FS Meeting October 6, 2011
PREPARED FOR: USEPA PREPARED BY: Bill McMillin/CH2M HILL DATE: October 13, 2011
The U.S. Environmental Protection Agency, Region 1 (USEPA), met with representatives of the City of New York (NYC) on October 6, 2011 at the offices of the USEPA at 290 Broadway, New York, NY. Discussions were held on the Gowanus Canal Remedial Investigation (RI) and Feasibility Study (FS). A roster of attendees representing the USEPA, NYC Law Department, NYC Department of Environmental Protection (NYCDEP) and its consultants, and CH2M HILL is shown in Attachment 1.
Christos Tsiamis, USEPA, opened the meeting by reviewing recent events and scheduled events relative to this meeting:
The USEPA and NYC last met on May 4, 2011 to discuss the details and NYC thoughts on the RI.
A draft FS report has been submitted to USEPA for review, comment, and revision if necessary.
The draft FS report will be shared with the State of New York, NYC, National Grid, and other potentially responsible parties (PRPs) after the review and revisions are completed in several weeks.
The draft FS will be released to the public by the end of 2011.
The Proposed Plan should be released in May/June 2012 with the Record of Decision will follow by the end of 2012.
Feasibility Study and Source Control
USEPA summarized key issues in the draft FS:
The three main management goals are to:
Clean and stabilize the bottom;
Prevent recontamination from the Manufactured Gas Plant (MGP) sites; and,
Prevent recontamination from combined sewer overflows (CSO) and other pipes discharging to the canal.
Discharges from CSOs must be addressed:
CSO discharges bring contaminants of concern (COC) and solids into the canal; and,
These discharges would make any remedy unsustainable.
USEPA would like to discuss with NYC approaches to address these issues. NYC agreed that they also would like to work towards this goal.
USEPA has been left with the impression from statements made by Carter Strickland, NYCDEP, at a recent Community Advisory Group meeting, that NYC considers that its CSOs are not contributing to the contamination in the canal. However it is clear to USEPA that NYC is a PRP with regards to CSOs.
The FS includes as an underlining requirement for all evaluated remedies that sources of current releases to the canal (including CSO discharges) be addressed. The overall approach for the canal is dredging with capping.

USEPA & NYC GOWANUS CANAL RI/FS MEETING OCTOBER 6, 2011
2
USEPA has been reviewing NYC’s CSO control alternatives from the past presentations and NYC’s Gowanus Canal Waterbody/Watershed Plan report including considerations in the report for tunnel, tanks, etc to evaluate how they could reduce CSO discharges and support the sustainability of the remedy. CH2M HILL has been helping USEPA interpret the information that NYC has presented. While the draft FS identifies the need for source control, it does not identify specific CSO controls. These need to be determined and included in the Proposed Plan.
USEPA is also working with National Grid and with New York State to establish remedies for the MGP sites.
USEPA is looking at opportunities for creating synergies between source control and other ongoing activities – for example National Grid has to fix a sewer line through their Carrol Gardens site that involves excavating and moving soil from the site. There may be an opportunity to construct a storage tank on the site that will help control discharges from CSO 035. Another option to consider would be an in-canal tunnel.
NYC Presentation on RI/FS
NYCDEP gave a presentation which included interpretation of RI results, inputs to conceptual site model, and engineering alternatives for CSO reductions (Attachment 2). The following are notes on the discussions held.
NYCDEP’s deposition rate shown in slide 20 of the NYC presentation is based on a visual interpretation of the 2010 bathymetry shown in the RI Report. NYC requested the bathymetry data collected during the RI in 2010 to refine their calculation.
Solids deposition calculations shown on slides 20 and 21 are for past conditions only. The calculations are not applicable for future conditions when NYCDEP’s Gowanus Canal Waterbody/Watershed Plan is fully implemented.
NYCDEP asked if USEPA calculated volumes of sedimentation for the RI/FS. USEPA indicate that this was not done.
NYCDEP has performed work to track down the sources of contaminants for its Industrial Pretreatment Program described in slide 31. The results indicate that the sources are residential. CH2M HILL asked if trackdown work was performed in wet weather, dry weather, or both. NYCDEP could not confirm during which condition this was performed. CH2M HILL commented that the source of contaminants in CSOs may be street runoff that would not be detected during dry weather trackdown work.
Open Discussion on the Levels of Controls
USEPA noted that 95% of the CSO discharges are from 4 CSOs. The focus should be on addressing the most significant contributors.
NYCDEP is required in its CSO Consent Order with New York State to submit a Gowanus Canal Long-Term Control Plan (LTCP) for CSO controls in 2015. This is where NYCDEP would do additional CSO control planning if its post-construction water quality monitoring in 2013-2014 indicates that more controls are needed. NYCDEP is looking at upgrading its pump stations, such as the 2nd Avenue Pump Station that overflows at OH-007. The grit chamber at OH-007 has been inspected and NYCDEP has determined that it has to be cleaned and fixed. However, the nature of the project will require NYCDEP to design, bid and award a construction contract to perform the work. These projects have usually long lead times.
NYCDEP asked if USEPA is looking for NYC to eliminate all CSO discharges or the solids in the discharge. USEPA responded yes, but recognizes the huge costs involved and is looking to NYC for suggestions and considerations. CH2M HILL added that USEPA wants to identify the best approaches to get where we need to be, which is not necessarily four storage tanks for CSO controls. USEPA stated

USEPA & NYC GOWANUS CANAL RI/FS MEETING OCTOBER 6, 2011
3
that it is open to cost-benefit analyses for identifying appropriate levels of controls. It recognizes that tanks, tunnels, etc. have significant costs.
NYCDEP also asked about controlling stormwater and other pipes discharging to the Canal. USEPA stated that the major contaminant contributions are from the MGP sites and CSOs, although USEPA is looking at other sources as well. For stormwater, there are very few stormwater discharges to the Canal. CH2M HILL stated that USEPA requested detailed maps of the combined and stormwater systems, but received a series of high-quality maps from the latest GIS for only a portion of the Red Hook Water Pollution Control Plant (WPCP) service area around the Canal. CH2M HILL and USEPA made follow-up requests for the same maps for the rest of the Red Hook WPCP service area and the Owls Head WPCP services areas, but has not received them. These maps would be helpful in identifying the remaining stormwater discharges to the Canal. The only maps available are NYCDEP Infiltration/Inflow maps for the two WPCP service areas that are 30 years old and incomplete.
It was noted that not only the volumes, but the frequency of discharges is important too. NYCDEP’s Waterbody/Watershed Plan has discharge calculations only for a typical year, not all years. In relation to that, the consideration of controlling the first flush was noted.
USEPA recognizes that a phased approach and adaptive management may be pathways to achieve management goals. USEPA wants to work together with NYCDEP and is looking for synergies between overlapping programs to save on costs. The objective is to have an engineering solution and set standards that can be incorporated into incremental progress. There are advantages to implementing the remedy under Superfund vs. other programs (permitting requirements).
NYCDEP stated its concern that the schedule for completing the Proposed Plan in May/June 2012 with the Record of Decision by the end of 2012 does not correspond to its Consent Order requirement of submitting a Gowanus Canal LTCP to New York State in 2015. NYCDEP’s CSO control schedule for Gowanus Canal has the implementation of its Waterbody/Watershed Plan (pump station and flushing tunnel upgrades) being completed in 2013. There will be two years of post-construction water quality monitoring in the Canal to assess the performance o f the Waterbody/Watershed Plan and to determine if any additional CSO controls are needed that have to be in the 2015 Gowanus Canal LTCP. The planning schedule between now and Spring 2012 is too fast - NYCDEP’s current LTCP engineering contract is ending now, having completed all of its Waterbody/Watershed Plans. The NYCDEP will be starting a new LTCP engineering contract next year. NYCDEP does not have the engineering resources to do the necessary planning within the USEPA timeframe.
NYCDEP asked what is in the FS regarding CSO controls. USEPA responded that the need for controls is discussed but specific controls are not identified. CH2M HILL added that the FS is not presumptive on the types and levels of CSO controls that are needed.
NYCDEP asked for a description of the “no-action” condition in the FS. USEPA stated that the no-action condition is the existing condition prior to the implementation of NYCDEP’s Gowanus Canal Waterbody/Watershed Plan and any other plans by the MGPs or other PRPs.
USEPA and NYCDEP agreed to continue meeting and to work together on identifying the remediation plan and the schedule. Next meeting will be in November.

USEPA & NYC GOWANUS CANAL RI/FS MEETING OCTOBER 6, 2011
4
Attachment 1 – Attendee List

USEPA & NYC GOWANUS CANAL RI/FS MEETING OCTOBER 6, 2011
5
Attachment 2 – NYCDEP Presentation

EPA Meeting
Gowanus Canal
10/6/11

2
Agenda
Results of RI Study
Inputs to Conceptual Site Model
Engineering Alternatives for CSO Reductions
3
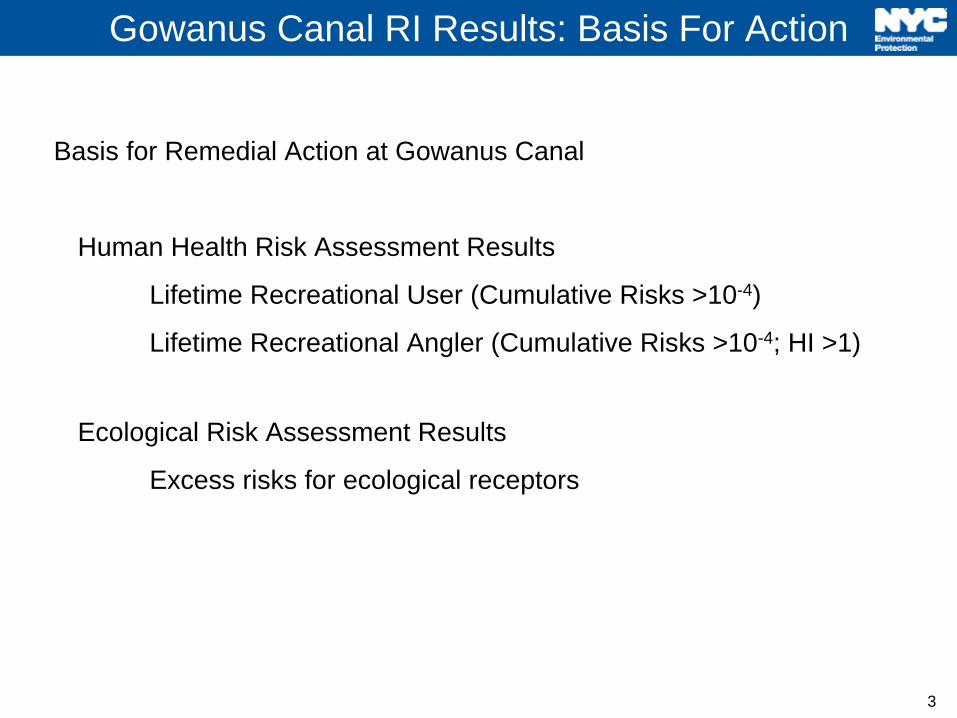
Gowanus Canal RI Results: Basis For Action
Basis for Remedial Action at Gowanus Canal
Human Health Risk Assessment Results
Lifetime Recreational User (Cumulative Risks >10-4)
Lifetime Recreational Angler (Cumulative Risks >10-4; HI >1)
Ecological Risk Assessment Results
Excess risks for ecological receptors

4
Chemical ofConcern
Maximum
measured CSO
sediment
concentration(mg/kg) (1)
Human health risk‐based
cleanup value(mg/kg) (3)
Maximum
backgroundsediment
concentration(mg/kg) (4)
Background
statistical
comparison (5)
Greater of
background
and risk‐based
cleanup
value(mg/kg)
CSO Exceeds
Background
and risk‐based
cleanup value?
Receptor: Recreational User Lifetime ExposureArsenic 7.9 138.5 19 Inadequate data 138.5 N
Benz(a)anthracene 1.3J 27.6 1.2 CSO=Bkgd 27.6 N
Benzo(a)pyrene 1.3J 2.7 0.9 Inconclusive 2.7 N
Benzo(b)fluoranthene 4.5J 27.6 1.4 Inconclusive 27.6 N
Benzo(k)fluoranthene 1.5 276 0.8 Inconclusive 276 N
Dibenz(a,h)anthracene 0.5J 2.8 <0.15 Inadequate data 2.8 N
Indeno(1,2,3‐c,d)pyrene) 1.8J 2.6 1.0 Inconclusive 2.6 N
1‐Taken from Table I‐47A of RI Report; 2‐
Taken from Table 4‐3 Science Collaborative, 2011; 3‐Taken from Table xx, NYCDEP, 2011; 4‐Taken from Table 4‐4b of RI Report; 5‐Results
from Table xx, Louis Berger, 2011.
Comparsion of CSO Sediment Concentrations to Risk-Based Cleanup Values and Background Sediment Concentrations
4

5
Comparsion of CSO Sediment Concentrations to Risk-Based Cleanup Values and Background Sediment Concentrations
5

6
Chemical ofConcern
Maximum measured CSO
Outfalls Water
concentration(ug/l) (1)
Ecologicalrisk‐based cleanup
valueconcentration
(ug/l) (2)
Human
health risk‐
based
cleanup
value(ug/l) (3)
Maximum backgroundSurface waterconcentration
(ug/l) (4)
Background
statistical
comparison
(5)
Greater of
background
and risk‐
based
cleanup
value(ug/l)
CSO Exceeds Back‐
ground and risk‐
based cleanup
value?
Receptor: Ecological
Lead, dissolved 6.8 (wet) 8.1 NA 10 (ND) Data
Inadequate10 (ND) N
Receptor: Recreational User Lifetime Exposure
Chromium +6, total 14.6 (wet) NA 64 30.6 (dry) CSO<bkgd 64 N
Tetrachloroethylene 20 (wet) NA 67.8 5.1 CSO>bkgd 67.8 N
1‐Taken from Table I‐53a or I‐49a of RI Report; 2‐
Taken from Table 4‐3 Science Collaborative, 2011; 3‐Taken from Table xx, NYCDEP, 2011; 4‐Taken from Table 4‐4b or
4‐9b of RI Report; 5‐Results from Table xx, Louis Berger, 2011.ND‐All results were non‐detect.
Table XX. Comparison of CSO Water Concentrations to Risk-Based Cleanup Values and Background Surface Water Concentrations
6

7
Comparison of Maximum Measured CSO Sediment Concentrations, to Human Health Risk-based Cleanup Values, and Maximum Background Sediment Concentrations

8
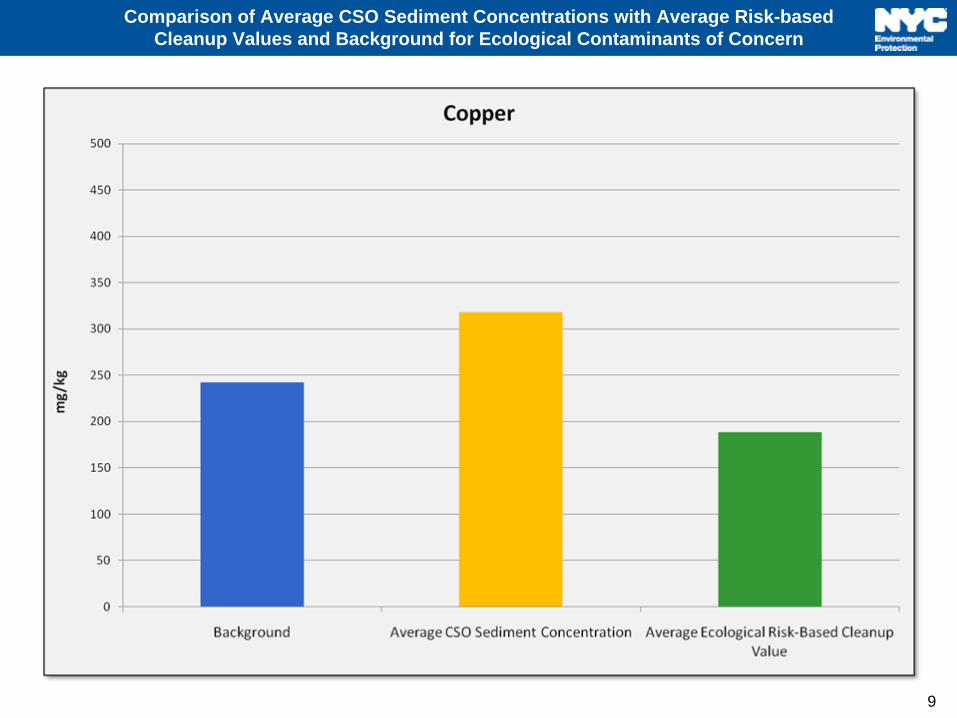
Comparison of Average CSO Sediment Concentrations with Average Risk-based Cleanup Values and Background for Ecological Contaminants of Concern
9
Comparison of Average CSO Sediment Concentrations with Average Risk-based Cleanup Values and Background for Ecological Contaminants of Concern

10
Sediment Sampling Locations (Canal and CSO)

11
SVOC Concentrations in Surface Sediments versus Human Health Risk-Based Cleanup Value

12
Metal Concentrations in Surface Sediment versus Ecological Risk Based Cleanup Value

13
Metal Concentrations in Surface Sediment versus Ecological Risk Based Cleanup Value

14
Metal Concentrations in Surface Sediment versus Ecological Risk Based Cleanup Value

Considerations for Conceptual Site Model
Considerations for Conceptual Site Model
15

Groundwater Flow Model Development
16
Based on site information and USGS publications
Agrees well with USGS head and flow data
The calibrated discharge to Gowanus Canal is about 2.1 ft3/sec (USGS pre-development estimate is 2.5 ft3/sec)
Model indicates about 75% of the flow to Gowanus Canal is through the sediment and 25% of flow is through the banks

Preliminary Upper Bound Estimates of PAH Loads from NAPL to Sediment Bottom
17
Analyte Mean GW
Concentration (ug/L)
Potential Annual
Loads from GW
(Kg/yr)
Mean CSO Aqueous
Concentration (ug/L)CSO Loads
(kg/yr)
Acenaphthene 946 1,750 0.67 1.0
Acenaphthylene 1,020 1,900 0.20 0.3
Anthracene 156 300 0.20 0.3
Benzo(a)anthracene 5.1 10 0.25 0.4
Benzo(a)pyrene 1.2 2 0.25 0.4
Benzo(b)fluoranthene 0.7 1 0.35 0.5
Benzo(g,h,i)perylene 0.4 1 0.39 0.5
Benzo(k)fluoranthene 0.2 0.4 0.23 0.3
Chrysene 3 6 0.26 0.4
Dibenz(a,h)anthracene 9 17 0.24 0.3
Fluoranthene 34 65 0.34 0.5
Fluorene 429 800 0.29 0.4
Indeno(1,2,3‐cd)pyrene 0.44 1 0.35 0.5
Naphthalene 26,925 50,500 4.0 5.7
Phenanthrene 412 770 0.48 0.7
Pyrene 53 100 0.38 0.5

Preliminary Upper Bound Estimates of Metals Load from Groundwater to Sediment Bottom
18
AnalyteMean GW
Concentration,
ug/l
Potential
Annual Loads
from GW
(Kg/yr)
Mean CSO
Aqueous
Concentration
(ug/L)
CSO
Loads
(kg/yr)
Arsenic 9 17.6 3 4 Barium 308 598 59 84 Cadmium 0.7 1.4 1 1
Chromium, Total 5 9.5 4 6 Copper 22 42 58 83 Lead 10 19 67 95
Mercury 0.10 0.2 0.1 0.2 Nickel 10 20 6 8 Silver 0.7 1.4 0.7 1

Change in Elevation from 2003 to 2010 – EPA RI Report
19

Calculation of Net Solids Deposition
* Mass was calculated using a solid specific density of 0.8 g/cc
** Uncertainty was calculated using areas where the change in elevation from June 2003 to January 2010 was within 0.6 feet.
20
Change in Elevation from June 2003 to January 2010 (6.6 years)
Deposition ErosionNet (Deposition ‐
Erosion)
Uncertainty**
Volume (cy) 41,000 14,000 27,000 15,200
Rate (cy/yr) 6,200 2,100 4,100 2,300
Mass (kg/yr)* 3.8x10^6 1.3x10^6 2.5x10^6 1.4x10^6
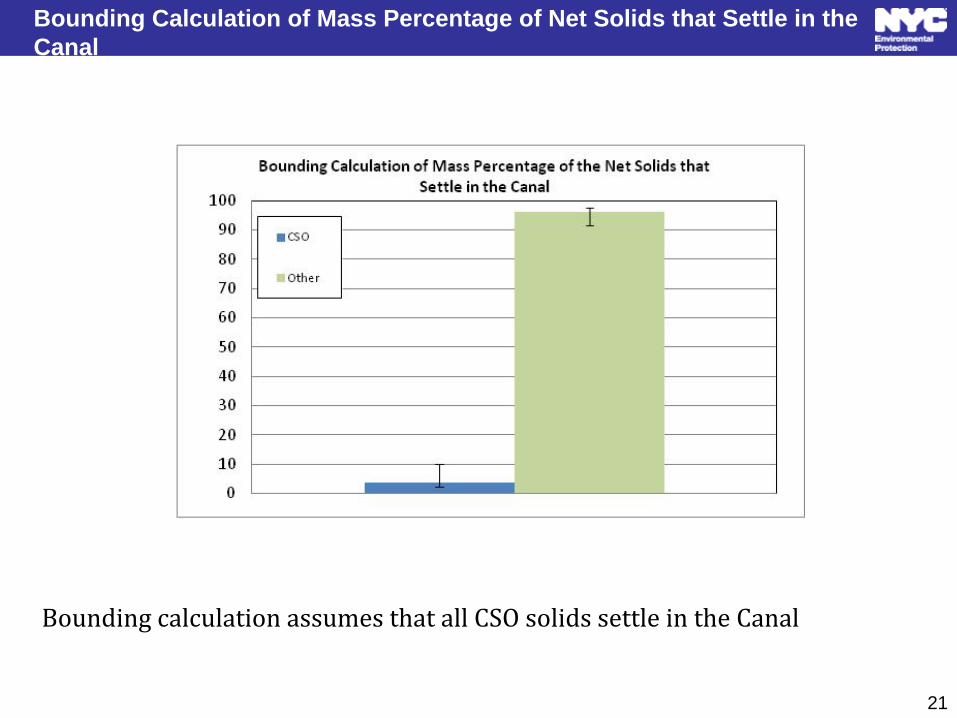
Bounding Calculation of Mass Percentage of Net Solids that Settle in the Canal
Bounding calculation assumes that all CSO solids settle in the Canal
21

“Organic Sink” Concern - TOC Comparison
22
Means Comparisons using Tukey-Kramer Test

Engineering Alternatives Requested by EPA
Requested Alternatives
AlternativeFlow
Reduction
(MG/Yr)
Present Worth
Cost (Million
Dollars) Cost Estimate Basis Notes
Capital
Storage Tank ‐
OH‐007 69 4208.2 MG Tank
WWFP Table 7‐4
Rejected during CSO Planning
Project because :1) Negligible impact on improving
compliance with WQ standards
2) Construction requires
condemnation and acquisition of
private property
3) Difficult construction
conditions related to
groundwater and proximity to the
waterbody4) Long construction period with
potential community impacts
5) High capital and maintenance
cost
Storage Tank ‐
RH‐034 127 655 17 MG Tank
WWFP Table 7‐4

Attainment of Dissolved Oxygen vs. Cost
24
Additional CSO controls do not increase attainment
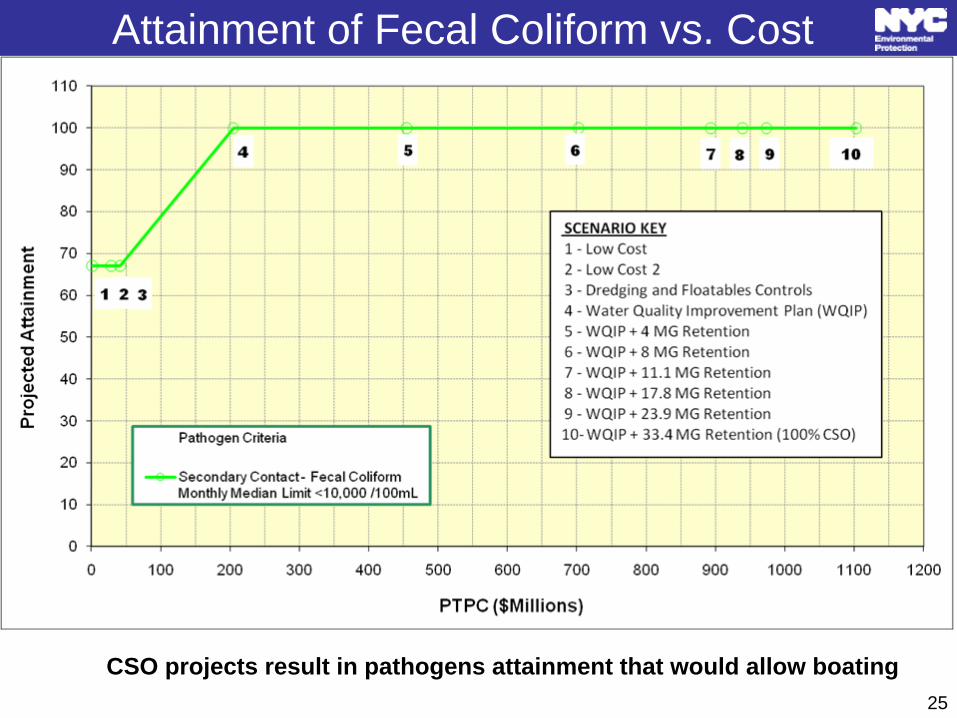
Attainment of Fecal Coliform vs. Cost
25
CSO projects result in pathogens attainment that would allow boating

DEP’s CSO Reduction Program
CSO ControlsGowanus Facilties Upgrade ($140,000,000)
CSO Reduction 34%
Sediment Reduction 37%
Odor/Aesthetic ImprovementsEnvironmental Dredging = ($20,000,000)
DEP’s Total Costs (Planned, In-Design or In- Construction, and Built)
= $XXX,XXX,XXX
26
Proposed Post-Upgrade Rendering of the
Gowanus Facilities

Additional Ongoing CSO Controls
Requested Alternatives
27
Alternative Date Notes Costs % CSO Reduction
High level Sewer Separation
Phase I FY13Phase 2 FY20
Captures 50% of drainage area (96 acre) of street runoff. New storm outfall at Carroll St
$20,000,000 5 %
Sewer Maintenance
2011, year to date
2004
37,355 linear ft of 4th Ave sewer cleaned; 724 yd3 of silt, debris, grease removed
110,000 yd3 of silt, debris, grease removed in Bond-Lorraine sewer
$ 685,000
Interceptor Maintenance
2010-2012 Owl’s Head and Red Hook Interceptor inspections. Completed 90% of total linear ft (16,530) for Red Hook. Inspected 2,200ft of 14,000ft in Owl’s Head. On-going
$ 148,000
IPP Program 1987 Reduction of metals influx
Green Infrastructure
2011-forward Downtown Brooklyn Traffic Calming/ community grants/EBP grant/future budget allocations
$ 1,000,000 + 11%
Total $ 21,853,000 + 16%
Total Reduction in CSOs
Plant Upgrades+HLSS+GI $181,853,000+ 45%

28
High Level Storm Sewers (HLSS)
Redirect existing catch basin flow from combined sewer to new HLSS
Primary benefit includes reductions in street flooding
Provides more capacity in the existing system including downstream interceptors
Completed hydraulic analysis to determine feasibility for “Carroll Street Outfall” and CSO volume reduction of approximately 5% projected with modeling
Carroll Street Outfall Amended Drainage Plan includes:
HLSS to capture 50% of drainage area runoff
96-acre area bounded by 1st Pl, 4th Ave, State St, 3rd Ave
A new storm outfall would be located at Carroll St
Phase I design expected in FY12, and construction in FY13
Phase II design expected in FY19 and construction in FY20
Phase I
Phase II

29
System Optimization: Sewers
4th Ave activities for 2011 calendar year, to date:
Over 37,355 linear feet of sewers cleaned in response to complaints
724 cubic yards of silt, grease, and debris removed
Bond-Lorraine sewer cleaned in 2004:
110,000 cubic yards removed from Bond Lorraine Street Sewer from Bond and 4th Streets to Lorraine and Court Streets
30
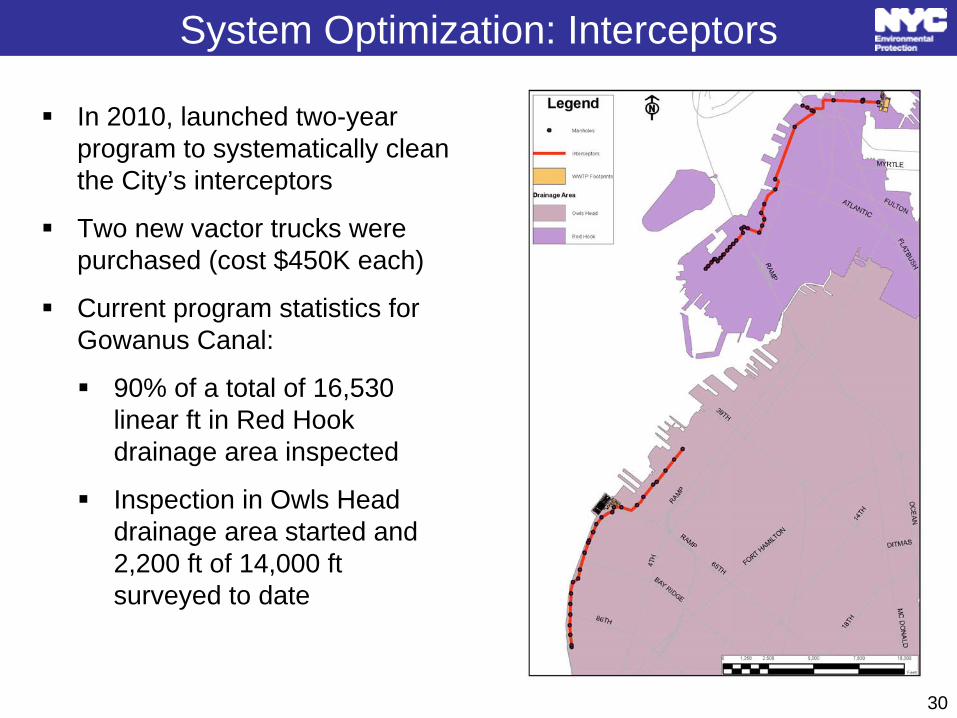
System Optimization: Interceptors
In 2010, launched two-year program to systematically clean the City’s interceptors
Two new vactor trucks were purchased (cost $450K each)
Current program statistics for Gowanus Canal:
90% of a total of 16,530 linear ft in Red Hook drainage area inspected
Inspection in Owls Head drainage area started and 2,200 ft of 14,000 ft surveyed to date

Industrial Pretreatment Program
Established in 1987 to control the introduction of toxic substances into public sewers that are tributary to WWTPs
In 1992, DEP added a corrosion inhibitor (orthophosphate) to reduce leaching of lead
Significant reduction of other metals due to:
Industries/businesses moving out of NYC or going out of business (currently, industries contribute less than 3% of the metals to the plant influent citywide)
Majority of metals in plant influent are from plumbing pipes/ fixtures
Regulates discharge from 9 Significant Industrial Users in Red Hook and Owls Head drainage areas
31

Green Infrastructure
Gowanus Canal Conservancy and dlandstudios’ DesignsCombination of federal, state, and city funding
Located at end of 2nd Street along eastern edge of the Canal
Rectangular planting beds approximately 28 ft by 40 ft to manage street runoff:
Runoff will be filtered by vegetation within swale or infiltratethrough the open bottom of swale
Excess runoff is collected after passing through the swale and directed into the storm drain system
Installations will be evaluated the potential for bio-filtration benefits
32
Images from Gowanus Canal Conservancy/dland studio
Existing Site Proposed Site

Ongoing Opportunities Analyses
33
Existing green infrastructure and publicly-owned properties within RH-034 and OH-007 drainage areas.
34
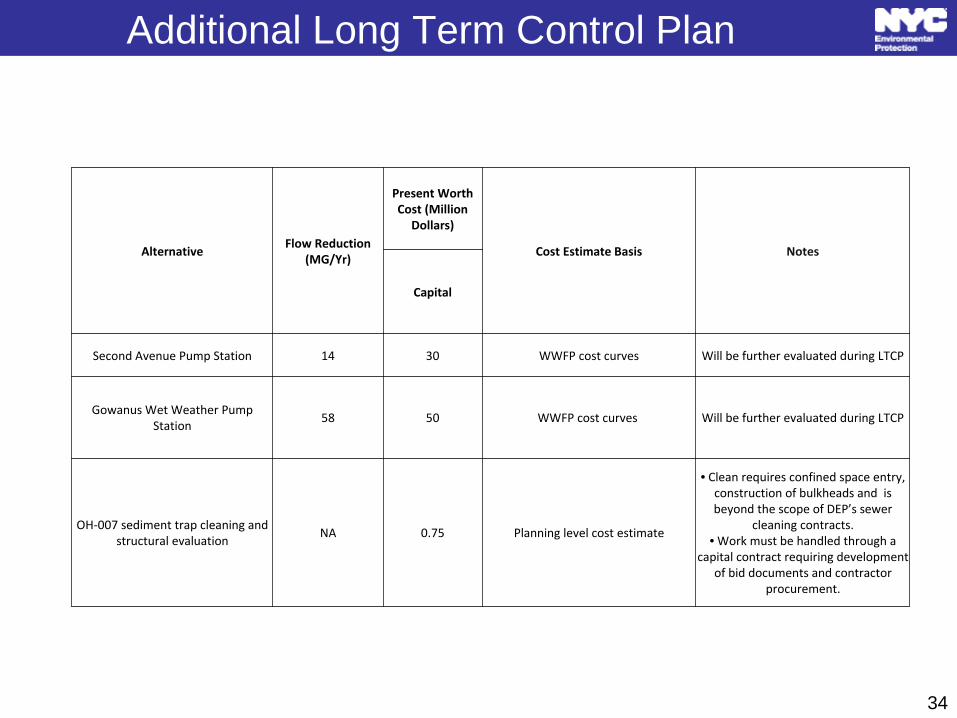
Additional Long Term Control Plan
Requested Alternatives
AlternativeFlow Reduction
(MG/Yr)
Present Worth
Cost (Million
Dollars)
Cost Estimate Basis Notes
Capital
Second Avenue Pump Station 14 30 WWFP cost curves Will be further evaluated during LTCP
Gowanus
Wet Weather Pump
Station58 50 WWFP cost curves Will be further evaluated during LTCP
OH‐007 sediment trap cleaning and
structural evaluationNA 0.75 Planning level cost estimate
• Clean requires confined space entry,
construction of bulkheads and is
beyond the scope of DEP’s
sewer
cleaning contracts. • Work must be handled through a
capital contract requiring development
of bid documents and contractor
procurement.