usefulness of gis in strategic planning markus m. hedorfer venice university of architecture —...
Post on 21-Dec-2015
214 views
TRANSCRIPT

Usefulness of GIS in Strategic Planning
Markus M. HedorferVenice University of Architecture — Department of Urban Planning
Venice, 6th July 1999
Introduction
Each Planner HandlesGeospatial Information
1.
Some Planners UseGeospatial Information Systems
2.
Few Planners Know How To Manage CorrectlyDigital Geospatial Information
3.
What Is?
What Are ?
?
What Is Geospatial Information?
Information that can be locatedon the Earth’s surface.
The Concept:
V1
V2
V3
V4
1 -1
1 -21 -41 -3
2 -1
2 -2
2 -3
3 -1
3 -2
3 -3 4 -1
4 -2
5 -15 -25 -3
11 -1
2 1 -1
2 1 -2 2 2 -1
2 2 -2
2 3 -1
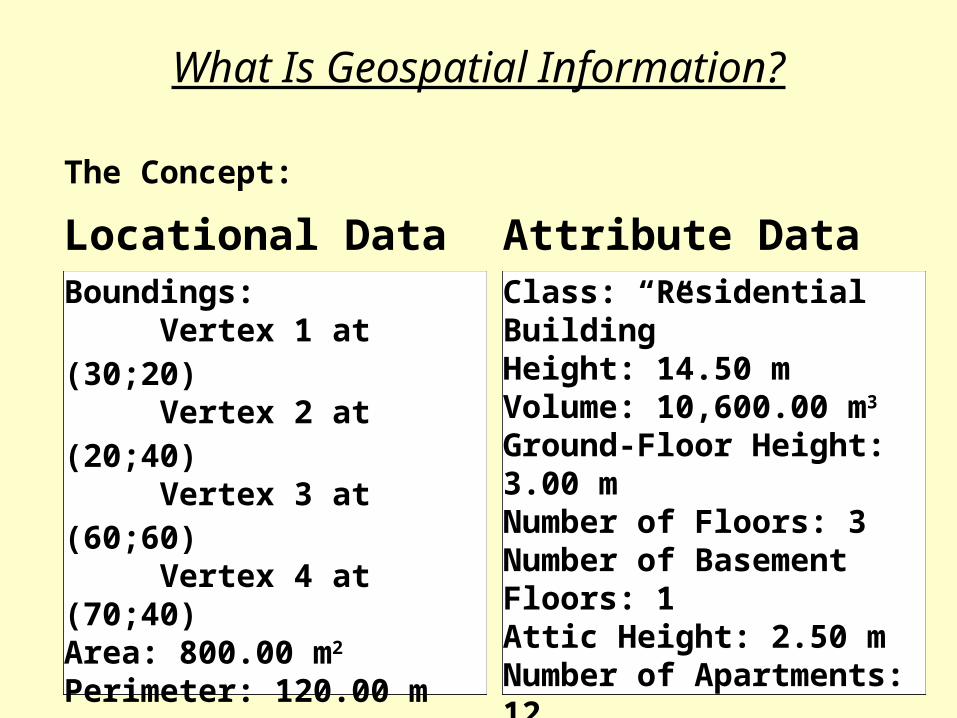
Class: “Residential Building”Height: 14.50 mVolume: 10,600.00 m3
Ground-Floor Height: 3.00 mNumber of Floors: 3Number of Basement Floors: 1Attic Height: 2.50 mNumber of Apartments: 12Inhabitants: 38Residential Volume: 27,000.00 m3
Commercial Area: 750.00 m2
What Is Geospatial Information?
Locational Data
The Concept:
Attribute DataBoundings:
Vertex 1 at (30;20)Vertex 2 at (20;40)Vertex 3 at (60;60)Vertex 4 at (70;40)
Area: 800.00 m2
Perimeter: 120.00 m

What Is Geospatial Information?
Topological Data
And In Addition:
Building 3-1 borders withbuilding 2-1,paved area 2-2,paved area 3-2,paved area 4-2,building 4-1,building 5-1,garden area 5-3, andgarden area 3-3.
1 -1
1 -21 -41 -3
2 -1
2 -2
2 -3
3 -1
3 -2
3 -3 4 -1
4 -2
5 -15 -25 -3
11 -1
2 1 -1
2 1 -2 2 2 -1
2 2 -2
2 3 -1
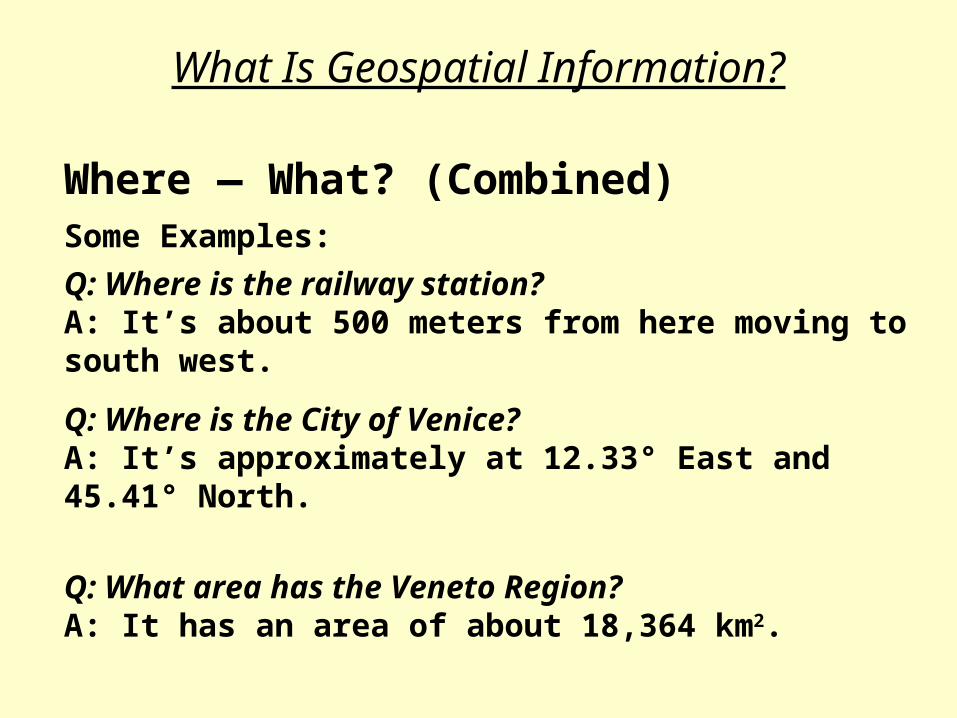
What Is Geospatial Information?
Where — What? (Combined)
Q: Where is the railway station?A: It’s about 500 meters from here moving to south west.
Q: Where is the City of Venice?A: It’s approximately at 12.33° East and 45.41° North.
Q: What area has the Veneto Region?A: It has an area of about 18,364 km2.
Some Examples:

What Is Geospatial Information?
Where — What? (Combined)
Q: By which Provinces is composed the Veneto Region?A: It’s composed by the Provinces of Venice, Padua, Vicenza, Verona, Rovigo, Treviso, and Belluno.
Q: With which Regions does the Veneto Region share its border line?A: It shares its border line with the Regions of Emilia-Romagna, Lombardy, Trentino-South Tyrol, Tyrol (Austria), Carinthia (Austria), and Friuli-Julian Veneto.
Q: Which Regions does the River Po cross?A: It crosses the Regions of Piedmont, Lombardy, Emilia-Romagna, and Veneto.
But Also:

What Is Geospatial Information?
Where — What? (Combined)
Q: Which Townships are located completely or partially inside the 30-minutes isochronal of the Venice railway station using the public transportation system?A: The Townships of Venice, Mira, Dolo, Pianiga, Vigonza, Padua, Spinea, Mirano, Martellago, Salzano, Noale, Mogliano Veneto, Preganziol, Treviso, Marcon, Quarto d’Altino, and Roncade.Q: Is there a place in the Venice Township where can be located a factory of at least 100,000 m2, that produces some noise, and that needs to be connected by industrial railways?A: Yes, there is such a place. It can be found in the southern part of the Porto Marghera industrial area.
And Some More Complex Queries:

What Are Geospatial Information Systems?
Geospatial Information Systems are thoseComputer-Aided Data Management Systemsthat are able to performthe previously mentioned spatial queriesin a completely automated way.
A Very Simple Definition:

What Are Geospatial Information Systems?
1. GIS SoftwareSoftware that makes you able to perform geospatial analysis
2. Geospatial DataData to be analysed and to be used to produce other data
3. Geospatial Data Handling ProceduresProcedural encoding to perform geospatial analysis
Components of a Geospatial Information System:
How To Manage Correctly Geospatial Information?
1. Layer-Based ModelGeospatial information is splitted into severalgraphics-oriented geometrically independentobject assemblage
2. Attribute-Based ModelGeospatial information is stored as atwo-dimensional continuum of geometrically dependentfeature classes
Two Contrasting Management Techniques:
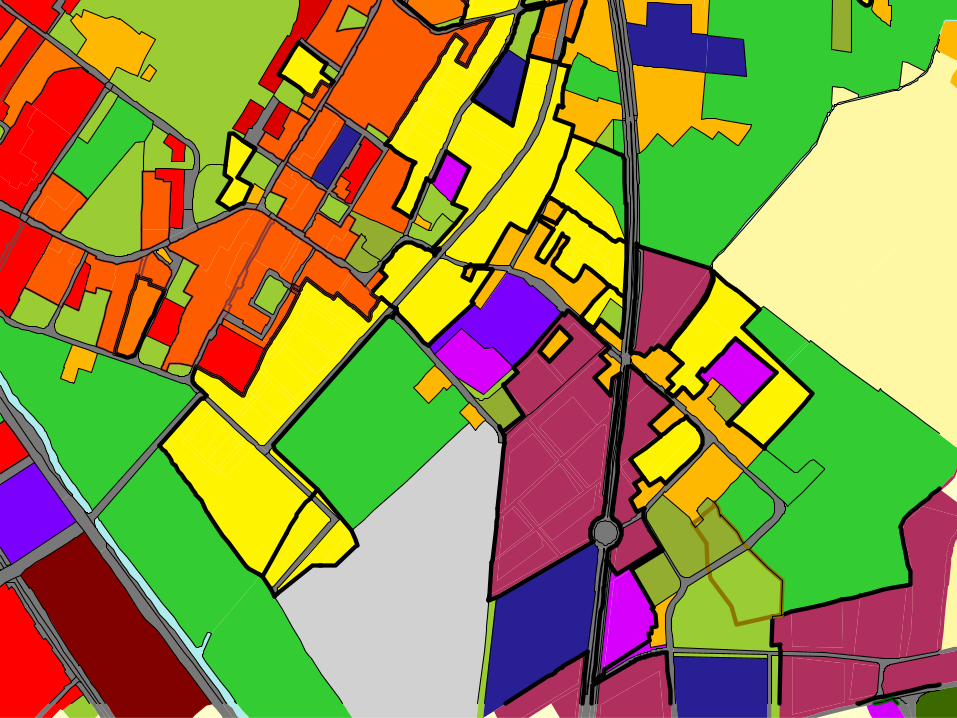
Layer-Based vs. Attribute-Based
Venice-MestreGeneral Programme of Urban Planning(Piano Regolatore Generale)
Courtesy of the Venice Township Administration(1998)
Example #1:

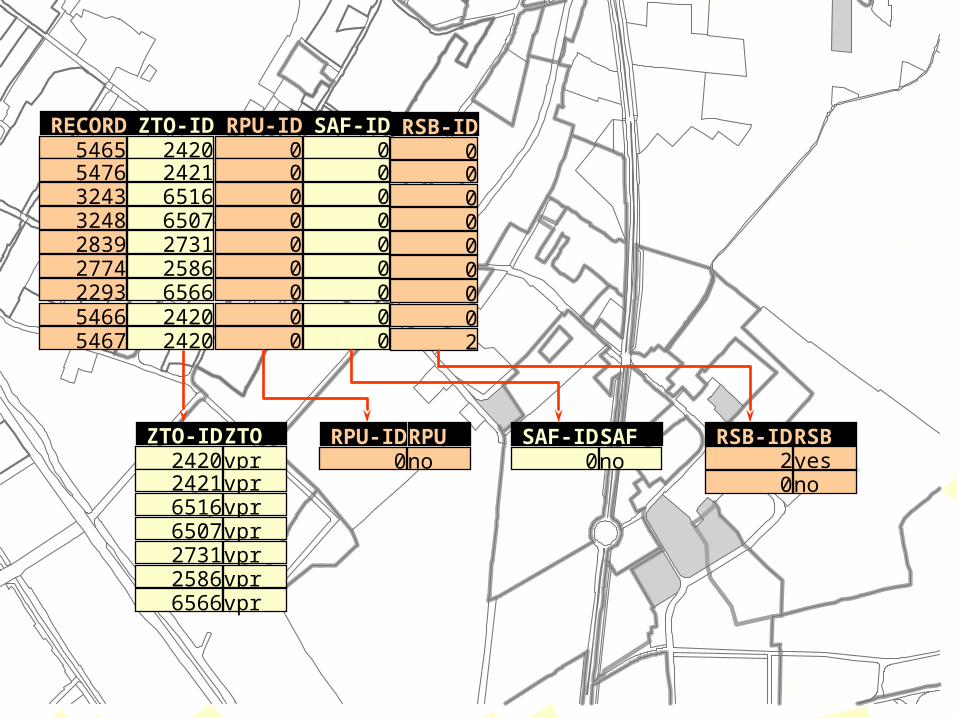
Layer-Based vs. Attribute-Based
Layer-Based Model
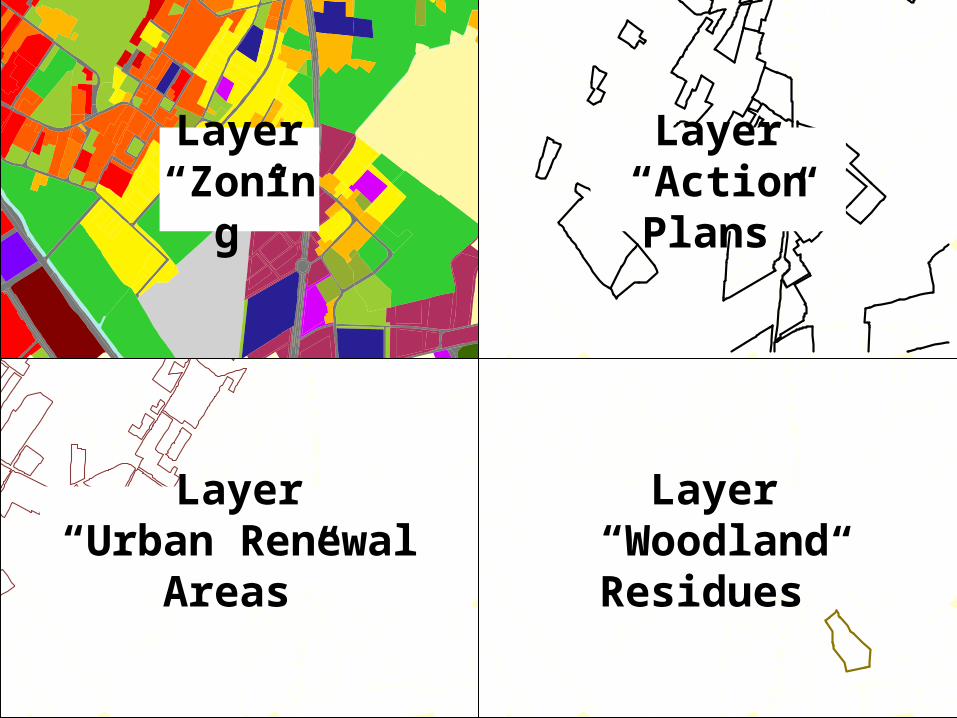
Layer“Zoning”
Layer“Action Plans”
Layer“Urban Renewal Areas”
Layer“Woodland Residues”

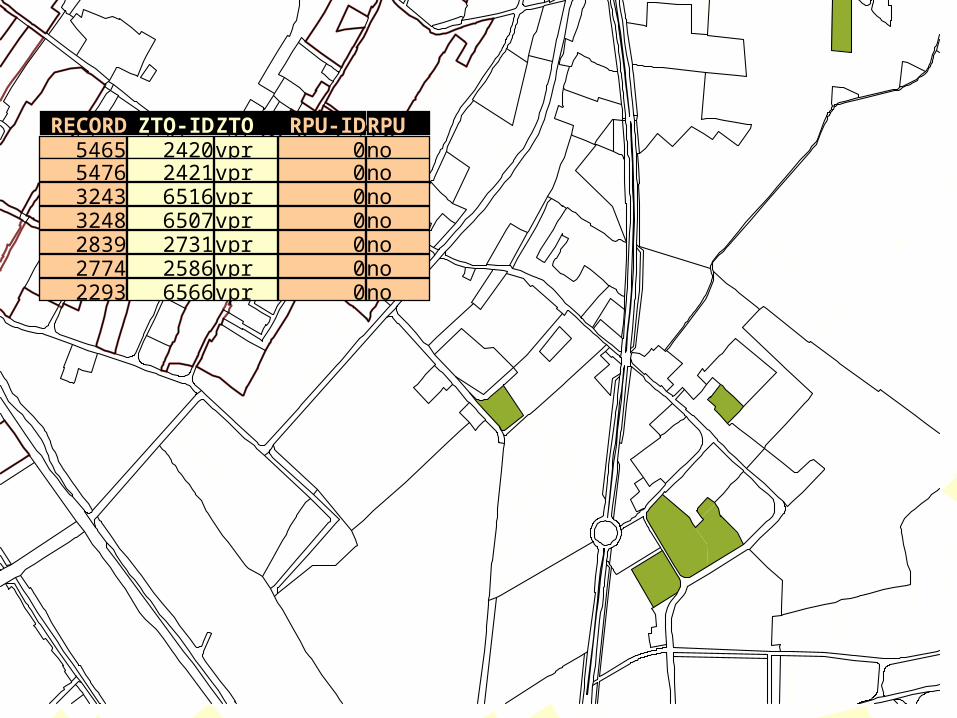
Layer-Based vs. Attribute-Based
Attribute-Based Model


RECORD5465
ZTO-ID2420
ZTOvpr
5476 2421vpr3243 6516vpr3248 6507vpr2839 2731vpr2774 2586vpr2293 6566vpr
RECORD5465
ZTO-ID2420
ZTOvpr
5476 2421vpr3243 6516vpr3248 6507vpr2839 2731vpr2774 2586vpr2293 6566vpr
RPU-ID0RPUno
0no0no0no0no0no0no
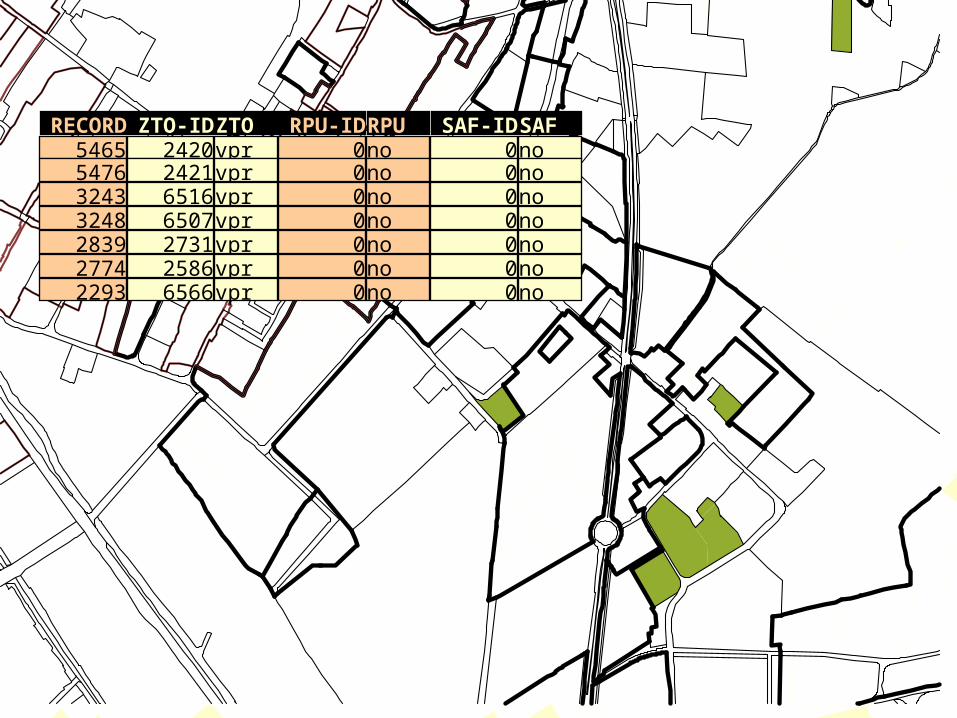
RECORD5465
ZTO-ID2420
ZTOvpr
5476 2421vpr3243 6516vpr3248 6507vpr2839 2731vpr2774 2586vpr2293 6566vpr
RPU-ID0RPUno
0no0no0no0no0no0no
SAF-ID0SAFno
0no0no0no0no0no0no
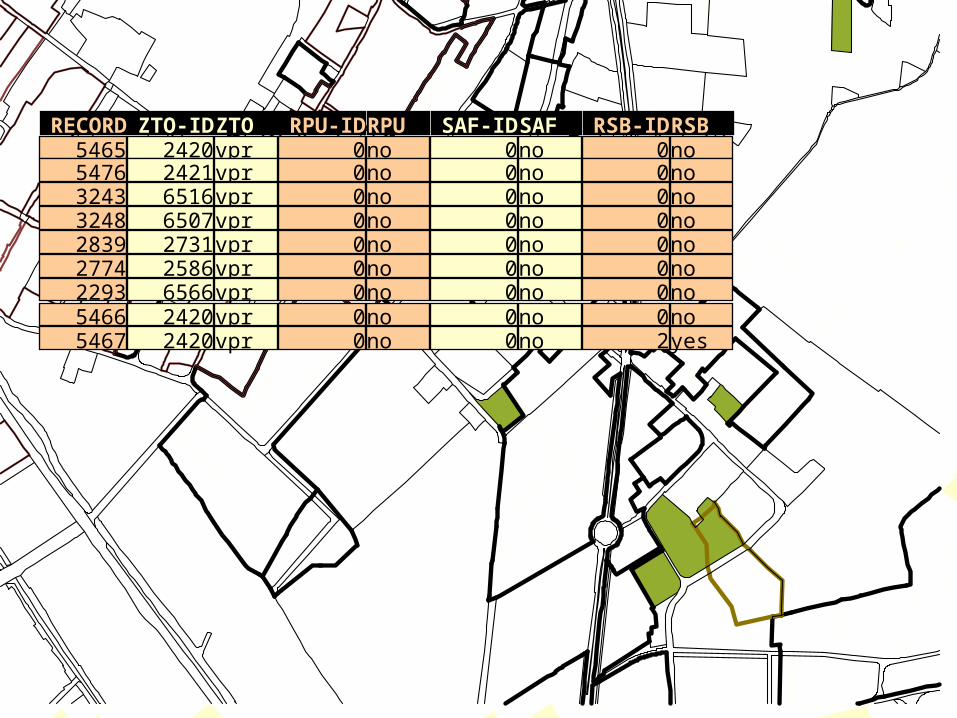
RECORD5465
ZTO-ID2420
ZTOvpr
5476 2421vpr3243 6516vpr3248 6507vpr2839 2731vpr2774 2586vpr2293 6566vpr
RPU-ID0RPUno
0no0no0no0no0no0no
SAF-ID0SAFno
0no0no0no0no0no0no
5466 2420vpr 0no 0no5467 2420vpr 0no 0no
RSB-ID0RSBno
0no0no0no0no0no0no0no2yes

PA-1RSB-ID
2RSByes
0no
RECORD5465
ZTO-ID2420
ZTOvpr
5476 2421vpr3243 6516vpr3248 6507vpr2839 2731vpr2774 2586vpr2293 6566vpr
RPU-ID0RPUno
0no0no0no0no0no0no
SAF-ID0SAFno
0no0no0no0no0no0no
5466 2420vpr 0no 0no5467 2420vpr 0no 0no
RSB-ID0RSBno
0no0no0no0no0no0no0no2yes
PA-1RSB-ID
2RSByes
0no
RECORD5465
ZTO-ID2420
ZTOvpr
5476 2421vpr3243 6516vpr3248 6507vpr2839 2731vpr2774 2586vpr2293 6566vpr
RPU-ID0RPUno
0no0no0no0no0no0no
SAF-ID0SAFno
0no0no0no0no0no0no
5466 2420vpr 0no 0no5467 2420vpr 0no 0no
RSB-ID000000002
PA-1RSB-ID
2RSByes
0no
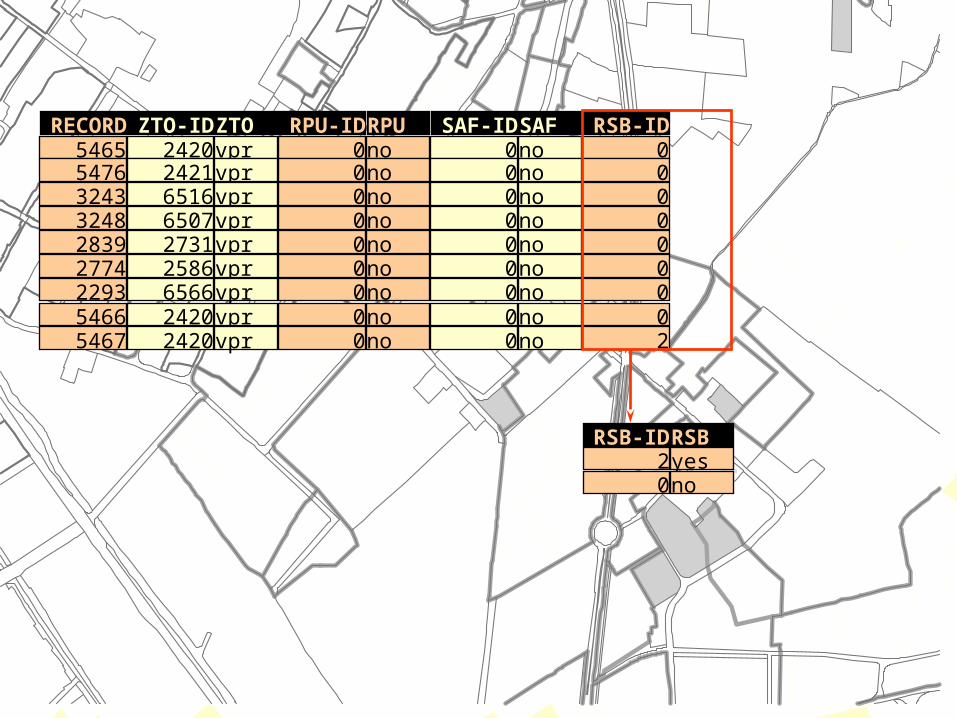
RECORD5465
ZTO-ID2420
5476 24213243 65163248 65072839 27312774 25862293 65665466 24205467 2420
RPU-ID000000000
SAF-ID000000000
RSB-ID000000002
ZTO-ID2420
ZTOvpr
2421vpr6516vpr6507vpr2731vpr2586vpr6566vpr
RPU-ID0RPUno
SAF-ID0SAFno
Topology-Oriented Attribute-Based Data Encoding
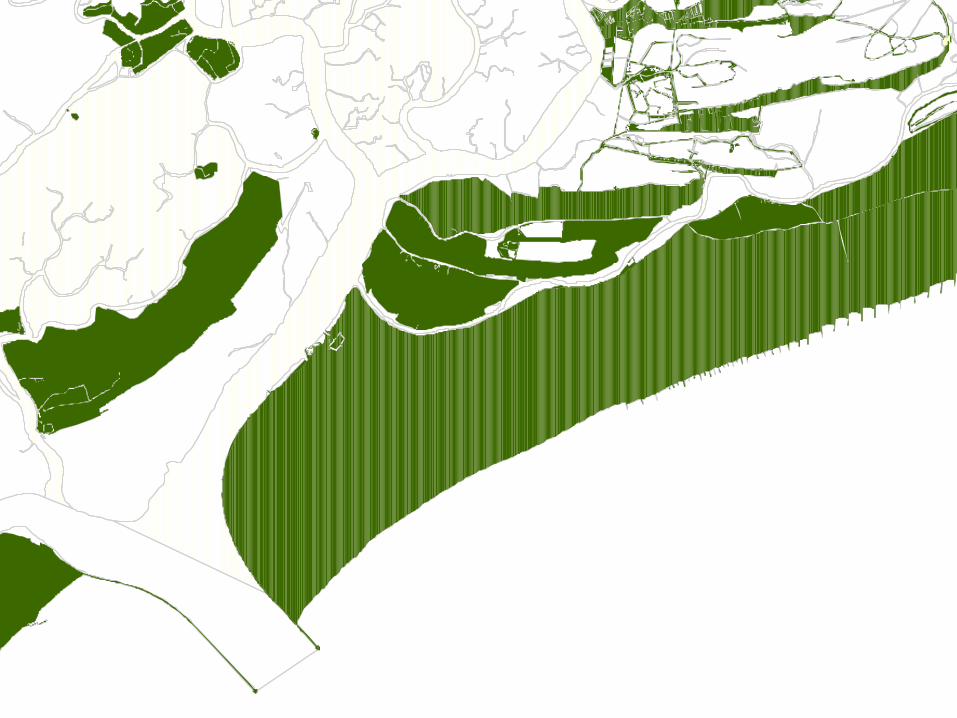
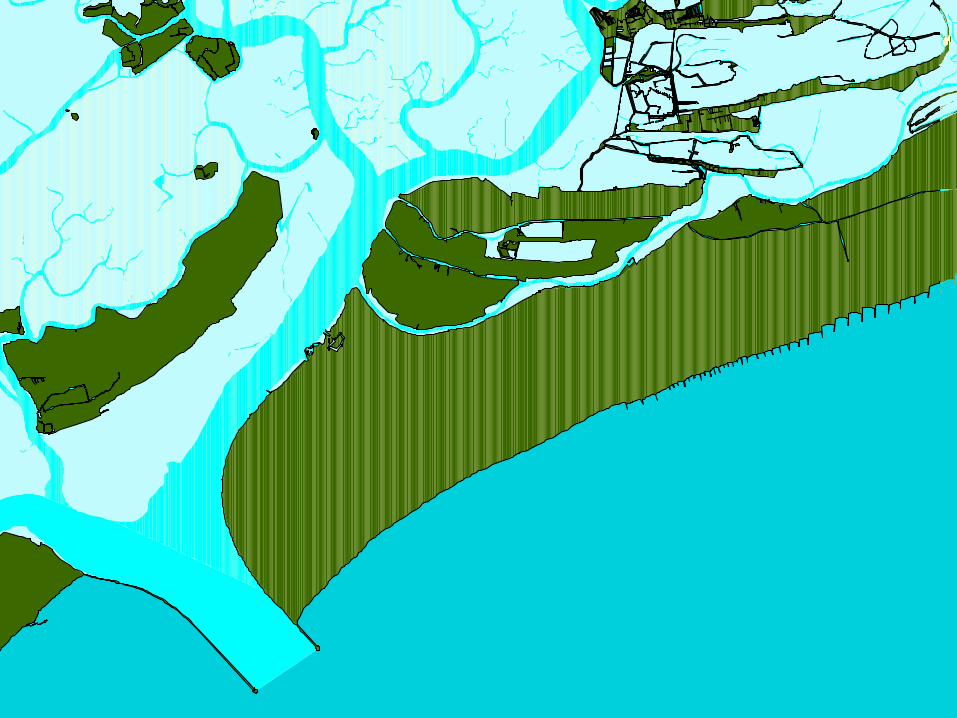
The Venice LagoonTaken from the SISALV — Experimental GeospatialInformation System at the IUAV for the Venice Lagoon(1996-1998)
Example #2:
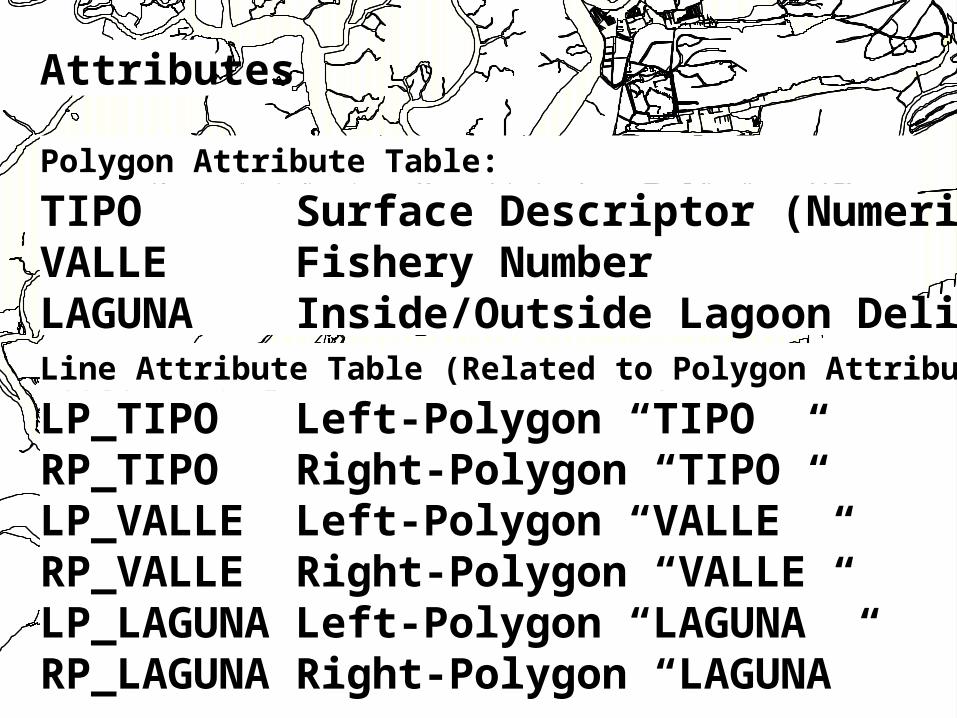
TIPO Surface Descriptor (Numeric)VALLE Fishery NumberLAGUNA Inside/Outside Lagoon Delimitation
Polygon Attribute Table:
Attributes
LP_TIPO Left-Polygon “TIPO”RP_TIPO Right-Polygon “TIPO”LP_VALLE Left-Polygon “VALLE”RP_VALLE Right-Polygon “VALLE”LP_LAGUNA Left-Polygon “LAGUNA”RP_LAGUNA Right-Polygon “LAGUNA”
Line Attribute Table (Related to Polygon Attribute Table):

TIPO >= 10 AND TIPO <= 19Polygon Attribute Table:
Dry Land

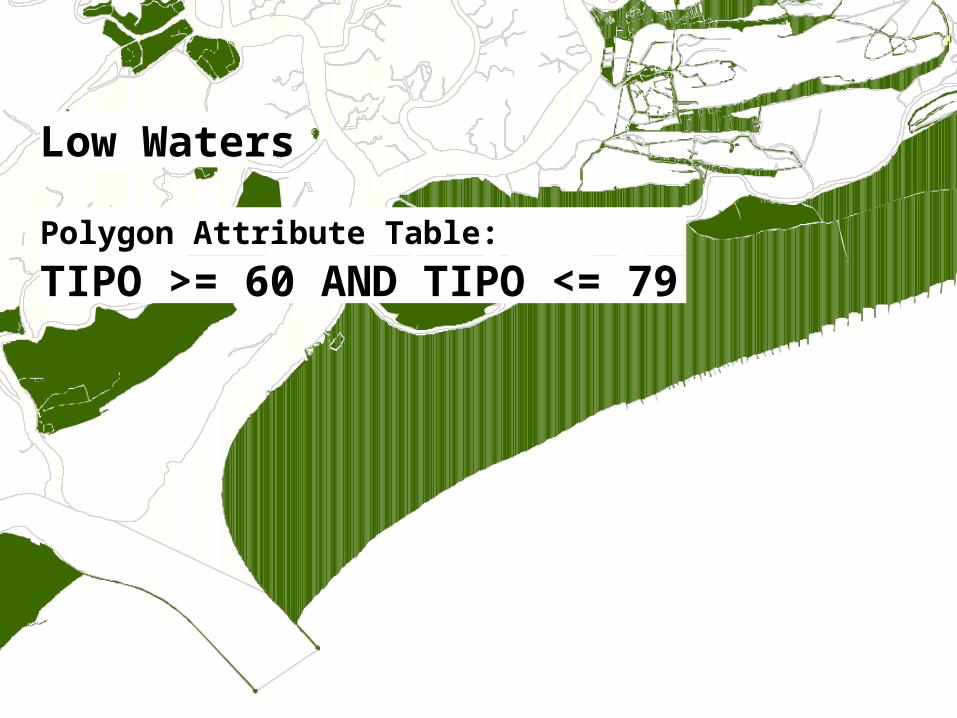
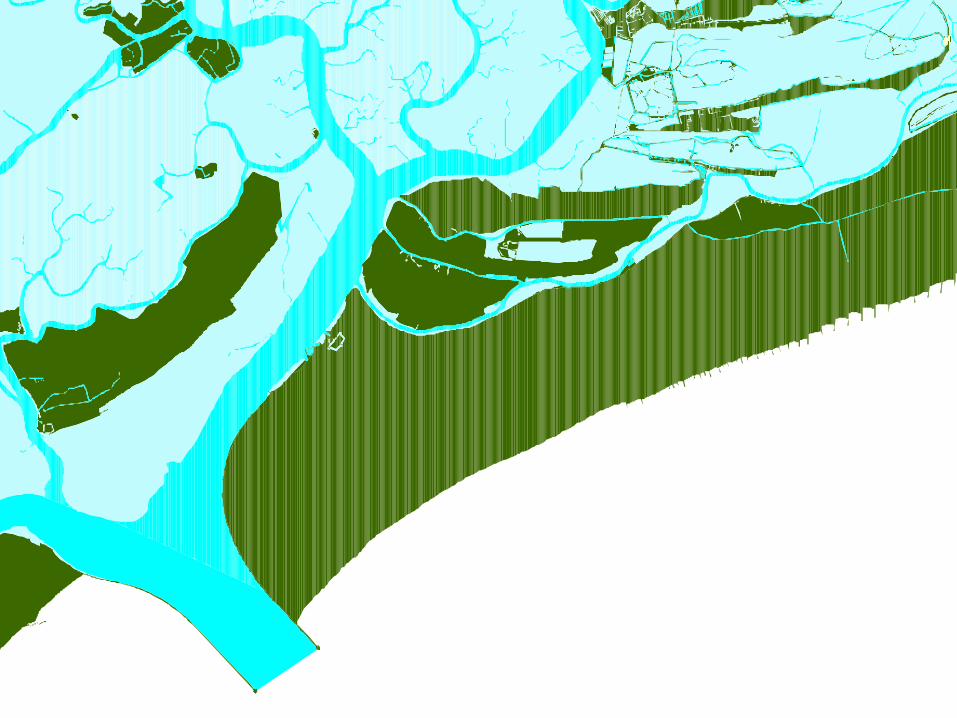
TIPO >= 60 AND TIPO <= 79Polygon Attribute Table:
Low Waters
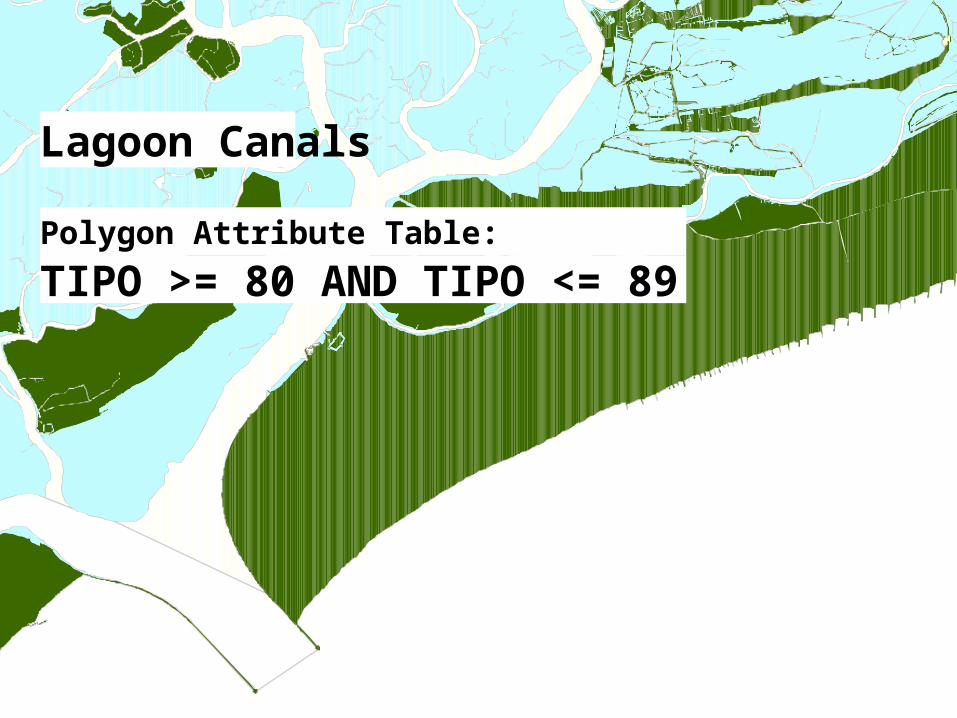
TIPO >= 80 AND TIPO <= 89Polygon Attribute Table:
Lagoon Canals

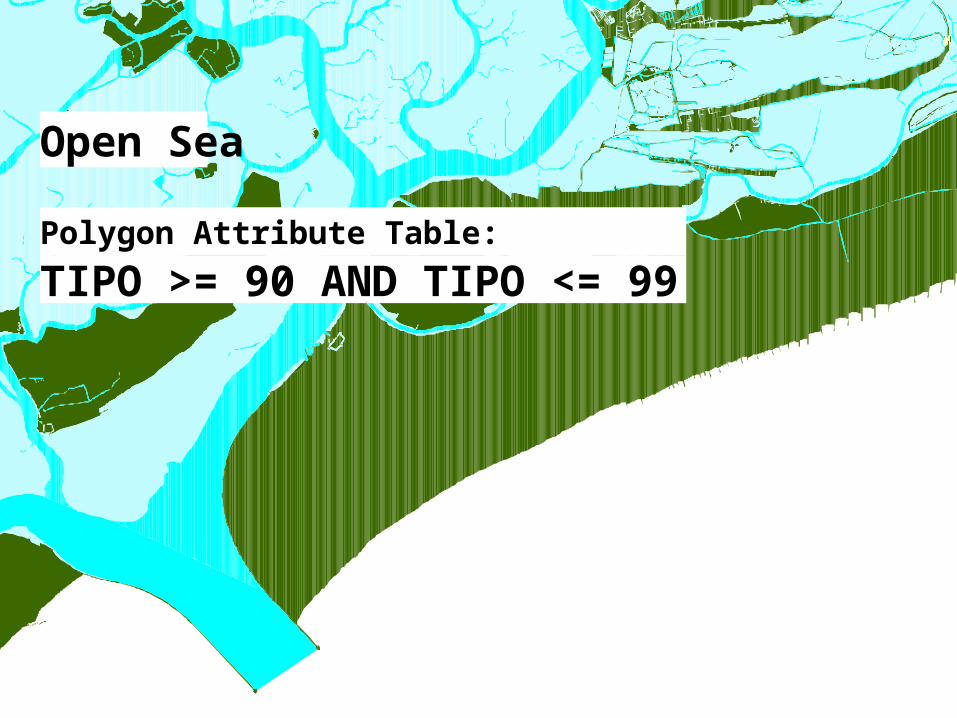
TIPO >= 90 AND TIPO <= 99Polygon Attribute Table:
Open Sea
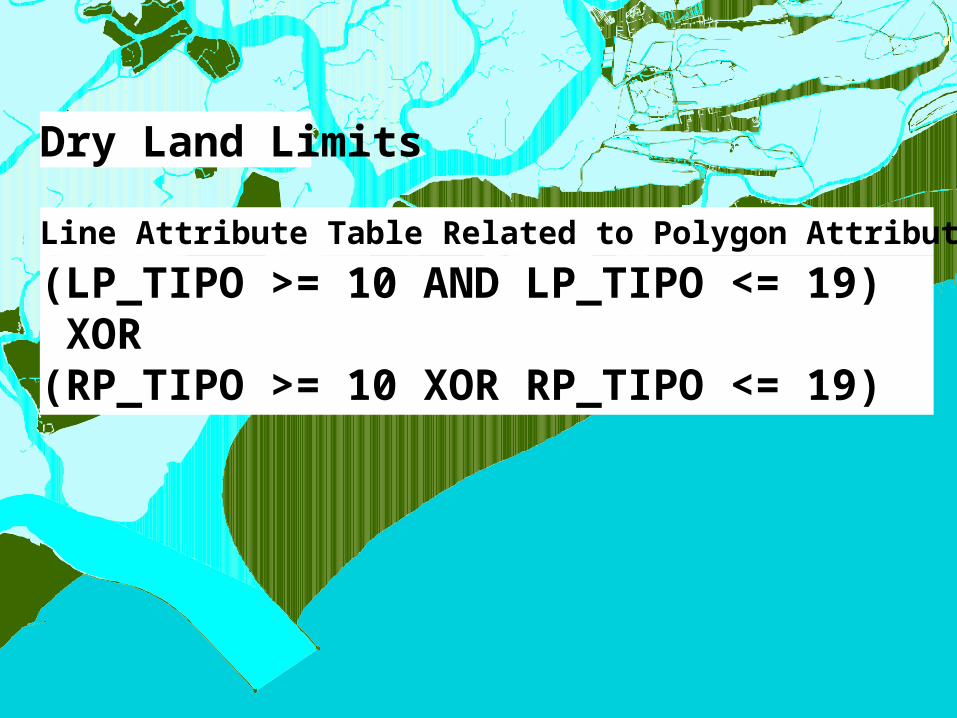
(LP_TIPO >= 10 AND LP_TIPO <= 19) XOR(RP_TIPO >= 10 XOR RP_TIPO <= 19)
Line Attribute Table Related to Polygon Attribute Table:
Dry Land Limits

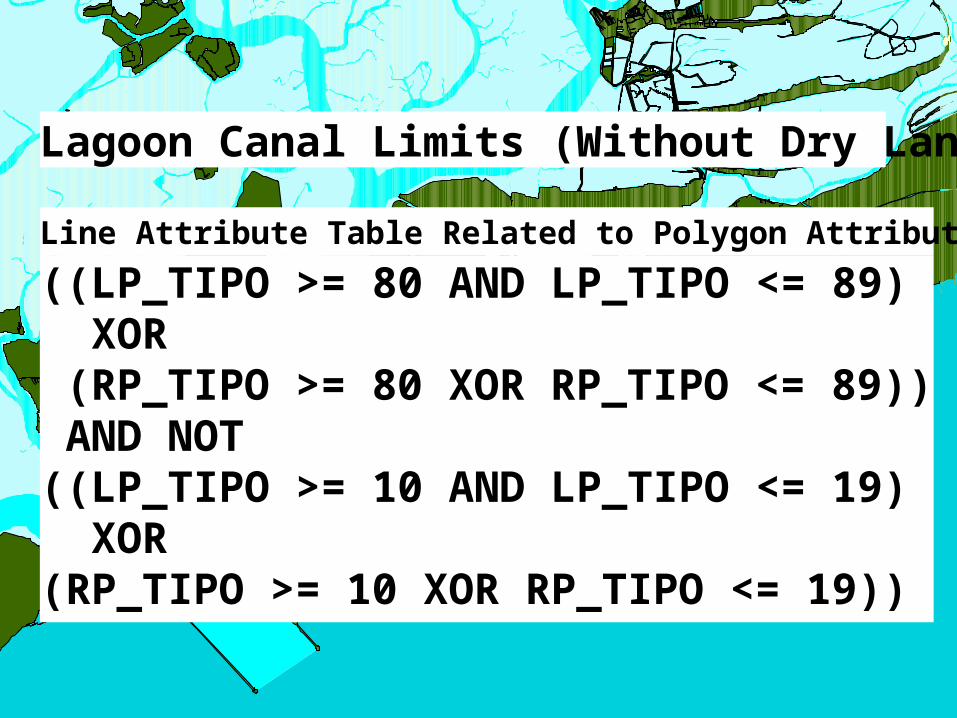
((LP_TIPO >= 80 AND LP_TIPO <= 89) XOR (RP_TIPO >= 80 XOR RP_TIPO <= 89)) AND NOT((LP_TIPO >= 10 AND LP_TIPO <= 19) XOR(RP_TIPO >= 10 XOR RP_TIPO <= 19))
Line Attribute Table Related to Polygon Attribute Table:
Lagoon Canal Limits (Without Dry Land Limits)

LP_VALLE <> RP_VALLELine Attribute Table Related to Polygon Attribute Table:
Fishery Limits

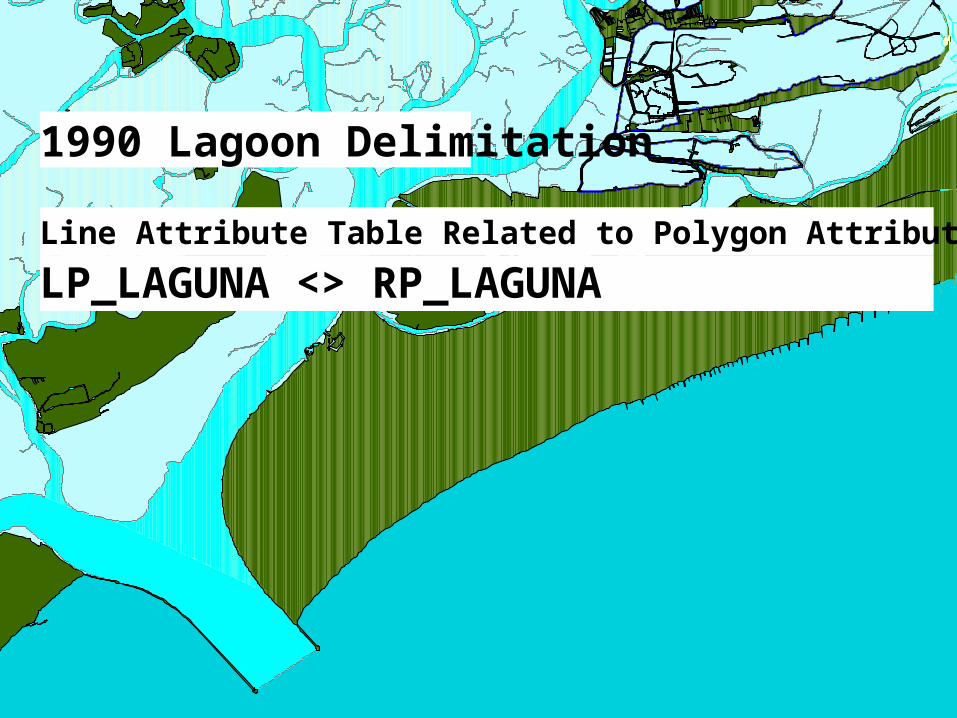
LP_LAGUNA <> RP_LAGUNALine Attribute Table Related to Polygon Attribute Table:
1990 Lagoon Delimitation


Attribute-Based Geospatial Analysis
Castelfranco Veneto (Province of Treviso)Settlement and Population Distribution
Taken from the Preliminary Analysis Chapter for theGeneral Programme of Urban Planning(1998)
Example #3:

Purpose
Residential settlements are extremely distributed in sub-urban and sub-rural areas.
1.
Residential settlements should be more centralised.2.
Sub-urban distributed population should be transferred to clearly urban and sub-urban areas.
3.
Need to distinguish proto-villages to be transformed into rural villages by transferring distributed settlements of the proto-villages’ surroundings.
4.
Where are the proto-villages?5.
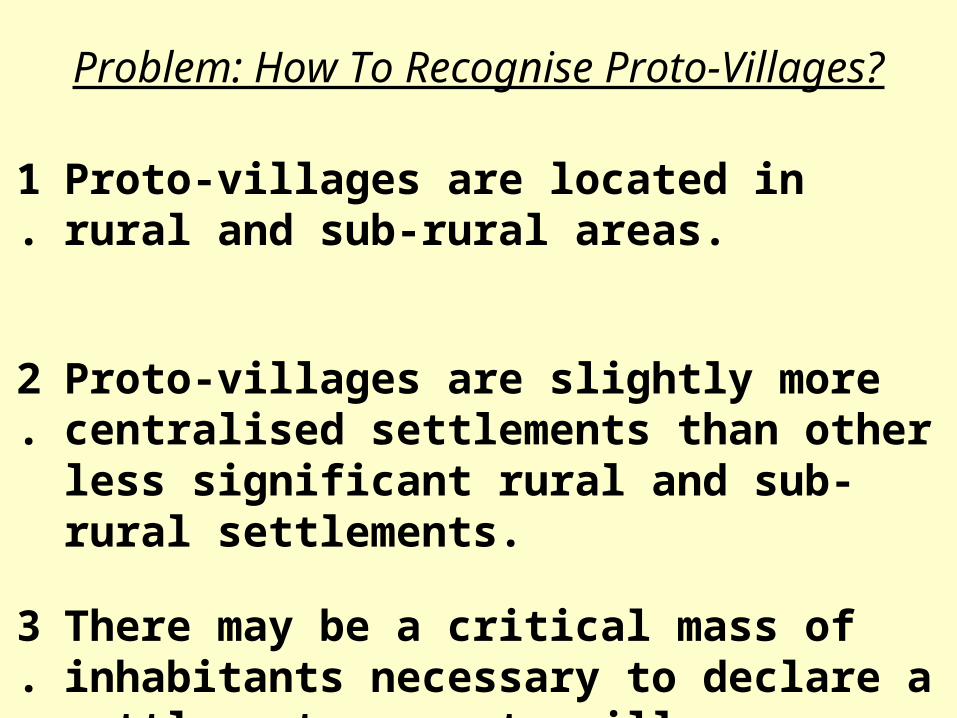
Problem: How To Recognise Proto-Villages?
Proto-villages are located in rural and sub-rural areas.
1.
There may be a critical mass of inhabitants necessary to declare a settlement as proto-village.
3.
Proto-villages are slightly more centralised settlements than other less significant rural and sub-rural settlements.
2.

Data Lack: There Are No Detailed Geospatial Data About Population Distribution!
Available Data Are:
1991 Census Tract Polygons(With Census Attribute Data)
2.
Residential Building Polygons(Without Volumes And Heights)
1.

Population Distribution ModelTo each residential building is attached a reference to the census tract to which it belongs
1.
For each census tract the total built-up area is calculated2.
Population is distributed between (attached to) residential buildings in order to each building’s “weight” (area percentage of total built-up area)
3.
An appropriated buffer around each building is generated in order to simulate contiguous urbanised areas
4.
For each contiguous urbanised area the total population is calculated5.
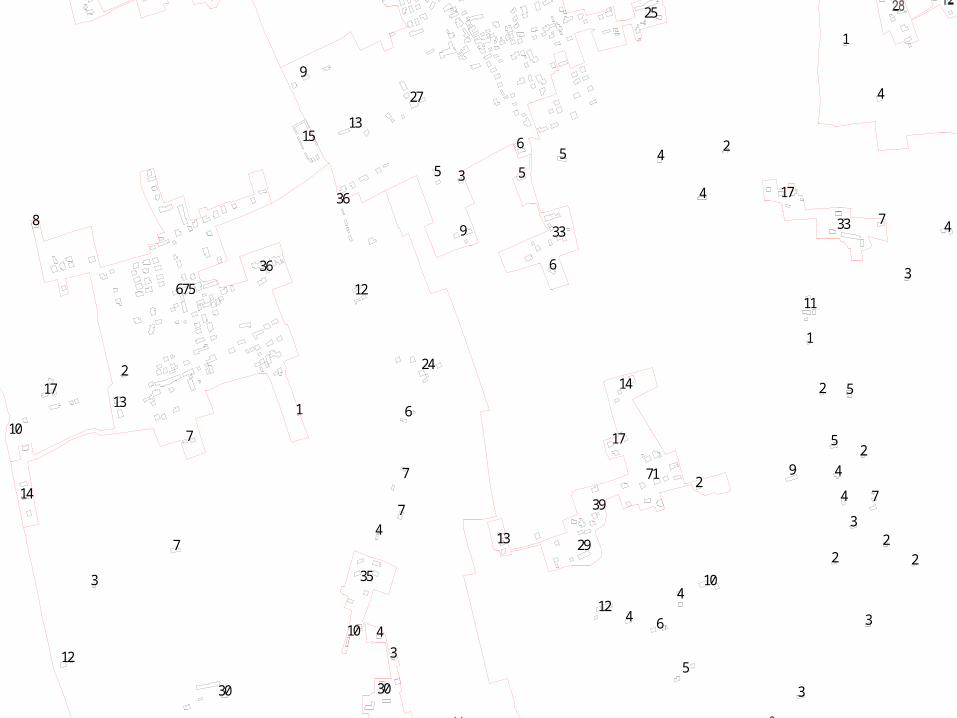
Geospatial information is displayed adopting appropriated population value ranges
6.
Contiguous Urbanised Surface Simulation
25
675
36
613
9
155
5
33
5 3
27
8 33
4
4
4
17
2
1
612
4
13 29
39
71
17
14
6
9
30
3410
35
74
7
7
1 6
24
12
36
7
3
30
12
14
10
172
13
4
3
7
11
1
52
52
492
4 7
32
22
410
5
3
3

25
675
36
6
13
9
155
5
33
5 3
27
8 33
4
4
4
17
2
1
612
4
13 29
39
71
17
14
6
9
30
3
410
35
74
7
7
1 6
24
12
36
7
3
30
12
14
10
172
13
4
3
7
11
1
52
52
492
4 7
32
22
410
5
3
3