use of strategic management accounting techniques by
TRANSCRIPT
Full Terms & Conditions of access and use can be found athttps://www.tandfonline.com/action/journalInformation?journalCode=rero20
Economic Research-Ekonomska Istraživanja
ISSN: (Print) (Online) Journal homepage: https://www.tandfonline.com/loi/rero20
Use of strategic management accountingtechniques by companies in the Czech Republic
Petr Petera & Libuše Šoljaková
To cite this article: Petr Petera & Libuše Šoljaková (2020) Use of strategic managementaccounting techniques by companies in the Czech Republic, Economic Research-EkonomskaIstraživanja, 33:1, 46-67, DOI: 10.1080/1331677X.2019.1697719
To link to this article: https://doi.org/10.1080/1331677X.2019.1697719
© 2019 The Author(s). Published by InformaUK Limited, trading as Taylor & FrancisGroup
Published online: 27 Dec 2019.
Submit your article to this journal
Article views: 6179
View related articles
View Crossmark data
Use of strategic management accounting techniquesby companies in the Czech Republic
Petr Petera and Libu�se �Soljakov�a
Department of Management Accounting, University of Economics, Prague, Czech Republic
ABSTRACTThe purpose of this paper is to investigate the degree of use ofstrategic management accounting (SMA) techniques and themain factors affecting this in the Czech Republic. In order toachieve such an understanding, we apply a quantitative approach,rooted in contingency theory, including descriptive statistics,correlation analysis and regression analysis. The most intensively-used SMA techniques are strategic planning and budgeting,customer accounting, and target costing. The least-used are inte-grated performance measurement systems, strategic pricing andactivity-based costing. Our respondents indicated that they expectan increase in the use of all SMA techniques over the next 3years. Regression analysis confirms that the implementation ofdifferentiation strategy (as opposed to cost leadership strategy)has a statistically significant and positive influence on SMA use.The findings of this study contribute to the better theoreticalunderstanding of the contingent factors influencing the use ofSMA techniques.
ARTICLE HISTORYReceived 30 January 2019Accepted 21 November 2019
KEYWORDSstrategic managementaccounting; managementcontrol; perceivedenvironmental uncertainty;contingency theory;strategy; Czech Republic
JEL CLASSIFICATIONSM21; M40; M41
1. Introduction
The term Strategic Management Accounting (SMA) was established by Simmonds(1981, p. 26), who defined SMA as ‘the provision and analysis of managementaccounting data about a business and its competitors for use in developing and moni-toring the business strategy’.
Simmonds forecast the rapid diffusion of SMA in practice, but this did not hap-pen. The lack of interest has also been manifested in research. In the Scopus database,the oldest article mentioning the term SMA is a paper by Simmonds (1982), but it isimpossible to find a single article on SMA indexed in Scopus or Web of Science from1982 to 1990. Nixon and Burns (2012, p. 229) claim that the term SMA was notaccepted by practitioners and that ‘SMA literature seems to have languished’.
This is rather surprising because there are several reasons why the implementationof SMA techniques is very important for company success. It is even possible to
CONTACT Petr Petera [email protected]� 2019 The Author(s). Published by Informa UK Limited, trading as Taylor & Francis Group.This is an Open Access article distributed under the terms of the Creative Commons Attribution License (http://creativecommons.org/licenses/by/4.0/), which permits unrestricted use, distribution, and reproduction in any medium, provided the original work isproperly cited.
ECONOMIC RESEARCH-EKONOMSKA ISTRAŽIVANJA2020, VOL. 33, NO. 1, 46–67https://doi.org/10.1080/1331677X.2019.1697719
postulate that the importance of SMA techniques is growing in the contemporary,highly-competitive business environment. The impossibility of managing companiessolely with financial measures and the need for more strategically-oriented tools suchas non-financial measures, externally-oriented information systems, and comprehen-sive systems supporting the implementation of strategy, requires the implementationof strategic management accounting techniques. The deployment of SMA can con-tribute to general strategic management maturity (a concept discussed, among others,by Witek-Crabb, 2016) and thus contribute to the sustainable development ofa company.
We therefore argue that neither of the extreme positions, i.e. those taken bySimmonds (1982) and Nixon and Burns (2012), is accurate. On the one hand, theexplosion of interest in SMA predicted by Simmonds did not arise; on the otherhand, from 1990 onwards interest in SMA revived and has slowly been growing, orat least holding steady. Our review of articles on SMA indexed in Scopus proves thatSMA has been abandoned neither in practice nor in academia and that research inthis area is meaningful.
In order to identify a narrower research gap, we conducted a literature review inhigh-quality journals (indexed in Scopus or Web of Science) and we found that thereare significantly under-researched areas. First, in SMA literature there are relativelyfew empirical articles using survey methodology (in total, we found approximately 20survey-based articles on SMA in the Scopus database). Second, the existing articleshave often addressed only a limited range of SMA techniques and thus failed to pro-vide a complete picture of SMA technique implementation. Third, these articles areoften descriptive and atheoretical. Regarding theory-based empirical survey research,the most-used is the contingency approach. Finally, we are not aware of any articledealing with the presentation and analysis of detailed information on SMA techniquesin the Czech Republic (see also Wagner, 2018) other than one conference paper(Bou�ckov�a & �Si�ska, 2017), which dealt with a sample of Czech and Slovak companies.�Si�ska (2016; 2018) analysed Czech companies, but addressed a broader topic andtherefore did not provide detailed information on SMA.
It is possible to summarise that knowledge on worldwide implementation of SMAtechniques is incomplete and also knowledge on the impact of various contingentvariables on the degree of SMA use is scarce and inconclusive. It is therefore import-ant to investigate these issues more profoundly and contribute to the development ofa more robust and practically usable theory.
This article therefore strives to answer the following research questions:
1. Which SMA techniques are used the most and which the least?2. Do companies intend to employ SMA to a greater or lesser extent in future?3. What are the key contingent variables which influence the degree of use of
SMA techniques?
These research questions are answered using 90 responses from a survey con-ducted in 2018 among 1,000 medium and large companies in the Czech Republic. Inorder to answer the questions, the obtained data are analysed using standard scientific
ECONOMIC RESEARCH-EKONOMSKA ISTRAŽIVANJA 47
research methods such as descriptive statistics, correlation analysis, multiple linearregression analysis and ordered logistic regression. The results are relevant both foracademia and in practice because they inform on the dissemination of SMA techni-ques, including their anticipated dynamic, and indicate the conditions in which theimplementation of SMA is especially important.
The first two questions are not developed into hypotheses and provide informationon the status quo and the anticipated development of SMA use. The third question setsour research in the stream of literature denoted as contingency-based. On the basis ofthe third research question, four hypotheses are formulated. Granlund and Lukka(2017, p. 63) state: ‘We define contingency-based management accounting as anapproach to management accounting research that seeks to understand how the oper-ation and effects of management accounting are not universal, but depend on the con-texts within which it operates’. Contingency theory, in contrast to best-practiceapproaches, proposes that the effectiveness of companies stems from adjusting theirmanagement control systems to the specific circumstances (contingencies) in which thecompanies operate. For contingency theory, it is therefore important to identify the keycontingent variables that affect the properties of management control systems.Consequently, theory can inform the practice regarding which contingencies should betaken into account during the implementation and use of various management controltools. The contingency-based approach is an important and well-established tool.
Specifically, in SMA research, it is possible to identify several prior studies usingthe contingency approach and contingent variables used in these studies are summar-ised in the ‘Selection and operationalisation of contingent variables’ section.Consideration was limited to studies applying advanced statistical methods such asregression analysis or structural modelling because simpler methods (e.g. variouscomparisons of means) are not suitable tools for the investigation of causalrelationships.
This article makes several key contributions. By providing a detailed comparisonof the previous operationalisation of SMA techniques (Table 1) and of contingentvariables (Table 2), our paper offers an up-to-date overview of the possibleapproaches. Moreover, in contrast to previous studies, a new SMA technique is intro-duced (strategic planning and budgeting) and our article thus contributes to the dis-cussion regarding those techniques which constitute SMA.
By investigating contingent variables, the article contributes to understanding thosecircumstances under which SMA is used. Our results provide support for the import-ance of the ‘strategy type’ contingent factor: companies implementing differentiationstrategy SMA use more than companies implementing cost leadership strategy. Thisis a most noteworthy result because together with prior studies it provides a strongcase for considering strategy to be an important contingent variable influencing SMAuse. From the practical viewpoint, these finding urges managers to use SMA inten-sively if their company pursues a strategy of differentiation. Contrary to several priorstudies, our results suggest that hypotheses regarding the positive impact of size, per-ceived environmental uncertainty and industry on the use of SMA techniques shouldbe rejected. As far as we know, the impact of industry on SMA use has not beeninvestigated via advanced statistical methods in any previous study.
48 P. PETERA AND L. ŠOLJAKOVÁ
The remainder of this study is divided into four main parts. The first part (litera-ture review and hypotheses development) provides the operationalisation of SMAtechniques as a variable, and the selection and operationalisation of the studied con-tingent variables. Hypotheses are formulated regarding the relationship of the keycontingent variables and the degree of use of SMA techniques. The second part(research methodology) explains the procedure of data gathering and sample charac-teristics. The third part (results and discussion) provides a concise description of thestructure of our sample and descriptive statistics related to the use of individual SMAtechniques, including anticipated development and an international comparison ofresults. Ultimately, the correlation and regression analysis of relationships betweencontingent variables and the degree of use of SMA techniques is presented andhypotheses are evaluated. The fourth part (conclusions) incorporates a summary ofthe key contributions of this study both to the literature and to practice, as well as adiscussion of the limitations and ideas for further research.
2. Literature review and hypotheses development
There are several reasons for the tepid acceptance of SMA both in practice and inacademia, one of which is the non-existence of a generally-accepted definition of the
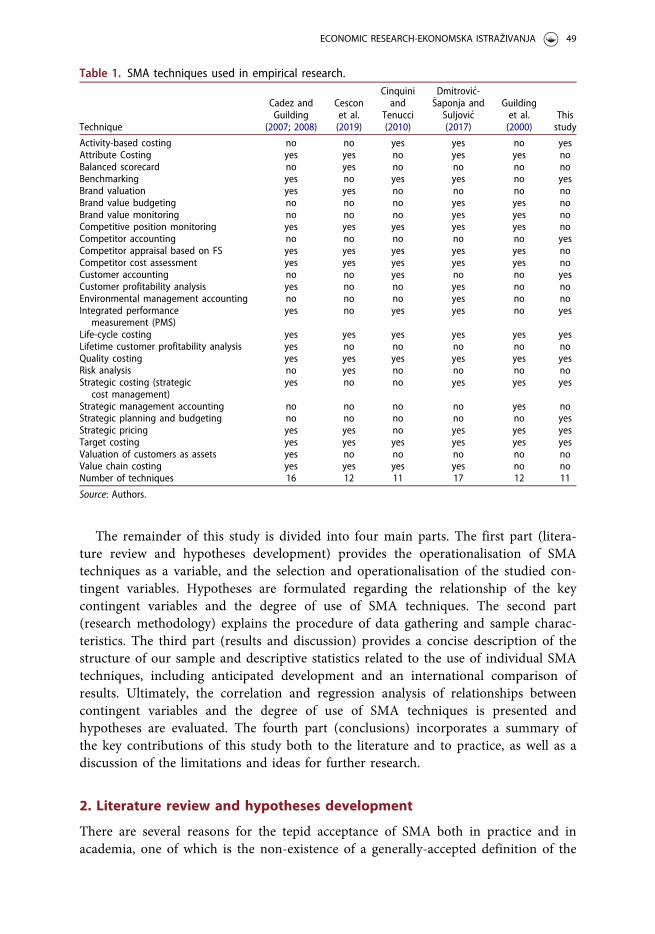
Table 1. SMA techniques used in empirical research.
Technique
Cadez andGuilding
(2007; 2008)
Cesconet al.(2019)
Cinquiniand
Tenucci(2010)
Dmitrovi�c-�Saponja andSuljovi�c(2017)
Guildinget al.(2000)
Thisstudy
Activity-based costing no no yes yes no yesAttribute Costing yes yes no yes yes noBalanced scorecard no yes no no no noBenchmarking yes no yes yes no yesBrand valuation yes yes no no no noBrand value budgeting no no no yes yes noBrand value monitoring no no no yes yes noCompetitive position monitoring yes yes yes yes yes noCompetitor accounting no no no no no yesCompetitor appraisal based on FS yes yes yes yes yes noCompetitor cost assessment yes yes yes yes yes noCustomer accounting no no yes no no yesCustomer profitability analysis yes no no yes no noEnvironmental management accounting no no no yes no noIntegrated performance
measurement (PMS)yes no yes yes no yes
Life-cycle costing yes yes yes yes yes yesLifetime customer profitability analysis yes no no no no noQuality costing yes yes yes yes yes yesRisk analysis no yes no no no noStrategic costing (strategic
cost management)yes no no yes yes yes
Strategic management accounting no no no no yes noStrategic planning and budgeting no no no no no yesStrategic pricing yes yes no yes yes yesTarget costing yes yes yes yes yes yesValuation of customers as assets yes no no no no noValue chain costing yes yes yes yes no noNumber of techniques 16 12 11 17 12 11
Source: Authors.
ECONOMIC RESEARCH-EKONOMSKA ISTRAŽIVANJA 49
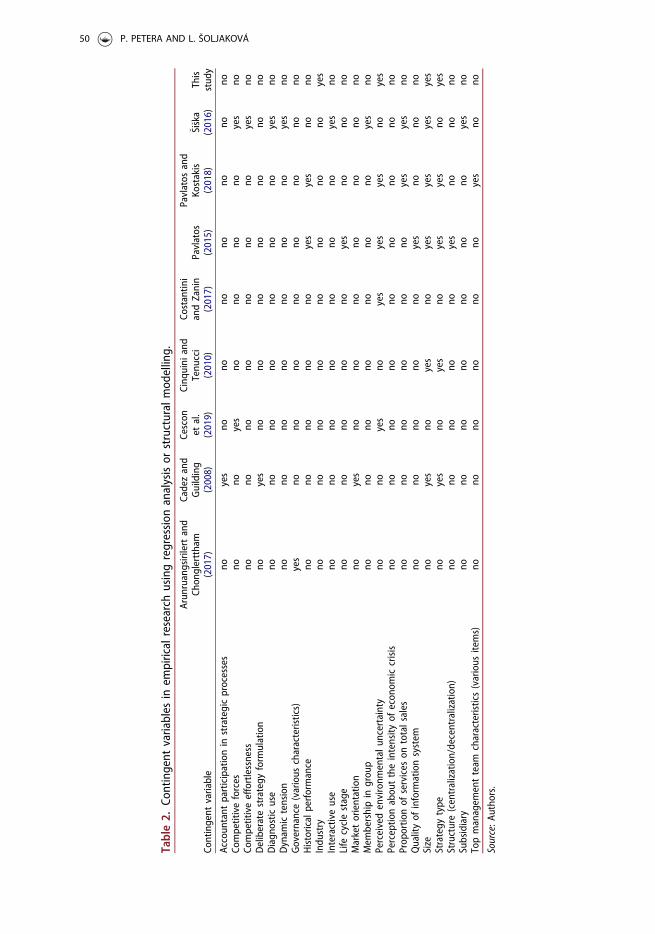
Table2.
Contingent
variables
inem
pirical
research
usingregression
analysisor
structuralmod
elling.
Contingent
variable
Arun
ruangsirilertand
Chon
glerttham
(2017)
Cadezand
Guilding
(2008)
Cescon
etal.
(2019)
Cinq
uini
and
Tenu
cci
(2010)
Costantin
iandZanin
(2017)
Pavlatos
(2015)
Pavlatos
and
Kostakis
(2018)
� Si� ska
(2016)
This
stud
y
Accoun
tant
participationin
strategicprocesses
noyes
nono
nono
nono
noCo
mpetitiveforces
nono
yes
nono
nono
yes
noCo
mpetitiveeffortlessness
nono
nono
nono
noyes
noDeliberatestrategy
form
ulation
noyes
nono
nono
nono
noDiagn
ostic
use
nono
nono
nono
noyes
noDynam
ictension
nono
nono
nono
noyes
noGovernance(various
characteristics)
yes
nono
nono
nono
nono
Historicalperformance
nono
nono
noyes
yes
nono
Indu
stry
nono
nono
nono
nono
yes
Interactiveuse
nono
nono
nono
noyes
noLife
cyclestage
nono
nono
noyes
nono
noMarketorientation
noyes
nono
nono
nono
noMem
bershipin
grou
pno
nono
nono
nono
yes
noPerceivedenvironm
entalu
ncertainty
nono
yes
noyes
yes
yes
noyes
Perceptio
nabou
ttheintensity
ofecon
omiccrisis
nono
nono
nono
nono
noProp
ortio
nof
services
ontotalsales
nono
nono
nono
yes
yes
noQualityof
inform
ationsystem
nono
nono
noyes
nono
noSize
noyes
noyes
noyes
yes
yes
yes
Strategy
type
noyes
noyes
noyes
yes
noyes
Structure(centralization/decentralization)
nono
nono
noyes
nono
noSubsidiary
nono
nono
nono
noyes
noTopmanagem
entteam
characteristics(various
items)
nono
nono
nono
yes
nono
Source:A
utho
rs.
50 P. PETERA AND L. ŠOLJAKOVÁ
term SMA. The contradictions and similarities in various definitions of SMA havebeen discussed in numerous seminal conceptual papers (Bromwich, 1990; Gond,Grubnic, Herzig, & Moon, 2012; Roslender & Hart, 2003; Bhimani & Langfield-Smith, 2007; Langfield-Smith, 2008; Lord, 1996; Ma & Tayles, 2009).
It is beyond the scope of this paper to discuss all these definitions, but it is pos-sible to summarise that scholars differ in their definition of SMA both in terms of itsscope and its structure, which influences the operationalisation of SMA. In ourresearch a relatively broad understanding of SMA was adopted, which in our opinionbest matches the nature of the information required for contemporary stra-tegic management.
2.1. Operationalisation of SMA techniques as a variable
It can be argued that empirical research often uses the conceptualization of SMAdeveloped in the influential articles by Guilding, Cravens, and Tayles (2000) andCadez and Guilding (2007; 2008). Table 1 depicts SMA techniques used in severalimportant articles and these techniques are compared with an approach taken inthis study.
Table 1 shows that the techniques considered as constituting SMA differ across thearticles. As far as we know, Table 1 includes all the relevant journal articles compre-hensively investigating SMA techniques. There are core techniques, which are used ineach piece of research, but also techniques which are not universally used or are col-lapsed into one category. In our research, a group of 11 SMA techniques was adoptedto investigate the extent of SMA use. Study by Cescon, Costantini, and Grassetti(2019) was published after our research had been designed.
In comparison with Cadez and Guilding (2007; 2008) we added activity-based cost-ing because we argue that this technique is not only a tool for the more exact alloca-tion of costs but also an important strategic technique, often accompanied by theimplementation of activity-based management. In this regard, we are in accordancewith Cinquini and Tenucci (2010) and Dmitrovi�c-�Saponja and Suljovi�c (2017), whoalso included this technique. Furthermore, we added strategic planning and budgetingbecause we consider this technique to be strategic and therefore relevant to the meas-urement of SMA use.
On the other hand, in contrast with Cadez and Guilding (2007; 2008), we excludedseveral SMA techniques and several techniques were collapsed into one. Specifically,we excluded attribute costing, a group of techniques related to brand valuation andvalue chain costing. Collapsed into one were techniques related to customer account-ing (an approach used in Cinquini & Tenucci, 2010) and techniques related to com-petitor accounting.
In contrast with Dmitrovi�c-�Saponja and Suljovi�c (2017), we decided to not includeenvironmental management accounting because we consider this tool to be part ofother SMA techniques.
Attribute costing was excluded because, according to our preliminary findings,practitioners and even academics do not know this technique well and asking aboutit may thus have been a source of confusion. Techniques related to brand valuation
ECONOMIC RESEARCH-EKONOMSKA ISTRAŽIVANJA 51
were excluded from our questionnaire because the majority of Czech companies areprivate and not public entities. Brand valuation is therefore irrelevant to these compa-nies. Value chain techniques were omitted because, similar to attribute costing, thesetechniques are often misunderstood and we argue that their measurement via ques-tionnaire surveys may be misleading.
Regarding an SMA-use measurement scale, in our research we used a five-pointLikert-type scale. For each of the selected 11 SMA techniques, the respondents wereasked to indicate on a scale - 1 (not at all), 2 (not much), 3 (partially), 4 (yes, inten-sively) and 5 (yes, very intensively) - to what degree their organization employs agiven technique at present, plus the expected degree of use in three years’ time. Ashort explanation of each technique was included directly into the text of the questionbecause we suspect that respondents do not pay enough attention to supplementarymaterials such as glossaries, etc.
For each respondent we also constructed an SMA-use index, which is calculated asan arithmetical mean of the values of all 11 SMA techniques.
2.2. Selection and operationalisation of contingent variables
According to the previous research, there are numerous contingent variables whichimpact the use of SMA techniques. Table 2 provides a detailed overview of contingentvariables used in prior studies. To our best knowledge, Table 2 includes all relevantjournal articles using advanced statistical methods (regression analysis, structuralmodelling) for investigation of the causal relationships in the area of SMA.
It is possible to summarise that numerous contingent variables were investigated,many of them in only one study. Obviously, it was impossible to investigate all thesevariables in our article and selection is always a combination of subjectivity and oftheoretical and empirical support for a given contingent variable. The most frequentlyinvestigated contingent factors in the SMA field are company size, strategy type, andperceived environmental uncertainty. The influential study of Cadez and Guilding(2008) in its qualitative part (the interviews) highlighted the importance of industry.Our article therefore investigates the following contingent factors: company size, per-ceived environmental uncertainty, strategy and industry.
Company size is considered an important contingent variable in numerous stud-ies. Within SMA research, size is usually measured as a unidimensional construct.For example, total revenues as a proxy for company size are used by Cadez andGuilding (2008) and by Cinquini and Tenucci (2010). In other studies, total assetsand the number of full-time employees are often used for size measurement.Considering the very strong, statistically significant positive correlation betweenmeasures of size, total turnover in 2017 was chosen as a proxy for company size inour research. The values of total turnover were found in the annual financialreports of the respondents.
Numerous researchers (e.g. �Si�ska, 2016; Cadez & Guilding, 2008) have found apositive relationship between the size of a company and the utilisation of variousmanagement accounting techniques. We therefore formulate this hypothesis:
H1: Company size positively impacts the use of SMA techniques.
52 P. PETERA AND L. ŠOLJAKOVÁ
Otley (2016) noted that of all the contingent variables, environmental uncertaintygained by far the widest attention in the field of management accounting. In ourresearch this construct was measured as perceived environmental uncertainty (PEU),which is a standard approach in the contingency-based literature. There are numer-ous operationalisations of perceived environmental uncertainty; we based the meas-urement of PEU on the approach taken by King, Clarkson, and Wallace (2010), whodistinguished two types of uncertainty – dynamism and hostility. Dynamism is associ-ated with a need for more externally-focused, broad and timely information; and hos-tility (competition) is connected with a higher emphasis on budgets. PEU wasmeasured using these questions:
1. How stable or dynamic is your company’s external environment? This questionis comprised of two sub-questions: (a) economic environment, (b) technologicalenvironment.
2. How would you characterise the market activities of your competitors?3. How intense is each of the following in your industry? This question is com-
prised of three sub-questions: (a) competition in the market for materials andservices, (b) competition for workforce, (c) competition in the outputs market.
Regarding the measurement scale for PEU, in our research we used a five-pointLikert-type scale. For the two questions related to the stability of the external envir-onment (1a, 1 b) we used a scale from 1 (stable) to 5 (dynamic); for question (2) weused a scale from 1 (very predictable) to 5 (very difficult to predict); and for the threequestions related to the intensity of competition (3a, 3 b, 3c) we used a scale from 1(not at all intense) to 5 (very intense). For each respondent we have also constructeda PEU index, which is calculated as an arithmetical mean of values of all answers tothe six questions related to PEU.
The relevance of SMA information should increase with perceived environmen-tal uncertainty and we therefore formulate the following hypothesis:
H2: Perceived environmental uncertainty positively impacts the use of SMA techniques.
Strategy is often used as a contingent variable in management accounting research,but Otley (2016) pointed out that there are numerous categorisations of strategy(Miles, Snow, Meyer, & Coleman, 1978; Porter, 1980; Gupta & Govindarajan, 1984).In this article, we employ Porter’s (1980) categorisation, specifically its operationalisa-tion by King et al. (2010), who distinguished two types of strategy (differentiationand cost leadership), and we asked respondents the following question:
How would you best describe your practice’s strategic emphasis (between cost leadership anddifferentiation)? This question included three sub-questions on (a) the quality of productsand services, (b) customer support and (c) the unique properties of products/services.
Regarding the measurement scale for strategy type, in our research we used a five-point Likert-type scale. All three sub-questions were answered on a scale from 1 (notimportant, low cost and price are crucial) to 5 (important). For each respondent wealso construct a Strategy index, which is calculated as the arithmetical mean of thevalues of all answers to the three questions related to strategy.
ECONOMIC RESEARCH-EKONOMSKA ISTRAŽIVANJA 53
We hypothesise that companies pursuing a strategy of differentiation need moreSMA information in all areas (including costs, because knowledge on costs is import-ant even if low costs are not the primary objective of the company). Our hypothesisis thus framed as follows:
H3: Companies pursuing a strategy of differentiation use SMA techniques more thancompanies pursuing a cost leadership strategy.
As far as we know, industry has not been examined as an important contingentvariable in the field of strategic management accounting. This is confirmed by thestudies listed in Table 2, in which industry was not examined as a contingent vari-able. On the other hand, Cadez and Guilding (2008, p. 853) stressed that all theirinterviewees advocated that the applicability of SMA is industry-specific.Unfortunately, limited consensus was accomplished regarding which particular indus-trial sector characteristics were conducive to SMA application.
We asked our respondents to indicate the industry in which their company oper-ates, according to the NACE classification, revision 2. We also cross-checked theiranswers with information on their websites and the business register. Consequently,we defined a dummy variable ‘industry’ with a value of 1 for manufacturing industryand 0 for all other industries.
We hypothesise that companies from manufacturing industry often operate inmore complex conditions than companies from other industries and therefore needSMA information more intensively. Our hypothesis is:
H4: Companies from manufacturing industry use SMA techniques more than companiesfrom other industries.
3. Research methodology
3.1. Data gathering
The data were collected via a questionnaire survey. The questionnaire was developedin the first half of 2018 after a comprehensive literature review which served for theidentification and operationalisation of key theoretical constructs (latent variables,which include multiple indicators) related to SMA and relationships betweenthese constructs.
The researchers intensively discussed the questionnaire over several months.Ultimately, we pilot-tested the survey on three executives (financial controllers andmanagerial accountants) and three academics and the relevant feedback was incorpo-rated into the questionnaire in the form of minor changes. The final version of thequestionnaire was finished in July 2018.
The data gathering took place from September 2018 through to the end ofDecember 2018; in total 90 complete and usable questionnaires were collected.
3.2. Sample description
The sample of companies for our research was sourced from the Albertina CZ GoldEdition database. The database was used to identify companies headquartered in the
54 P. PETERA AND L. ŠOLJAKOVÁ
Czech Republic with more than 50 employees and a turnover above 256 millionCZK. The selected companies spanned all industry groups except O – Public adminis-tration and defence, P – Education, Q – Human health and social work activities, S –Other service activities, T – Activities of households as employers, and U – Activitiesof extraterritorial organisations and bodies, consistent with NACE Rev. 2. Theauthors decided to investigate only medium and large companies in order to focus onorganisations of sufficient size and breadth of activities because SMA techniques tendnot to be used by small companies. The database search provided us with approxi-mately 3900 companies meeting the above criteria and from these companies we ran-domly selected a sample of 1000 companies.
The selected sample of 1000 companies was contacted by phone and if they agreedto participate in our research, we sent them an e-mail with a link to the web-basedquestionnaire. We asked for answers from respondents in senior finance positions,for example Chief Financial Officer, Financial Director, Economic Director, Head ofControlling Department, etc. This requirement was imposed in order to ensure thatthe contacted executives would possess considerable experience of SMA techniques.Some companies refused to take part in our inquiry. The most-cited reasons forrefusal were lack of time and corporate policy. These reasons for non-participationare the same as the reasons mentioned in Cadez and Guilding (2007).
4. Results and discussion
The results are presented in several steps. First, we provide a concise description ofour respondents. Second, we provide descriptive statistics related to the degree of useof individual SMA techniques and an international comparison of results (Tables 3and 4). Finally, we apply correlation and regression analysis and evaluate our hypoth-eses (Tables 5–7).
Our respondents consist only of medium and large companies. There are two com-panies with less than 50 employees and three companies with a turnover below 250million CZK, the rest of the respondents fully meeting the initial selection criteria.Presumably the reason why these companies were selected from the database is thatthe data on these companies were not entirely exact or fully up-to-date. Despite thefact that these values do not meet our initial selection criteria, we decided not toexclude these companies because they were very close to the threshold values.
From the viewpoint of the industrial structure of our respondents, the majority ofcompanies are from manufacturing industry (55.6% of respondents, i.e. 50 compa-nies) followed by the wholesale and retail trade industry (20.0% of respondents, i.e.18 companies), and construction industry (7.8% of respondents, i.e. 7 companies).The other industries are represented by three or fewer companies.
Descriptive statistics related to the use of individual SMA techniques use can befound in Table 3.
Table 3 shows that the mean values of SMA use vary from 2.40 (integrated PMS)to 3.46 (strategic planning and budgeting). The median value of SMA use rangesfrom 2, i.e. weak utilisation of a given technique (strategic pricing and integratedPMS) to 4, i.e. intensive utilisation of a given technique (strategic planning and
ECONOMIC RESEARCH-EKONOMSKA ISTRAŽIVANJA 55
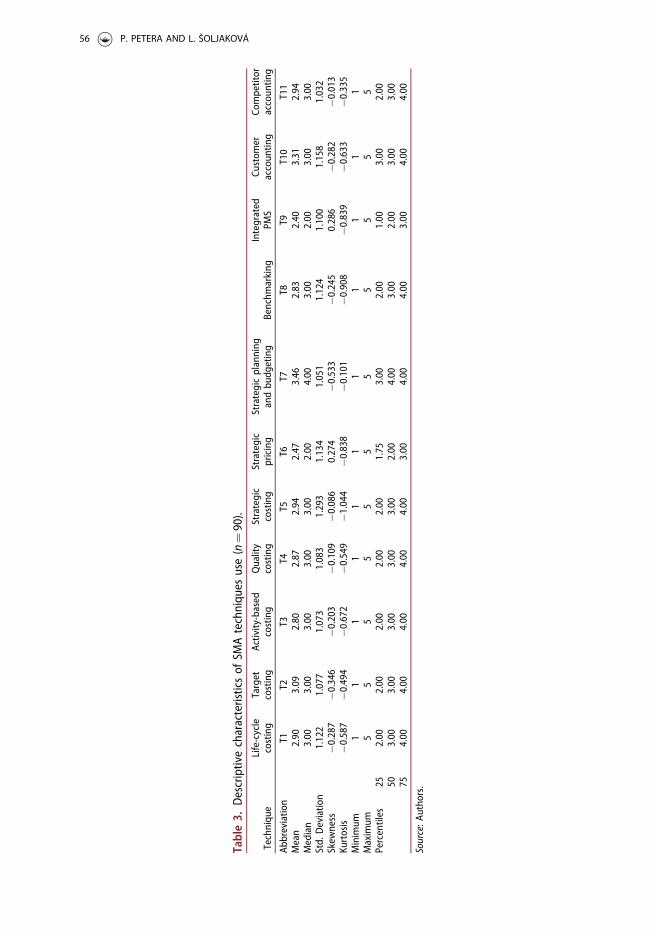
Table3.
Descriptivecharacteristicsof
SMAtechniqu
esuse(n¼90).
Techniqu
eLife-cycle
costing
Target
costing
Activity-based
costing
Quality
costing
Strategic
costing
Strategic
pricing
Strategicplanning
andbu
dgeting
Benchm
arking
Integrated
PMS
Custom
eraccoun
ting
Competitor
accoun
ting
Abbreviatio
nT1
T2T3
T4T5
T6T7
T8T9
T10
T11
Mean
2.90
3.09
2.80
2.87
2.94
2.47
3.46
2.83
2.40
3.31
2.94
Median
3.00
3.00
3.00
3.00
3.00
2.00
4.00
3.00
2.00
3.00
3.00
Std.
Deviatio
n1.122
1.077
1.073
1.083
1.293
1.134
1.051
1.124
1.100
1.158
1.032
Skew
ness
�0.287
�0.346
�0.203
�0.109
�0.086
0.274
�0.533
�0.245
0.286
�0.282
�0.013
Kurtosis
�0.587
�0.494
�0.672
�0.549
�1.044
�0.838
�0.101
�0.908
�0.839
�0.633
�0.335
Minimum
11
11
11
11
11
1Maximum
55
55
55
55
55
5Percentiles
252.00
2.00
2.00
2.00
2.00
1.75
3.00
2.00
1.00
3.00
2.00
503.00
3.00
3.00
3.00
3.00
2.00
4.00
3.00
2.00
3.00
3.00
754.00
4.00
4.00
4.00
4.00
3.00
4.00
4.00
3.00
4.00
4.00
Source:A
utho
rs.
56 P. PETERA AND L. ŠOLJAKOVÁ
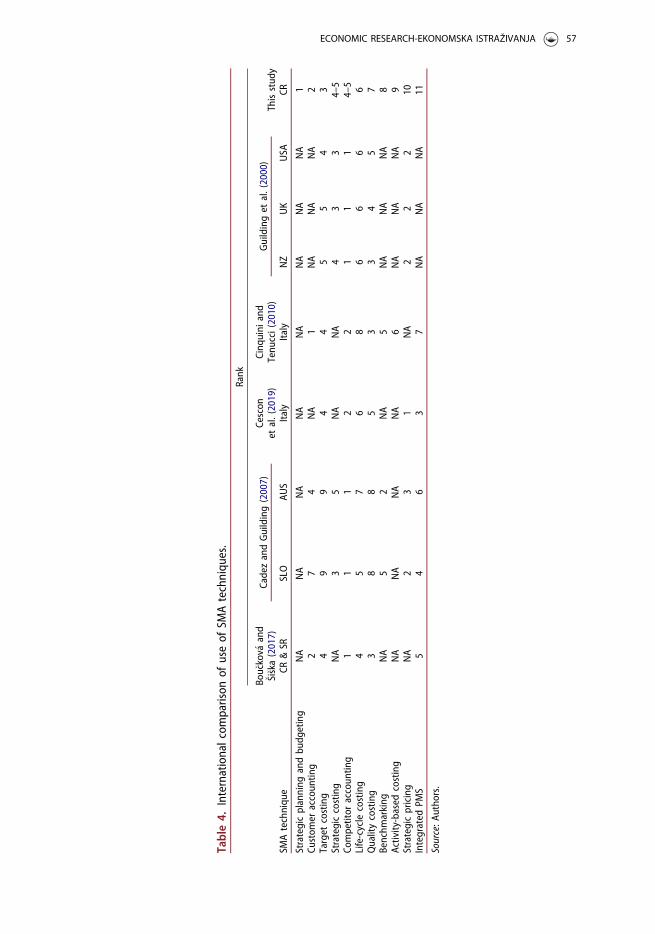
Table4.
Internationalcom
parison
ofuseof
SMAtechniqu
es.
SMAtechniqu
e
Rank
Bou� ckov� a
and
� Si� ska(2017)
CadezandGuilding(2007)
Cescon
etal.(2019)
Cinq
uini
and
Tenu
cci(2010)
Guildinget
al.(2000)
Thisstud
yCR
&SR
SLO
AUS
Italy
Italy
NZ
UK
USA
CR
Strategicplanning
andbu
dgeting
NA
NA
NA
NA
NA
NA
NA
NA
1Cu
stom
eraccoun
ting
27
4NA
1NA
NA
NA
2Target
costing
49
94
45
54
3Strategiccosting
NA
35
NA
NA
43
34–5
Competitor
accoun
ting
11
12
21
11
4–5
Life-cycle
costing
45
76
86
66
6Qualitycosting
38
85
33
45
7Benchm
arking
NA
52
NA
5NA
NA
NA
8Activity-based
costing
NA
NA
NA
NA
6NA
NA
NA
9Strategicpricing
NA
23
1NA
22
210
Integrated
PMS
54
63
7NA
NA
NA
11
Source:A
utho
rs.
ECONOMIC RESEARCH-EKONOMSKA ISTRAŽIVANJA 57
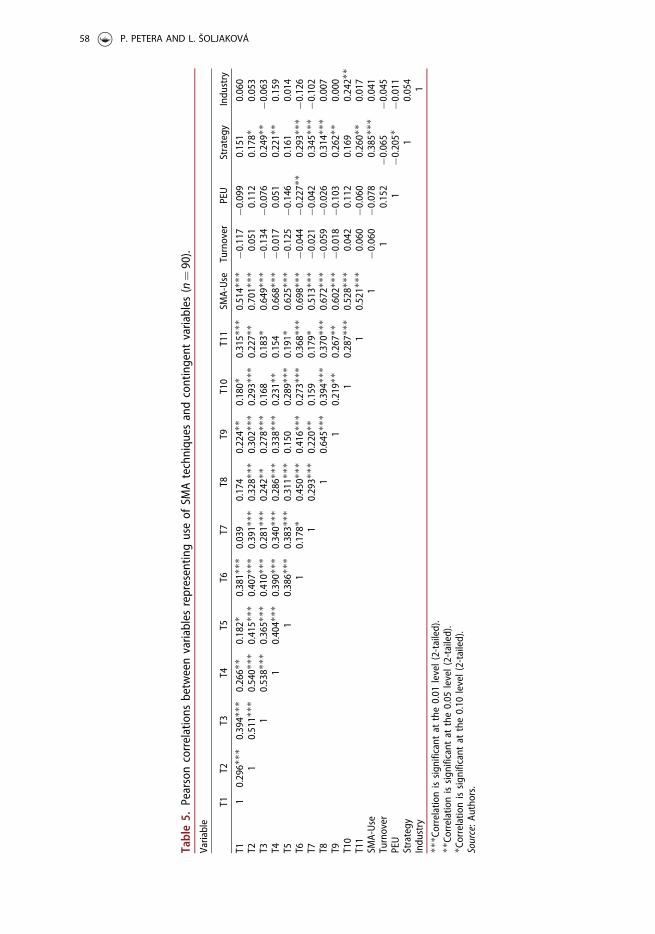
Table5.
Pearsoncorrelations
betweenvariables
representin
guseof
SMAtechniqu
esandcontingent
variables
(n¼90).
Variable
T1T2
T3T4
T5T6
T7T8
T9T10
T11
SMA-Use
Turnover
PEU
Strategy
Indu
stry
T11
0.296���
0.394���
0.266��
0.182�
0.381���
0.039
0.174
0.224��
0.180�
0.315���
0.514���
�0.117
�0.099
0.151
0.060
T21
0.511���
0.540���
0.415���
0.407���
0.391���
0.328���
0.302���
0.293���
0.227��
0.701���
0.051
0.112
0.178�
0.053
T31
0.538���
0.365���
0.410���
0.281���
0.242��
0.278���
0.168
0.183�
0.649���
�0.134
�0.076
0.249��
�0.063
T41
0.404���
0.390���
0.340���
0.286���
0.338���
0.231��
0.154
0.668���
�0.017
0.051
0.221��
0.159
T51
0.386���
0.383���
0.311���
0.150
0.289���
0.191�
0.625���
�0.125
�0.146
0.161
0.014
T61
0.178�
0.450���
0.416���
0.273���
0.368���
0.698���
�0.044
�0.227��
0.293���
�0.126
T71
0.293���
0.220��
0.159
0.179�
0.513���
�0.021
�0.042
0.345���
�0.102
T81
0.645���
0.394���
0.370���
0.672���
�0.059
�0.026
0.314���
0.007
T91
0.219��
0.267��
0.602���
�0.018
�0.103
0.262��
0.000
T10
10.287���
0.528���
0.042
0.112
0.169
0.242��
T11
10.521���
0.060
�0.060
0.260��
0.017
SMA-Use
1�0
.060
�0.078
0.385���
0.041
Turnover
10.152
�0.065
�0.045
PEU
1�0
.205�
�0.011
Strategy
10.054
Indu
stry
1��� C
orrelatio
nissign
ificant
atthe0.01
level(2-tailed).
��Co
rrelationissign
ificant
atthe0.05
level(2-tailed).
� Correlatio
nissign
ificant
atthe0.10
level(2-tailed).
Source:A
utho
rs.
58 P. PETERA AND L. ŠOLJAKOVÁ
budgeting). The median value of the other techniques is three, which indicates partialuse of a given technique. The minimal value for all techniques is one (no use of agiven technique) and the maximal value five (very intensive use of a given technique).The negative values of the skewness of variables representing use of the individualSMA techniques suggest that the frequent amounts of use of these techniques areclustered at the higher end.
Table 4 displays an international comparison of our results (the table includingonly techniques investigated in our study) with the studies of Bou�ckov�a and �Si�ska(2017), Cadez and Guilding (2007), Cescon et al. (2019), Cinquini and Tenucci(2010), and Guilding et al. (2000). Table 4 omits a study by Dmitrovi�c-�Saponja andSuljovi�c (2017) because they measured the utilisation of SMA techniques as a binaryvariable and not on a Likert-type scale.
International comparison is not straightforward because in the mentioned studiesdifferent SMA techniques were investigated and different measurement scales wereused (e.g. we used five-point Likert-type scale while other researchers used seven-point or even eleven-point scales). For comparison we therefore use rankings and notmean values. Moreover, for some techniques (e.g. competitor accounting) we meas-ured them as one technique while other researchers measured them as more than one(e.g. competitor performance appraisal and competitor cost assessment). In such caseswe clustered all the techniques into one (so that it matches our list of techniques)and assigned the best ranking (for example, if competitor performance appraisal isranked 2 and competitor cost assessment is ranked 3, then the clustered technique ofcompetitor accounting receives rank 2). Moreover, Bou�ckov�a and �Si�ska (2017) alsoinvestigated small companies (whose strategic behaviour is largely based on intuitionand the recognition and utilisation of opportunities). We therefore have to comparethe results with caution.
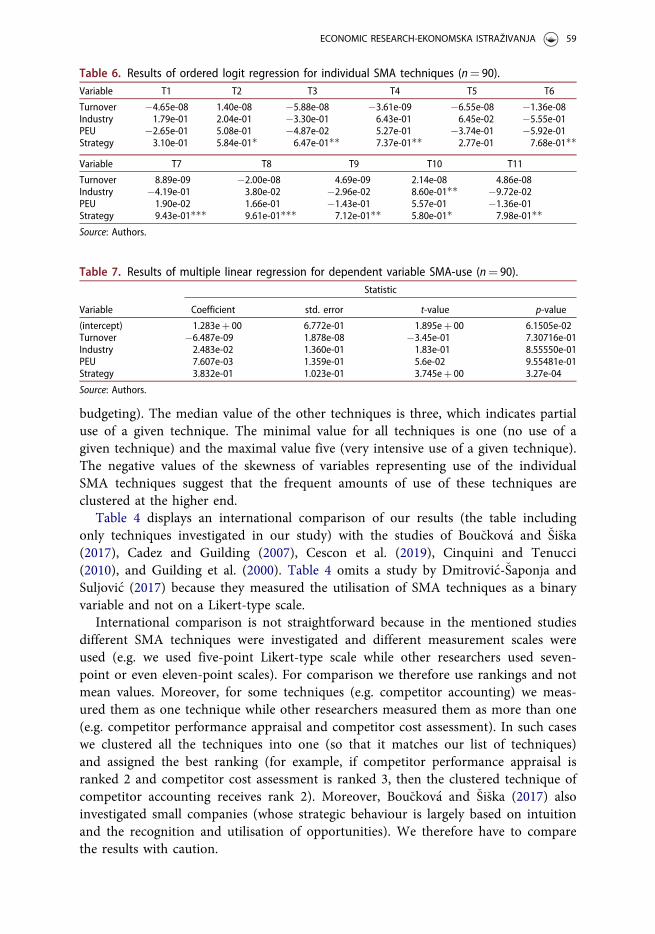
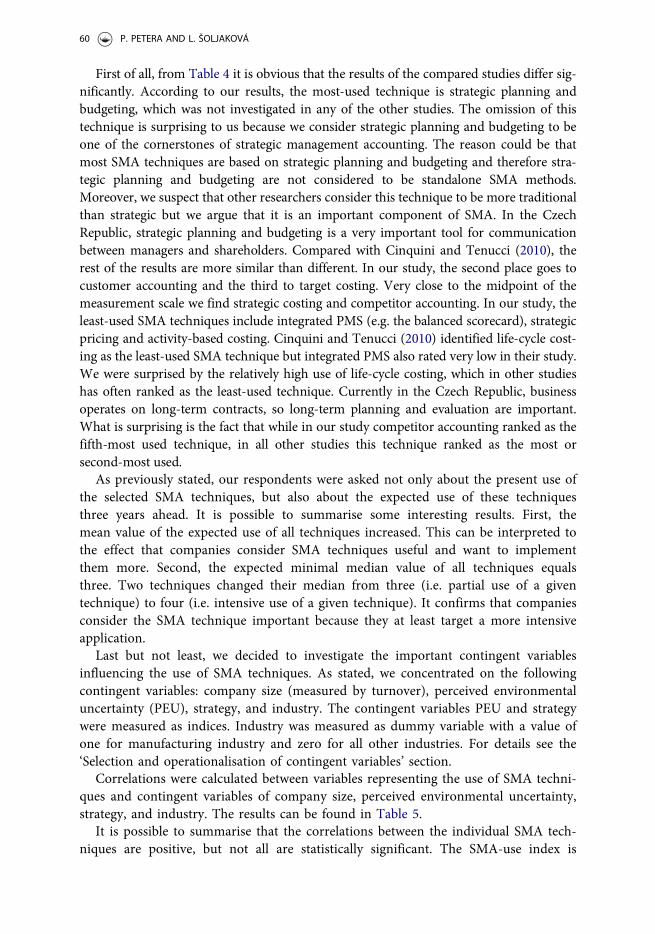
Table 6. Results of ordered logit regression for individual SMA techniques (n¼ 90).Variable T1 T2 T3 T4 T5 T6
Turnover �4.65e-08 1.40e-08 �5.88e-08 �3.61e-09 �6.55e-08 �1.36e-08Industry 1.79e-01 2.04e-01 �3.30e-01 6.43e-01 6.45e-02 �5.55e-01PEU �2.65e-01 5.08e-01 �4.87e-02 5.27e-01 �3.74e-01 �5.92e-01Strategy 3.10e-01 5.84e-01� 6.47e-01�� 7.37e-01�� 2.77e-01 7.68e-01��
Variable T7 T8 T9 T10 T11
Turnover 8.89e-09 �2.00e-08 4.69e-09 2.14e-08 4.86e-08Industry �4.19e-01 3.80e-02 �2.96e-02 8.60e-01�� �9.72e-02PEU 1.90e-02 1.66e-01 �1.43e-01 5.57e-01 �1.36e-01Strategy 9.43e-01��� 9.61e-01��� 7.12e-01�� 5.80e-01� 7.98e-01��Source: Authors.
Table 7. Results of multiple linear regression for dependent variable SMA-use (n¼ 90).
Variable
Statistic
Coefficient std. error t-value p-value
(intercept) 1.283eþ 00 6.772e-01 1.895eþ 00 6.1505e-02Turnover �6.487e-09 1.878e-08 �3.45e-01 7.30716e-01Industry 2.483e-02 1.360e-01 1.83e-01 8.55550e-01PEU 7.607e-03 1.359e-01 5.6e-02 9.55481e-01Strategy 3.832e-01 1.023e-01 3.745eþ 00 3.27e-04
Source: Authors.
ECONOMIC RESEARCH-EKONOMSKA ISTRAŽIVANJA 59
First of all, from Table 4 it is obvious that the results of the compared studies differ sig-nificantly. According to our results, the most-used technique is strategic planning andbudgeting, which was not investigated in any of the other studies. The omission of thistechnique is surprising to us because we consider strategic planning and budgeting to beone of the cornerstones of strategic management accounting. The reason could be thatmost SMA techniques are based on strategic planning and budgeting and therefore stra-tegic planning and budgeting are not considered to be standalone SMA methods.Moreover, we suspect that other researchers consider this technique to be more traditionalthan strategic but we argue that it is an important component of SMA. In the CzechRepublic, strategic planning and budgeting is a very important tool for communicationbetween managers and shareholders. Compared with Cinquini and Tenucci (2010), therest of the results are more similar than different. In our study, the second place goes tocustomer accounting and the third to target costing. Very close to the midpoint of themeasurement scale we find strategic costing and competitor accounting. In our study, theleast-used SMA techniques include integrated PMS (e.g. the balanced scorecard), strategicpricing and activity-based costing. Cinquini and Tenucci (2010) identified life-cycle cost-ing as the least-used SMA technique but integrated PMS also rated very low in their study.We were surprised by the relatively high use of life-cycle costing, which in other studieshas often ranked as the least-used technique. Currently in the Czech Republic, businessoperates on long-term contracts, so long-term planning and evaluation are important.What is surprising is the fact that while in our study competitor accounting ranked as thefifth-most used technique, in all other studies this technique ranked as the most orsecond-most used.
As previously stated, our respondents were asked not only about the present use ofthe selected SMA techniques, but also about the expected use of these techniquesthree years ahead. It is possible to summarise some interesting results. First, themean value of the expected use of all techniques increased. This can be interpreted tothe effect that companies consider SMA techniques useful and want to implementthem more. Second, the expected minimal median value of all techniques equalsthree. Two techniques changed their median from three (i.e. partial use of a giventechnique) to four (i.e. intensive use of a given technique). It confirms that companiesconsider the SMA technique important because they at least target a more intensiveapplication.
Last but not least, we decided to investigate the important contingent variablesinfluencing the use of SMA techniques. As stated, we concentrated on the followingcontingent variables: company size (measured by turnover), perceived environmentaluncertainty (PEU), strategy, and industry. The contingent variables PEU and strategywere measured as indices. Industry was measured as dummy variable with a value ofone for manufacturing industry and zero for all other industries. For details see the‘Selection and operationalisation of contingent variables’ section.
Correlations were calculated between variables representing the use of SMA techni-ques and contingent variables of company size, perceived environmental uncertainty,strategy, and industry. The results can be found in Table 5.
It is possible to summarise that the correlations between the individual SMA tech-niques are positive, but not all are statistically significant. The SMA-use index is
60 P. PETERA AND L. ŠOLJAKOVÁ
calculated as an arithmetical mean of all 11 SMA techniques and we can see that theindex is positively and statistically significantly correlated with all SMA techniques.
Correlations between turnover and the individual SMA techniques are not statistic-ally significant and moreover are usually negative. This result may seem surprisingbecause �Si�ska (2016), for example, found that size was the most influential controlvariable. The correlation between turnover and the SMA-use index is negative, butnot statistically significant.
The correlation between perceived environmental uncertainty and individual SMAtechniques is positive (but not statistically significant) only for target costing, qualitycosting and customer accounting. For all other SMA techniques, the correlation isnegative, and in the case of strategic pricing is negative and statistically significant.The correlation between perceived environmental uncertainty and the SMA-use indexis negative, but not statistically significant.
The correlation between strategy and the individual SMA techniques is positiveand, in many cases, statistically significant. The correlation between strategy and theSMA-use index is positive and statistically significant. It is possible to conclude thatthe use of SMA techniques increases together with the implementation of differenti-ation strategy (as opposed to a strategy of cost leadership).
The correlation between industry (manufacturing) and the individual SMA techni-ques is statistically significant and positive only for customer accounting. For otherSMA techniques the correlation is not statistically significant.
Correlation does not imply causation and we therefore applied regression analysis.We analysed the dependence of the relative dependent variables (11 SMA techniques)on company size, perceived environmental uncertainty (PEU), strategy (cost leader-ship vs differentiation) and industry. We used the following regression model:
SMAT ¼ b0 þ b1 � Turnoveri þ b2 � Industryi þ b3 � PEUi þ b4 � Strategyi þ ei(1)
where SMAT are the individual SMA techniques; b0 is a constant; b1…b4 are regres-sion coefficients; Turnover is the turnover of a company (in thousands of CZK);Industry is a dummy variable whose value is 1 if the company belongs to a manufac-turing industry and 0 for other industries; PEU is an index measuring perceivedenvironmental uncertainty; and Strategy is an index measuring the inclination of acompany towards differentiation strategy as opposed to cost leadership strategy.
Because SMAT is measured on a 5-point Likert Scale, we used ordered logitregression. Consequently, equations are estimated for all SMA techniques, i.e., in totalwe estimate 11 equations, the results of which are found in Table 6.
Statistical significance (p-values) is expressed by the number of stars, ‘�’ meaninga p-value between 0.10 and 0.05, ‘��’a p-value between 0.05 and 0.01, and ‘���’ ap-value of less than 0.01.
To summarise, we found a statistically significant dependence only betweenStrategy and the majority of SMA techniques (only life-cycle costing and strategiccosting – T1 and T5 – not being statistically significant). Other contingent variablesdo not have a statistically significant influence on the use of SMA techniques except
ECONOMIC RESEARCH-EKONOMSKA ISTRAŽIVANJA 61
manufacturing industry, which has a statistically significant and positive influence oncustomer accounting.
Ultimately, we tested the dependence of the SMA-use index (the arithmetical meanof all 11 SMA techniques) on the selected contingent variables and the following mul-tiple linear regression model was used:
SMA�use ¼ b0 þ b1 � Turnoveri þ b2 � Industryiþ b3 � PEUi þ b4 � Strategyi þ ei;
(2)
where SMA-use is an index measuring the degree of use of an SMA technique; for adescription of other variables see equation (1). We tested the statistical assumptionsof the model (normality of residuals, heteroskedasticity, and multicollinearity) andfound that the assumptions are satisfied.
Table 7 shows that only the dependence of the SMA-use index on differentiationstrategy is statistically significant. We can therefore reject hypotheses H1, H2 and H4.Hypothesis H3 is accepted. The result regarding the positive influence of differenti-ation strategy on the use of SMA techniques is in accordance with theoretical expect-ation, and this influence exists not only between differentiation strategy and theSMA-use index, but also between differentiation strategy and a majority of the indi-vidual SMA techniques. What is surprising is the fact that we did not find a statistic-ally significant influence of PEU on SMA use (neither on SMA use measured as anindex nor on the individual SMA techniques). On the one hand, there is strong the-oretical support for the existence of a positive influence of PEU on the use of SMAtechniques (e.g. companies under higher environmental uncertainty need not onlyfinancial information but also information on the external environment and its devel-opments). On the other hand, the results of empirical studies on this are inconclusive;we discuss these studies in the final section.
5. Conclusion
This paper contributes to the empirical literature on SMA, its main purpose being toinvestigate the degree of use of strategic management accounting techniques and themain contingent factors. Our study contributes to the theoretical understanding ofSMA utilisation in several ways.
The first research question addressed the status quo of SMA use. We investigated11 SMA techniques and measured their degree of use on a 5-point Likert-type scalewith midpoint three (partial use of a given technique). The paper provides descriptivestatistics pertaining to these results and details the ranking of the individual SMAtechniques. We found that the three most-used SMA techniques are (in descendingorder): strategic planning and budgeting, customer accounting, and target costing.The least-used SMA techniques are (in ascending order): integrated PMS (e.g. bal-anced scorecard), strategic pricing, and activity-based costing. In comparison withother studies, our results regarding the first three most-used techniques confirm theimportance of customer accounting, but the high utilisation of target costing is sur-prising because this technique usually does not rank so highly. It is noteworthy that
62 P. PETERA AND L. ŠOLJAKOVÁ
other studies have not investigated strategic planning and budgeting, but we argue thatthis technique is an element of SMA and we therefore included it in our research.Regarding the least-used techniques, our results are in accordance with, among others,Cinquini and Tenucci (2010), who also find activity-based costing and integrated PMSranked lowly. Surprisingly, our research showed life-cycle costing ranked sixth, while innumerous other studies it has ranked as the least-used technique.
The second research question addressed the expected development of SMA use.Our results show that our respondents expect to increase their use of all SMA techni-ques, the mean value of expected use of all SMA techniques being higher than thepresent mean value of use of these techniques. Possibly this result can be interpretedsuch that companies consider SMA techniques useful and want to implementthem more.
The third research question was aimed at the key contingent factors and fourhypotheses were formulated on the basis of previous empirical and theoretical litera-ture. Specifically, four contingent variables (company size, perceived environmentaluncertainty, strategy and industry) were investigated. We tested the influence of allthese contingent variables both for all individual SMA techniques and a compositeSMA-use index. In the following paragraphs we compare our results with studiesfrom Table 2.
The results of regression analysis showed that there is no statistically significantpositive influence of size, perceived environmental uncertainty or manufacturingindustry on the SMA-use index (rejection of hypotheses H1, H2 and H4).Nevertheless, our results provide support for H3 (implementation of differentiationstrategy has a statistically significant and positive influence on SMA).
Regarding size, the results of the various studies differ. Our result is in accordancewith Pavlatos and Kostakis (2018) and Cinquini and Tenucci (2010), who did notfind size to be a statistically significant contingent variable; but it differs from theresults of studies by Cadez and Guilding (2008), Pavlatos (2015) and �Si�ska (2016). Itis possible to suggest that the differences stem from the structure of respondents,because �Si�ska (2016), for example, investigated small, medium and large companieswhile in our study medium and large companies are investigated. This would supportthe hypothesis that SMA techniques are relevant to all companies from a certain sizeupwards. On the other hand, the studies of Cadez and Guilding (2008) and Pavlatos(2015) address only medium and large companies and yet their results support thehypothesis of the positive influence of size on SMA use. Further research is there-fore needed.
Regarding PEU, our results (rejection of hypothesis) are in accordance withPavlatos (2015), but differ from Pavlatos and Kostakis (2018), who concluded thatmanagement respond to increased perceived environmental uncertainty by increasingSMA use; Cadez and Guilding (2008) did not investigate PEU as a contingent variableand Costantini and Zanin (2017) concluded that their hypothesis regarding the rela-tionship between PEU and the use of SMA techniques was only partially supported(positive and statistically significant coefficients being found for the strategic pricingand balanced scorecard techniques, but not for other SMA techniques). Similarly,Cescon et al. (2019) found only partial support for this hypothesis. It is possible to
ECONOMIC RESEARCH-EKONOMSKA ISTRAŽIVANJA 63
summarise that despite the fact that theoretical considerations support the view thatPEU increases SMA use (because external, non-financial and leading indicators pro-vided by SMA can reduce uncertainty), the empirical results are inconclusive.Unfortunately, our results suggest that the hypothesis regarding the positive influenceof PEU on SMA use should be rejected.
Regarding industry, our study is the first to use advanced statistical methods to investi-gate the relationship of this contingent variable with SMA use. Thus far, studies haveaddressed this topic only tangentially, for example Cadez and Guilding (2008) highlight-ing that their interviewees advocated that industry is relevant to the extent of SMA use.Specifically, they hypothesised that in a manufacturing industry with complicated techno-logical processes, companies should implement SMA more than in other industries. Weoperationalised industry as a dummy variable with a value of 1 for manufacturing indus-try and 0 for all other industries. Our study indicates that there is no statistically signifi-cant positive influence of manufacturing industry on SMA use. Again, further research isneeded, both in the form of quantitative studies and in the form of comparative qualita-tive studies, which could provide deeper insights into reasons why and when industryinfluences the extent of SMA use.
Regarding strategy, the implementation of differentiation strategy (as opposed tocost leadership strategy) has a statistically significant and positive influence on theSMA-use index (hypothesis H3 is accepted). This result supports theoretical viewsthat companies implementing differentiation strategy need non-financial and externalinformation more than companies implementing cost leadership strategy. Moreover,we found a positive statistically significant influence of differentiation strategy on allindividual SMA techniques (except the techniques of life-cycle costing and strategiccosting, where the influence was positive but not statistically significant). Theseresults are in accordance with the majority of prior studies and together providestrong support for the view that strategy is an important contingent variable forSMA. For example, Cadez and Guilding (2008) concluded that SMA use is positivelyand statistically significantly associated with a prospector strategy; Pavlatos (2015)and Pavlatos and Kostakis (2018) found that SMA use is positively and statisticallysignificantly associated with a differentiation strategy.
Results regarding the positive influence of differentiation strategy on the use ofSMA techniques have both theoretical and practical implications. From the theoreticalviewpoint, our results contribute to a better understanding of the relevance of contin-gent factors. From the practical viewpoint, this finding is a strong message for man-agers: if your company pursues a strategy of differentiation (or a prospector strategy),you should intensively use SMA techniques.
This study has several limitations. Next to the generally accepted limitations ofsurvey research (e.g. subjectivity of answers and greenwashing/giving politically cor-rect answers), there are also other issues. Foremost, there is no definitive list of allpossible SMA techniques. Second, the individual techniques are defined slightly dif-ferently in the various studies, which complicates the comparison of results and theincremental growth of knowledge. Third, the response rate is usually quite low andthis requires researchers to contact very large samples of companies, which isextremely time-consuming. Fourth, our study does not investigate all possible
64 P. PETERA AND L. ŠOLJAKOVÁ
contingent variables. Fifth, the operationalisation of contingent variables is not uni-fied across studies. Finally, data were collected from Czech companies and thus gen-eralisations need to be made with caution.
The above-mentioned results and limitations can serve as starting points for fur-ther research. First, we found that the importance of various SMA techniques differsin the individual studies (and therefore countries) significantly. It would be interest-ing to investigate why there are such differences, possibly using multiple case-studymethodology. Similarly, the ‘how’ question regarding the use of SMA techniquescould provide useful insights (we studied only the degree of use of these techniques).Second, replication of the research in other countries (especially in the SlovakRepublic, Hungary and Poland) would be interesting and it would enlarge sample sizeand more sophisticated, data-hungry methods of analysis could be used. Third, thecareful selection of additional contingent factors could increase the theoretical andpractical implications of the research (e.g. capital structure to control for foreign capital,which may be connected with additional know-how regarding SMA techniques).
Disclosure statement
No potential conflict of interest was reported by the authors.
Funding
This paper describes the outcome of research financed by the Internal Grant Agency of theUniversity of Economics, Prague, Grant No. F1/71/2017.
ORCID
Petr Petera http://orcid.org/0000-0001-6606-3184Libu�se �Soljakov�a https://orcid.org/0000-0003-0660-5820
References
Arunruangsirilert, T., & Chonglerttham, S. (2017). Effect of corporate governance characteris-tics on strategic management accounting in Thailand. Asian Review of Accounting, 25(1),85–105. doi:10.1108/ARA-11-2015-0107
Bhimani, A., & Langfield-Smith, K. (2007). Structure, formality and the importance of financialand non-financial information in strategy development and implementation. ManagementAccounting Research, 18(1), 3–31. doi:10.1016/j.mar.2006.06.005
Bou�ckov�a, M., & �Si�ska, L. (2017). Adoption of strategic management accounting techniques inCzech and Slovak companies. In D. Prochazka (Ed.), New trends in finance and accounting(pp. 559–569). Switzerland: Springer. doi:10.1007/978-3-319-49559-0_51
Bromwich, M. (1990). The case for strategic management accounting: The role of accountinginformation for strategy in competitive markets. Accounting, Organizations and Society,15(1–2), 27–46. doi:10.1016/0361-3682(90)90011-I
Cadez, S., & Guilding, C. (2007). Benchmarking the incidence of strategic managementaccounting in Slovenia. Journal of Accounting & Organizational Change, 3(2), 126–146. doi:10.1108/18325910710756140
ECONOMIC RESEARCH-EKONOMSKA ISTRAŽIVANJA 65
Cadez, S., & Guilding, C. (2008). An exploratory investigation of an integrated contingencymodel of strategic management accounting. Accounting Organizations and Society, 33(7–8),836–863. doi:10.1016/j.aos.2008.01.003
Cescon, F., Costantini, A., & Grassetti, L. (2019). Strategic choices and strategic managementaccounting in large manufacturing firms. Journal of Management and Governance, 23(3),605–636. doi:10.1007/s10997-018-9431-y
Cinquini, L., & Tenucci, A. (2010). Strategic management accounting and business strategy: aloose coupling? Journal of Accounting & Organizational Change, 6(2), 228–259. doi:10.1108/18325911011048772
Costantini, A., & Zanin, F. (2017). The effect of perceived environmental uncertainty on theuse and perceived usefulness of strategic management accounting: Some empirical evidence.Managing Global Transitions, 15(4), 379–398. doi:10.26493/1854-6935.15.379-398
Dmitrovi�c-�Saponja, L., & Suljovi�c, E. (2017). Strategic management accounting in the Republicof Serbia. Economic Research-Ekonomska Istra�zivanja, 30(1), 1829–1839. doi:10.1080/1331677X.2017.1392884
Gond, J.-P., Grubnic, S., Herzig, C., & Moon, J. (2012). Configuring management control sys-tems: Theorizing the integration of strategy and sustainability. Management AccountingResearch, 23(3), 205–223. doi:10.1016/j.mar.2012.06.003
Granlund, M., & Lukka, K. (2017). Investigating highly established research paradigms:Reviving contextuality in contingency theory based management accounting research.Critical Perspectives on Accounting, 45, 63–80. doi:10.1016/j.cpa.2016.11.003
Guilding, C., Cravens, K. S., & Tayles, M. (2000). An international comparison of strategicmanagement accounting practices. Management Accounting Research, 11(1), 113–135. doi:10.1006/mare.1999.0120
Gupta, A. K., & Govindarajan, V. (1984). Business unit strategy, managerial characteristics,and business unit effectiveness at strategy implementation. Academy of ManagementJournal, 27(1), 25–41. doi:10.5465/255955
King, R., Clarkson, P. M., & Wallace, S. (2010). Budgeting practices and performance in smallhealthcare businesses. Management Accounting Research, 21(1), 40–55. doi:10.1016/j.mar.2009.11.002
Langfield-Smith, K. (2008). Strategic management accounting: How far have we come in 25years? Accounting, Auditing and Accountability Journal, 21(2), 204–228. doi:10.1108/09513570810854400
Lord, B. R. (1996). Strategic management accounting: The emperor’s new clothes?Management Accounting Research, 7(3), 347–366. doi:10.1006/mare.1996.0020
Ma, Y., & Tayles, M. (2009). On the emergence of strategic management accounting: An insti-tutional perspective. Accounting and Business Research, 39(5), 473–495. doi:10.1080/00014788.2009.9663379
Miles, R. E., Snow, C. C., Meyer, A. D., & Coleman, H. J. (1978). Organizational strategy,structure, and process. Academy of Management Review, 3(3), 546–562. doi:10.5465/amr.1978.4305755
Nixon, B., & Burns, J. (2012). The paradox of strategic management accounting. ManagementAccounting Research, 23(4), 229–244. doi:10.1016/j.mar.2012.09.004
Otley, D. (2016). The contingency theory of management accounting and control: 1980-2014.Management Accounting Research, 31, 45–62. doi:10.1016/j.mar.2016.02.001
Pavlatos, O. (2015). An empirical investigation of strategic management accounting in hotels.International Journal of Contemporary Hospitality Management, 27(5), 756–767. doi:10.1108/IJCHM-12-2013-0582
Pavlatos, O., & Kostakis, X. (2018). The impact of top management team characteristics andhistorical financial performance on strategic management accounting. Journal of Accounting& Organizational Change, 14(4), 455–472. doi:10.1108/JAOC-11-2017-0112
Porter, M. E. (1980). Competitive strategy: techniques for analyzing industries and competitors.New York: Free Press.
66 P. PETERA AND L. ŠOLJAKOVÁ
Roslender, R., & Hart, S. J. (2003). In search of strategic management accounting: Theoreticaland field study perspectives. Management Accounting Research, 14(3), 255–279. doi:10.1016/S1044-5005(03)00048-9
Simmonds, K. (1981). Strategic management accounting. Management Accounting, 59(4), 26–29.Simmonds, K. (1982). Strategic management accounting for pricing: A case example.
Accounting and Business Research, 12(47), 206–214. doi:10.1080/00014788.1982.9728809�Si�ska, L. (2016). The contingency factors affecting management accounting in Czech compa-
nies. Acta Universitatis Agriculturae et Silviculturae Mendelianae Brunensis, 64(4),1383–1392. doi:10.11118/actaun201664041383
�Si�ska, L. (2018). How strategic priorities are reflected in features of strategic performancemeasurement system? Engineering Economics, 29(5), 591–600. doi:10.5755/j01.ee.29.5.17463
Wagner, J. ( (2018). ). Management accounting practice and change in the Czech Republic -reviewing last 30 years from the perspective of an institutional framework. Paper presentedat the IDIMT 2018: Strategic Modeling in Management, Economy and Society - 26thInterdisciplinary Information Management Talks, pp. 393–400.
Witek-Crabb, A. (2016). Maturity of strategic management in organizations. OeconomiaCopernicana, 7(4), 669–682. doi:10.12775/OeC.2016.037
ECONOMIC RESEARCH-EKONOMSKA ISTRAŽIVANJA 67