use of remote sensing in crop forecasting and assessment ... · disasters: operational approaches...
TRANSCRIPT

1
Use of Remote Sensing in Crop Forecasting and Assessment of Impact of Natural
Disasters: Operational Approaches in India
Shibendu Shankar Ray*, Neetu, S. Mamatha and Sanjeev Gupta
Mahalanobis National Crop Forecast Centre
Department of Agriculture & Cooperation, Ministry of Agriculture,
Pusa Campus, New Delhi -110 012, India
*Email: [email protected]
Abstract:
Use of remote sensing data for pre-harvest crop production forecast has been operationalized in India
under a national level programme called Forecasting Agricultural output using Space, Agrometeorology
and Land based observations (FASAL). FASAL programme, funded by the Ministry of Agriculture,
envisages multiple production forecasts of major crops of the country at National/State/District level.
Similarly, under National Agricultural Drought Assessment and Monitoring System (NADAMS) project
remote sensing data from multiple sources integrated with ground and meteorological information for
district/sub-district level drought assessment for 13 states of India. The methodology for both of these
programmes were developed by the Indian Space Research Organization and later on transferred to a
centre (Mahalanobis National Crop Forecast Centre) specifically created under the Ministry of
Agriculture to operationalize space technology applications in agriculture.
Keywords: FASAL, NADAMS, Crop Forecasting, Drought Assessment, Remote Sensing
1. Introduction
In India, agriculture is one of the major application areas of the remote sensing technology. Various
national level agricultural applications have been developed which showcases the use of remote sensing
data provided by the sensors/satellites launched by the country’s space agency, Indian Space Research
Organisation (ISRO). Some of these applications include, crop acreage and production estimation,
cropping system analysis, agricultural water management, drought assessment and monitoring,
horticultural development, precision farming, soil resources mapping, potential fishing zone forecast,
watershed development, climate impact on agriculture and so on (Navalgund and Ray, 2000, Panigrahy
and Ray, 2006, Navalgund et al., 2007). A few of these applications, after reaching operational level,
have been transferred to the user departments. This has resulted in the institutionalization of the
remote sensing applications in the country (Parihar & Manjunath, 2013). One recent example of
operationalization/ institutionalization of remote sensing application is the creation of a centre called
Mahalanobis National Crop Forecast Centre (MNCFC) under Department of Agriculture & Cooperation,
Ministry of Agriculture. The centre operationalises two major programmes developed by ISRO on crop
forecasting and drought assessment apart from various other activities related to agricultural
assessment. This article describes these operational approaches.

2
2. Crop Forecasting
Crop forecasting is essential for various agricultural planning purposes, including pricing, export/import,
contingency measures, etc. Crop forecasting using remote sensing data, in India, started in late 80s in
Space Applications Centre of ISRO under the Department of Agriculture & Cooperation (DAC)’s
sponsored project CAPE (Crop Acreage and Production Estimation). This later on developed into a
national level programme, called FASAL (Forecasting Agriculture using Space, Agro-meteorology and
Land based observations), which is in operation since August, 2006. FASAL project aims at providing
multiple pre-harvest production forecasts of crops at National/State/District level (Parihar and Oza,
2006). Remote sensing data, both optical and microwave form the core of crop area enumeration, crop
condition assessment and production forecasting. Crop yield is estimated using
agrometeorological/spectral yield models and also crop growth simulation models. FASAL approach also
involves using econometric models to forecast the area and production before the crop sowing
operations. FASAL is a multi-institutional programme, which integrates the activity from many
organizations. The list of such organizations is given in Table 1. MNCFC has started providing crop
forecasts, under FASAL programme, from the Kharif (Rainy) season of 2012.
Table 1. Organizations involved in FASAL programme and their responsibilities
S.N. Name of the Organisation Responsibility
1 Directorate of Economics & Statistics, Ministry of Agriculture
Overall Coordination
2 Mahalanobis National Crop Forecast Centre, Ministry of Agriculture
Operational Crop Assessment
3 Space Applications Centre, Indian Space Research Organisation
Techniques Development
4 India Meteorological Department Crop Yield Forecasting
5 Institute of Economic Growth Econometric Modelling for pre-season forecast
6 State Agricultural Departments Ground truth collection
7 State Remote Sensing Application Centres Support for Techniques Development Activities
Currently, under FASAL project, National and State Level multiple forecasts are being issued for 5 crops
(Rice (Kharif & Rabi), Jute, Rapeseed & Mustard, Winter Potato and Wheat). From the year 2013-14
onwards, State and District Level forecasts are generated for Cotton, Sugarcane and Rabi (winter
season) Sorghum. While multi-date SAR (Synthetic Aperture Radar) data of Indian SAR satellite RISAT-1
is used for Rice (Kharif & Rabi) (Figure 2) and Jute, multi-date Resourcesat-2 AWiFS (Advanced Wide
Field Sensor) data, with 56 m spatial resolution, are used for other crops. LISS III data, with 23.5 m
resolution, is being used for district level assessments. Stratified random sampling approach is followed
for crop area estimation. All those states, which together contribute more than 90% of the particular

3
crop’s area in the country, are considered for area and production assessment. Hierarchical/logical
classification approach is followed for classifying multi-date SAR data. A hybrid (combination of
supervised and unsupervised) classification method is followed for multi-date optical data, while
maximum likelihood (MXL) is followed for single date optical data. Indigenously developed software,
called FASALSoft (Manthira Moorthi et al., 2014) is used for carrying out the digital analysis of remote
sensing data. The yield forecasts are generated under FASAL programme by India Meteorological
Department, correlation weighted empirical agro-meteorological models. For Rice and Wheat crops the
final yield forecasts are being given using physical models with inputs from remote sensing data
(Chakraborty et al., 2005; Tripathy et al., 2013). The details of the crop forecasts given in the year 2013-
14 are presented in Table 2. Typically, in an agricultural year, 16 crop forecasts are generated. A
comparison with the official estimates of Ministry of Agriculture showed that the Remote sensing based
area estimates, at national level, are within -0.5 to -8.8 %, while differences in production estimates
ranged between -11.2 to 5.6 %.
Figure 1. Approaches followed for multiple forecasts under FASAL programme (Source: SAC, ISRO)
LandObservations
MULTIPLE IN-SEASON FORECAST
Pre-Season
Early-Season
Mid-SeasonState
Pre-Harvest
State
Pre-HarvestDistrict
Cropped area
Crop condition
Crop acreage
Crop yield
RevisedAssessing
Damage

4
Figure 2. A typical 3-date RISAT-1 colour composite showing Rice crop of different transplanting time
Table 2. Summary of crop forecasts generated under FASAL project during 2013-14
Crop No. of States Forecasts Dates of Forecasts Satellite Data Used
Jute 3 F1 Jul 24, 2013 RISAT-1 SAR
Rice (Kharif) 13 F1
F2
F3
Aug 31, 2013
Sep 30, 2013
Jan 22, 2014
RISAT-1 SAR
RISAT-1 SAR
RISAT-1 SAR
Sugarcane 3 F1 Dec 18, 2013 R2 LISS III
Cotton 7 F1 Dec 18, 2013 R2 LISS III
Rapeseed &
Mustard
5
5
6
F1
F2
F3
Dec 31, 2013
Jan 31, 2014
Feb 28, 2014
R2AWiFS
R2 AWiFS
R2 LISS III
Winter Potato 4
5
F1
F2
Jan 31, 2014
Mar 04, 2014
R2 AWiFS
R2 LISS III
Wheat 9 F1
F2
F3
Feb 15, 2014
Mar 11, 2014
Apr 04, 2014
R2AWiFS
R2 AWiFS
R2 LISS III
Sorghum (Rabi) 2 F1 Feb 15, 2014 R2 LISS III
Rabi Rice 4 F1 Apr 04, 2014 RISAT-1 SAR
R2- Resourcesat-2 satellite

5
2.1 Ground truth collection using smart phone
Ground truth (GT) is an essential component for remote sensing data analysis. Ground truth includes
collection of GPS Reading, Photographs, preparing a Sketch of the field Layout and filling -up of GT form.
Earlier GT was being collected using a GPS, a camera and filling up of a form. A recent initiative was
made for Smartphone based GT collection. An Android based application was developed by National
Remote Sensing Centre of ISRO (Figure 3a). State Agriculture Department officials collected GT using
Smartphones provided by MNCFC. The GT information directly comes to Bhuvan server (ISRO’s
Geoportal), which can be downloaded and used real-time (Figure 3b). During Kharif and Rabi season of
2013-14 more than 5800 GT points were collected from 16 states using the smart phones.
Figure 3. Real time ground truth collection using smart phone, a) Android App developed by NRSC, b)
Ground Truth sites available on Bhuvan server
2.2 Remote sensing based Crop Cutting Experiments
Crop cutting experiments (CCE) are carried for each crop to estimate crop yield at district and state level.
The conventional method CCE planning does not consider the current crop condition, which may result
error in sampling. To overcome this, remote sensing driven Crop Cutting Experiments (CCE) planning was
carried out in Bihar state for Rice crop during Kharif season of 2013. The work was carried out jointly
with Bihar Agriculture Department. Rice Crop Map was generated using such as RISAT-1 MRS data.
Resourcesat-2 AWiFS time composite NDVI during September 2nd Fortnight to October 1st Fortnight was
extracted for rice area. Three classes (A, B, C) were defined based on frequency distribution of NDVI
values. 37 points were randomly selected in 22 districts of Bihar (Figure 4a). Crop cutting experiment
was carried out under the supervision of MNCFC. Yield models were developed between NDVI and yield
and yield map was generated (Figure 4b). The study showed very high efficiency of stratified sampling
plan generated for CCE based on NDVI values.

6
Figure 4. Use of remote sensing data for a) selecting sites for Crop Cutting Experiments for rice crop in
Bihar and b) generating a yield map
2.3 Crop Emergence Progression
The NDVI (Normalized Difference Vegetation Index) product derived from the Indian geostationary
satellite INSAT-3A based CCD camera is extremely useful for vegetation monitoring, because of its high
temporal frequency (half an hour) (Nigam et al., 2011). The spatial resolution of the data is 1 km. The 10
day NDVI product was used to monitor the Rabi season crop emergence based on a methodology
developed by Space Applications Centre, ISRO (Vyas et al., 2011). Since Satellite data sees the crop only
after spectral emergence (i.e. the time when crops are big enough to start registering spectral signature)
this was called as emergence area progression. The analysis was carried out for 6 states (Punjab,
Haryana, Rajasthan, UP, MP and Bihar) at every 10 day interval during December, 2013 to February,
2014 (Figure 5).
Figure 5. Map of Rabi season crop Emergence Area progression in 6 States of India

7
3. Drought and Flood Impact Assessment on Agriculture
Agriculture, in India, is strongly affected by two major hydro-meteorological disasters, namely drought
and flood. Drought is a perennial feature. 16 per cent of India’s total area is drought prone and
approximately, 50 million people are annually affected by droughts (DAC, 2009). Over 68-70% of total
sown area in India is vulnerable to drought. Similarly, around 40 million hectares of land in India is prone
to floods as per National Flood Commission report.
Assessment of agricultural condition during drought or flood is essential for taking various relief and
rehabilitation measures. Since both these disasters impact large area, satellite based monitoring is
extremely useful.
3.1 Agricultural Drought Assessment
In India, operational agricultural drought assessment using remote sensing data is carried under a major
programme called National Agricultural Drought Assessment & Monitoring System (NADAMS). NADAMS
project, developed by National Remote Sensing Centre, provides near real-time information on
prevalence, severity level and persistence of agricultural drought at state/ district/sub-district level
(Murthy & Sesha Sai, 2011). Currently, it covers 13 states of India (Andhra Pradesh, Bihar, Chattisgarh,
Gujarat, Haryana, Jharkhand, Karnataka, Madhya Pradesh, Maharashtra, Odisha, Rajasthan, Tamil Nadu,
and Uttar Pradesh), which are predominantly agriculture based and prone to drought situation. In four
states (Andhra Pradesh, Karnataka, Haryana and Maharashtra), the assessment is carried out at sub-
district level. The remote sensing data of NOAA AVHRR (for district level), MODIS and Resourcesat-2
Advanced Wide Field Sensor, AWiFS (for sub-district level) along with rainfall data are used for drought
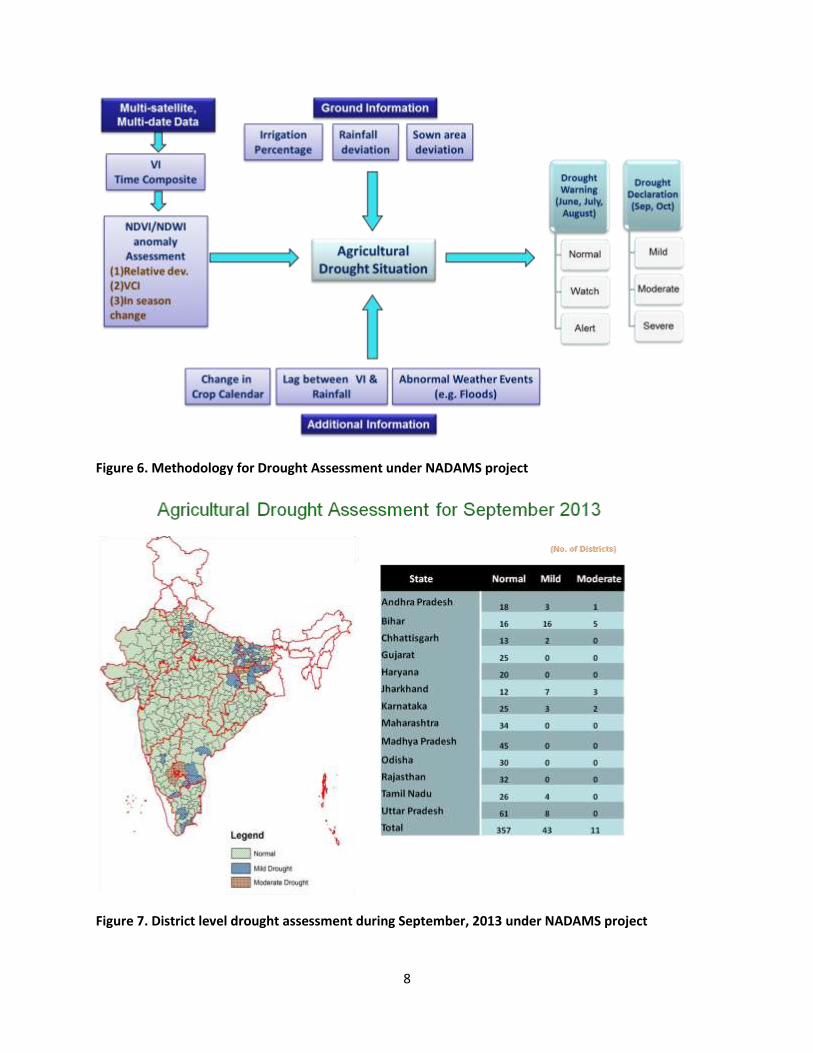
assessment (Choudhary et al., 2011). Various spectral indices, such as Normalized Difference Vegetation
Index (NDVI), Normalized Difference Water Index (NDWI) & Shortwave Angle Slope Index (SASI) are
computed and integrated with Soil Moisture Index and District Level Rainfall to assess the drought
condition (Figure 6). Agricultural conditions are monitored at state/district level using daily NOAA
AVHRR/ MODIS data. Fortnightly/monthly report of drought condition is provided to all the concerned
central and state government agencies under NADAMS. MNCFC has started providing periodic Drought
Assessment Reports from the Kharif season of 2012 (Ray et al., 2014).
The district level drought assessment map for September, 2013 is presented in figure 7, which shows in
the 13 states 11 districts were in moderate drought condition and 43 districts in mild drought condition.
Every month, similar maps are generated and circulated along with all satellite derived products.
Recently a drought geo-portal has been created (www.ncfc.gov.in), where users can access the images,
maps, assessments and NDVI profiles.
8
Figure 6. Methodology for Drought Assessment under NADAMS project
Figure 7. District level drought assessment during September, 2013 under NADAMS project

9
3.2 Rice Flooded Area Mapping
Another study was carried out to assess the impact of flood on Rice crop in Odisha state of India post
Phailin cyclone of October 12, 2013. RISAT SAR derived rice map was integrated with flood inundation
map developed National Remote Sensing Centre to map the areas of rice crop under flood. Total ten
districts were affected by cyclone and rice inundation was more than 4% of rice area. Four Districts
namely Baleshwar, Bhadrak, Kendrapara and Jajpur more than 15% of rice was severely affected by
cyclone. A post-analysis ground truth was conducted which showed the accuracy of the rice flooded
area mapping was 89%.
Figure 8. Flooded rice area mapping in Odisha state of Indian post Phailin cyclone
3.3 Rabi Season Crop Alert
As mentioned earlier the drought assessment is generally carried out during the Kharif (Rainy) season.
Though majority of crop growing area in Rabi (winter) season is irrigated, it is essential to monitor the
agricultural condition to identify any alert situation for necessary intervention measures. The crop
condition was assessed using MODIS Vegetation Indices 16-Day Composite data and MODIS Land
Surface Temperature 8-day Composite data. Vegetation Condition Index of NDVI and NDWI and
Temperature Condition Index (Kogan, 1995) were derived using past ten years’ satellite data. Based on
the above three mentioned parameters, and by using a logical modeling approach, the district were
divided into normal, watch and alert. This exercise was carried out for 8 states namely Bihar, Haryana,
Punjab, Rajasthan, Uttar Pradesh, Madhya Pradesh and West Bengal (Figure 9). The analysis showed
that the crop situation was normal during the Rabi season of 2013-14.

10
Figure 9. Rabi season crop alert assessment for 8 states of India during February, 2014
4. Conclusions
The examples presented in this article have showed how remote sensing data from various sources, in
combination with other ancillary data, have been successfully used for operational assessment of
agriculture in the country. However, there is a need to further extend the area of activity. Following
future developments are envisaged in this field. i) Taking up more crops and covering more number of
states, ii) Developing spectral yield models for all crops, iii) assessing biotic and abiotic disaster impact
on agriculture, iv) Monitoring the impact of agricultural development programmes of the country, v)
Horticultural assessment, and vii) Agricultural resources management.
Acknowledgement:
Authors are grateful to the scientists of the Indian Space Research Organization for developing the
procedures for FASAL and NADAMS Project and transferring the technology to the Mahalanobis National
Crop Forecast Centre for their operationalization. The Ministry of Agriculture has not only funded this

11
activity, but also has been responsible for the growth remote sensing applications in the country by pro-
actively adopting the technology. Authors are grateful to Sh. Ashish Bahuguna, the Secretary, DAC for his
guidance. Thanks are due to Dr. J. S. Parihar, Outstanding Scientist, Space Applications Centre and Dr.
Dalip Singh, Additional Statistical Adviser, DES for their strong support to these activities.
References
Chakraborty, M., Manjunath, K.R, Panigrahy, S., Kundu, N. and Parihar, J. S. (2005) Rice crop parameter
retrieval using multi-temporal, multi-incidence angle Radarsat SAR data. ISPRS Journal of
Photogrammetry and Remote Sensing. 59(5): 310–322
Choudhary, K., Goel, Inka, Bisen, P. K., Mamatha, S., Ray, S. S., Chandrasekar, K., Murthy, C. S. and Sesha
Sai, M.V.R. (2014) Use of Remote Sensing Data for Drought Assessment: A Case Study for Bihar
State of India during Kharif, 2013. In: High Impact Weather Events over the SAARC Region (Eds.
Kamaljit Ray, M. Mohapatra, B. K. Bandyopadhyay & L. S. Rathore). Capital Publishers &
Springer India, New Delhi. pp. 378-385.
DAC (2009) Manual for Drought Management. Department of Agriculture & Cooperation, Ministry of
Agriculture, Government of India, New Delhi, 192 p.
Dadhwal, V. K., Singh, R. P., Dutta, S. and Parihar, J. S. (2002) Remote sensing based crop inventory: A
review of Indian experience. Tropical Ecology 43(1): 107-122.
Kogan, F.N. (1995) Application of vegetation index and brightness temperature for drought detection.
Advances in Space Research. 15(11): 91–100.
Manthira Moorthi S., Oza, M.P., Misra, Indranil, Gambhir, Rajdeep K., Darji, N.P., Sharma, Shikha, Jain,
D.K., Dhar, D., Padia, Kirti, Ramakrishnan, R., Chowdhury, S. and Parihar, J.S. (2014)
FASALSoft - An ISRO software framework for crop production forecast using remote sensing data
analysis. Journal of Geomatics. 8(1):27-33.
Murthy, C.S. and Sesha Sai, M V R (2011) Agricultural Drought Monitoring and Assessment. In: ‘Remote
Sensing Applications’ (Eds.) P. S. Roy, R. S. Dwivedi and D. Vijayan, NRSC, Hyderabad.
Navalgund R.R, Jayaraman V, Roy PS. (2007) Remote sensing applications: An overview. Current Science,
93(12):1747-1766
Navalgund, R. R. and Ray, S. S. (2000) Geomatics in natural resources management. In Proceedings of
Geomatics-2000. 21-22 January, 2000, Pune, pp. NR1-NR14.
Nigam, R., Bhattacharya, B. K., Gunjal, K. R., Padmanabhan, N. and Patel, N. K. (2011) Continental scale
vegetation index from Indian geostationary satellite: algorithm definition and validation. Current
Science, 100(8): 1184-1192.
Panigrahy, S. and Ray, S. S. (2006) Remote Sensing. In: Environment and Agriculture. (Eds. K. L. Chadha &
M. S. Swaminathan). Malhotra Publishing House, New Delhi. pp. 361-375.
Parihar, J. S. and Dadhwal, V. K. (2002). Crop production forecasting using remote sensing data: Indian
experience. Proceedings of the ISPRS Comm. VII Symposium “Resource and Environmental
Monitoring” held at Hyderabad, India. during Dec. 3-6 2002, IAPRS & GIS, vol. 34, Part 7, pp. 1-6.
Parihar, J. S. and Manjunath, K. R. (2013) Agricultural Applications: Evolution during last 25 Years.
NNRMS Bulletin. March, 2013, pp. 58-75.

12
Parihar, J.S. and M.P. Oza (2006). FASAL: an integrated approach for crop assessment and production
forecasting. Proc. of SPIE Vol. 6411641101 Agriculture and Hydrology Applications of Remote
Sensing, edited by Kuligowski, R.J., Parihar,J.S. and Saito, G. (doi: 10.1117/12.713157).
Ray, S. S., Sesha Sai, M V R, and Chattopadhyay, N. (2014) Agricultural Drought Assessment: Operational
Approaches in India with special emphasis on 2012. In: High Impact Weather Events over the
SAARC Region (Eds. Kamaljit Ray, M. Mohapatra, B. K. Bandyopadhyay & L. S. Rathore). Capital
Publishers & Springer India, New Delhi. pp. 331-345.
Tripathy, R. Chaudhari, K. N., Mukherjee, J., Ray, S. S., Patel, N.K., Panigrahy, S. and Parihar, J. S. (2013)
Forecasting wheat yield in Punjab state of India by combining crop simulation model WOFOST
and remotely sensed inputs. Remote Sensing Letters 4 (1), 19-28.
Vyas Swapnil, Nigam, Rahul, Patel, N. K., Panigrahy, S. and Parihar, J. S. (2011). Monitoring of rabi crop
progress using geostationary satellite INSAT 3A CCD data. SAC, Scientific note: ABHG/
SAC/SN/03/2011. Space Applicatiosn Centre, Ahmedabad