use of radars to monitor stream discharge by noncontact ... · use of radars to monitor stream...
TRANSCRIPT

Use of radars to monitor stream discharge by noncontact methods
J. E. Costa,1 R. T. Cheng,2 F. P. Haeni,3 N. Melcher,4 K. R. Spicer,1 E. Hayes,5
W. Plant,6 K. Hayes,6 C. Teague,7 and D. Barrick7
Received 13 July 2005; revised 2 March 2006; accepted 3 April 2006; published 27 July 2006.
[1] Conventional measurements of river flows are costly, time-consuming, and frequentlydangerous. This report evaluates the use of a continuous wave microwave radar, amonostatic UHF Doppler radar, a pulsed Doppler microwave radar, and a ground-penetrating radar to measure river flows continuously over long periods and withouttouching the water with any instruments. The experiments duplicate the flow records fromconventional stream gauging stations on the San Joaquin River in California and theCowlitz River in Washington. The purpose of the experiments was to directly measure theparameters necessary to compute flow: surface velocity (converted to mean velocity)and cross-sectional area, thereby avoiding the uncertainty, complexity, and cost ofmaintaining rating curves. River channel cross sections were measured by ground-penetrating radar suspended above the river. River surface water velocity was obtained byBragg scattering of microwave and UHF Doppler radars, and the surface velocity datawere converted to mean velocity on the basis of detailed velocity profiles measured bycurrent meters and hydroacoustic instruments. Experiments using these radars to acquire acontinuous record of flow were conducted for 4 weeks on the San Joaquin River and for16 weeks on the Cowlitz River. At the San Joaquin River the radar noncontactmeasurements produced discharges more than 20% higher than the other independentmeasurements in the early part of the experiment. After the first 3 days, the noncontactradar discharge measurements were within 5% of the rating values. On the Cowlitz Riverat Castle Rock, correlation coefficients between the USGS stream gauging station ratingcurve discharge and discharge computed from three different Doppler radar systemsand GPR data over the 16 week experiment were 0.883, 0.969, and 0.992. Noncontactradar results were within a few percent of discharge values obtained by gauging station,current meter, and hydroacoustic methods. Time series of surface velocity obtained bydifferent radars in the Cowlitz River experiment also show small-amplitude pulsationsnot found in stage records that reflect tidal energy at the gauging station. Noncontactdischarge measurements made during a flood on 30 January 2004 agreed with the rateddischarge to within 5%. Measurement at both field sites confirm that lognormal velocityprofiles exist for a wide range of flows in these rivers, and mean velocity is approximately0.85 times measured surface velocity. Noncontact methods of flow measurementappear to (1) be as accurate as conventional methods, (2) obtain data when standardcontact methods are dangerous or cannot be obtained, and (3) provide insight into flowdynamics not available from detailed stage records alone.
Citation: Costa, J. E., R. T. Cheng, F. P. Haeni, N. Melcher, K. R. Spicer, E. Hayes, W. Plant, K. Hayes, C. Teague, and D. Barrick (2006),
Use of radars to monitor stream discharge by noncontact methods, Water Resour. Res., 42, W07422, doi:10.1029/2005WR004430.
1. Introduction
[2] Quantification of streamflow is essential for economic,social, and political security. Streams and rivers providewater
for important uses including drinking water, irrigation, nav-igation, power generation, and recreation. Too much waterpresents problems for public safety as rivers overflow theirbanks, breach levees, and inundate critical infrastructure suchas hospitals and fire stations. Flow data are essential forcomputation of loads for water quality. The amount of wateravailable for different uses, and the basis for predicting thefrequency of damaging floods, is dependent upon accuratemeasurements of the rate of flow in rivers under widelyvarying conditions.[3] The basic method for measuring streamflow in the
United States using current meters has been virtuallyunchanged for over a century. Direct measurements are
1U.S. Geological Survey, Vancouver, Washington, USA.2U.S. Geological Survey, Menlo Park, California, USA.3U.S. Geological Survey, Storrs, Connecticut, USA.4U.S. Geological Survey, Tucson, Arizona, USA.5U.S. Geological Survey, Stennis Space Center, Mississippi, USA.6Applied Physics Laboratory, University of Washington, Seattle,
Washington, USA.7CODAR Ocean Sensors, Mountain View, California, USA.
Copyright 2006 by the American Geophysical Union.0043-1397/06/2005WR004430$09.00
W07422
WATER RESOURCES RESEARCH, VOL. 42, W07422, doi:10.1029/2005WR004430, 2006ClickHere
for
FullArticle
1 of 14

made at regular intervals across the river with mechanicalmeters from bridges, cableways, or boats [Rantz, 1982].More recently, some direct discharge measurements havebeen made using acoustic Doppler current profilers(ADCPs) that record water velocity through most of thewater column by measuring the Doppler shift in the fre-quency of the acoustic signals reflected from materialssuspended in, and moving with, the river flow. ADCPsare rapidly replacing mechanical meters in many situations[Morlock, 1996]. The use of instruments based on theDoppler principle for measuring water velocity and com-puting discharge is common within the U.S. GeologicalSurvey, but still require human operators and expensiveinstrumentation placed in contact with the water.[4] Under some conditions, direct measurement of dis-
charge by current meter or ADCP is unreliable, unsafe, orimpossible. These include floods where flow conditions ordebris are dangerous to personnel in boats, and rapidlychanging unsteady flows. Rivers at flood stage are danger-ous to measure because of high velocities and drifting logs,stumps, and debris. Time consuming direct measurementmethods are increasingly subject to error and/or failure asstream depth, velocity, and bed instability increase [Sauerand Meyer, 1992]. In situations when direct measurements
are not made, discharge is determined indirectly by survey-ing high-water marks left by the flow and applying indirectdischarge procedures such as the slope-area method[Benson and Dalrymple, 1967]. Accuracies of indirectdischarge methods are far less than direct measurements,yet many times estimates of flows that are not directlymeasured are critical for identification of flood hazard areas,the frequency with which flooding occurs, or the mass fluxof sediment or contaminants.[5] In an effort to solve some of these problems the U.S.
Geological Survey began a project to investigate new andemerging technologies that might have the potential ofdeveloping into the basis for a more inexpensive, accurate,safe, and robust method of stream gauging. The ideal streamgauge of the future was conceived as one that would (1)directly measure the variables that determine discharge(channel geometry and flow velocity), so a rating curvewould no longer be needed, (2) measure these variablescontinuously, and (3) not place any instruments in contactwith the water, thus greatly extending the range for high-flowmeasurements and making them more accurate and safe.[6] This paper describes a method by which river channel
cross section and mean flow velocity (the two variablesnecessary to compute river flow) can be measured over
Figure 1. GPR output. Interpreted channel bottom is marked with red dots, measured at the San JoaquinRiver near Vernalis, California, on 17 April 2002.
2 of 14
W07422 COSTA ET AL.: NONCONTACT STREAMFLOW W07422
extended time periods without putting any instruments intothe water. The hypothesis is that surface velocity is highlycorrelated with discharge, and channel cross sections can bemeasured in real time by radar. It reviews (1) a radar methodto measure the cross-sectional area of river channels withouttouching the water, (2) the difficulties of measuring surfacevelocity with water contact instruments, (3) methods tomeasure the surface velocity of rivers using different kindsof radars, (4) the basis for converting measured surfacevelocity to mean flow velocity, and (5) the results of twoexperiments designed to continuously measure river flow bynoncontact methods.
2. Noncontact Measurements of StreamDischarge
2.1. Channel Cross Section
[7] Channel cross-section geometry is routinely measuredduring conventional discharge measurements. This typicallyinvolves making depth soundings at 20–30 points acrossthe river, connecting the points, and integrating for area.Alternatively, cross sections can be measured with a fa-thometer or acoustic device, both of which require floatinginstruments across the river from one side to the other.[8] Several possible techniques for measuring channel
cross section by noncontact means have been considered.These include visible and infrared lasers, electromagneticinduction techniques, and VHF and UHF radar techniques.The conclusion reached was that the most promising tech-nology to record channel cross section without touching thewater is radar operating at Megahertz frequencies, specifi-cally ground-penetrating radar. Several unrelated studies inthe past have offered hints on how to scan the bed of a riveror shallow coastal areas continuously and record the shapeof the channel cross section without having the antennas inthe water [e.g., O’Neill and Arcone, 1991; Spicer et al.,1997; Okamoto, 1999; Bell, 1999].[9] Ground-penetrating radar (GPR) involves transmis-
sion of an electromagnetic pulse with carrier frequency inthe MHz range toward the ground from a transmittingantenna at the surface. Some of the radiated electromagneticenergy is reflected back to the receiving antenna frominterfaces of materials having different dielectric properties.GPR systems are light, portable, digital, and can providereal-time images of the subsurface.[10] To obtain noncontact cross-section data, the GPR
unit can be operated from a bridge or cableway that allows
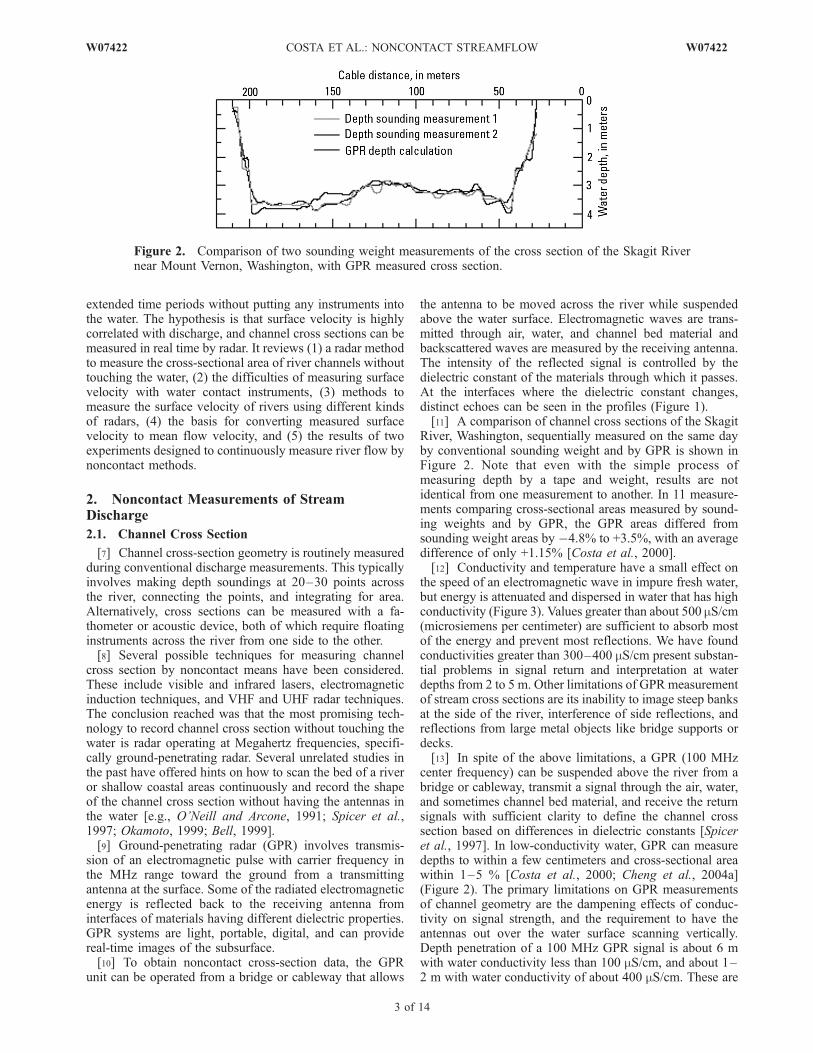
the antenna to be moved across the river while suspendedabove the water surface. Electromagnetic waves are trans-mitted through air, water, and channel bed material andbackscattered waves are measured by the receiving antenna.The intensity of the reflected signal is controlled by thedielectric constant of the materials through which it passes.At the interfaces where the dielectric constant changes,distinct echoes can be seen in the profiles (Figure 1).[11] A comparison of channel cross sections of the Skagit
River, Washington, sequentially measured on the same dayby conventional sounding weight and by GPR is shown inFigure 2. Note that even with the simple process ofmeasuring depth by a tape and weight, results are notidentical from one measurement to another. In 11 measure-ments comparing cross-sectional areas measured by sound-ing weights and by GPR, the GPR areas differed fromsounding weight areas by �4.8% to +3.5%, with an averagedifference of only +1.15% [Costa et al., 2000].[12] Conductivity and temperature have a small effect on
the speed of an electromagnetic wave in impure fresh water,but energy is attenuated and dispersed in water that has highconductivity (Figure 3). Values greater than about 500 mS/cm(microsiemens per centimeter) are sufficient to absorb mostof the energy and prevent most reflections. We have foundconductivities greater than 300–400 mS/cm present substan-tial problems in signal return and interpretation at waterdepths from 2 to 5 m. Other limitations of GPRmeasurementof stream cross sections are its inability to image steep banksat the side of the river, interference of side reflections, andreflections from large metal objects like bridge supports ordecks.[13] In spite of the above limitations, a GPR (100 MHz
center frequency) can be suspended above the river from abridge or cableway, transmit a signal through the air, water,and sometimes channel bed material, and receive the returnsignals with sufficient clarity to define the channel crosssection based on differences in dielectric constants [Spiceret al., 1997]. In low-conductivity water, GPR can measuredepths to within a few centimeters and cross-sectional areawithin 1–5 % [Costa et al., 2000; Cheng et al., 2004a](Figure 2). The primary limitations on GPR measurementsof channel geometry are the dampening effects of conduc-tivity on signal strength, and the requirement to have theantennas out over the water surface scanning vertically.Depth penetration of a 100 MHz GPR signal is about 6 mwith water conductivity less than 100 mS/cm, and about 1–2 m with water conductivity of about 400 mS/cm. These are
Figure 2. Comparison of two sounding weight measurements of the cross section of the Skagit Rivernear Mount Vernon, Washington, with GPR measured cross section.
W07422 COSTA ET AL.: NONCONTACT STREAMFLOW
3 of 14
W07422

minimum depths, limited by the channel depths beingimaged. Fortunately, during most floods, even high-conduc-tivity rivers are substantially diluted so that GPR couldtheoretically work [Hem, 1985, Figure 38]. This technologywould not be usable in estuarine environments, and notduring low flows in highly conductive river water that isundiluted.
2.2. Surface Velocity of Streams
2.2.1. Measurement With Water Contact Instruments[14] Surface velocity of rivers is difficult to measure with
water contacting instruments and therefore it is difficult toverify radar determined surface velocities. Conventionalcurrent meters are subject to surface wave effects and mustbe submerged below the water surface to allow uninterrupt-ed spinning of cups. A Price AA meter must have its cupsabout 15 cm below the surface, and thus measures the pointvelocity substantially below the water’s surface. An ADCPcannot measure velocity in a layer near the water surface ora layer near the bed [Simpson and Oltman, 1992]. When a1200 KHz ADCP is used with a bin size of 25 cm, the firstvelocity point is measured at about 75 cm below the watersurface. Near the bed, the velocity in the bottom 6% of thetotal depth cannot be measured due to acoustic signalsidelobe interference. An acoustic instrument called Boo-gieDopp (BD) has been developed for river dischargemeasurements in small and shallow rivers. The first validvelocity of the shallow-looking forward transducer beam ismeasured at about 11 cm below the water surface. Thisvelocity has been used to verify radar-measured surfacevelocity [Cheng and Gartner, 2003].[15] Another simple way to estimate surface velocity
involves timing seeded or naturally occurring floatingmaterials to establish surface velocity fields. This method,known as particle image velocimetry, or PIV, has producedgenerally good results [e.g., Creutin et al., 2003], butrequires the photography of floating materials across theentire river to define the surface velocity flow patterns. Itwas not used in our experiments.
2.2.2. Surface Velocity Measurement UsingElectromagnetic Waves at UHF and MicrowaveFrequencies[16] Three different radar systems designed to measure
surface velocity of rivers were deployed and evaluated inthe field tests described later. They were a continuous wavemicrowave systems (24 GHz) [e.g., Yamaguchi and Niizato,1994], a monostatic UHF (350 MHz) Doppler radar [Teagueet al., 2003a] and an pulsed Doppler (9.36 GHz) microwaveradar [Plant et al., 2005a]. Both microwave and UHFDoppler radars receive scattered signals from random waveson the water surface because of Bragg scattering of elec-tromagnetic waves by short surface waves that roughen thewater surface. These short waves produce a Doppler shiftboth because they have an intrinsic phase speed and becausethey are advected by the current in the river [Plant andKeller, 1990]. Bragg scattering is a resonant phenomenon inwhich the lengths of those short waves that cause backscat-ter are well characterized by the Bragg condition:
lb ¼ l= 2 sinqð Þ
where lb is the wavelength of the resonant water wave (theBragg wave), l is the wavelength, and q is the incidenceangle. For an X band radar of frequency 10 GHz, l � 3 cmso lb is about 1.5 to 2 cm; at a UHF frequency of 350 MHz,l � 86 cm so lb is about 50 cm. For surface velocities to besuccessfully measured by this technique, some watersurface roughness must be present. This roughness can begenerated by turbulent boils on the water surface, by wind,or by rain.[17] As a result of diffraction effects, typical microwave
antennas have beam widths on the order of a few degrees.This sets the size of the illuminated area in the azimuthdirection. In the pointing direction of the antenna, the rangedirection, the footprint on the river surface can be limited bypulsing the transmitted signal. Sampling the return signal ata variety of time delays then yields signals from small‘‘range bins’’ equally spaced over the water. In both range
Figure 3. Effects of conductivity on 100 MHz GPR signals in impure freshwater.
4 of 14
W07422 COSTA ET AL.: NONCONTACT STREAMFLOW W07422

and azimuth dimensions, the areas on the water surfaceilluminated by electromagnetic waves are decimeters tometers in size, and contain many cycles of the resonantwater wave. The Bragg scattering process is highly selectivein both wavelength and direction, and the only significantenergy returned to the radar comes from water waveshaving approximately one half the radar wavelength thatare traveling radially toward or away from the radar. Otherwater waves also scatter the radar signal, but not back to theantenna. The signal that is returned to the radar representsan average over the scattering patch. The same phenomenaoccur at UHF frequencies, the primary difference being thatbeam widths are much broader at this frequency for similar-sized antennas. The result is that Bragg waves travelingtoward or away from the antenna occur over a wide range ofazimuth angles. Neither system will work in the absence ofshort waves (here meant to be wavelengths less than about0.5m) on the surface of the water.[18] For the narrow beams of microwave antennas, the
Doppler spectrum typically shows two peaks, one for shortwaves advancing toward the antenna and one for thosereceding from the antenna. Since these peaks are close infrequency and their intensities may differ, and indeed, onemay vanish, the problem at microwave frequencies isdetermining the mean frequency between these peaks. Theshift of this frequency from zero is a measure of the surfacecurrent. For the broader beams of UHF antennas, theproblem is different. Here peaks caused by advancing andreceding waves in any given direction are well separatedand can be used individually to determine surface currentsby subtracting their known phase speed. The problem,however, is that signals are received from a wide range ofazimuth angles simultaneously. Some of these angles aredirected upstream and some downstream. Thus advancingand receding waves from different directions may overlap ifthe current is strong. This must be sorted out in dataprocessing.
2.3. Wind Effects on Surface Velocity
[19] After proper processing, the surface current in theriver can be determined from the Doppler shifts but thiscurrent includes the drift current caused at the surface by thewind. The effective depth at which the velocity is measured,both at UHF and microwave frequencies, is approximately0.044 lb [Stewart and Joy, 1974; Plant and Wright, 1980].For lb = 1.7 cm, relevant to microwave scattering, thisdepth is about 0.75 mm. At this depth, the wind drift layerhas not completely decayed. The magnitude of the winddrift at the surface is well known from experiment to beabout 2% of the wind speed measured 10 m above thesurface and in the wind direction [Plant and Wright, 1980].For a 10 m/s wind speed, this is 20 cm/s. Assuming alogarithmic decay to the effective depth of the microwavemeasurement following Plant and Wright [1980], the winddrift at the effective measurement depth is about 11 cm/s.This amount of error is incurred in the measurement ofsurface velocity only if the wind blows exactly along thedirection in which the antenna is pointing. For otherdirections, the error will be less.[20] At UHF, the wind drift has an even smaller effect.
For lb = 50 cm, the effective measurement depth is about2.2 cm where the wind drift created by a 10 m/s wind has
decayed to about 4 cm/s. This is very difficult to detect evenfor wind blowing directly along the river.
2.4. Continuous Wave Microwave System
[21] Presently, the simplest and least expensive methodfor monitoring the surface velocity of a river is with acontinuous wave microwave system. RiverScat was devel-oped at the Applied Physics Laboratory, University ofWashington. A transceiver operating at 24 GHz (K band)and producing 5 mW of power is attached to a verticallypolarized, 30 cm diameter, parabolic antenna. This systemdigitizes the analog signals at a 1 kHz rate, computesDoppler spectra every half second, and stores the resultsin files for subsequent processing. Spectra are analyzed byfitting the noise level to an inverse frequency function,dividing the received signal by this noise level, and apply-ing an algorithm to determine the Doppler frequency shiftmidway between the Bragg lines [Plant et al., 2005a].[22] In a low-turbulence river, continuous wave micro-
wave sensors will not yield a measurement unless rain isfalling or wind is blowing. The limitation is lack of surfaceroughness, not slow flow velocity. Thus gaps in the datarecord can occur if turbulence is too low. The number ofgaps can be reduced by operating the system closer to thewater. As stage increases or decreases, the illuminated spoton the river surface from RiverScat is simply displaced asmall distance along streamlines. Since RiverScat ismounted in a fixed position or moved across the channelon a cableway, georeferencing is accomplished by notinglocation across the river.
2.5. Pulsed Doppler Microwave Radar
[23] A second method for measuring surface velocity isthe pulsed Doppler microwave radar (RiverRad) developedby the Applied Physics Laboratory, University of Washing-ton. The radar emits bursts of 9.36 GHz microwaves acrossthe water surface from two antennae on the riverbank. Theaverage transmitted power is 5 mW. Average surfacevelocities are measured in a series of bins across the river,whose locations are determined by time gating, and whosesize varies with beam width in the azimuth direction.Azimuth widths vary from about 1 m near the antenna toabout 4 m at a distance of 100 m. In the range direction,RiverRad can measure in bins of width 3.75, 7.5, 15, or30 m. The maximum range at this resolution is 480 m and isproportional to resolution. Doppler spectra averaged over a30 s interval were recorded for each measurement. Theactual velocity vectors were determined from a pair ofalong-beam velocities pointing at 23� upstream and down-stream of the river by assuming the velocity was steadybetween the two footprints [Plant et al., 2005a]. Theoptimal location for radar measurements is a straight chan-nel with steady, uniform flow and no significant variation ofbed roughness, bottom slope, or channel geometry betweenradar footprints.[24] Uncertainties caused by variations in stage on bank-
side radar systems are negligible. For RiverRad, changes instage will change the grazing angle. A stage change of3 meters causes a grazing angle change of 2�–3�, whichleads to a change in velocity of no more than a fraction of apercent. RiverRad georeferencing is easy since the velocitydrops to zero at both riverbanks in the absence of current.
W07422 COSTA ET AL.: NONCONTACT STREAMFLOW
5 of 14
W07422

2.6. UHF Radar
[25] A different kind of radar system for measuringsurface velocity was developed by CODAR Ocean Sensors,Ltd. [Teague et al., 2003a, 2003b]. A high-frequencysystem used to observe ocean currents (SeaSonde) wasmodified to a higher frequency (UHF) consistent with theshorter Bragg wavelengths in open channel flow of rivers.The radar makes three basic measurements: the Dopplerfrequency, the distance or range to the scattering patch, andthe direction of arrival of the radar echoes. From these, theradial component of the flow velocity can be mapped as afunction of position on the water surface. If, in addition, theflow is assumed to be predominantly in one direction, as isoften the case for a river, the total flow velocity and thecross-channel flow profile can be estimated.[26] The UHF radar, named RiverSonde, works by Four-
ier processing of the received signal to determine itsDoppler shift and direction in each frequency bin producingthe Doppler shift. RiverSonde uses a yagi antenna systemand monostatic geometry (transmitting and receiving anten-nas located on the same side of the river) that broadcasts at350 MHz. The radar antenna system consists of threemultielement yagi antennas, separated by one half of theradar wavelength and oriented in different directions, withthe outer yagi antenna rotated 30� from the direction of thecenter antenna. Processing signals separately from the threeyagi antennas allows the direction of arrival of the radarechoes to be measured to a resolution of about 1� using aMUSIC direction finding algorithm [Schmidt, 1986]. Therange resolution of the radar was set to 5 m, with amaximum range of 140 m, although the range resolutioncan be varied by software setting. Transmitted power is lessthan 1 W.
2.7. Converting Surface Velocity to Mean Velocity
[27] All noncontact methods for measurement of streamvelocity measure the velocity of the river current at or veryclose to the surface of the water. For discharge computa-tions, the average velocity in the vertical water column mustbe known. Most open channel flow, especially duringfloods, has high Reynolds numbers and is turbulent. Thisis advantageous because while turbulent flow field veloci-ties fluctuate widely, over time the constant flow mixingmakes the river’s mean velocity structure predictable.[28] Numerous observations and measurements have
shown that in natural channels, flow velocity increasesvertically with the logarithm of the distance from thechannel boundary. Velocity changes rapidly near the chan-nel bed and banks, and more slowly in the interior of theflow, allowing larger eddies to develop in the middle of theflow. This predictable log layer (absent significant second-ary flows) leads to the fundamental basis for measurementof streamflow by current meters: the mean velocity of a loglaw vertical flow profile occurs at about 0.6 the mean depth,or the average of 0.2 and 0.8 mean depth.[29] The measurement of surface velocity by noncontact
methods can serve as a surrogate for mean flow velocity ifone assumes that open channel flows conform to the loglaw. To convert surface velocity to mean velocity in thewater column, assuming the velocity profile follows the loglaw of the wall, the theoretical mean to surface velocity ratiois 0.85 [Rantz, 1982] for a wide range of depth to bottom
roughness ratios. For steep rivers where relative roughnessis large, a logarithmic velocity profile does not developbecause of drag from coarse bed material and the high-velocity flow near the water surface [Jarrett, 1991]. Theseconditions did not exist in the two rivers used for these tests,but when computing flow in steeper channels, individualsites may need to be calibrated to their unique verticalvelocity profiles.
3. Field Tests of Noncontact River DischargeMeasurements
3.1. San Joaquin River Near Vernalis, California
[30] In April–May 2002, a month-long experiment in theSan Joaquin River at Vernalis, California, was conducted.The goal was to simulate a system of continuous noncontactdirect measurements of surface velocity and periodic mea-surements of channel cross section to produce discharge bynoncontact methods and without using a rating curve. Theexperiment involved continuous recording of surface veloc-ity by microwave radar not counting periods of mechanicalrepairs or power interruptions, 23 separate measurements ofchannel cross section by GPR, and testing of a UHF radarsystem.[31] The GPR system used to measure channel cross-
section area is a Mala Geoscience Ramac X3M Corder GPRsystem using shielded antennas with a center frequency of100 MHz and weighing about 25–30 kg. This frequencyseems to give the best compromise of penetration andresolution in fresh water settings. The GPR unit is operatedfrom a cableway that allows the antenna to be moved acrossthe river while suspended 0.5–2 m above the water surface.For these experiments, the speed of electromagnetic wavesin water was measured to be 0.033 m/ns (0.11 ft/ns), andthis value was used to convert the timescale GPR data into alength scale to determine water depth.[32] Water contact instruments used to estimate surface
velocity during the experiments described here are listed inTable 1.[33] The site of the experiment was the USGS stream
gauging station 11303500 San Joaquin River near Vernalis,California. This is a daily record stream gauging stationwith data extending back to 1930. The rating curve for thisstation is frequently inaccurate due to the unstable nature ofthe channel bed during high flows. During high runoffperiods, weekly and even daily direct current meter dis-charge measurements are necessary to make adjustments tothe rating curve. Noncontact direct measurement of rivervelocity and channel cross sections hold the promise ofavoiding the time and resources needed to maintain a ratingcurve at an unstable channel such as exists at this site.[34] The pulsed Doppler microwave radar RiverRad (with
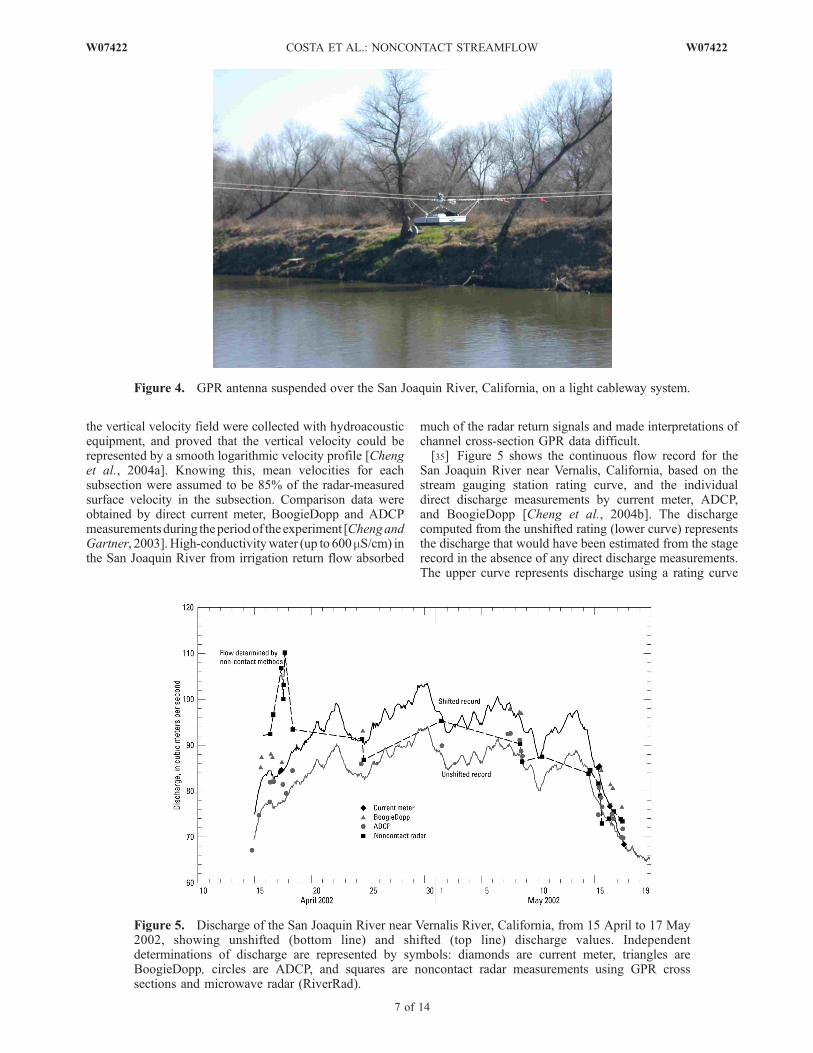
a bin width of 3.75 m) was used to measure surface velocity,and the GPR system was suspended over the river using abank-operated cableway (Figure 4). Numerous profiles of
Table 1. Instruments Used to Measure Surface Velocity
Standard Water Contact Instrument Closest Distance to Surface
BoogieDopp �11 cmPrice AA current meter �15 cmRio Grande 1200 KHz ADCP �75 cm
6 of 14
W07422 COSTA ET AL.: NONCONTACT STREAMFLOW W07422
the vertical velocity field were collected with hydroacousticequipment, and proved that the vertical velocity could berepresented by a smooth logarithmic velocity profile [Chenget al., 2004a]. Knowing this, mean velocities for eachsubsection were assumed to be 85% of the radar-measuredsurface velocity in the subsection. Comparison data wereobtained by direct current meter, BoogieDopp and ADCPmeasurementsduring theperiodof theexperiment [ChengandGartner, 2003].High-conductivitywater (up to 600 mS/cm) inthe San Joaquin River from irrigation return flow absorbed
much of the radar return signals and made interpretations ofchannel cross-section GPR data difficult.[35] Figure 5 shows the continuous flow record for the
San Joaquin River near Vernalis, California, based on thestream gauging station rating curve, and the individualdirect discharge measurements by current meter, ADCP,and BoogieDopp [Cheng et al., 2004b]. The dischargecomputed from the unshifted rating (lower curve) representsthe discharge that would have been estimated from the stagerecord in the absence of any direct discharge measurements.The upper curve represents discharge using a rating curve
Figure 4. GPR antenna suspended over the San Joaquin River, California, on a light cableway system.
Figure 5. Discharge of the San Joaquin River near Vernalis River, California, from 15 April to 17 May2002, showing unshifted (bottom line) and shifted (top line) discharge values. Independentdeterminations of discharge are represented by symbols: diamonds are current meter, triangles areBoogieDopp, circles are ADCP, and squares are noncontact radar measurements using GPR crosssections and microwave radar (RiverRad).
W07422 COSTA ET AL.: NONCONTACT STREAMFLOW
7 of 14
W07422

that has been corrected based on direct measurements.Noncontact (radar) discharges measured in April and May2002 are plotted as squares. During the first 3 days of theexperiment, water was being released from upstream reser-voirs and discharge increased from 62 to 91 m3/s. All thedirect discharge measurements by current meter, Boogie-Dopp, and ADCP are in good agreement. The radar mea-surements produced discharges more than 20% higher thanthe other independent measurements in the early part of theexperiment. The data show that the GPR depth measure-ments at this time were about 5–10% larger than the in situmeasurements and that RiverRad’s surface velocities wereabout 15–20% higher than the hydroacoustic comparisondata (Figure 6). The depth differences could be related to thehigh-conductivity river water at the beginning of the exper-
iment that may have led to greater error in interpretation ofchannel cross-section area. The reason for the higherRiverRad surface velocities compared with hydroacousticdata remains unclear. After the first three days, the noncon-tact radar discharge measurements are within 5% of therating values, and agreement appears to be good (Figure 5).
3.2. Cowlitz River at Castle Rock, Washington
[36] From October 2003 to March, 2004, another exper-iment was conducted to demonstrate continuous noncontactmonitoring of river discharge. The bank-operated cablewayand the GPR unit used in the San Joaquin River experimentswere relocated to the Cowlitz River at Castle Rock, Wash-ington, just upstream of a USGS stream gauging station(14243000). This site was selected because buildings to
Figure 6. Comparisons of radar depth and surface velocity measurements with water contactmeasurements during the first days of the experiment on the San Joaquin River, California.
Table 2. Characteristics and Features of Different Radar Systems Used in Experiments
ResponsibleOrganization Radar Radar System Frequency Purpose Accuracy
Light WindOperation
RangeResolution
USGS Mala X3M Corder GPR 100 MHz cross section 15–20 cm OKUW RiverScat Microwave/CW 24 GHz surface velocity 15 cm/s difficult �5 mUW RiverRad Microwave/pulsed Doppler 9.36 GHz surface velocity 10 cm/s OK �5 mCODAR RiverSonde UHF/monostatic 350 MHz surface velocity 15 cm/s OK �5 m
8 of 14
W07422 COSTA ET AL.: NONCONTACT STREAMFLOW W07422

house instrumentation and provide power and telemetrywere located next to the field site, the stream gauge waslocated between Portland, OR, and Seattle, Washington,where field personnel were located, and the flow history ofthe river indicated a high probability of floods during thetime of the experiment. The Cowlitz River at Castle Rockdrains about 5,800 km2 in the Cascade Mountains in centralWashington. The river is about 92 m wide and between 2–7 m deep at the measurement site.[37] Three organizations interested in noncontact mea-
surement of streamflow participated in the Cowlitz Riverstream gauging station experiment: the USGS, the Applied
Physics Laboratory of the University of Washington (UW),and CODAR Ocean Sensors, Ltd. Table 2 describes theradar systems deployed by each organization. All systemswere installed and operational for the period 28 October2003 to 4 March 2004.[38] The RiverRad system was deployed with two dish
antennas, one pointing up river and one pointing downriver, separated by an angle of about 23�. A RiverScat arrayof eight microwave antennas was mounted under thehighway bridge over the Cowlitz River at the streamgauging station about 100 m downstream from the bank-operated cableway (Figure 7) [Plant et al., 2005b].
Figure 7. View under Cowlitz River bridge with four of eight RiverScat antennas visible and pointingupstream.
Figure 8. Continuous wave RiverScat system (antenna and control box) mounted atop a GPR antennasuspended from a cableway approximately 3–4 m above the water, across the Cowlitz River,Washington.
W07422 COSTA ET AL.: NONCONTACT STREAMFLOW
9 of 14
W07422

[39] To make complete discharge measurements from alight cableway, a single RiverScat antenna was mounted ontop of a GPR antenna. This arrangement is shown inFigure 8. The package was sufficiently light that it couldbe towed across the river by an electric motor on the bank.No personnel were required to be on the cableway. A shortvideo of equipment used to make this discharge measure-ment is attached to the electronic version of this paper(Animation 1).[40] Surface velocities measured by RiverScat were com-
pared with those measured by an acoustic system (Boogie-Dopp) that had to be placed in the water and towed acrossthe river in a boat or from a bridge to collect data. Theresults are shown in Figure 9. Velocity data are not identical,possibly indicating a small bias in the RiverScat measure-ment. This bias was not consistently present. Outputs ofboth RiverRad and RiverScat were sent over phone lines tothe University of Washington twice a day.[41] Agreement between directly measured (hydroacous-
tic) and noncontact surface velocity (RiverRad) has beengood (Figure 10), except near the banks of the river wherebank interference can disrupt or block return signals [Costaet al., 2000; Cheng et al., 2004b, Figure 8]. In theseexperiments, we never observed a situation where the signalto RiverRad was absent, which is attributed to the muchlower noise levels in RiverRad.[42] Both RiverRad and the bridge-mounted RiverScat
units collected a near-continuous record of surface velocityover the 4-month period of the experiment. TheUSGS streamgauging station measured a continuous record of river stage(and, with use of a rating curve, discharge) over the sameperiod, while cross-section profiles were measured periodi-cally with a fathometer or ADCP/BoogieDopp, and GPR.[43] The RiverSonde system was installed and began
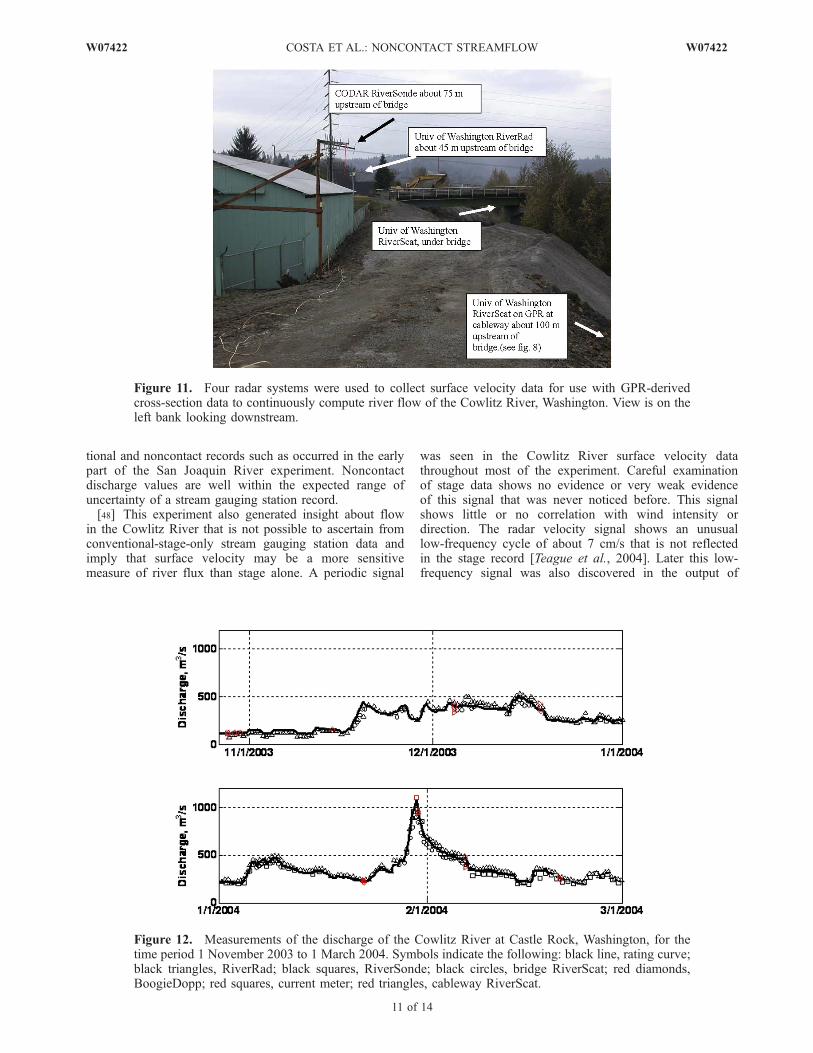
collecting data on 28 October 2003. A weather station thatrecorded wind speed and direction, air temperature, baro-metric pressure, rainfall and humidity, was later added to theinstallation. The antennas were erected on the left bank ofthe river on the artificial levee. Electronics were housed inan adjoining building that had AC power and allowed for atelephone line and modem for direct, remote interrogationof data, and a live video camera.[44] Figure 11 is a photo of the four radar systems used to
measure surface velocity on the Cowlitz River. Results from
the four radar systems were compared with the rating curveof stage versus discharge maintained by the USGS, anddirect discharge measurements by current meter and hydro-acoustic methods.
3.3. Continuous Noncontact Measurements ofSurface Velocity and Discharge
[45] Truly continuous noncontact discharge measure-ments could not be obtained for the Cowlitz River becausethe GPR was operated only intermittently from the cable-way. The bed of the river, however, is stable and thisstability can be used to estimate continuous discharges fromthe radar measurements of surface velocity. All GPR mea-surements of the height of the bottom of the river above adatum (mean sea level for this site) were averaged and thisaverage value was subtracted from the continuous record ofstage measurements. This yielded a time series of crosssections to compliment surface-velocity measurements, bothof which are then used to compute discharge. The productof cross section and surface velocity multiplied by 0.85 (toobtain mean velocity) yielded the record of continuous radardischarge measurements shown in Figure 12. Figure 12 alsoshows the discharge obtained from the rating curve andfrom in situ conventional measurements made by hydro-acoustic or mechanical meters during the experiment.[46] Between 1 November 2003 and 1 March 2004, the
USGS stream gauging station recorded 10,358 individualstage readings, or about 9% less than the expected numberbecause of lost record when bankside constructiondestroyed the orifice line of the stream gauging station.During this time, the total number of RiverScat measure-ments was 5,931; RiverRad measurements totaled 4,807;and RiverSonde measurements were 1,155. The radarsystems measured river velocity less frequently than stagewas measured to keep telephone-transmitted data files toreasonable size. Correlation coefficients between the dis-charge computed from the stream gauging station ratingcurve, and each of the three radars are:
Rating curve=RiverScat ¼ 0:883Rating curve=RiverRad ¼ 0:969Rating curve=RiverSonde ¼ 0:992
[47] On average, noncontact instantaneous dischargeswere within 1–3% of conventional method discharges,and there are no significant differences between conven-
Figure 9. Comparison of surface velocities measured byRiverScat with those from the acoustic system, Boogie-Dopp, from the Cowlitz River, Washington.
Figure 10. Comparison of RiverRad-derived surface velo-city and BoogieDopp for the Cowlitz River, Washington.
10 of 14
W07422 COSTA ET AL.: NONCONTACT STREAMFLOW W07422
tional and noncontact records such as occurred in the earlypart of the San Joaquin River experiment. Noncontactdischarge values are well within the expected range ofuncertainty of a stream gauging station record.[48] This experiment also generated insight about flow
in the Cowlitz River that is not possible to ascertain fromconventional-stage-only stream gauging station data andimply that surface velocity may be a more sensitivemeasure of river flux than stage alone. A periodic signal
was seen in the Cowlitz River surface velocity datathroughout most of the experiment. Careful examinationof stage data shows no evidence or very weak evidenceof this signal that was never noticed before. This signalshows little or no correlation with wind intensity ordirection. The radar velocity signal shows an unusuallow-frequency cycle of about 7 cm/s that is not reflectedin the stage record [Teague et al., 2004]. Later this low-frequency signal was also discovered in the output of
Figure 11. Four radar systems were used to collect surface velocity data for use with GPR-derivedcross-section data to continuously compute river flow of the Cowlitz River, Washington. View is on theleft bank looking downstream.
Figure 12. Measurements of the discharge of the Cowlitz River at Castle Rock, Washington, for thetime period 1 November 2003 to 1 March 2004. Symbols indicate the following: black line, rating curve;black triangles, RiverRad; black squares, RiverSonde; black circles, bridge RiverScat; red diamonds,BoogieDopp; red squares, current meter; red triangles, cableway RiverScat.
W07422 COSTA ET AL.: NONCONTACT STREAMFLOW
11 of 14
W07422

RiverRad. Upon discovery of this signal, the time seriesrecord was carefully analyzed. The time series recordincludes hourly measurements of water level (stage),along-channel wind speed, and the surface velocity mea-sured by RiverSonde. The original measurements weretaken at finer time intervals, but averaged over an hour toconstruct an hourly time series that covers the periodfrom 29 January 2004 to 15 April 2004 (Figure 13).[49] The standard tidal harmonic analysis procedure was
applied to the time series [Foreman, 2004]. The time serieswas analyzed in three ways: (1) the entire record between 15February and 15 April 2004, (2) the record covering from15 February to 17March 2004 (30 days), and (3) 15March to15 April 2004. Because of the high-flow event that took placeat the end of January (see section 3.4), the record in the first
two weeks in February was not used. The major astronomicaltidal components of velocity and water level have valueshigher than the minor components. Only the amplitudes andphases of the four major tidal components (two diurnal, O1
Figure 13. Time series of water level (reference to mean sea level), along-channel wind speed (m/s), andwater surface velocity measured by RiverSonde (m/s) for the Cowlitz River at Castle Rock, Washington.
Table 3a. Results of Harmonic Analysis: Water Surface Velocitya
Amplitude, m/s Phase, deg
A B C A B C
O1 0.0298 0.0232 0.0321 55.64 52.61 61.08K1 0.0243 0.0164 0.0231 129.78 124.57 136.83M2 0.0127 0.0151 0.0106 339.74 43.20 343.35S2 0.0205 0.0225 0.0169 73.58 78.10 67.71
aIn Tables 3a and 3b, A refers to the entire record between 15 Februaryand 15 April 2004, B refers to the record covering 15 February to 17 March2004, and C refers to the record covering 15 March to 15 April 2004.
12 of 14
W07422 COSTA ET AL.: NONCONTACT STREAMFLOW W07422

and K1 and two semidiurnal, M2 and S2) are compiled andgiven in Tables 3a and 3b. Of the three independentlyanalyzed time series, the amplitudes of these major compo-nents consistently show higher values when compared withtheminor components (not shown). The phase angles of theseindependent analyses show stationarity, i.e., the maximumdifference of the phase angles from different analysis is lessthan 7�. Thus the time variations of velocity are definitelyassociated with astronomical forcings no matter how smallthe amplitudes of the velocity components may be. Incontrast, with water level the amplitudes of the major com-ponents are also higher than minor components (not shown),but there is no sign of stationarity in the phase angles betweenthese independent analyses. There is not a clear explanationwhy the astronomical properties are reflected in surfacevelocity but not in the water level measurements. Keepingin mind that the velocity fluctuations are only on the order of5–7 cm/s, the respective water level fluctuations might be toosmall to be detected by stage recorders.
3.4. Peak Flow of January 2004
[50] On 30 January 2004, the Cowlitz River crested at thehighest flow during the 4month experiment. Heavy rainfall inthe headwaters of the Cowlitz basin resulted in a peakdischarge of 1,079 m3/s at a stage of 12.77 m (41.89 ft). Peakstage occurred at 0930. We were able to make a direct currentmeter measurement at the peak of this flood, although themeasurement took two hours to complete and conditionsconducive to making an accurate measurement continued todeteriorate. The current meter discharge measurement (madeat a mean time of 0930) was 1,102 m3/s (mean gauge height12.77 m (41.89 ft)), 2.1% greater than the rating curve valueof 1,079m3/s. Large volumes of floating logs and debrismadethis measurement difficult as well as dangerous. One methodto deal with large volumes of floating debris is to leave thecurrent meter in the water for only half the prescribed time fora velocity measurement with a Price AA meter. While thisallows a measurement to be made, the uncertainty of pointvelocities obtained by using this ‘‘half count’’ methodincreases. The time (2 hours), effort, uncertainty, and safetyconsiderations of making this discharge measurement rein-forced the reasons for continued pursuit of a noncontact flowmeasuring system.[51] The three surface velocity measuring radars were
operational during this flood. The channel cross section wasmeasured with GPR from the bank-operated cableway abouttwo hours following the peak. The water surface had onlydeclined about 0.1 m and flow had dropped by less than 4%.GPR profiles for cross-section measurements took about10 min to acquire following a 30 min antenna setup. Inter-preted water surface and channel bed reflections made every3mweremarked on the profile. Radar signals were convertedfrom timescale to length scale, assuming the velocity of radar
waves in water was 0.033 m/ns. These values were enteredinto a spreadsheet with the area computed for each subsectionand summed to obtain total area. GPR-derived depths werecompared with depth measurements from hydroacoustics(BoogieDopp) and agreed to within about 3%.[52] Surface velocity data collected from the different
radars during the time GPR measurements were being madewere converted to mean velocity (assuming a logarithmicvelocity profile). These data were then combined with theGPR-derived channel depths and subsection dischargescomputed, then summed to obtain a total noncontact dis-charge flow value. Results are tabulated in Table 4.[53] Noncontact discharge measurements made following
the peak on 30 January 2004 agreed with the rated dischargeto within 5%. Best results (+1.4%) were obtained usingRiverScat mounted on the GPR antenna, as pictured inFigure 8 and Animation 1.
4. Conclusions
[54] The desire to improve the safety, speed, and costeffectiveness of the stream gauging program in the USGSsparked new interest in investigating new or differenttechnologies for streamflow measurements. Partnershipswith university colleagues and a private company wereessential for the successful completion of several experi-ments to measure the flow of rivers without having instru-ments in the water. The two experiments described hereinprovide some direction and guidance on what can beaccomplished. Water surface velocity has been measuredsuccessfully (when compared to data collected with acousticinstruments or mechanical current meters) with a micro-wave Doppler radar at 9.36 GHz, continuous wave micro-wave systems using 24 GHz, and a UHF radar system using350 MHz center frequencies. All radars use the principle ofBragg scatter from roughness elements on the water’ssurface. Channel cross sections were measured successfully(when compared to fathometer, sounding weight, andADCP data) with a GPR unit suspended above the watersurface. Conductivity is the most significant problem facedduring the experiments. On the San Joaquin River nearVernalis, California, conductivity values ranged from 300 to600 mS/cm, making GPR interpretations of cross-sectionalarea difficult.[55] The most important contribution of these experi-
ments may be the demonstration of the ability to measuredirectly all of the properties of river flow needed to computedischarge, velocity and cross-sectional area, by noncontact
Table 3b. Results of Harmonic Analysis: Water Level (Stage)
Amplitude, m Phase, deg
A B C A B C
O1 0.0030 0.0100 0.0221 190.29 83.8 237.88K1 0.0137 0.0030 0.0269 197.20 329.42 119.47M2 0.0155 0.0138 0.0102 49.14 36.58 14.87S2 0.0101 0.0085 0.0100 60.71 60.39 357.52
Table 4. Comparison of Discharge Measurements With Conven-
tional Methods (BoogieDopp, Rating Curve, and Current Meter)
and With Radars for High Flow on Cowlitz River, Washington,
Measured During the Period 0930–1530 LT, 30 January 2004
Time Source Discharge, m3/s
0930 rating curve 1,0790930 current meter 1,1021200 rating curve 1,0391200 GPR/RiverRad 9911200 GPR/RiverSonde 9971200 GPR/RiverScat (cableway) 1,0541530 rating curve 9741530 BoogieDopp 954
W07422 COSTA ET AL.: NONCONTACT STREAMFLOW
13 of 14
W07422

methods and thereby, in the future, potentially eliminate theneed for a rating curve. There are some aspects of thesemethods that are not completely resolved and may be sitedependent. One is the need to convert from surface velocityto mean velocity in a subsection of the river. We concludedthat an assumption of the lognormal velocity profile wasappropriate for the two river sites used in these experiments.This assumption will not apply to all rivers. The periodicvelocity pulses observed in all radar-derived surface veloc-ities in the Cowlitz River, Washington, are interpreted toresult from tidal influences, but their lack of signal in thestage record is an unresolved dilemma.[56] Another technical problem is how to measure the
cross section of a river from a single point on the bank ofthe river. We have not yet solved this, and for now a bridge,cableway, or helicopter [Melcher et al., 2002] is required tomove the GPR antenna out over the river. Additionalexperiments are planned in the future to test a banksidechannel–cross section radar system.[57] These experiments have demonstrated that technol-
ogy exists for making continuous noncontact measurementsof streamflow that could supersede present methods thatrely on a rating curve adjusted with periodic direct flowmeasurements by mechanical meter or hydroacoustic instru-ments. The primary constraint identified is high-conductiv-ity water. In time, these methods may lead to new processesand practices for stream gauging, ones that are safer, faster,less expensive, and more accurate than present methods.
[58] Acknowledgments. This work was supported by the NationalStreamflow Information Program (NSIP), U.S. Geological Survey. We wishto thank Mark Landers and Scott Morlock for helpful reviews, RobertHirsch and Stephen Blanchard for their vision and leadership, and WilliamKeller and Chris Siani for technical support. The Editors and reviewers forthe journal were equally thoughtful and supportive. W. J. Plant andK. Hayes would like to acknowledge partial support for this project fromthe National Science Foundation through grant EAR-0106391.
ReferencesBell, P. S. (1999), Shallow water bathymetry from an analysis of X-bandmarine radar images of waves, Coastal Eng., 37, 513–527.
Benson, M. A., and T. Dalrymple (1967), General field and office proce-dures for indirect discharge measurements, U.S. Geol. Surv. Tech. WaterResour. Invest., Chap A1, Book 3, 30 pp.
Cheng, R. T., and J. W. Gartner (2003), Complete velocity distribution inriver cross-section by acoustic instruments, paper presented at 7th Work-ing Conference on Current Measurement Technology, Inst. of Electr. andElectr. Eng., San Diego, Calif.
Cheng, R. T., J. W. Gartner, R. R. Mason, J. E. Costa, W. J. Plant, K. R.Spicer, F. P. Haeni, N. B. Melcher, W. C. Keller, and K. Hayes (2004a),Evaluating a radar-based, non-contact streamflow measurement systemin the San Joaquin River at Vernalis, California, U. S. Geol. Surv. OpenFile Rep., 2004-1015, 16 pp.
Cheng, R. T., J. E. Costa, R. R.Mason,W. J. Plant, J.W.Gartner, K. R. Spicer,F. P. Haeni, and N. B. Melcher (2004b), Continuous non-contact riverdischarge measurements, paper presented at Ninth International Sympo-sium on River Sedimentation, Minist. of Water Resour., Yichang, China.
Costa, J. E., K. R. Spicer, R. T. Cheng, F. P. Haeni, N. B. Melcher, and E. M.Thurman (2000), Measuring stream discharge by non-contact methods: Aproof-of-concept experiment, Geophys. Res. Lett., 27, 553–556.
Creutin, J. D., M. Muste, A. A. Bradley, S. C. Kim, and A. Kruger (2003),River gauging using PIV techniques: A proof of concept experiment onthe Iowa River, J. Hydrol., 277, 182–194.
Foreman, M. G. G. (2004), Manual for tidal heights analysis and prediction(revised), Pac. Mar. Sci. Rep. 77-10, 58 pp., Inst. of Ocean Sci., PatriciaBay, B. C., Canada.
Hem, J. D. (1985), Study and interpretation of the chemical characteristicsof natural water, U.S. Geol. Surv Water Supply Pap., 2254, 263 pp.
Jarrett, R. D. (1991), Wading measurements of vertical velocity profiles,Geomorphology, 4, 243–247.
Melcher, N. B., et al. (2002), River discharge measurements by usinghelicopter-mounted radar, Geophys. Res. Lett., 29(22), 2084,doi:10.1029/2002GL015525.
Morlock, S. E. (1996), Evaluation of acoustic Doppler current profilermeasurements of river discharge, U.S. Geol. Surv. Water Resour. Invest.Rep., 95-4218, 37 pp.
Okamoto, Y. (1999), Development of a non-contact method of measuringriver depth from the air, in Environmental Hydraulics: Proceedings of theSecond International Symposium on Environmental Hydraulics, editedby J. H. W. Lee, A. W. Jayawardena, and Z. Y. Wang, pp. 965–970, A.A. Balkema, Brookfield, Vt.
O’Neill, K., and S. A. Arcone (1991), Investigations of freshwater and icesurveying using short-pulse radar, CRREL Rep. 91-15, 22 pp., U.S. ArmyCorps of Eng., Hanover, N. H.
Plant, W. J., and W. C. Keller (1990), Evidence of Bragg scattering inmicrowave Doppler spectra of sea return, J. Geophys. Res., 95,16,299–16,310.
Plant, W. J., and J. W. Wright (1980), Phase speeds of upwind and down-wind traveling short gravity waves, J. Geophys. Res., 85(C6), 3304–3310.
Plant, W. J., W. C. Keller, and K. Hayes (2005a), Measurement of riversurface currents with coherent microwave systems, IEEE Trans. Geosci.Remote Sens., 43, 1242–1257.
Plant, W. J., W. C. Keller, K. Hayes, and K. R. Spicer (2005b), Streamflowproperties from time series of surface velocity and stage, J. Hydraul.Eng., 657–664, doi:10.1061/(ASCE)0733-9429(2005)131:8(657).
Rantz, S. E. (1982), Measurement and computation of streamflow, vol 1.,Measurement of stage and discharge, U.S. Geol. Surv. Water SupplyPap., 2175, 284 pp.
Sauer, V. R., and R. W. Meyer (1992), Determination of error in individualdischarge measurements, U.S. Geol. Surv. Open File Rep., 92-144, 4–6,16.
Schmidt, R. O. (1986), Multiple emitter location and signal parameterestimation, IEEE Trans. Antennas Propag., 34, 276–280.
Simpson, M. R., and R. N. Oltman (1992), Discharge measurement systemusing an acoustic Doppler current profiler with applications to largerivers and estuaries, U.S. Geol. Surv. Open File Rep., 91-487, 49 pp.
Spicer, K. R., J. E. Costa, and G. Placzek (1997), Measuring flood dis-charge in unstable stream channels using ground-penetrating radar, Geol-ogy, 25, 423–426.
Stewart, R. W., and J. W. Joy (1974), HF radio measurements of surfacecurrents, Deep Sea Res., 21, 1039–1049.
Teague, C. C., D. E. Barrick, P. M. Lilleboe, and R. T. Cheng (2003a),Initial river test of a monostatic RiverSonde streamflow measurementsystem, in Proceedings of the IEEE Seventh Working Conference onCurrent Measurement Technology, edited by J. A. Rizoli, pp. 46–50,IEEE Press, Piscataway, N. J.
Teague, C. C., D. E. Barrick, and P. M. Lilleboe (2003b), Geometries forstreamflow measurement using a UHF RiverSonde, in Proceedings ofIEEE International Geosciences and Remote Sensing Symposium, pp.4286–4288, IEEE Press, Piscataway, N. J.
Teague,C.C.,D. E.Barrick, P.M.Lilleboe, andR.T.Cheng (2004), ExtendedUHF radar observations of river flow velocity and comparisonswith in-situmeasurements, paper presented atNinth International SymposiumonRiverSedimentation, Minist. of Water Resour., Yichang, China.
Yamaguchi, T., and K. Niizato (1994), Flood discharge measurement usingradio current meter (in Japanese), Pap. Jpn. Soc. Civ. Eng., 497 (II-28),41–50.
����������������������������D. Barrick and C. Teague, CODAR Ocean Sensors, 1914 Plymouth
Street, Mountain View, CA 94043, USA.R. T. Cheng, U.S. Geological Survey, 345 Middlefield Road, Menlo
Park, CA 94025, USA.
J. E. Costa and K. R. Spicer, U.S. Geological Survey, Office of SurfaceWater, 1300 Cardinal Court, Building 10, Suite 100, Vancouver, WA98683, USA. ([email protected])
F. P. Haeni, U.S. Geological Survey, 11 Sherman Place U-5015, Storrs,CN 06269-5015, USA.
E. Hayes, U.S. Geological Survey, Building 2101, Stennis Space Center,MS 39529, USA.
K. Hayes and W. Plant, Applied Physics Laboratory, University ofWashington, 1013 NE 40th Street,Box 355640, Seattle, WA 98105-6698,USA.
N. Melcher, U.S. Geological Survey, 520 North Park Avenue, Suite 221,Tucson, AZ 85719, USA.
14 of 14
W07422 COSTA ET AL.: NONCONTACT STREAMFLOW W07422