use of fluorescence photobleaching techniques to measure ... · use of fluorescence photobleaching...
TRANSCRIPT

Use of fluorescence photobleaching techniques to measure the kinetics of
intracellular transport
R.G. Davies, D.A. Jans and K.M. Wagstaff
Nuclear Signalling Laboratory, Department of Biochemistry and Molecular Biology, Monash University, Clayton, Vic,
3800 Australia
Transport into/out of subcellular compartments such as the nucleus is central to many important biological processes. In
recent decades, significant advances in the development of fluorescent proteins has led to the development of various
techniques to examine the movement/diffusion of proteins in living cells, enabling quantitative kinetic data to be generated
and facilitating insight into the underlying molecular mechanisms. Here, we discuss the use of fluorescence
photobleaching techniques such as fluorescence recovery after photobleaching (FRAP) to examine intracellular protein
transport, including movement into and out of the nucleus, cytoplasmic/nuclear retention of proteins and lateral movement
within membranes.
Keywords Fluorescence Recovery After Photobleaching; FRAP; Photobleaching, Protein Movement
1. Introduction
Understanding the movement of proteins is crucial to unravelling many cellular biological processes. The movement of
proteins may be either through active transport (i.e. “facilitated”) or occur through simple diffusion, and take place
within single cellular compartments/organelles such as the cell cytoplasm, or between compartments/organelles, such as
the movement of proteins from the cytoplasm to the nucleus or vice versa. Proteins can also move along cytoskeletal
networks, such as microtubules, or within membranous structures including the cell membrane. Fundamentally, protein
movement determines the interactive capabilities of proteins; ie. slow moving proteins require higher local
concentrations to interact with target molecules/sites than fast moving proteins. Therefore, in order to construct a
complete picture of the role of proteins in complex cellular processes such as receptor signalling or gene transcription, it
is not sufficient to simply measure the binding affinities of the various protein-protein interactions involved; rather, it is
also critically important to define in detail the kinetics of movement of each component.
Until the last 15 years or so, the accuracy of measuring protein dynamics has been a major limitation, with live cell
fluorescence microscopic techniques, and photobleaching approaches, the only viable option. With recent advances in
both hardware and software/image analysis and automation, there are now a number of advanced photobleaching
techniques available, some of which will be discussed here. Obviously, the importance of the development of
fluorescent labels to enable live cell imaging/photobleaching experiments in this context should not be overestimated,
with the use of tags such as green fluorescent protein (GFP) and derivatives being a major contribution to the field. Due
to the large size of these tags (GFP is ~27 kDa), there have been many attempts to develop alternative fluorescent
labelling technologies with smaller fusion sequences. Unfortunately, not all of these alternative technologies have
proved successful in terms of sensitivity and specificity, including the fluorescent bi-arsenical Lumio/FlAsHTM dye
approach, which relies on the high affinity of a small tetracysteine binding motif (CCXXCC, single letter amino acid
code, where X is any amino acid); for specific fluorescent cell-permeable dyes (see [1]). However, these technologies
have the potential, with further development to be superior to GFP and other fluorescent tags due their small size and
increased versatility of recognition sequence placement.
2. Fluorescence recovery after photobleaching
Photobleaching occurs when a fluorophore is rendered irreversibly unable to fluoresce due to chemical damage induced
by photons and covalent modification. This can occur through either repeated excitation/emission cycles or by exposure
to a single intense laser emission. One of the most common applications of photobleaching to measure protein
dynamics is fluorescence recovery after photobleaching (FRAP). FRAP is commonly used to examine protein lateral
movement within membranes but is also particularly useful for examining protein movement between
compartments/organelles such as nucleocytoplasmic transport of proteins. In either case, the protein of interest is
expressed in live cells as a fusion protein, coupled to a fluorophore such as GFP. During the FRAP approach, a small
area of the fluorescent sample in the region of interest is permanently photobleached by intense laser illumination (Fig.
1) and the cells monitored over a period of time. If the protein in question is immobile then the bleached area will
remain dark as there is no protein movement to replenish the signal (Fig. 1a). If however the protein (or a fraction
thereof) is mobile, then unbleached mobile fluorophores from outside the bleached region will move/diffuse into the
area and bleached proteins may in turn move out of the dark area (Fig. 1b). The rate of this recovery is a function of the
Microscopy: Science, Technology, Applications and Education A. Méndez-Vilas and J. Díaz (Eds.)
756 ©FORMATEX 2010
______________________________________________

mobility of the protein, enabling the kinetics of movement to be calculated. Standard confocal microscopes are usually
suitable for the FRAP technique; ideally, they are equipped with an acousto-optical tunable filter, which allows for
rapid switching of the laser power from low intensity for imaging the cells to high intensity for bleaching the desired
area and back again. In addition the microscope needs to be able to limit the area of illumination to only the region of
interest selected, which is achieved through most modern-day microscope software packages.
Figure 1. Schematic Representation of FRAP. A/B The protein of interest is expressed as a GFP-fusion protein in living cells. A
small area of the region of interest, in this case the nucleus, is photobleached using intense laser illumination. The cell is continued to
be monitored over time using confocal laser scanning microscopy (CLSM). If the protein is immobile (A) then the bleached area will
remain dark. If a portion of the protein is mobile however (B), then the fluorescence will return over time as mobile fluorophores
from the surrounding area will diffuse/move into the bleached area. C Using image analysis of the digitised CLSM images, the
fluorescence intensity can be plotted over time. From this (left panel) the half-maximal time (t1/2), indicative of the rate of movement,
and the % Fractional recovery (%Fr), indicative of the % mobile molecules, can be determined. Changes in experimental conditions
(right panel) may result in alterations in either the t1/2 (red plot, showing an increase in the rate of movement) or the %Fr (blue plot,
indicative of reduced mobility of the molecule of interest), or both.
Using image analysis it is possible to quantify the kinetics of protein movement from a FRAP experiment. By
plotting the measured fluorescence intensity over time, the diffusion coefficient or the half-maximal accumulation time
(t1/2) can be determined along with the mobile fraction (Mf) or the % Fractional recovery (%Fr, Fig 1c). Post-
translational modifications of the proteins, mutagenesis of the protein sequence and various experimental conditions
including temperature, pH and the addition of inhibitors can alter the observed dynamics by altering either the mobile
fraction or the diffusion coefficient or both parameters (Fig 1c, right panel). Slower recovery indicates low mobility due
to parameters such as a more viscous environment or limited movement within membranes and importantly the
formation of protein complexes can have dramatic effects on the mobility of a protein during FRAP assays.
2.1 Use of FRAP to investigate nucleocytoplasmic transport
2.1.1 Conventional nuclear transport
Movement of proteins into and out of the nucleus is essential for many cellular processes including cell growth and
differentiation and to combat infectious diseases [2-4]. All transport into and out of the nucleus occurs via nuclear
A
B
Time
C
Time
Flo
ure
scence Inte
nsity
t1/2
%Fr
Time
Flo
ure
scence Inte
nsity
Microscopy: Science, Technology, Applications and Education A. Méndez-Vilas and J. Díaz (Eds.)
©FORMATEX 2010 757
______________________________________________

envelope-embedded nuclear pore complexes (NPCs). Small proteins < c. 45kDa enter the nucleus via passive diffusion,
whereas larger proteins require a nuclear localisation signal (NLS) [2]. The NLS is recognised by members of the
importin (Imp) superfamily of nuclear transport receptors. Recognition is either through an Imp α subunit within an Imp
α/β1 heterodimer or through Imp β1 or a homolog thereof alone [2, 5]. In either case Imp β mediates docking to and
translocation through the NPC [6-8]. Nuclear export is an analogous process where proteins containing a nuclear export
signal (NES) are recognised by particular Imp βs known as exportins which mediate both docking and translocation
through the NPC [9-13].
2.1.2 Measurement of nuclear import of the simian virus SV40 large tumour-antigen
One of the strongest and most well characterised NLSs is that of the simian virus 40 (SV40) large tumour antigen (T-
ag). The T-ag NLS is a monopartite stretch of basic amino acids contained in the N–terminus of the protein
(PKKKRKV132; single letter amino acid code) [14-17]. In addition to the basic NLS residues, flanking regions upstream
of the NLS have been shown to regulate T-ag nuclear import [18]. In particular, phosphorylation of S111/112
by protein
kinase CK2 and of S120 by double-stranded DNA dependent protein kinase enhances Imp α/β1 recognition by c. 100
fold, resulting in an c. 50-fold increase in nuclear accumulation [14, 19]. Similarly, phosphorylation by cyclin
dependent kinase 2 (cdk2) at T124 inhibits nuclear import of T-ag [20, 21]. The mechanism of inhibition was held to be
through binding to a cytoplasmic retention factor [21], which was recently identified as the BRCA1 binding protein 2
(BRAP2); BRAP2 binds phosphorylated T-ag through its C-terminus [20].
Figure 2. FRAP analysis of GFP-T-ag (111-135). A Cos-7 cells were transfected to express GFP-T-ag (111-135). At 24h post
transfection cells were first scanned (pre-bleach image), and then the nucleus bleached using intense laser power for 10 scans.
Immediately afterwards, cells were monitored every 20s by CLSM for fluorescence recovery. B Digitised images of the cells (A)
were analysed to determine the nuclear to cytoplasmic fluorescence ratio (Fn/c) according to the formula Fn/c = (Fn-Fb)/(Fc-Fb),
where Fn is nuclear fluorescence, Fc is cytoplasmic fluorescence and Fb is background autofluorescence. The Fn/c was then
expressed as a percentage of the pre-bleach Fn/c value to give the % fractional recovery (%Fr) as shown. C Fn/c is plotted against
time for the initial linear portion of the curve in order to enable the initial rate of nuclear import to be determined.
Due to the complex regulation of nuclear import of T-ag, FRAP analysis can be employed to dissect the kinetics of
T-ag nuclear accumulation more thoroughly. For example, COS-7 cells were transfected with plasmid DNA encoding
GFP-T-ag (111-135) containing the NLS region and its upstream regulatory residues (Fig. 2). 24h post transfection,
cell were imaged 3 times via confocal laser scanning microscopy (CLSM) to derive the pre-bleach image (Fig. 2A).
Following this the cell nuclei was subjected to 10 scans of intense laser power to photobleach GFP-Tag (111-135)
A Pre-bleach 0 s 20 s 100 s 220 s 440 s
GFP-T-ag (111-135)
B C
Time (s)
% F
r
0
20
40
60
80
100
120
0 100 200 300 400 500
Time (s)
Fn/c
0
4
6
12
0 20 40 60 80 120100
2
8
10
Initial rate = 0.055 Fn/cs-1
Microscopy: Science, Technology, Applications and Education A. Méndez-Vilas and J. Díaz (Eds.)
758 ©FORMATEX 2010
______________________________________________

contained in the nuclear compartment. Cells were subsequently monitored using CLSM every 20s for 8 min. It can
clearly be seen that immediately after the initial bleach (0s), the nuclear fluorescence is severely decreased as expected,
with the intensity of fluorescence in the nucleus much closer to that of the cytoplasm. Over the experimental time
period, the nuclear fluorescence recovers, indicating that the GFP-Tag (111-135) protein is mobile and able to enter the
nucleus.
Using image analysis of digitised images, the nuclear to cytoplasmic fluorescence ratio (Fn/c) was determined
according to the formula Fn/c = (Fn-Fb)/(Fc-Fb), where Fn is nuclear fluorescence, Fc is cytoplasmic fluorescence and
Fb is background autofluorescence. By expressing this as a percentage of the average pre-bleach Fn/c, a % fractional
recovery (%Fr) for each time point can be determined (Fig. 2B). The results demonstrate that the nuclear fluorescence
of GFP-T-ag (111-135) is able to recover completely during the 8 min experiment (%Fr of ~100) indicating that
essentially all of the protein is mobile between the cytoplasm and the nucleus. Plotting the change in Fn/c over time for
the initial linear portion of the curve (Fig. 2C) enables the initial rate of nuclear import to be determined. This kinetic
parameter reflects the rate of protein movement before saturation of the system, complementing the ½ maximal time
(t1/2) parameter as an indicator of the rate of protein movement in complex, living cell systems.
2.1.3 BRAP2 acts as a cytoplasmic retention factor for T-ag
It is possible to use FRAP to examine the interaction of T-ag with BRAP2, recently identified as a cytoplasmic retention
factor, and the effect on the kinetics of GFP-T-ag (111-135) nuclear accumulation. This can be achieved by performing
FRAP experiments similar to those in Fig. 2 on cells transfected to express both GFP-T-ag (111-135) and a DsRed2-
tagged BRAP2 (residues 343-592). The DsRed2 expression is used to identify cells in which both proteins are
expressed, but FRAP is only carried out for GFP-T-ag (111-135). In this instance it is immediately apparent that
recovery of nuclear fluorescence of GFP-T-ag (111-135) is markedly reduced in cells co-expressing DsRed2-BRAP2
(343-592) (Fig. 3A). Image analysis of the images confirms a 20% reduction in the %Fr (Fig. 3B), indicating that in the
presence of the C-terminus of BRAP2, only 80% of the GFP-Tag protein is mobile between the cytoplasm and the
nucleus. This implies that at any given time c. 20% of the GFP-T-ag molecules are rendered immobile by BRAP2 and
retained in the cytoplasm, confirming the role of BRAP2 as a cytoplasmic retention factor for T-ag. Interestingly, the
initial rate of nuclear import is not significantly affected by co-expression of DsRed2-BRAP2 (343-592) (Fig. 3C),
implying that although a portion of the T-ag molecules are rendered immobile by BRAP2, the remainder retain their
original kinetic status, demonstrating that BRAP2 acts as a cytoplasmic retention factor holding T-ag out of the nucleus,
rather than simply slowing its rate of nuclear import.
The above example effectively demonstrates how the FRAP approach can be utilised to dissect the intricacies of
protein movement/protein-protein interactions, including where a kinetic parameter is altered for one protein and not
another. FRAP has been utilised effectively to examine the nuclear import/export kinetics of numerous proteins
including cancer regulatory proteins such as the parathyroid hormone related protein (PTHrP) signalling molecule or
pRB (retinoblastoma protein) tumour suppressor, members of the Imp family of proteins such as Imp13, and
transcription factors such as STATs (signal transducers and activators of transcription) [22-28] and the vitamin D
receptor [29]. This highlights the important role high-end CLSM imaging techniques such as FRAP will play in the
piecing together of complex protein interaction and signalling networks. In particular, FRAP can be combined with
mutagenesis and truncation analysis of the protein in question and their interacting partners to demonstrate the kinetic
effects of particular signals, phosphorylation sites etc. on protein mobility. For example, FRAP has been used to
examine STAT1 mutant derivatives with enhanced DNA-binding ability that show 10-fold reduced intranuclear
mobility in HeLa cells after stimulation with interferon-γ [30].
Microscopy: Science, Technology, Applications and Education A. Méndez-Vilas and J. Díaz (Eds.)
©FORMATEX 2010 759
______________________________________________
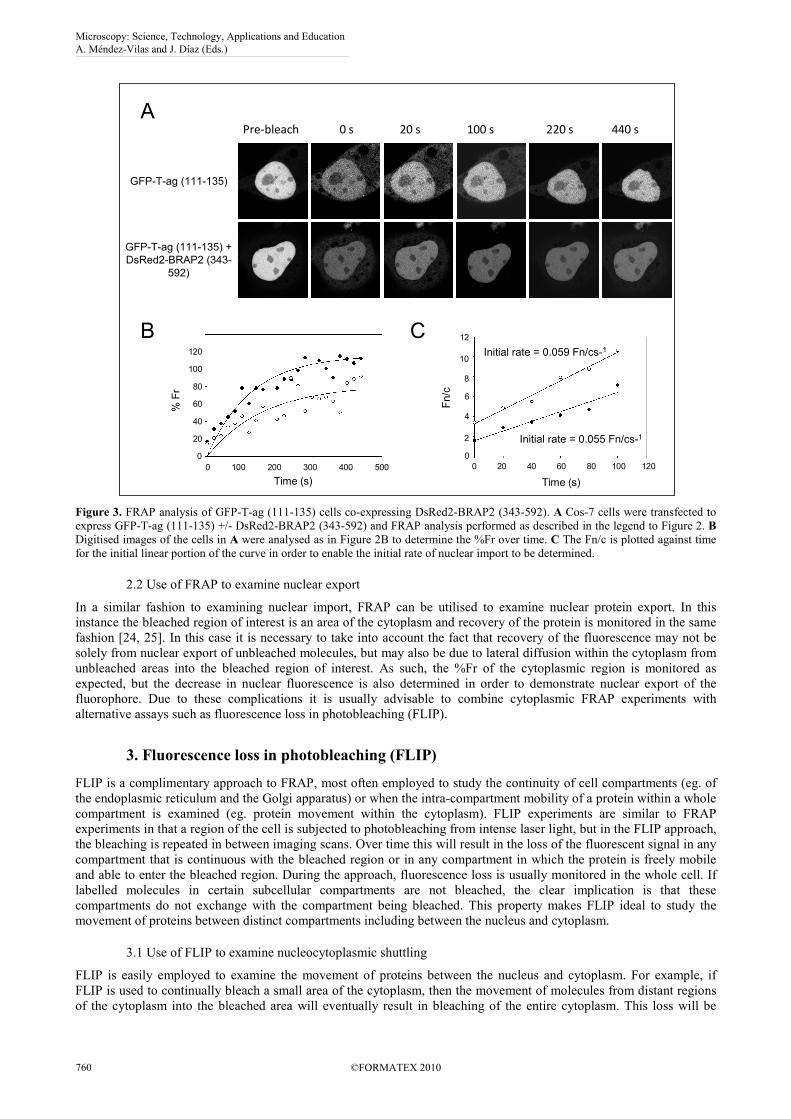
Figure 3. FRAP analysis of GFP-T-ag (111-135) cells co-expressing DsRed2-BRAP2 (343-592). A Cos-7 cells were transfected to
express GFP-T-ag (111-135) +/- DsRed2-BRAP2 (343-592) and FRAP analysis performed as described in the legend to Figure 2. B
Digitised images of the cells in A were analysed as in Figure 2B to determine the %Fr over time. C The Fn/c is plotted against time
for the initial linear portion of the curve in order to enable the initial rate of nuclear import to be determined.
2.2 Use of FRAP to examine nuclear export
In a similar fashion to examining nuclear import, FRAP can be utilised to examine nuclear protein export. In this
instance the bleached region of interest is an area of the cytoplasm and recovery of the protein is monitored in the same
fashion [24, 25]. In this case it is necessary to take into account the fact that recovery of the fluorescence may not be
solely from nuclear export of unbleached molecules, but may also be due to lateral diffusion within the cytoplasm from
unbleached areas into the bleached region of interest. As such, the %Fr of the cytoplasmic region is monitored as
expected, but the decrease in nuclear fluorescence is also determined in order to demonstrate nuclear export of the
fluorophore. Due to these complications it is usually advisable to combine cytoplasmic FRAP experiments with
alternative assays such as fluorescence loss in photobleaching (FLIP).
3. Fluorescence loss in photobleaching (FLIP)
FLIP is a complimentary approach to FRAP, most often employed to study the continuity of cell compartments (eg. of
the endoplasmic reticulum and the Golgi apparatus) or when the intra-compartment mobility of a protein within a whole
compartment is examined (eg. protein movement within the cytoplasm). FLIP experiments are similar to FRAP
experiments in that a region of the cell is subjected to photobleaching from intense laser light, but in the FLIP approach,
the bleaching is repeated in between imaging scans. Over time this will result in the loss of the fluorescent signal in any
compartment that is continuous with the bleached region or in any compartment in which the protein is freely mobile
and able to enter the bleached region. During the approach, fluorescence loss is usually monitored in the whole cell. If
labelled molecules in certain subcellular compartments are not bleached, the clear implication is that these
compartments do not exchange with the compartment being bleached. This property makes FLIP ideal to study the
movement of proteins between distinct compartments including between the nucleus and cytoplasm.
3.1 Use of FLIP to examine nucleocytoplasmic shuttling
FLIP is easily employed to examine the movement of proteins between the nucleus and cytoplasm. For example, if
FLIP is used to continually bleach a small area of the cytoplasm, then the movement of molecules from distant regions
of the cytoplasm into the bleached area will eventually result in bleaching of the entire cytoplasm. This loss will be
A Pre-bleach 0 s 20 s 100 s 220 s 440 s
GFP-T-ag (111-135)
B C
Time (s)
% F
r
0
20
40
60
80
100
120
0 100 200 300 400 500
Time (s)
Fn/c
0
4
6
12
0 20 40 60 80 120100
2
8
10
Initial rate = 0.055 Fn/cs-1
GFP-T-ag (111-135) +
DsRed2-BRAP2 (343-
592)
Initial rate = 0.059 Fn/cs-1
Microscopy: Science, Technology, Applications and Education A. Méndez-Vilas and J. Díaz (Eds.)
760 ©FORMATEX 2010
______________________________________________

relative to the mobility of the protein within the cytoplasm and will be delayed by the movement of molecules from
distant sites relative to the bleached area. In addition, if the protein in question also shuttles between the nucleus and the
cytoplasm, such as in the case of Imp13, which moves between the two compartments to perform its roles in nuclear
import of other proteins in HeLa cells, the nuclear pool of fluorescent protein will also progressively be bleached,
although usually at a different rate to the cytoplasm [27]. If the protein has a low rate of nucleocytoplasmic shuttling
and therefore does not undergo rapid nuclear export during the experimental time frame, then fluorescence in the
nuclear compartment will remain largely unaffected, such as in the case of GFP-STAT1 nucleocytoplasmic shuttling in
unstimulated NIH3T3 cells [23, 31]. There may also be a small amount of indirect fluorescence loss due to unspecific
bleaching in the unbleached compartment from repetitive scanning, however this is easily controlled for by inclusion of
an unbleached cell in the imaging area.
In a similar vein, FLIP can be applied to examine the nuclear import/export of proteins which are localised
predominantly in the cytoplasm due to strong nuclear export or rapid nucleocytoplasmic shuttling rates. In this case,
FLIP would be applied to an area of the nucleus, where by monitoring the loss of fluorescence in the cytoplasm, the
exchange of molecules between the two compartments can be monitored. In this case, the data must be corrected for
background bleaching of the cytoplasm above and below the nucleus during the procedure, although in practice this is
usually minimal, unless the cell type has a particular morphology. To determine the background level of unwanted
cytoplasmic bleaching during nuclear FLIP, nuclear FLIP can be performed on an immobile cytoplasmic protein such as
STAT1 in NIH3T3 cells in the absence of activation in response to interferon [23].
4. Use of FRAP/FLIP to monitor protein movement within membranes
Due to the continuous nature of membrane systems, the photobleaching techniques described here are particularly well
suited for examining protein lateral movement within membranes as well as between continuous membranous
structures. FLIP can be employed to examine membrane continuity where continuous photobleaching of an area of
membrane will eventually lead to a loss of fluorescence in all membranes continuous with the region, but not affect
areas not continuous with it. FLIP has been used to confirm the continuity of cellular structures such as the Golgi, the
endoplasmic reticulum, the nucleolus, and nuclear splicing factor-containing compartments [23, 32-34]. In the case of
the Golgi itself, the fluorescence of proteins localised within it that are subjected to FRAP recovers rapidly if the Golgi
is intact and the proteins are freely mobile within the Golgi membrane, but if the membrane is disrupted (eg. upon
depletion of anchoring/tethering proteins such as ZW10, which results in a cluster of distinct Golgi compartments rather
than a single continuous structure), the fluorescent recovery is minimal [35]. Finally, FRAP and FLIP may also be
useful for examining protein lateral movement/diffusion within membranes of varying compositions [36, 37].
5. Conclusions
It is clear that fluorescent microscopy approaches to examine the kinetics of protein mobility have proved most useful
in analysing protein interaction networks and signalling pathways in intact, living cells under conditions as
physiological as possible. The basic appeal of such approaches is their versatility, having application not only in
membrane trafficking and nucleocytoplasmic shuttling, but a diverse variety of proteins can and have been studied
using these approaches, including nuclear architecture-related proteins and cell-cycle regulators, as well as transcription
factors, viral proteins and membrane-associated proteins. As the approach is at the single cell level, one is able to draw
conclusions based on local variations in experimental conditions including temperature fluctuations, pH variations or
cell cycle progression or through the co-expression of interacting proteins. However, by performing the experiment on
large numbers of individual cells, effects on an entire population of cells can also be examined.
One limitation can be the need to employ proteins fused to fluorescent tags such as GFP, which has been shown in
some circumstances to affect protein function and subcellular targeting, including masking of targeting signals (eg. GFP
can mask NLS recognition by Imps) [23, 38, 39]. The recent progress in developing novel and smaller/monomeric
fluorescent tags may help alleviate this concern, but clearly, appropriate controls are required to demonstrate protein
function and hence physiological relevance of FRAP/FLIP analysis.
Finally it is worth noting that, if used appropriately, techniques such as FRAP/FLIP do not significantly interfere
with the permanent viability of the cells in the experiment, suggesting that the procedures may applicable to whole
animal/tissue applications eg. using multi-photon excitation CLSM systems [40]. Exciting new developments in the
area of microscopic resolution and live cell imaging seem likely to make FRAP/FLIP approaches even more attractive
and invaluable to cell biologists in the future
Microscopy: Science, Technology, Applications and Education A. Méndez-Vilas and J. Díaz (Eds.)
©FORMATEX 2010 761
______________________________________________

References
[1] Hearps, A.C., et al., The biarsenical dye Lumio exhibits a reduced ability to specifically detect tetracysteine-containing
proteins within live cells. Journal of Fluorescence, 2007. 17(6): p. 593-7.
[2] Poon, I.K. and D.A. Jans, Regulation of nuclear transport: central role in development and transformation? Traffic, 2005.
6(3): p. 173-86.
[3] Wagstaff, K.M. and D.A. Jans, Importins and beyond: non-conventional nuclear transport mechanisms. Traffic, 2009. 10(9):
p. 1188-98.
[4] Moseley, G.W., et al., Nucleocytoplasmic distribution of rabies virus P-protein is regulated by phosphorylation adjacent to
C-terminal nuclear import and export signals. Biochemistry, 2007. 46(43): p. 12053-61.
[5] Goldfarb, D.S., et al., Importin alpha: a multipurpose nuclear-transport receptor. Trends in Cell Biology, 2004. 14(9): p. 505-
14.
[6] Bayliss, R., A.H. Corbett, and M. Stewart, The molecular mechanism of transport of macromolecules through nuclear pore
complexes. Traffic, 2000. 1(6): p. 448-56.
[7] Bayliss, R., T. Littlewood, and M. Stewart, Structural basis for the interaction between FxFG nucleoporin repeats and
importin-beta in nuclear trafficking. Cell, 2000. 102(1): p. 99-108.
[8] Kutay, U., et al., Export of importin alpha from the nucleus is mediated by a specific nuclear transport factor. Cell, 1997.
90(6): p. 1061-71.
[9] Fischer, U., et al., The HIV-1 Rev activation domain is a nuclear export signal that accesses an export pathway used by
specific cellular RNAs. Cell, 1995. 82(3): p. 475-83.
[10] Fornerod, M., et al., CRM1 is an export receptor for leucine-rich nuclear export signals. Cell, 1997. 90(6): p. 1051-60.
[11] Fried, H. and U. Kutay, Nucleocytoplasmic transport: taking an inventory. Cell Mol Life Sci, 2003. 60(8): p. 1659-88.
[12] Kutay, U. and S. Guttinger, Leucine-rich nuclear-export signals: born to be weak. Trends in Cell Biology, 2005. 15(3): p.
121-4.
[13] Mosammaparast, N. and L.F. Pemberton, Karyopherins: from nuclear-transport mediators to nuclear-function regulators.
Trends in Cell Biology, 2004. 14(10): p. 547-56.
[14] Hubner, S., C.Y. Xiao, and D.A. Jans, The protein kinase CK2 site (Ser111/112) enhances recognition of the simian virus
40 large T-antigen nuclear localization sequence by importin. Journal of Biological Chemistry, 1997. 272(27): p. 17191-5.
[15] Kalderon, D., et al., Sequence requirements for nuclear location of simian virus 40 large-T antigen. Nature, 1984.
311(5981): p. 33-8.
[16] Kalderon, D., et al., A short amino acid sequence able to specify nuclear location. Cell, 1984. 39(3 Pt 2): p. 499-509.
[17] Wagstaff, K.M. and D.A. Jans, Nucleocytoplasmic transport of DNA: enhancing non-viral gene transfer. Biochemical
Journal, 2007. 406(2): p. 185-202.
[18] Fulcher, A.J., M.M. Dias, and D.A. Jans, Binding of p110 retinoblastoma protein inhibits nuclear import of simian virus
SV40 large tumor antigen. J Biol Chem. 285(23): p. 17744-53.
[19] Xiao, C.Y., S. Hubner, and D.A. Jans, SV40 large tumor antigen nuclear import is regulated by the double-stranded DNA-
dependent protein kinase site (serine 120) flanking the nuclear localization sequence. Journal of Biological Chemistry,
1997. 272(35): p. 22191-8.
[20] Fulcher, A.J., et al., The BRCA-1 binding protein BRAP2 is a novel, negative regulator of nuclear import of viral proteins,
dependent on phosphorylation flanking the nuclear localization signal. FASEB J. 24(5): p. 1454-66.
[21] Jans, D.A., et al., p34cdc2-mediated phosphorylation at T124 inhibits nuclear import of SV-40 T antigen proteins. J Cell
Biol, 1991. 115(5): p. 1203-12.
[22] Howell, J.L. and R. Truant, Live-cell nucleocytoplasmic protein shuttle assay utilizing laser confocal microscopy and
FRAP. Biotechniques, 2002. 32(1): p. 80-2, 84, 86-7.
[23] Koster, M., T. Frahm, and H. Hauser, Nucleocytoplasmic shuttling revealed by FRAP and FLIP technologies. Curr Opin
Biotechnol, 2005. 16(1): p. 28-34.
[24] Lam, M.H., et al., Dynamics of leptomycin B-sensitive nucleocytoplasmic flux of parathyroid hormone-related protein.
Traffic, 2001. 2(11): p. 812-9.
[25] Roth, D.M., et al., A microtubule-facilitated nuclear import pathway for cancer regulatory proteins. Traffic, 2007. 8(6): p.
673-86.
[26] Tao, T., et al., Importin 13 regulates nuclear import of the glucocorticoid receptor in airway epithelial cells. Am J Respir
Cell Mol Biol, 2006. 35(6): p. 668-80.
[27] Tao, T., et al., Nucleocytoplasmic shuttling of lgl2 is developmentally regulated in fetal lung. Am J Respir Cell Mol Biol,
2004. 30(3): p. 350-9.
[28] Roth, D.M., et al., Modulation of nucleocytoplasmic trafficking by retention in cytoplasm or nucleus. J Cell Biochem,
2009. 107(6): p. 1160-7.
[29] Sunn, K.L., et al., FRAP analysis of nucleocytoplasmic dynamics of the vitamin D receptor splice variant VDRB1:
preferential targeting to nuclear speckles. Biochem J, 2005. 388(Pt 2): p. 509-14.
[30] Meyer, T., et al., DNA binding controls inactivation and nuclear accumulation of the transcription factor Stat1. Genes Dev,
2003. 17(16): p. 1992-2005.
[31] Lillemeier, B.F., M. Koster, and I.M. Kerr, STAT1 from the cell membrane to the DNA. EMBO J, 2001. 20(10): p. 2508-
17.
[32] Cole, N.B., et al., Diffusional mobility of Golgi proteins in membranes of living cells. Science, 1996. 273(5276): p. 797-
801.
[33] Nehls, S., et al., Dynamics and retention of misfolded proteins in native ER membranes. Nat Cell Biol, 2000. 2(5): p. 288-
95.
Microscopy: Science, Technology, Applications and Education A. Méndez-Vilas and J. Díaz (Eds.)
762 ©FORMATEX 2010
______________________________________________

[34] Phair, R.D. and T. Misteli, High mobility of proteins in the mammalian cell nucleus. Nature, 2000. 404(6778): p. 604-9.
[35] Storrie, B., T. Starr, and K. Forsten-Williams, Using quantitative fluorescence microscopy to probe organelle assembly and
membrane trafficking. Methods Mol Biol, 2008. 457: p. 179-92.
[36] Kenworthy, A.K., et al., Dynamics of putative raft-associated proteins at the cell surface. J Cell Biol, 2004. 165(5): p. 735-
46.
[37] Owen, D.M., et al., Quantitative microscopy: protein dynamics and membrane organisation. Traffic, 2009. 10(8): p. 962-
71.
[38] Wagstaff, K.M., et al., Quantitative analysis of protein-protein interactions by native page/fluorimaging. Journal of
Fluorescence, 2005. 15(4): p. 469-73.
[39] Wagstaff, K.M. and D.A. Jans, Intramolecular masking of nuclear localization signals: analysis of importin binding using a
novel AlphaScreen-based method. Analytical Biochemistry, 2006. 348(1): p. 49-56.
[40] Rothstein, E.C., et al., Multi-photon excitation microscopy in intact animals. J Microsc, 2006. 222(Pt 1): p. 58-64.
Microscopy: Science, Technology, Applications and Education A. Méndez-Vilas and J. Díaz (Eds.)
©FORMATEX 2010 763
______________________________________________