use of energy in egypt, past and recent - united nations · available on energy production and...
TRANSCRIPT

Use of Energy in Egypt, Past and Recent
May 2014
Eng. Tawfik F. Azer
Energy Consultant
9th Oslo Group Meeting Abu Dhabi, UAE

INTRODUCTION Energy statistics is a crucial tool to analyse the energy
situation in order to provide the necessary vital
information for policy makers, planners and researchers.
A reliable energy statistics is really needed as energy plays
a critical role in the social and economic development.
This presentation demonstrates the latest historical data
available on energy production and energy use in Egypt.
The recent energy situation is also highlighted through
energy production and consumption patterns as well as
energy balance and energy flow.
The presentation tackles the primary and secondary
energy production in addition to the energy use of all
energy fuels and every economic sector. The major
industry subsectors electricity consumption has also been
included.

1. Evolution of Primary Energy
Production 1.1 PETROLEUM Petroleum production means the domestic production of
crude oil, condensates and associated LPG.
Crude oil production has reduced by 1% yearly.
Its production decreased from 32.3 MT in 2000/2001 to
28.7 MT in 2011/2012.
This deterioration has been partially compensated by the
increase of the condensates production.
Condensates production increased from 3.26 MT in
2000/2001 to 4.7 MT in 2011/2012, 3.1% per annum.
The production of LPG from fields has enhanced yearly
by only 1.7%. Its production increased from 1.204 MT in
2000/2001 to 1.475 MT in 2011/2012.

32.27630.939 30.706 30.431
29.040
27.01725.934 26.354
28.140 27.60028.280 28.700
3.2633.873 3.960 3.381 3.150
4.0304.876 5.242 5.148 5.087 5.028 4.688
1.204 1.161 1.154 1.097 1.173 1.169 1.173 1.317 1.430 1.300 1.374 1.475
0.000
5.000
10.000
15.000
20.000
25.000
30.000
35.000M
illi
on
To
n
Fig. 1.1: Petroleum Primary Production (2000/2001-2011/2012)
Crude
Condensates
LPG

1.2 NATURAL GAS
Production of natural gas in Egypt has
jumped from 18.4 MT in 2000/20001 to 46.1
MT in 2011/2012.
This evolution by an average annual
growth rate of about 8% reflects the high
growth of reserves and discoveries.

18.419.5
21.3
23.625.5
38.4
41.342.9
45.846.7 46.4 46.1
0.0
5.0
10.0
15.0
20.0
25.0
30.0
35.0
40.0
45.0
50.0
Mil
lio
n T
on
Fig. 1.2: Natural Gas Primary Production (2000/2001-2011/2012)

1.3 HYDROPOWER
The hydropower production is estimated to be 2.997 MTOE in
2000/2001 and 2.962 MTOE in 2011/2012.
Most of the available hydropower energy resources in Egypt
were exploited, the share of hydropower in the primary energy
production is limited 3.3%.
2.997
3.277
2.821 2.8632.781 2.731 2.778
3.334
3.156
2.760 2.715
2.962
0
0.5
1
1.5
2
2.5
3
3.5
4
MTO
E
Fig. 1.3: Hydropower Primary Production (2000/2001-2011/2012)

1.4 RENEWABLES
The share of renewables in the total primary energy production
has increased by 10 times during the last 12 years. However, it
still represents only 0.5% of the primary production.
The renewable production is about 0.03 MTOE in 2000/2001
and 0.408 MTOE in 2011/2012.
0.0300.048 0.045
0.081
0.115 0.1190.132
0.179
0.200
0.243
0.355
0.408
0.000
0.050
0.100
0.150
0.200
0.250
0.300
0.350
0.400
0.450
MTO
E
Fig. 1.4: Renewables Primary Production (2000/2001-2011/2012)

1.5 TOTAL PRIMARY ENERGY
PRODUCTION The total primary energy production (petroleum, natural gas,
hydropower and renewables) was about 60.5 MTOE in
2000/2001, increased to 90 MTOE in 2011/2012. It encounters
an average annual growth rate of approximately 3.4%.
0
10
20
30
40
50
60
70
80
90
100
MTO
E
Fig. 1.5: Total Primary Energy Production (2000/2001-2011/2012)
Petroleum Natural Gas Hydropower Renewables

1.5 TOTAL PRIMARY ENERGY
PRODUCTION (cont.)
Natural gas becomes the major energy source in Egypt. Its
production represents 57% of the total production. Petroleum
comes second 39%, hydropower 3% and finally renewables 0.5%.
Petroleum35.387
39%
Natural Gas51.217
57%
Hydropower2.962
3%
Renewables0.408
1%
Fig. 1.6: Primary Energy Production Pattern (2011/2012)
Unit: MTOE
Total: 89.973 MTOE

2. Evolution of Secondary Energy
Production
Oil throughput in the Egyptian refineries
amounts for 26.9 MT in 2011/2012.
Total production of petroleum products
increased from 24.9 MT in 2000/2001 to
25.9 MT in 2011/2012.
2.1 PETROLEUM PRODUCTS


2.2 ELECTRICITY
Electricity generation increased from 78.1 TWh in 2000/2001 to 156.6 TWh in 2011/2012 (6% yearly).
Electricity generated by thermal power stations amplified from about 64.3 TWh in 2000/2001 to 141.7 TWh in 2010/2011.
Electricity generated from hydropower is slightly decreased from 13.7 TWh to 12.9 TWh.
In addition to 0.137 TWh generated by renewables in 2000/2001 boosted to 1.958 TWh in 2011/2012.

0
20
40
60
80
100
120
140
160
TW
h
Fig. 2.2: Electricity Generation(2000/2001-2011/2012)
Thermal Hydropower Renewables

Thermal141.694
91%
Hydropower12.934
8%
Renewables1.958
1%
Fig. 2.3: Electricity Generation Pattern (2011/2012)
Unit: TWh
Total 156.586 TWh

3. Evolution of Energy Use
Petroleum products use has increased by about 3% per year.
The total consumption increased from 22.8 MT in 2000/2001 to 32.5 MT in 2011/2012.
Out of the total consumption in 2011/2012, there is 8.6 MT imported.
On the other side, the country exported 3.25 MT of different petroleum products.
3.1 PETROLEUM PRODUCTS

0.000
2.000
4.000
6.000
8.000
10.000
12.000
14.000
Mil
lio
n T
on
Fig. 3.1: Petroleum Products Consumption(2000/2001-2011/2012)
LPG
Gasoline
Turbine
Kerosene
Gas Oil / Diesel
Fuel Oil
Others

3.1 PETROLEUM PRODUCTS (cont.)
The consumption of gasoline has increased
by 7.6%/year.
LPG and gas oil increased by 4.7% and
4.1% respectively.
The use of kerosene is vanishing because of
the near saturation of the LPG or natural
gas cookers.

7.085
7.666
7.830 7.842 7.853 7.874
7.546
7.764
7.572
7.993
7.600
6.816
6.200
6.400
6.600
6.800
7.000
7.200
7.400
7.600
7.800
8.000
8.200
Mil
lio
n T
on
Fig. 3.2: Industry Petroleum Products Consumption(2000/2001-2011/2012)

0.122 0.111 0.111 0.108
1.6021.653
1.729
1.8791.956
2.059 2.099 2.140
0.000
0.500
1.000
1.500
2.000
2.500
Mil
lio
n T
on
Fig. 3.3: Agriculture Petroleum Products Consumption(2000/2001-2011/2012)

5.8125.655
5.8116.101
5.730 5.7165.927
6.449
6.8387.181 7.217 7.144
0.000
1.000
2.000
3.000
4.000
5.000
6.000
7.000
8.000M
illi
on
To
n
Fig. 3.4: Residential and CommercialPetroleum Products Consumption
(2000/2001-2011/2012)

6.774 6.591 6.7737.111
6.6777.050
7.501
8.413
9.052
9.80510.082
11.096
0.000
2.000
4.000
6.000
8.000
10.000
12.000
Mil
lio
n T
on
Fig. 3.5: Transport Petroleum Products Consumption(2000/2001-2011/2012)

2.040
1.5391.713
1.455
4.0443.785
4.354
4.686
5.303
5.813
5.321
4.627
0.000
1.000
2.000
3.000
4.000
5.000
6.000
7.000M
illi
on
To
n
Fig. 3.6: Petroleum Products Consumptionin Electricity Sector
(2000/2001-2011/2012)

0.961
0.6980.722
0.516
0.586 0.599 0.6050.652 0.662
0.718 0.704 0.704
0.000
0.200
0.400
0.600
0.800
1.000
1.200M
illi
on
To
n
Fig. 3.7: Petroleum Products Consumptionin Petroleum Sector
(2000/2001-2011/2012)

3.2 NATURAL GAS
The use of the natural gas has increased by
about 7% per annum.
The total consumption increased from
22.65 BCM 2000/2001 to 51.8 BCM in
2011/2012.

22562
25228
28123
30839 30825
34865
3736139603
4152843878
46890
51829
0
10000
20000
30000
40000
50000
60000
MC
M
Fig. 3.8: Natural Gas Total Consumption (2000/2001-2011/2012)

0
10000
20000
30000
40000
50000
60000
MC
M
Fig. 3.9: Natural Gas Sectoral Consumption (2000/2001-2011/2012)
Industry Res. & Comm. Transport Electricity Petroleum

58116375
6916
75928223
8852
10415
11375
12092
13222
13941 13994
0
2000
4000
6000
8000
10000
12000
14000
16000
MC
M
Fig. 3.10: Natural Gas Consumption in Industry (2000/2001-2011/2012)

417
499 514 526
588626 644
833
963986
10461082
0
200
400
600
800
1000
1200
MC
M
Fig. 3.11: Natural Gas Consumption in Resdintial and Commercial (2000/2001-2011/2012)

136
185
239
267
296305
336356
408
440457
473
0
50
100
150
200
250
300
350
400
450
500
MC
M
Fig. 3.12: Natural Gas Consumption in Transport (2000/2001-2011/2012)
1408915408
17491
1937618422
20775 2091421975
2309124519
26014
30061
0
5000
10000
15000
20000
25000
30000
35000
MC
M
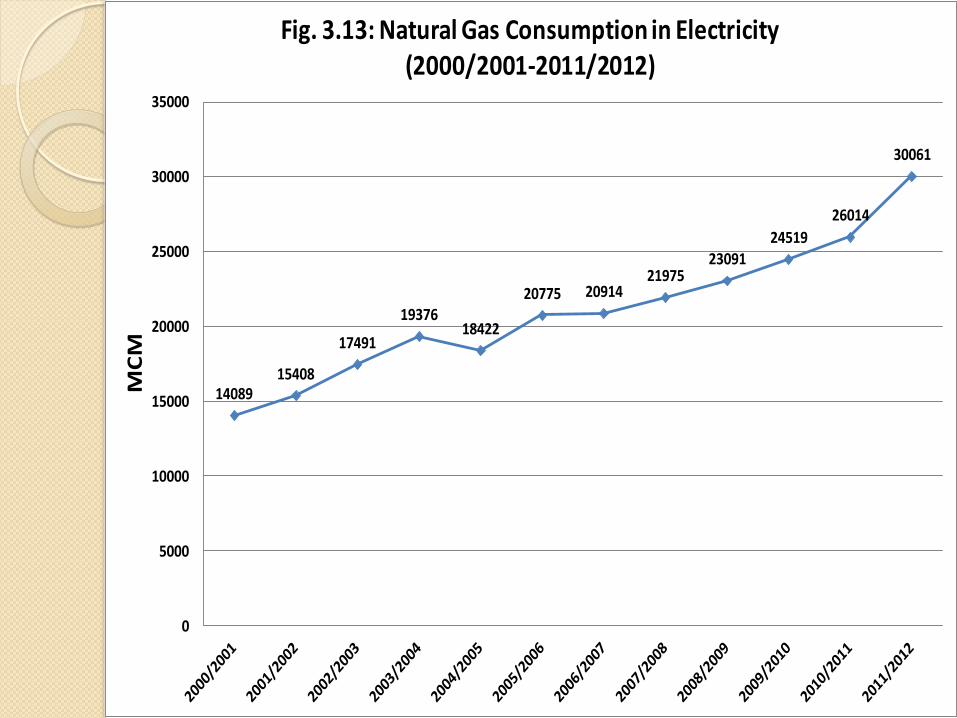
Fig. 3.13: Natural Gas Consumption in Electricity (2000/2001-2011/2012)

2109
27612963 3077
3297
4307
5052 5065 49754710
5432
6219
0
1000
2000
3000
4000
5000
6000
7000
MC
M
Fig. 3.14: Natural Gas Consumption in Petroleum Sector (2000/2001-2011/2012)

3.3 ELECTRICITY Electricity total consumption has increased from
about 64 TWh in 2000/2001 to 134 TWh in
2011/2012, having an average annual
growth rate of 6.3 per cent.
64.33069.166
74.12079.642
85.088
92.08598.443
106.595111.714
118.903125.159
133.969
0
20
40
60
80
100
120
140
160
TWh
Fig. 3.15: Electricity Total Consumption (2000/2001-2011/2012)

0
20
40
60
80
100
120
140
160
TW
h
Fig. 3.16: Electricity Sectoral Consumption (2000/2001-2011/2012)
Industry Agriculture Residential Commercial Gov./Utilities

24.18825.402
26.52528.386
30.284
32.701
34.569
37.045 37.27338.916
40.70242.098
0.000
5.000
10.000
15.000
20.000
25.000
30.000
35.000
40.000
45.000
TW
h
Fig. 3.17: Electricity Consumption in Industry (2000/2001-2011/2012)

The table shows the electricity consumption of the
major industry subsectors along with their shares of
the industry sector total electricity consumption,
assuming the same pattern as 2010/2011. Those
seven major consumer subsectors represent more
than 71% of the sectors total consumption.
Subsector GWh Share
Iron & Steel 8604.79 20.44%
Cement 6702.25 15.92%
Aluminium 6123.87 14.55%
Food 2998.10 7.12%
Textile 2383.34 5.66%
Fertilizers 1590.27 3.78%
Rubber 1529.97 3.63%

2.5422.733
2.991
3.2803.460
3.719 3.789
4.209
4.6174.834 4.927
5.560
0.000
1.000
2.000
3.000
4.000
5.000
6.000
TW
h
Fig. 3.18: Electricity Consumption in Agriculture (2000/2001-2011/2012)

23.67325.752
27.71729.823
31.311
33.900
36.596
40.271
43.811
47.431
51.370
56.664
0.000
10.000
20.000
30.000
40.000
50.000
60.000
TW
h
Fig. 3.19: Electricity Consumption in the Residential Sector(2000/2001-2011/2012)

3.9893.733
4.256
4.801
5.393
6.016
7.046
8.240
8.754
9.674
10.23810.715
0.000
2.000
4.000
6.000
8.000
10.000
12.000
TW
h
Fig. 3.20: Electricity Consumption in the Commercial Sector(2000/2001-2011/2012)

9.938
11.546
12.63113.352
14.640
15.74916.443
16.83017.259
18.048 17.922
18.932
0.000
2.000
4.000
6.000
8.000
10.000
12.000
14.000
16.000
18.000
20.000T
Wh
Fig. 3.21: Electricity Consumption in the Governmentand Utilities Sector
(2000/2001-2011/2012)

3.4 TOTAL ENERGY The total final energy consumption was
34.4 MTOE in 2000/2001 increased to 59.5
MTOE in 2011/2012 (growth rate of 4.7%).
0
10
20
30
40
50
60
70
MTO
E
Fig. 3.22: Total Final Energy Consumption (2000/2001 - 2011/2012)
Petrpleum Products Natural Gas Electricity
2.7%.
8.2%
6.3%
Growth rate

Petrpleum Products
21.75763.3%
Natural Gas7.07820.6%
Electricity5.53116.1%
Fig. 3.23: Total Final Energy Consumption Pattern (2000/2001)
Unit: MTOE
Total 34.366 MTOE
Petrpleum Products
29.78650.1%
Natural Gas18.18430.6%
Electricity11.51919.4%
Fig. 3.24: Total Final Energy Consumption Pattern (2011/2012)
Unit: MTOE
Total 59.489 MTOE
The share of petroleum products in the total
final energy consumption is 63.3% in
2000/2001 and 50% in 2011/2012. Natural gas
share raised from 20.6% to 30.6%. Electricity
share changed from 16.1% to 19.4%

Industry14.01340.8%
Agriculture0.3461.0%
Res. & Comm.9.08326.4%
Transport7.32821.3%
Others3.59510.5%
Fig. 3.26: Sectoral Final Energy Consumption Pattern (2000/2001)
Unit: MTOE
Total 34.366 MTOE
Share of each economic sector in the total
final consumption in 2000/2001 and
2011/2012.
Industry22.26137.4%
Agriculture2.7554.6%
Res. & Comm.14.56724.5%
Transport12.34520.8%
Others7.56112.7%
Fig. 3.27: Sectoral Final Energy Consumption Pattern (2011/2012)
Unit: MTOETotal 59.489 MTOE

14.013
15.20115.916
16.77217.366
18.140
19.297
20.52120.964
22.477 22.85322.261
0.000
5.000
10.000
15.000
20.000
25.000
MT
OE
Fig. 3.25: Industry Final Energy Consumption(2000/2001 - 2011/2012)

0.346 0.350 0.372 0.393
2.0012.078
2.164
2.3592.477
2.606 2.6562.755
0.000
0.500
1.000
1.500
2.000
2.500
3.000
MT
OE
Fig. 3.28: Agriculture Final Energy Consumption(2000/2001 - 2011/2012)

9.083 9.1569.553
10.062 9.95310.251
10.820
11.973
12.863
13.64914.124
14.567
0.000
2.000
4.000
6.000
8.000
10.000
12.000
14.000
16.000
MT
OE
Fig. 3.29: Residential and Commercial Final Energy Consumption(2000/2001 - 2011/2012)

7.328 7.1967.435
7.7657.403
7.8188.345
9.351
10.098
10.94711.269
12.345
0.000
2.000
4.000
6.000
8.000
10.000
12.000
14.000
MT
OE
Fig. 3.30: Transport Final Energy Consumption(2000/2001 - 2011/2012)

Crude Oil & NGLPetroleum
ProductsNatural Gas Hydropower Renewables Total
33.728 1.659 51.217 2.962 0.408 89.974
2.115 9.335
5.631 3.435 7.464
0.258
0.050 -0.077
Refinery 26.476 33.728 0.458
26.911
34.289 43.295 2.962 0.408 89.974
4.503 25.111 2.962 0.408 32.984
Petroleum
ProductsNatural Gas Electricity Total
6.952 11.690 3.620 22.261
2.277 0.478 2.755
7.870 0.904 5.794 14.567
11.950 0.395 12.345
0.738 5.195 1.628 7.561
29.786 18.184 11.519 59.489Total Final Consumption
Final Consumption
Industry
Agriculture
Residential/Commercial
Transport
Others
Supply
Production
Imports
Exports
International Marine Bunkers
Stock Changes
- Input
- Output
Statistica Difference
Total Supply
Input to Electricity Production
4. Energy Balance

4. Energy Flow

Thank
You