use of cfd technology in hydraulics system design … · hydraulics technology is most preferred...
TRANSCRIPT

Abstract—Hydraulics technology is most preferred for
off-highway equipment due to its high power density. Pumps,
motors, valves, cylinders and hoses constitute a typical hydraulic
machinery. Design of these parts will decide efficiency,
reliability and power density of the system and the entire
equipment itself. To meet these requirements, there is a
paradigm shift towards the use of computational fluid dynamics
(CFD) technology to design these products. CFD is used to
simulate actual behavior of the fluid system, identify the critical
areas of concern, evaluate various design alternatives and
develop an optimized solution. The paper highlights CFD
modeling approach with simulation challenges for pumps,
motors and valves to predict pressure losses, fill speed and
cavitation. Validation of CFD results with test data for key
performance parameters is highlighted. This simulation
methodology not only saves design and prototype building cost
but also more importantly accelerates design cycle and improves
speed to market. Thus, it has emerged as an integrated part of
the design process.
Index Terms—Cavitation, CFD, fill speed, multiphase,
motors, pressure drop, pumps, valves.
I. INTRODUCTION
A hydraulic system for off-highway comprises three major
elements: hydraulic power generator such as pumps;
transmitters and controllers such as hoses and control valves;
and actuators such as motors and cylinders. The successful
operation of any hydraulic system requires desired
performance of all three elements. Therefore, it is important
to understand the flow behavior in order to design the
components and hence the system. Current industrial trend is
towards the use of simulation technology (CFD) for detail
investigation of flow physics and performance prediction. In
this paper, three case studies are presented where the use of
simulation is made to predict the performance. In first case,
CFD simulation of a piston pump is elaborated for fill-speed
and cavitation predictions. In second case, a hydraulic control
valve is described for pressure override prediction.
Performance prediction of a GerolerTM
motor is discussed in
third case.
II. CASE STUDY — AXIAL PISTON PUMP
In hydraulic systems, axial piston pumps are used to deliver
variable flow rate at required pressure. Fig. 1 shows typical
piston pump architecture. Fill speed and cavitation are two
Manuscript received May 12, 2015; revised July 16, 2015.
The authors are with the Eaton Technologies Pvt. Ltd., Pune, 411014,
India (e-mail: [email protected], [email protected],
important performance characteristics for piston pump. Fill
speed is the measure of filling capability of suction chambers
of the pump which determines maximum speed rating of the
pump. It is the critical speed after which flow rate starts
deviating from linearity with increase in speed, as shown in
Fig. 2 [1]. If pump operates beyond its fill speed, cavitation
will occur which will degrade the performance and reduces
life of the pump. Fig. 1 shows the general flow passage of the
piston pump and typical cavitation damage on valve plate.
Prediction of fill speed and cavitation requires simulation of
multiphase flow and cavitation physics along with modeling
of complex pump dynamics. Multiphase modeling with pump
dynamics poses challenges in handling numerical instabilities
and convergence difficulties. This section explains modeling
methodology regarding the simulation of piston pump.
Fig. 1. Typical piston pump flow passage.
Fig. 2. Fill speed characteristics [1].
A. Mathematical Background
A two-phase cavitation model [2] is used to model the flow
features along with a conventional k-ε turbulence model. The
liquid-vapor mass transfer is governed by the vapor transport
equation:
cevvv RRVt
(1)
where, v is the vapor phase, is the vapor volume fraction, v
Use of CFD Technology in Hydraulics System Design for
off-Highway Equipment and Applications
Shivayogi S. Salutagi, Milind S. Kulkarni, and Aniruddha Kulkarni
International Journal of Materials, Mechanics and Manufacturing, Vol. 4, No. 1, February 2016
52DOI: 10.7763/IJMMM.2016.V4.224

is vapor density, Vv is the vapor phase velocity and, Re and Rc
are mass transfer source terms connected to the growth and
collapse of the vapor bubbles respectively. The net phase
change rate or mass transfer rate uses the following two-phase
continuity equations.
Liquid phase: RVt
ll
11 (2)
Vapor phase: RVt
vv
(3)
Mixture: 0
Vt
(4)
where, l is liquid phase, where, l is liquid density, is
mixture density, and R is the net mass source term is given as:
Dt
DR lv
Mixture density () is defined as:
lv 1 (5)
Combining equations (3), (4) and (5) yields a relationship
between the mixture density and vapor volume fraction:
Dt
D
Dt
Dvl
(6)
The vapor volume fraction can be co-related from bubble
number density and radius of bubble:
3
3
3
41
3
4
Bb
Bb
Rn
Rn
(7)
From above equations, net mass transfer rate (R) is derived
which is given below:
l
v
B
lv PP
RR
3
231 , 3
1
1
4
3
1
nRB
(8)
where, RB is bubble radius, Pv is vapor pressure, and P is local
pressure. The final form of above equation for modeling
evaporation and condensation process is as follows:
When P Pv, there will be an evaporation (i.e. vapor
generation) which is modelled as:
l
v
B
lve
PP
RR
3
231 (9)
When P Pv, there will be condensation (i.e. vapor
collapse) which is modelled as:
l
v
B
lvc
PP
RR
3
231 (10)
B. CFD Flow Domain and Mesh
Typical flow domain consists of suction and delivery
kidney ports, valve plate and all nine piston chambers as
shown in Fig. 3. Hexahedral mesh is created separately for
each stationary and rotating components using ICEM CFD
15.0. Interface technique is used to connect multiple zones.
Snap shots of a typical mesh of different parts are shown in
Fig. 4. Total mesh count is ~10 lakh elements.
Fig. 3. Flow domain for piston pump.
Fig. 4. Grid in the flow domain.
C. CFD Modeling Approach
1) Modeling piston pump dynamics
The cross sectional view of a typical piston pump [3] is
shown in Fig. 5. Standard layering technique of dynamic
deforming mesh is used to model the intake and delivery
strokes of all nine pistons through user defined function (UDF)
using the below equation.
Piston displacement, x = r×tan( ) × sin(n ) (11)
where, r is the piston pitch radius, is the swash-plate angle
and n is the angular position of nth
piston.
2) Boundary conditions and fluid properties
The pressure boundary condition is applied at inlet and
outlet. Angular speed is defined at all piston zones for
rotational motion. Fluid properties (density, viscosity, bulk
modulus, and vapor pressure) of mineral oil are used for the
simulations.
3) Numerical models
Cavitation model with two-phase flow is used with k-ε
turbulence model. Schnerr-Sauer model [4] is used to
simulate cavitation phenomena for predicting filling
capability of suctions chambers of pump. Further advances in
the field of cavitation energy release model [5] are in
progress.
International Journal of Materials, Mechanics and Manufacturing, Vol. 4, No. 1, February 2016
53
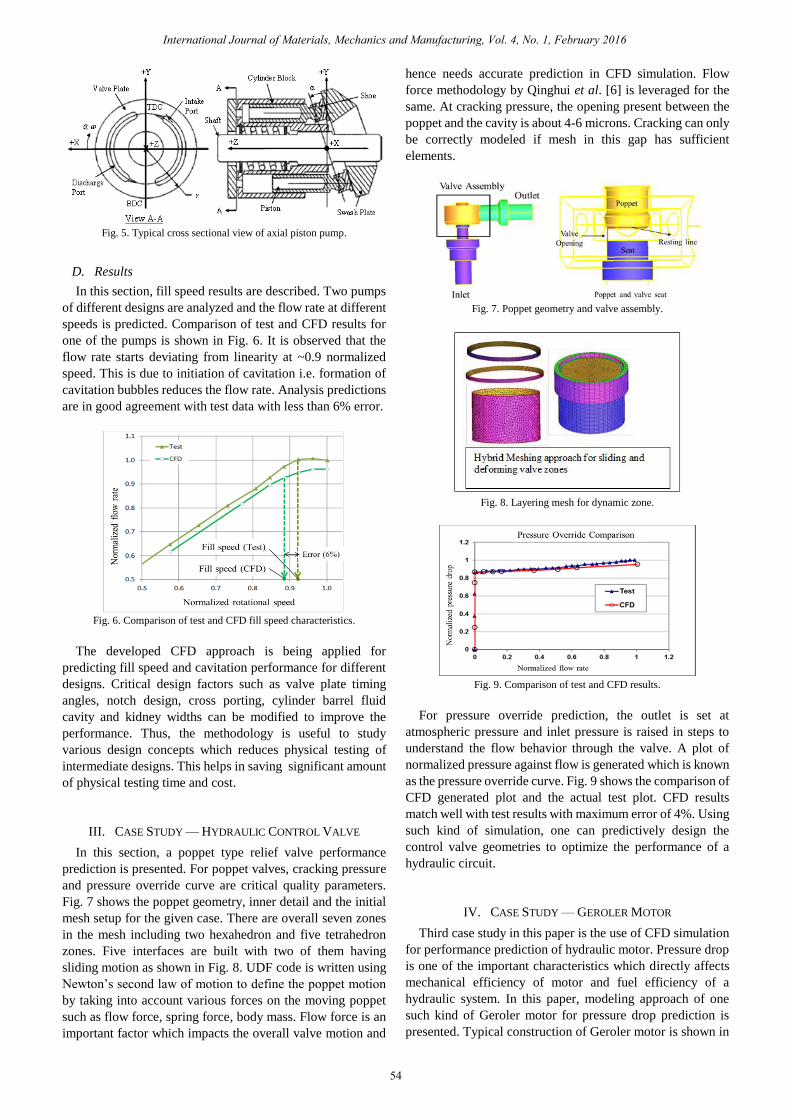
Fig. 5. Typical cross sectional view of axial piston pump.
D. Results
In this section, fill speed results are described. Two pumps
of different designs are analyzed and the flow rate at different
speeds is predicted. Comparison of test and CFD results for
one of the pumps is shown in Fig. 6. It is observed that the
flow rate starts deviating from linearity at ~0.9 normalized
speed. This is due to initiation of cavitation i.e. formation of
cavitation bubbles reduces the flow rate. Analysis predictions
are in good agreement with test data with less than 6% error.
Fig. 6. Comparison of test and CFD fill speed characteristics.
The developed CFD approach is being applied for
predicting fill speed and cavitation performance for different
designs. Critical design factors such as valve plate timing
angles, notch design, cross porting, cylinder barrel fluid
cavity and kidney widths can be modified to improve the
performance. Thus, the methodology is useful to study
various design concepts which reduces physical testing of
intermediate designs. This helps in saving significant amount
of physical testing time and cost.
III. CASE STUDY — HYDRAULIC CONTROL VALVE
In this section, a poppet type relief valve performance
prediction is presented. For poppet valves, cracking pressure
and pressure override curve are critical quality parameters.
Fig. 7 shows the poppet geometry, inner detail and the initial
mesh setup for the given case. There are overall seven zones
in the mesh including two hexahedron and five tetrahedron
zones. Five interfaces are built with two of them having
sliding motion as shown in Fig. 8. UDF code is written using
Newton’s second law of motion to define the poppet motion
by taking into account various forces on the moving poppet
such as flow force, spring force, body mass. Flow force is an
important factor which impacts the overall valve motion and
hence needs accurate prediction in CFD simulation. Flow
force methodology by Qinghui et al. [6] is leveraged for the
same. At cracking pressure, the opening present between the
poppet and the cavity is about 4-6 microns. Cracking can only
be correctly modeled if mesh in this gap has sufficient
elements.
Fig. 7. Poppet geometry and valve assembly.
Fig. 8. Layering mesh for dynamic zone.
Fig. 9. Comparison of test and CFD results.
For pressure override prediction, the outlet is set at
atmospheric pressure and inlet pressure is raised in steps to
understand the flow behavior through the valve. A plot of
normalized pressure against flow is generated which is known
as the pressure override curve. Fig. 9 shows the comparison of
CFD generated plot and the actual test plot. CFD results
match well with test results with maximum error of 4%. Using
such kind of simulation, one can predictively design the
control valve geometries to optimize the performance of a
hydraulic circuit.
IV. CASE STUDY — GEROLER MOTOR
Third case study in this paper is the use of CFD simulation
for performance prediction of hydraulic motor. Pressure drop
is one of the important characteristics which directly affects
mechanical efficiency of motor and fuel efficiency of a
hydraulic system. In this paper, modeling approach of one
such kind of Geroler motor for pressure drop prediction is
presented. Typical construction of Geroler motor is shown in
International Journal of Materials, Mechanics and Manufacturing, Vol. 4, No. 1, February 2016
54

Fig. 10. The challenge in accurately predicting the pressure
drop is to understand the motor dynamics and fluid cavity in
different areas such as housing, valve plate orifices, Geroler
pocket openings, etc. This decides selection of appropriate
computational domain. Modeling variable fluid volume
between star and rollers needs deforming zone technique
which is complex and time consuming. Computational
domain is appropriately selected at three different orientations
in order to capture the least and maximum pressure drop
without modeling Geroler pocket areas. Steady state
simulation for three different orientations is performed and
average pressure drop is reported. Fig. 11 shows comparison
of CFD predictions and actual test observations. The results
are in good agreement with test data with less than 5% error
for all the flow rates. The validated methodology is being
applied to study the effect of valve plate orifices, housing
fluid cavities, Geroler pocket areas, etc. to optimize the
design
Fig. 10. Typical construction of Geroler motor.
Fig. 11. Pressure drop — CFD vs. Test.
V. SUMMARY
Three case studies of CFD applications for hydraulic
system design are described in this paper. In first case, CFD
modeling approach for transient dynamic simulation for
piston pump with multiphase physics is discussed to predict
fill speed characteristics. Fill speed is one of the critical
performance parameters for pump design qualification as it
decides the maximum speed rating of the pump. CFD
predictions are compared with test data for one of the pumps
with less than 6% error. Similarly, the pressure override and
pressure drop are important performance parameters for
control valve and Geroler motor respectively. In second and
third cases, simulation of control valve and Geroler motor is
presented. CFD results for both the cases are in close
agreement with test data with less than 5% error.
The validated CFD models are being applied for different
designs to simulate the actual behavior of the fluid system,
evaluate various design alternatives and develop optimized
solution. CFD analysis not only saves the design and
prototype building cost, but also more importantly accelerates
the design cycle and improves speed to market. Thus, it has
emerged as an integrated part of the design process.
REFERENCES
[1] S. Salutagi, M. Kulkarni, N. Gandhi, and R. Vale, “Numerical
modeling to predict fill speed characteristics,” presented at the
NAFEMS World Congress, May 23-26, 2011, Boston, USA.
[2] ANSYS FLUENT 15.0 Theory Guide — Cavitation Models.
[3] N. Manring and Y. Zhang, “The improved volumetric efficiency of an
axial piston pump utilizing a trapped volume design,” Journal of
Dynamic Systems, Measurement & Control, vol. 123, pp. 479-487,
September 2001.
[4] A. Singhal, M. Athavale, H. Y. Li, and J. Yu, “Mathematical basis and
validation of the full cavitation model,” Journal of Fluids Engineering,
vol. 124, pp. 617-624, September 2002.
[5] A. Kulkarni, M. Kulkarni, and S. Salutagi, “Numerical modelling of
cavitation using energy approach,” in Proc. the International
Conference on Heat Transfer and Fluid Flow, August 11-12, 2014,
Prague, Czech Republic.
[6] Y. Qinghui, S. Singh, A. Kulkarni, M. Kulkarni, P. Navale, and R.
Navale, “Flow forces investigation through computational fluid
dynamics and experimental study,” in Proc. 9th International Fluid
Power Conf., March 24-26, 2014, AACHEN University, Germany.
Shivayogi S. Salutagi received his B.E. degree in
mechanical engineering from Shivaji University,
Kolhapur, India in 2002. He completed his
post-graduation in fluids & thermal engineering from
Walchand college of engineering, Sangli, Shivaji
University, Kolhapur, India in 2005.
He joined Ashok Leyland, Chennai, India as a CFD
engineer after his post-graduation and worked on CFD
analysis projects for automotive applications till 2008.
Then he joined Eaton India, Pune and currently he is working as the lead
engineer (CFD) for hydraulics and aerospace products. His major areas of
interest are cavitation, multiphase flow, conjugate heat transfer and dynamic
mesh modeling.
Mr. Shivayogi Salutagi is a member of SAE. He has published several
technical papers in multiple internationals conferences. He also guided 3
post-graduation student projects.
International Journal of Materials, Mechanics and Manufacturing, Vol. 4, No. 1, February 2016
55