use of biocementation for slope stabilization of levees ...earthen levees by strengthening the soil...
TRANSCRIPT

Use of Biocementation for Slope Stabilization of LeveesFinal ReportNovember 2018
Sponsored byMidwest Transportation Center
U.S. Department of Transportation Office of the Assistant Secretary for Research and Technology

About MTCThe Midwest Transportation Center (MTC) is a regional University Transportation Center (UTC) sponsored by the U.S. Department of Transportation Office of the Assistant Secretary for Research and Technology (USDOT/OST-R). The mission of the UTC program is to advance U.S. technology and expertise in the many disciplines comprising transportation through the mechanisms of education, research, and technology transfer at university-based centers of excellence. Iowa State University, through its Institute for Transportation (InTrans), is the MTC lead institution.
About InTransThe mission of the Institute for Transportation (InTrans) at Iowa State University is to develop and implement innovative methods, materials, and technologies for improving transportation efficiency, safety, reliability, and sustainability while improving the learning environment of students, faculty, and staff in transportation-related fields.
ISU Non-Discrimination Statement Iowa State University does not discriminate on the basis of race, color, age, ethnicity, religion, national origin, pregnancy, sexual orientation, gender identity, genetic information, sex, marital status, disability, or status as a U.S. veteran. Inquiries regarding non-discrimination policies may be directed to Office of Equal Opportunity, 3410 Beardshear Hall, 515 Morrill Road, Ames, Iowa 50011, Tel. 515-294-7612, Hotline: 515-294-1222, email [email protected].
NoticeThe contents of this report reflect the views of the authors, who are responsible for the facts and the accuracy of the information presented herein. The opinions, findings and conclusions expressed in this publication are those of the authors and not necessarily those of the sponsors.
This document is disseminated under the sponsorship of the U.S. DOT UTC program in the interest of information exchange. The U.S. Government assumes no liability for the use of the information contained in this document. This report does not constitute a standard, specification, or regulation.
The U.S. Government does not endorse products or manufacturers. If trademarks or manufacturers’ names appear in this report, it is only because they are considered essential to the objective of the document.
Quality Assurance StatementThe Federal Highway Administration (FHWA) provides high-quality information to serve Government, industry, and the public in a manner that promotes public understanding. Standards and policies are used to ensure and maximize the quality, objectivity, utility, and integrity of its information. The FHWA periodically reviews quality issues and adjusts its programs and processes to ensure continuous quality improvement.

Technical Report Documentation Page
1. Report No. 2. Government Accession No. 3. Recipient’s Catalog No.
4. Title and Subtitle 5. Report Date
Use of Biocementation for Slope Stabilization of Levees November 2018
6. Performing Organization Code
7. Author(s) 8. Performing Organization Report No.
Xinyi Jiang, Cassandra Rutherford, Kaoru Ikuma, Bora Cetin
9. Performing Organization Name and Address 10. Work Unit No. (TRAIS)
Civil, Construction, and Environmental Engineering
Iowa State University
Town Engineering Building, 813 Bissell Rd
Ames, IA 50010-8664
11. Contract or Grant No.
Part of DTRT13-G-UTC37
12. Sponsoring Organization Name and Address 13. Type of Report and Period Covered
Midwest Transportation Center
2711 S. Loop Drive, Suite 4700
Ames, IA 50010-8664
U.S. Department of Transportation
Office of the Assistant Secretary for
Research and Technology
1200 New Jersey Avenue, SE
Washington, DC 20590
Final Report
14. Sponsoring Agency Code
15. Supplementary Notes
Visit www.intrans.iastate.edu for color pdfs of this and other research reports.
16. Abstract
While levee embankments are the first line of defense for urban flooding, recent flooding events have revealed widespread slope
instability of embankments around the country that can lead to levee failures. This work aimed to improve the slope stability of
earthen levees by strengthening the soil through the use of a biologically-inspired technique called biocementation.
The major objective of this study was to determine the optimal and most practical biocementation method that results in the best
performance of levee slopes under various flooding conditions.
A novel biocementation method called bacterial enzyme-induced calcite precipitation (BEICP) was tested. This method differs
from the well-studied microbial-induced calcite precipitation (MICP) method mainly in the size of the biological agent (whole
bacterial cell vs. enzyme), which influences the agent’s mobility in soils of different grain sizes.
The BEICP methods for soil strengthening were optimized in laboratory-scale column experiments. The optimized methods were
then used to construct levees in an experimental flume system.
The results indicated that the BEICP treatment resulted in significant strengthening of the surface of the soil specimens, which
were measured as increases in unconfined compressive strength. The strengthened samples were able to resist erosion for a longer
time period under overtopping scenarios of water challenges with high water velocity in a flume. Therefore, BEICP offers a
sustainable and economical method for treatment of soil surfaces to improve erosion resistance.
The results of this study will help mitigate flooding events that could cause major issues in transportation infrastructure and
traffic safety.
17. Key Words 18. Distribution Statement
biocementation—flood mitigation—levee slope stabilization—unstable
embankments
No restrictions.
19. Security Classification (of this
report)
20. Security Classification (of this
page)
21. No. of Pages 22. Price
Unclassified. Unclassified. 25 NA
Form DOT F 1700.7 (8-72) Reproduction of completed page authorized


USE OF BIOCEMENTATION FOR SLOPE
STABILIZATION OF LEVEES
Final Report
November 2018
Principal Investigator
Kaoru Ikuma, Assistant Professor
Civil, Construction, and Environmental Engineering, Iowa State University
Co-Principal Investigators
Bora Cetin, Assistant Professor
Cassandra Rutherford, Assistant Professor
Chris Rehmann, Associate Professor
Say Kee Ong, Associate Chair and Director of Graduate Education
Civil, Construction, and Environmental Engineering, Iowa State University
Research Assistants
Rayla Pinto Vilar and Xinyi Jiang
Authors
Xinyi Jiang, Cassandra Rutherford, Bora Cetin, and Kaoru Ikuma
Sponsored by
Midwest Transportation Center and
U.S. Department of Transportation
Office of the Assistant Secretary for Research and Technology
A report from
Institute for Transportation
Iowa State University
2711 South Loop Drive, Suite 4700
Ames, IA 50010-8664
Phone: 515-294-8103 / Fax: 515-294-0467
www.intrans.iastate.edu


v
TABLE OF CONTENTS
ACKNOWLEDGMENTS ............................................................................................................ vii
LITERATURE REVIEW ................................................................................................................1
MATERIALS AND METHODS .....................................................................................................3
Controlled Soil Column Materials and Testing Methods ....................................................3 Levee Specimen Material and Preparation ..........................................................................7 Levee Testing Method .........................................................................................................9
RESULTS AND DISCUSSION ....................................................................................................12
CONCLUSION ..............................................................................................................................15
REFERENCES ..............................................................................................................................17

vi
LIST OF FIGURES
Figure 1. Typical soil column specimen ..........................................................................................4 Figure 2. Flange attached on the plywood (left) and flume test set up (right) .................................6
Figure 3. Testing No. 1 specimen (left) and Nos. 2, 3, and 4 specimens (right) .............................7 Figure 4. Levee model before testing ..............................................................................................9 Figure 5. No. 1 levee model flume test set up ...............................................................................10 Figure 6. No. 1 levee model during flume test ..............................................................................11 Figure 7. MICP treated specimen after flume test (left) and untreated specimen after flume
test (right) ...........................................................................................................................12 Figure 8. Weight loss of controlled specimens ..............................................................................13 Figure 9. Unconfined compressive strength of controlled specimens ...........................................14
LIST OF TABLES
Table 1. Soil column specimen preparation .....................................................................................3 Table 2. Typical spray process.........................................................................................................5 Table 3. Summary of controlled specimens enzyme preparation ....................................................5
Table 4. Flume test ...........................................................................................................................7 Table 5. Compaction process of levee model ..................................................................................8
Table 6. Spray process of levee model with enzyme concentration of 0.09 mg/ml ........................8 Table 7. Summary of controlled specimens ...................................................................................13

vii
ACKNOWLEDGMENTS
The authors would like to thank the Midwest Transportation Center and the U.S. Department of
Transportation Office of the Assistant Secretary for Research and Technology for sponsoring this
research. The Iowa State University Department of Civil, Construction, and Environmental
Engineering provided match funds for this project.


1
LITERATURE REVIEW
The slope stability of levees is one of the key factors for the prevention of catastrophic flooding,
especially in urban riverine systems. In recent years, levee failures were observed in major
flooding events such as during Hurricane Katrina in New Orleans, Louisiana, in 2005 (Sills et al.
2008) and the Mississippi River flood in 2011 (Davidson et al. 2013). In many of these cases,
levee failures were due, at least in part, to slope instability and susceptibility to erosion (Li et al.
2013).
There is a strong need for levee stabilization to prevent such failures in areas that are prone to
flooding, especially with the increasing effects of climate change (IPCC 2007).
Microbial-induced calcite precipitation (MICP) is a biocementation method used for soil
stabilization that relies on bacterial activity to produce calcium carbonate (CaCO3, calcite). The
method utilizes the enzyme urease to produce ammonium (NH4+) and carbonate (CO3
2-) during
the urea hydrolysis process (Fauriel and Laloui 2012). This ureolysis reaction will also cause an
elevation in pH. Bacterial ureolysis is utilized in biocementation to form calcium carbonate
(CaCO3) when Ca2+ ions are added, which will then connect soil particles together to result in
soil strengthening. The chemical reactions for urea hydrolysis and the formation of calcium
carbonate are shown below (Qabany and Soga 2013):
𝐶𝑂(𝑁𝐻2)2 + 2𝐻2𝑂 → 2𝑁𝐻4+ + 𝐶𝑂3
2− 𝑝𝐻 ↑ (1)
𝐶𝑎 + 𝐶𝑂32− → 𝐶𝑎𝐶𝑂3 𝑝𝐻 ↓ (2)
The main purpose of the MICP method is to increase the soil strength, preferably without
sacrificing permeability. In the MICP method, the voids volume of the soil specimen is filled
with precipitated calcium carbonate. The presence of the calcium carbonate bridging results in an
increase of the stiffness in soil (DeJong 2006). The correlation of the calcium carbonate
precipitation and the soil particles is the key factor that increases the soil strength. As tested by
van Paassen (2009), the unconfined compressive strength test showed the soil strength increased,
while the traxial compression test also showed a higher value of the compressive strength after
MICP treatment of soil.
The use of a different biocementation technique called bacterial enzyme-induced calcite
precipitation (BEICP) was tested in this study. Both MICP and enzyme-induced calcite
precipitation (EICP) have been shown to lead to soil stabilization through the formation of
calcium carbonate precipitates that bind soil particles together (DeJong et al. 2011).
In MICP, the urease enzymes that are critical for biocementation are located within bacterial
cells (Sporosarcina pasteurii), whereas in BEICP, the enzymes are provided in an aqueous cell-
free suspension (Hoang et al. 2018). One of the major differences between MICP and EICP is the
mobility of the biological agent due to differences in size; bacterial cells used in MICP are ≥1
µm long and therefore, are less mobile compared to enzymes used in BEICP (~10 nm in

2
diameter). As such, BEICP is likely to be more effective in stabilizing fine-grain soils compared
to MICP as has been shown in a recent study (Hoang et al. 2018).
In this project, BEICP-treated soil samples were tested for their resistance to erosion to
determine whether BEICP is an effective method for levee stabilization. Soil specimens were
surface-treated with the BEICP protocol, then tested for their erosion resistance in a flume.

3
MATERIALS AND METHODS
Controlled Soil Column Materials and Testing Methods
The controlled soil columns were tested in the flume with the goal of determining the erosion
rate. Soil column specimens were prepared for the controlled tests. Two of the five soil
specimens were untreated specimens; the other eight soil specimens were treated with the
variation of the enzyme type and concentrations. All the soil column specimens were prepared
with Ottawa sand and silt. The silt was collected from Iowa loess soil that was passed through a
No. 200 sieve. The soil column specimens were prepared by adding 5 percent water of the total
weight to obtain the optimum dry unit weight. The compaction method was used for the
specimen preparation. The summary of the soil column specimens is shown in Table 1 along
with their geotechnical properties.
Table 1. Soil column specimen preparation
Specimen
Materials
Weight of
soil column
(g)
Silt
content
(%)
Water
content (%)
Specific
gravity
Initial
void
ratio
Initial void
volume
(ml)
No. 1 296.19 10 5 2.649 0.435 48.74
No. 2 290.95 10 5 2.649 0.540 56.37
No. 3 292.65 10 5 2.649 0.530 55.67
No. 4 242.51 10 5 2.649 0.494 43.1
No. 5 256.46 10 5 2.649 0.412 38.03
The soil column specimens, 2 in. height and 2.5 in. diameter, were built using PVC pipes cut to
3.5 in. heights. The space under the soil specimen (~1 in. height) was filled with gravel to
provide a drainage system for the soil column specimen. Scrub pads were used between the
gravel and soil specimens to separate the soil specimen and the gravel layers. A piece of scrub
pad was also attached on the bottom of the column to provide free drainage. A typical specimen
is shown in Figure 1.

4
Figure 1. Typical soil column specimen
Enzymes to be used in the BEICP method were prepared by growing S. pasteurii cells in growth
medium (containing 20 g/L tryptic soy broth, 10 g/L ammonium sulfate, 0.13 mol/L Tris base,
and an overall solution pH of 9.0) for 48 hours with shaking at 160 rpm. Total proteins including
urease enzymes were extracted from the harvested cells in two ways. Method 1 was performed
through sonication of the cell suspension (in the spent growth media) for six 10-min cycles with
a 2-min rest in between to lyse the cells. The rest periods were necessary to ensure that the
samples did not overheat, which may cause protein denaturation. Following sonication, the
suspension was centrifuged to remove cells and the supernatant was used as the enzyme solution.
Method 2 was used to obtain purer and more controlled enzyme samples. Cells were harvested,
washed, and suspended again in 50 mM phosphate buffer (pH 8.0), then sonicated for 15 2-min
cycles with a 1-min rest in between. The suspension was centrifuged and the supernatant was
filtered through 0.2 µm pore size membranes, after which the solution was dialyzed in 50 mM
phosphate buffer using 3,500 Da cutoff dialysis membranes to remove impurities. The dialyzed
sample was then used as the enzyme solution in subsequent procedures described as follows.
The spray method of applying enzyme and chemical solutions was tested first. The treated
specimens were prepared with varying enzyme types and concentrations. Nos. 1, 2, and 3 were
treated with enzyme solution prepared through Method 1; Nos. 4 and 5 were treated with enzyme
solution prepared through Method 2; and Nos. 6 and 7 were untreated specimens. The Nos. 1–5
specimens were treated with five spray cycles that reached the optimum unconfined compressive
strength. The total volume of enzyme solution used was based on the initial void volume; the
volume of enzyme solution sprayed on the soil specimens should be at least equal to the void
volume of each soil specimen. For each spray cycle, the appropriate volume of enzyme solution
was first sprayed onto the top surface of the soil specimen followed by air-drying of the
specimen, and then the appropriate volume of the chemical solution containing 0.3 M calcium
chloride and urea was sprayed. The next spray cycle started after the specimens were air dried.
Typical details of the spray cycle process are shown in Table 2.

5
Table 2. Typical spray process
Spray Cycle No.
1 2 3 4 5
Enzyme volume 15g 15g 10g 6g 3g
Chemical solution volume 20g 15g 5g 4g 3g
Starting time 3:06 p.m. 7:23 p.m. 11:12 p.m. 1:10 a.m. 8:30 a.m.
Weight before spray enzyme 521.6g 553.83g 575.13g 578.90g 584.86g
Weight after spray enzyme 539.35g 566.59g 582.81g 583.44g 587.18g
Weight before chemical solution 538.81g 564.78g 582.61g 582.47g 584.17g
Weight after chemical solution 555.84g 576.07g 586.95g 585.97g 586.90g
Cycle waiting time 4 hr 17 min 3 hr 51 min 2 hr 7 hr 20 min
Oven dry weight after spray 553.83g 575.13g 578.90g 584.86g 529.44g
All the treated specimens were treated with five spray cycles, allowed to air dry for 5–7 days,
and placed in the oven at 55°C for two days before testing in the flume. The variations in the
enzyme solution concentration and volume used for each specimen are shown in Table 3.
Table 3. Summary of controlled specimens enzyme preparation
Specimen
Enzyme Variation
Method Concentration
Void Volume
(ml)
Amount Used
(ml)
No. 1 1 NA 48.74 54
No. 2 1 NA 56.37 56
No. 3 1 NA 55.67 56
No. 4 2 0.9 mg/ml 43.1 50
No. 5 2 0.2 mg/ml 38.03 50
Method 1 of enzyme solution preparation did not allow for enzyme concentration measurements
For flume testing of samples, the PVC tubes containing the treated soil specimens were placed in
the flange attached on the plywood board to keep them stable. Figure 2 shows the flange attached
on the plywood and how the soil column specimens were placed in the flume.

6
Figure 2. Flange attached on the plywood (left) and flume test set up (right)
During the flume test, the water height was set up to be slightly higher than the top of the soil
column specimen to mimic an overtopping scenario. Figure 3 shows some of the specimens
during the flume tests.

7
Figure 3. Testing No. 1 specimen (left) and Nos. 2, 3, and 4 specimens (right)
The velocity of the flume on top of the soil column specimens is around 19 cm/s. Detailed
information on each flume test is shown in Table 4.
Table 4. Flume test
Flume Tests Water height Flume velocity Testing specimens
Test 1 10.1 cm 19.5756 cm/s No. 1
Test 2 11.2 cm 18.9087 cm/s Nos. 2, 3, and 4
Test 3 12.0 cm Nos. 6 and 7
Levee Specimen Material and Preparation
In the levee model testing, two models were tested. The first one was treated with the type 1
enzyme, and the other one was treated with the type 2 enzyme.
The levee model was prepared in a plastic frame with a 4:1 slope. In the levee model preparation,
the Ottawa sand was mixed with 10 percent silt and 5 percent of water. Two layers of the soil
were compacted to obtain the optimum dry unit weight. The spraying procedure for BEICP was
applied on the surface of the levee model. Both types of enzyme were used for levee model
preparation (concentration of 0.09 mg/ml used for type 2). The volumes of the enzyme solution

8
and urea and calcium chloride solution were calculated based on the best result from the
controlled soil column specimens. The details of the prepared levee model are shown in Table 5.
Table 5. Compaction process of levee model
Layer 1
Specification
Layer 2
Specification
Thickness 2 in. height 2 in. height
Weight of soil 9900 6710
Weight of water 495 335.5
Silt content 10% 10%
Moisture content 5% 5%
Specific gravity 2.649 2.649
Total weight 17440.5 g
The spray process was based on the controlled specimen spray process, and the volumes of the
enzyme solution and urea and calcium chloride solution used for each cycle were proportionally
increased. In the spray process, the waiting time between each cycle was relatively longer than
the time used to prepare the controlled soil column specimens, since the surface area was much
larger and needed more time for drainage. The detailed spray cycle is shown in Table 6.
Table 6. Spray process of levee model with enzyme concentration of 0.09 mg/ml
Sample Preparation
Spray Cycle No.
1 2 3 4 5
Enzyme volume 830.5g 588g 427.02g 346.92g 206.48g
Chemical solution volume 840g 573g 410g 305g 200g
Starting time 5:30 p.m. 1:00 a.m. 8:30 a.m. 7:30 p.m. 8:30 a.m.
Cycle waiting time 7.5 hrs 7.5 hrs 11 hrs 13 hrs
Figure 4 shows the levee model after the spray process and before testing.

9
Figure 4. Levee model before testing
Levee Testing Method
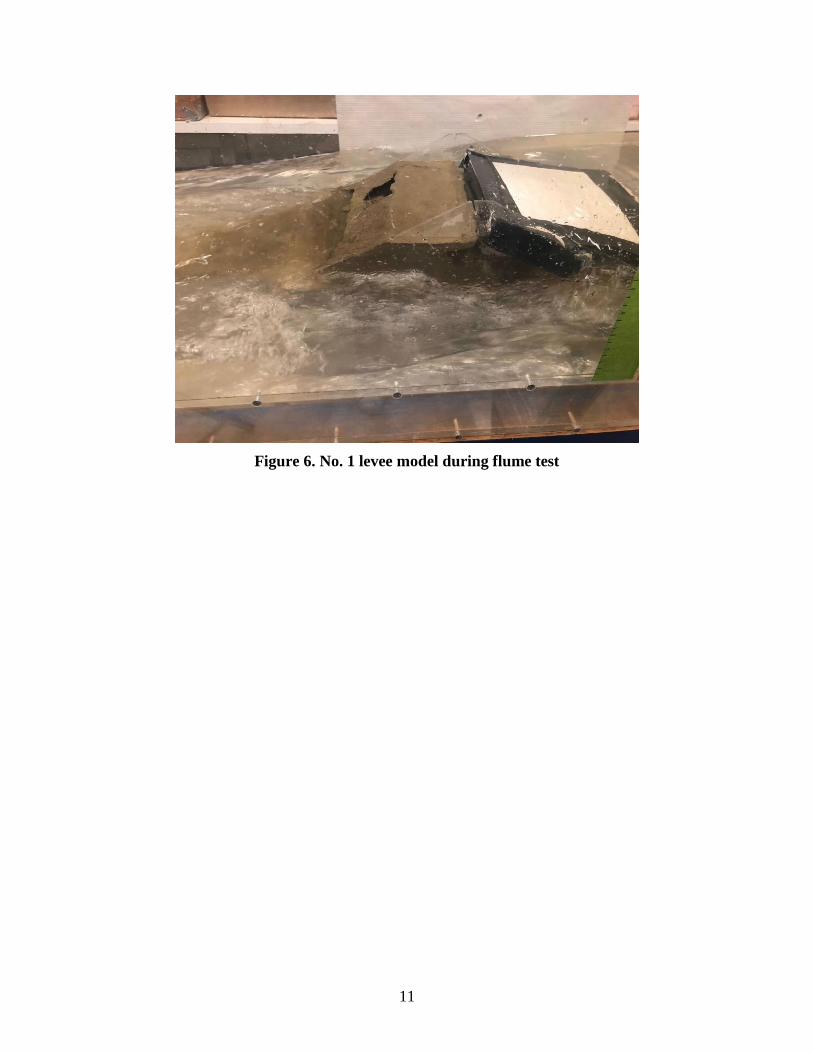
The first levee model was tested in the flume. This levee model was built only on one side, while
another side was covered with Styrofoam to prevent erosion on the side of the levee model. The
levee model was placed in the flume as shown in Figure 5.

10
Figure 5. No. 1 levee model flume test set up
During the flume test of the first levee model, the water height was slightly higher than the levee
model. The water velocity was changed from 13.506 cm/s during the first 6 minutes, while there
was an 8.5-minute gap due to some movement of the levee model, the water velocity during the
last 5 minutes was 23.1121 cm/s. This levee model was tested in the flume and the test is shown
in Figure 6.
11
Figure 6. No. 1 levee model during flume test

12
RESULTS AND DISCUSSION
The No. 1–4 and 6–7 specimens were tested in the flume with the water and flume information
described earlier. The specimens were placed in the water until erosion was observed on the
surface. Typical pictures of the soil column surface of treated soil specimens and untreated soil
specimens are shown in Figure 7.
Figure 7. MICP treated specimen after flume test (left) and untreated specimen after flume
test (right)
Weight loss in each specimen following the flume test was recorded as a quantitative measure
for the degree of erosion. The oven dry weight of the soil column specimen was measured before
and after flume testing. The unconfined compressive strength was measured with a pocket
penetrometer after the flume test and oven dry process. A summary of the results for comparison
between treated and untreated specimens is shown in Table 7.

13
Table 7. Summary of controlled specimens
Specimen
Enzyme
concentration
(mg/ml)
Weight
loss
(g)
Testing
time
Unconfined
compressive
strength
(TSF) psf
No. 1 NA 19.5 100 min 1.75 3500
No. 2 NA 12.34 60 min 4.0 8000
No. 3 NA 16.07 60 min 4.5 9000
No. 4 0.9 17.54 60 min 3.0 6000
No. 5 0.2 NA NA 1.75 3500
No. 6 NA 22.5 6 min 1.0 2000
No. 7 NA 19.3 5 min 1.5 3000
The weight loss and the unconfined compressive strength of each specimen are shown in Figures
8 and 9.
Figure 8. Weight loss of controlled specimens
19.5
12.34
16.07
17.54
22.5
19.3
11
13
15
17
19
21
23
No.1 No.2 No.3 No.4 No.5 No.6 No.7
We
igh
t Lo
ss (
g)
Specimen No.
Weight loss (g)

14
Figure 9. Unconfined compressive strength of controlled specimens
The Nos. 6 and 7 specimens were untreated specimens, and these two specimens had around 20 g
of weight loss after only 5 minutes in the flume water, whereas all the BEICP-treated specimens
exhibited observable erosion after approximately 60 minutes. Compared to all the other
controlled specimens, Nos. 1, 2, and 3 were treated using the same method, same type of
enzyme, and same spray cycle process. However, the No. 1 specimen was tested after one week
of air drying and one day of oven drying, whereas Nos. 2 and 3 were tested following 12 days of
air drying and 2 days of oven drying. Comparing the weight loss and unconfined compressive
strength, the No.1 specimen had more weight loss than Nos. 2 and 3, and a lower unconfined
compressive strength. The Nos. 2, 3, and 4 specimens were tested together. The Nos. 4 and 5
specimens were treated with the type 2 enzyme, which had a lower concentration than the type 1
enzyme. The Nos. 2, 3, and 4 specimens were tested together. The No. 4 specimen had greater
weight loss and a lower unconfined compressive strength compared with the Nos. 2 and 3
specimens. The No. 5 specimen was not tested in the flume, only the unconfined compressive
strength was tested. The unconfined compressive strength of the No. 5 specimen was the same as
the No. 1 specimen, and both were 1.75 TSF, which is 3500 psf. Compared with the Nos. 6 and 7
specimens, all the bio-treated specimens tested in the flume had a lower weight loss and a higher
unconfined compressive strength than the two untreated specimens.
While analysis of the levee test results was underway, the researchers noticed significant
improvements in erosion resistance in levees that were treated with type 2 enzymes compared to
type 1.
1500
2500
3500
4500
5500
6500
7500
8500
9500
No.1 No.2 No.3 No.4 No.5 No.6 No.7
Un
con
fin
ed
Co
mp
ress
ive
Str
en
gth
(p
sf)
Specimen No
Unconfined Compressive strength (psf)

15
CONCLUSION
In conclusion, this project showed that a novel biocementation method, BEICP, was effective in
treating the surface of soil column and levee samples to achieve improved erosion resistance.
BEICP offered a sustainable, bio-inspired technology that allowed for surface treatment of soils
with a range of soil particle sizes and porosities.


17
REFERENCES
Davidson, G. R., J. R. Rigby, D. Pennington, and J. V. Cizdziel. 2013. Elemental Chemistry of
Sand-Boil Discharge used to Trace Variable Pathways of Seepage beneath Levees during
the 2011 Mississippi River Flood. Applied Geochemistry, Vol. 28, pp. 62–68.
DeJong, J. T., M. B. Fritzges, and K. Nüsslein. 2006. Microbially Induced Cementation to
Control Sand Response to Undrained Shear. Journal of Geotechnical and
Geoenvironmental Engineering, Vol. 132, No. 11, pp. 1381–1392.
DeJong, J. T., K. Soga, S. A. Banwart, W. R. Whalley, T. R. Ginn, D. C. Nelson, B. M.
Mortensen, B. C. Martinez, and T. Barkouki. 2011. Soil Engineering in vivo: Harnessing
Natural Biogeochemical Systems for Sustainable, Multi-Functional Engineering
Solutions. Journal of the Royal Society Interface, Vol. 8, No. 54, pp. 1–15.
Fauriel, S. and L. Laloui. 2012. A Bio-Chemo-Hydro-Mechanical Model for Microbially
Induced Calcite Precipitation in Soils. Computers and Geotechnics, Vol. 46, pp. 104–
120.
Hoang, T., J. Alleman, B. Cetin, K. Ikuma, and S. G. Choi. 2018. Sandy and Silty-Sand Soil
Stabilization using Bacterial Enzyme Induced Calcite Precipitation (BEICP). Canadian
Geotechnical Journal. http://www.nrcresearchpress.com/doi/abs/10.1139/cgj-2018-
0191#.W9nGE-JOmUk.
IPCC. 2007. Climate Change 2007: The Physical Science Basis. Contribution of working group
1 to the fourth assessment report of the Intergovernmental Panel on Climate Change
(IPCC). Cambridge University Press, Cambridge, United Kingdom, and New York, NY.
Li, L., F. Amini, and Y. Pan. 2013. Erosion Resistance of Earthen Levee Strengthened by
HPTRM System under Combined Wave and Surge Overtopping Conditions. Paper
presented at the Geo-Congress 2013, March 3–7, San Diego, CA.
Qabany, A. Al and K. Soga. 2013. Effect of Chemical Treatment Used in MICP on Engineering
Properties of Cemented Soils. Géotechnique, Vol. 63, No. 4, pp. 331–39.
Sills, G. L., N. D. Vroman, R. E. Wahl, and N. T. Schwanz. 2008. Overview of New Orleans
levee failures: Lessons Learned and their Impact on National Levee Design and
Assessment. Journal of Geotechnical and Geoenvironmental Engineering, Vol. 134, No.
5, pp. 556–565.
van Paassen, L. A. 2009. Biogrout: Ground Improvement by Microbially Induced Carbonate
Precipitation. Delft University of Technology.


Visit www.InTrans.iastate.edu for color pdfs of this and other research reports.
THE INSTITUTE FOR TRANSPORTATION IS THE FOCAL POINT FOR TRANSPORTATION AT IOWA STATE UNIVERSITY.
InTrans centers and programs perform transportation research and provide technology transfer services for government agencies and private companies;
InTrans manages its own education program for transportation students and provides K-12 resources; and
InTrans conducts local, regional, and national transportation services and continuing education programs.