usda mcgovern-dole international food for education … kenya mid term... · usda mcgovern-dole...
TRANSCRIPT
A Mid-Term Evaluation of WFP’s
USDA McGovern-Dole International
Food for Education and Child
Nutrition Program’s Support (2013-
2015) in Kenya from September
2013 to December 2014
Final Report
October 2015
Submitted by: Flavio Braidotti Coordinator Research & Advisory Service Kimetrica LTD Eldama Park, off Peponi Road, Nairobi [email protected]
Submitted to:
Lara Fossi Head of Country Programme Unit
WFP Kenya Gigiri Compound, Nairobi

ii
Acronyms and Abbreviations
CDE County Director of Education CEC Chief Executive of Education CT Cash Transfer CP Country Program CSB Corn-Soya Blend DEO District Education Office DFATD Department of Foreign Affairs, Trade and Development ECDC Early Childhood Development Centres FTC Feed the Children GPE Global Partnership for Education HGSMP Home Grown School Meals Program KCPE Kenya Certificate of Primary Education KI Key Informant IPA Innovation Poverty Action M&E Monitoring and Evaluation MGD Mc-Govern Dole MOEST Ministry of Education, Science and Technology MoALF Ministry of Agriculture, Livestock And Fisheries MoH Ministry of Health MoU Memorandum of Understanding NER Net Enrolment Ratio NESP the National Education Sector Plan NGO Non-governmental Organization NSNP National Safety Net Program PCD Partnership for Child Development PHO Public Health Officer PMP Program Monitoring Plan PTA Parent Teacher Association QA Quality Assurance SDI Service Delivery Indicators SFP School Feeding Program SMC School Meal Committee SMPO School Meals Program Officer SNV Netherlands Development Organization TSC Teachers Service Commission TOR Terms of Reference UNDAF United Nations Development Action Framework UNDSS United Nations Department of Safety and Security USDA United States Department of Agriculture WaSH Water, Sanitation and Hygiene WFP World Food Program

iii
Acknowledgements
We would like to give special thanks to the World Food Program (WFP) and the Ministry of
Education, Science and Technology (MOEST) staff for their time, thoughtful input, and guidance
to this review process. Without their help in sharing documents and providing insight into the
history and evolution of the School Feeding Program (SFP), we would have missed valuable
historical context. We would also like to thank all of the in-country stakeholders who took the
time to meet with the Kimetrica team, sharing their candid thoughts and reflections about the
SFP. Finally, thank you to the United States Department of Agriculture (USDA) for providing
valuable inputs and support to the design of this mid-term evaluation.
Disclaimer
The opinions expressed are those of the Evaluation Team, and do not necessarily reflect those
of the World Food Programme. Responsibility for the opinions expressed in this report rests
solely with the authors. Publication of this document does not imply endorsement by WFP of
the opinions expressed.
The designation employed and the presentation of material in the maps do not imply the
expression of any opinion whatsoever on the part of WFP concerning the legal or constitutional
status of any country, territory or sea area, or concerning the delimitation of frontiers.
iv
Contents
Executive Summary ...................................................................................................................... 1
1. Scope of the consultancy .................................................................................................... 12
2. The WFP school feeding program in Kenya ......................................................................... 13
2.1. Overview ................................................................................................................... 13
2.2. Handover process ...................................................................................................... 16
3. Survey Plan ........................................................................................................................ 17
3.1. Methodology ............................................................................................................. 17
3.1.1. Secondary data ........................................................................................................... 17
3.1.2. Quantitative data ........................................................................................................ 17
3.1.3. Qualitative data .......................................................................................................... 18
3.2. Key evaluation questions ........................................................................................... 19
4. Findings ............................................................................................................................. 21
4.1. Strategy of the program ............................................................................................. 21
4.2. Program performance at mid-term ............................................................................. 24
4.2.1. Outputs and progress towards outcomes .................................................................. 24
4.2.2. Additional findings ...................................................................................................... 37
4.2.3. Program efficiency ...................................................................................................... 39
4.3. External and internal factors affecting results ............................................................. 41
4.4. Sustainability of the program ..................................................................................... 44
5. Best practices, lessons learned and recommendations ........................................................ 45
Annex 1: Bibliography ................................................................................................................ 49
Annex 2: Sampled Schools by County ......................................................................................... 51
Annex 3: Pupil Sampling Methodology ....................................................................................... 53
Annex 4: Performance Indicators at Mid-Term Point ................................................................... 54

v
Annex 6: List of Interviewees ...................................................................................................... 67
Annex 7: Survey Instruments ...................................................................................................... 69
Annex 8: Sampling Strategy and Enumerators’ Training ............................................................ 105
Tables
Table 1: Lessons Learned and Recommendations .......................................................................... 8
Table 2: County, School and Household sample ........................................................................ 105
Figures
Figure 1: Program Performance at Mid-Term: Some Key Indicators ............................................... 4
Figure 2: Program Performance at Mid-Term .............................................................................. 24
Figure 3: Percent of teachers attending at least 90% of scheduled days ....................................... 26
Figure 4: Percent of students identified as inattentive ................................................................. 27
Figure 5: Percent of students regularly attending school ............................................................. 28
Figure 6: Percent of students who regularly consume a meal before the school day ..................... 31
Figure 7: Percentage of students who regularly consume a meal during the school day ............... 32

1
Executive Summary
The external mid-term evaluation of the United States Department of Agriculture (USDA)
McGovern Dole (MGD)-supported World Food Program (WFP) School Feeding Program (SFP) in
Kenya covers the period from September 2013 to December 2014
The Evaluation was designed to 1. Assess performance against agreed targets and determine
successes, challenges and areas that need improvement based on evaluation questions 2.
Determine factors that have affected the achievement of results, drawing lessons and best
practices 3. Outline how the lessons could be applied to inform future interventions and 4.
identify changes required to enable achievement of set program objectives and targets within
the set timeframes.
The WFP SFP provides daily school meals to pre-primary and primary school children in the Arid
Lands of Kenya and in selected Nairobi informal settlement schools. Through this support, pupils
are provided over a third of their daily energy intake with the objective of increasing enrolment
in targeted schools, enhancing school attendance and improving performance. In 2009, the
Government of Kenya launched a cash-based Home-Grown School Meals Program (HGSMP)
with the aim of taking over schools under the WFP SFP. Initially it was agreed to transition an
average of 50,000 students each year to the Government program, but with the start of WFP’s
new Country Program in 2014, this has been accelerated to one county per year. So far, all the
semi-arid counties have been transitioned to the national program, plus one arid county.1
McGovern-Dole is one of the most long-standing donors to the SFP in Kenya. Its most recent
contribution of US$20million supports the SFP during the period 2013-2015. Under this
agreement USDA intends to provide about 3,770 MT of split yellow peas, 540 MT of vegetable
oil and 14,700 MT of bulgar.
The key goals of the WFP-USDA agreement, as stated in the Project Level Framework, are two:
1) improved literacy of school-age children and 2) increased use of health and dietary practices.
The first objective has three outcomes: improved quality of teaching (through more consistent
teacher attendance, improved literacy instructional materials and increased knowledge and
skills of teachers), improved student attentiveness and higher attendance. The second objective
focuses on improving the knowledge of health, hygiene, safe food preparation and storage
practices, increasing knowledge of nutrition, increasing access to clean water and sanitation
services, and increased access to food and storage tools and equipment.
1 Arid Districts are as follows: Turkana, Marsabit, Samburu, Baringo, Moyale, Isiolo, Tana River, Garissa, Ijara, Wajir,
Mandera.
Semi-Arid Districts are as follows: West Pokot, Marakwet, Koibatek, Laikipia, Trans Mara, Bomet, Narok, Kajado,
Machakos, Mbeere, Tharaka, Makueni, Mwingi, Kitui, Taita Taveta, Kwale, Kilifi, Malindi, Lamu.

2
Methodology
The evaluation was designed to assess the performance of the program as at mid-term against
the following criteria: relevance, efficiency, effectiveness and sustainability. The main evaluation
questions, as indicated in the Terms of Reference were under the following four broad areas:
Strategy of the program, results of the program as at mid- term, factors affecting the results and
sustainability of the program. In order to respond to these questions, a mixed methods
approach was adopted. This entailed a combination of secondary data review and quantitative
and qualitative primary data collection approaches. Secondary data was provided by the major
project implementers: WFP, Ministry of Education, Science and Technology (MOEST) and Feed
the Children (FTC). Primary data on the other hand was obtained through a survey conducted in
48 sampled schools across six counties (Garissa, Marsabit, Nairobi, Tana River, Turkana and
West Pokot). In particular, data from the SMP 6 Form was collected for all months of 2014,
when available. The data collection was carried out by 20 enumerators in teams of two.
Qualitative data was gathered through Key Informant (KI) interviews at county levels in Garissa
and Turkana (WFP officials, education and health officials) and in Nairobi with project
stakeholders, including donors and complementary partners (WFP Officials, Unicef, USDA,
Department of Foreign Affairs, Trade and Development (DFATD) Canada, City Education
Department, FTC, MOEST & Ministry of Health (MoH) officials, Netherlands Development
Organization (SNV), Partnership for Child Development (PCD), Evidence Action).
Key findings
The key findings of the evaluation team are summarized below. It should be noted that although
this is an evaluation of USDA MGD funds and given that the SFP is a multi-donor program, it is
difficult to attribute results to specific donor contributions. The findings presented in this
evaluation should therefore be seen as a result of multiple donor efforts. Moreover, given the
short time interval between the baseline and mid-term surveys, care should be taken in
determining causality for changes in the indicator values.
Evaluation Question 1: Strategy of the program
Overall, all project stakeholders and beneficiaries consider the SFP to be a successful program
that is relevant to pupils’ needs and consistent with government policies.
Ninety-one percent of teachers interviewed believe that school attendance would drop
drastically (over 30 percent) if meals were no longer provided. Our primary data collection also
found that only 60% of the pupils regularly consume a meal before going to school and that
more than 50% of parents reduce the evening meal portions when lunch is provided in schools.
This means that for many pupils in the arid lands, the SFP meal is the most substantial meal they
have during the day.
Moreover, the evaluation found that the work of major partners in the fields of education,
health and water, sanitation and hygiene (WaSH), deworming and governance/capacity building

3
complement quite well the SFP though stronger partnerships in particular in the education and
child protection sectors are recommended in order to improve the consistent poor performance
of pupils over the years (more on this provided in the next sections).
The SFP currently targets the most food insecure areas of Kenya with the lowest educational
indicators. The program is inclusive, as it covers all public schools in the targeted counties and
selected schools in the Nairobi informal settlements that meet the basic requirements for
participation in the program. Based on this, the mid-term evaluation confirmed that the
program reaches the right people.
The SFP provides the right type of assistance considering that the SFP is designed to provide a
basic basket of commodities covering 30 percent of pupils’ daily energy intake and considering
that the program is well complemented by other programs (i.e. deworming, capacity building,
WASH and Education).
Worthy of mention is the strong community support for the SFP. Despite the bleak food security
situation, a high percentage of sampled schools (87 percent) were able to contributed non-food
items to the program. Remarkably, observations during the survey implementation showed that
two schools in Turkana also provided vegetables.
Evaluation Question 2: Program performance at mid-term
For the full set of 33 indicators and their values please refer to Annex 4. Please find below a
summary of the key indicators’ trend. Generally speaking, the program has met established
indicator targets for 2014 and is on track for achieving the expected program results by the end
of the project cycle.
Overall, the performance of pupils remains quite low (including low completion rates) which is
most probably related to the low quality of teaching, as verified by the SDI 2012 Report where
only 35.2% of teachers have scored more than 80% on general knowledge tests that combine
Mathematics, English and Pedagogy. Attendance alone therefore does not necessarily translate
into good literacy outcomes especially in the arid areas.
Compared to the baseline survey, the data revealed an increase in pupils’ enrolment figures and
teachers’ attendance. The communities’ knowledge and awareness of the benefits of primary
education also improved over the period analysed. Food preparation and storage procedures
improved as a result of USDA assistance. All trainings to MOEST and teachers were implemented
as planned and exceeded the targets for 2014. As a consequence almost all cooks passed the
test on safe food preparation and storage (based on the 50% threshold used during the
baseline).
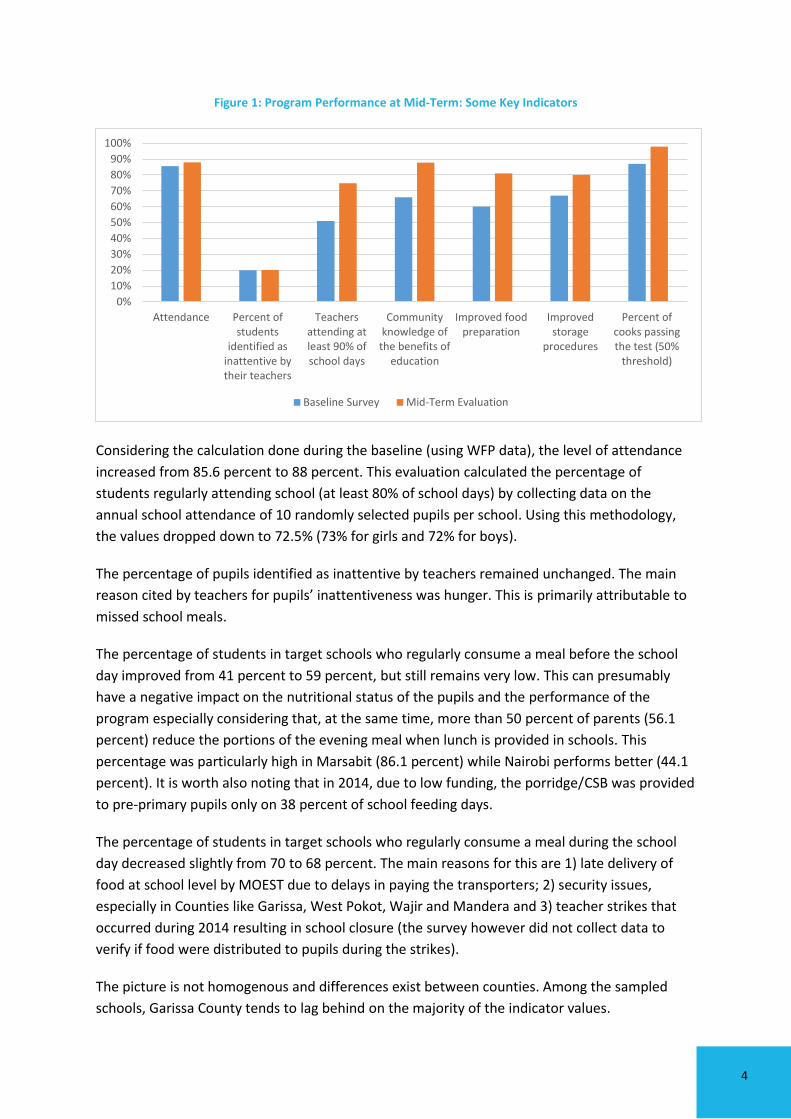
Figure 1 shows some of the key indicators measured during this mid-term evaluation and their
improvements from the baseline survey.
4
Figure 1: Program Performance at Mid-Term: Some Key Indicators
Considering the calculation done during the baseline (using WFP data), the level of attendance
increased from 85.6 percent to 88 percent. This evaluation calculated the percentage of
students regularly attending school (at least 80% of school days) by collecting data on the
annual school attendance of 10 randomly selected pupils per school. Using this methodology,
the values dropped down to 72.5% (73% for girls and 72% for boys).
The percentage of pupils identified as inattentive by teachers remained unchanged. The main
reason cited by teachers for pupils’ inattentiveness was hunger. This is primarily attributable to
missed school meals.
The percentage of students in target schools who regularly consume a meal before the school
day improved from 41 percent to 59 percent, but still remains very low. This can presumably
have a negative impact on the nutritional status of the pupils and the performance of the
program especially considering that, at the same time, more than 50 percent of parents (56.1
percent) reduce the portions of the evening meal when lunch is provided in schools. This
percentage was particularly high in Marsabit (86.1 percent) while Nairobi performs better (44.1
percent). It is worth also noting that in 2014, due to low funding, the porridge/CSB was provided
to pre-primary pupils only on 38 percent of school feeding days.
The percentage of students in target schools who regularly consume a meal during the school
day decreased slightly from 70 to 68 percent. The main reasons for this are 1) late delivery of
food at school level by MOEST due to delays in paying the transporters; 2) security issues,
especially in Counties like Garissa, West Pokot, Wajir and Mandera and 3) teacher strikes that
occurred during 2014 resulting in school closure (the survey however did not collect data to
verify if food were distributed to pupils during the strikes).
The picture is not homogenous and differences exist between counties. Among the sampled
schools, Garissa County tends to lag behind on the majority of the indicator values.
0%
10%
20%
30%
40%
50%
60%
70%
80%
90%
100%
Attendance Percent ofstudents
identified asinattentive bytheir teachers
Teachersattending atleast 90% ofschool days
Communityknowledge of
the benefits ofeducation
Improved foodpreparation
Improvedstorage
procedures
Percent ofcooks passingthe test (50%
threshold)
Baseline Survey Mid-Term Evaluation

5
The mid-term evaluation also measured cross-cutting indicators related to the physical and/or
emotional threats to safety of pupils. Parents were asked whether their child had been exposed
to specific threats (rape, sexual harassment, robberies, animal attack, bullying and abuse of
drugs) in the past 30 days while walking to and from school. The results show that the
percentage of pupils experiencing threats ranges from 3.5 percent for bullying to 4.9 percent for
rape and sexual harassment) and indicate that, generally speaking, pupils have experienced
significant threats to their safety. However the problem seems to be particularly prevalent in
Nairobi and to a lesser extent in Turkana (animal attack) and Tana River (animal attack and
bullying). These findings are consistent with the WFP Country Program 2014-2018 Baseline
Study, which found that 96 percent of pupils were able to access school feeding programs
safely.
Another finding of the mid-term review is that schools often inflate their enrolment figures, as
was verified by WFP in Samburu County, where the difference between reported enrolment
figures and actual pupil enrolment was 19 percent (secondary data from WFP 2015).
Gender analysis
The UWEZO 2014 Report found that Kenya has achieved 100 percent gender parity in basic
education (UWEZO 2014, p.14). This should not mask the notable regional disparities that exist
in Kenya. For both enrolment and performance, data from MOEST for the sampled counties
shows a lower figure for girls compared to boys (NER: 58.4% girls and 67.1% boys, Kenya
Certificate of Primary Education (KCPE) performance: 228 girls and 241 boys out of 500). There
are no significant differences between girls and boys in terms of attendance on the other hand.
Program efficiency
There have been no major pipeline breaks during reference period of the evaluation (2014). This
has been possible thanks to WFP’s capacity to source funds from different donors (including the
private sector) thus ensuring a smooth pipeline even when USDA food commodities did not
arrive in 2013 and arrived late in 2014.
Efficiency is hindered by the limited financial and human resources at the county level, which
limit the government institutions’ monitoring capacity and ability to carry out timely secondary
transportation of commodities (causing late delivery to schools). This was confirmed by KI
interviews with MOEST and WFP officers in Garissa and Turkana Counties. This is a significant
problem.
For Nairobi’s informal settlements, WFP has an agreement with Feed the Children (FTC), an
international NGO Nairobi informal settlements’ schools are characterized by a different
administrative arrangement compared with other counties (there is no MOEST oversight), hence
the need for a counterpart. Interviews with WFP in Nairobi and analysis of FTC secondary data
have revealed that logistics are not an issue for the Nairobi informal settlement schools and that
FTC has been highly efficient in managing the SFP.

6
The efficiency of the program in terms of the quantities of food cooked on a daily basis was
quite high. Findings show that cooks often cook daily quantities of food based on the official
enrolment and not based on actual daily pupil attendance. Related issues include the fact that
several schools do not have functioning weighing scales, and that pulses need to be soaked
several hours before being cooked (i.e. before the actual attendance is known).
In regard to the rations, WFP monitoring data from 2014 found that the average ration size for
food cooked was of 149.21 grams for cereals, 5.0 grams for vegetable oil and 40.4 grams for
pulses2; our findings confirm this with the average cereal ration size ranging between 147 and
154 grams (dry ration equivalent). This means that the amount of food provided is in line with
the quantity envisaged by the program.
Currently, food distribution during the lunch break among children varies between schools:
some schools use a centralized distribution system through the school cook while others
distribute food by classes (using large buckets). The absence of a common measure for the
pupils’ rations and the fact that children use food containers of different sizes means that that
rations distributed are not accurate and distribution methods could be significantly improved.
The average wet ration weighed during the survey varied between 303 grams in Marsabit to 622
grams in Garissa. In Nairobi it was recorded an average of 498 grams.
Based on a WFP study on school feeding cost benchmarks conducted at the global level, the
average standard annual cost per recipient for “meals only” in Kenya amounts to U$33 (based
on 2013 data).
Finally, KI interviews revealed that communication channels between WFP Kenya, USDA Kenya
and Washington offices could be streamlined to increase program efficiency. Currently, direct
communication between USDA Washington and the WFP Kenya Country Office only happens
with WFP Washington office acting as an intermediary.
Evaluation Question 3: Factors affecting results of the programs
External Factors affecting program performance
The devolution process in Kenya has changed the responsibilities and reporting lines of
different Ministries involved in the SFP (MOEST has not been decentralized to County
level)
Teacher strikes and insecurity in certain Counties (Garissa, Mandera, Wajir) had a
negative impact on the attendance rate and regular consumption of food of pupils (the
survey however did not collect data to verify if food were distributed to pupils during
the strikes)
2 This information is based on the total quantity of food used for cooking during the day of monitoring, compared to the attendance of the day. The results are compared with the official ration for each commodity.

7
The low quality of teaching (World Bank SDI report 2012) is potentially one of the factors
which keep the performance of pupils low. This hypothesis should however be further
tested.In turn, this hinders one of the strategic objectives of the program (literacy). The
mid-term evaluation however recognizes that this goes beyond WFP’s mandate and
responsibility.
Internal Factors3 affecting program performance
The late disbursement of Government funds (even two months after it has been
approved) has proven to be one of the greatest hindrances to program implementation.
This affects the HGSMP with even greater implications. This delay is not specific to the
SFP, but affects all other programs implemented jointly by the GoK with other
development partners
An independent state agency, the Teacher Service Commission (TSC), was established
under the Constitution of Kenya to manage human resource within the education sector.
However, the SFP is under the purview of MOEST while all teachers report to the TSC
(which is not represented in the MOEST-led Technical School Feeding Committee)
Several stakeholders agree that there is a low level of collaboration between MOEST and
MoH officials at the county level, negatively affecting program implementation. This
does not reflect their relationship at the national level, where the degree of interaction
is much higher
KI interviews in Garissa and Turkana Counties both revealed that, in practice, MOEST
monitoring does not occur due to lack of funding at County level and that there is low
awareness among MOEST and MoH officials of the joint monitoring mechanism which is
in place with WFP. WFP and MOEST staff conduct joint monitoring at school level once a
term in both WFP supported areas and HGSMP areas. WFP has also donated
motorcycles to various Counties using USDA funds to enhance MOEST’s own monitoring
capacity
KI interviews in Garissa and Turkana counties revealed that SFP training is not done
frequently enough (one per County during the project duration) to accommodate
government staff turnover rates
The schools’ record-keeping capacity is low and school records were found to be
disorganized and missing during the data collection exercise (7 schools out of 48 had
some SMP6 forms missing)
The accountability system established by WFP and the main partners (in particular
MOEST) in case of mismanagement of resources through the use of the
hotline/complaints call is effective.
3 Internal factors are considered those related to the SFP implementing partners, thus including WFP, GoK, MOEST, MoH and other implementing partners.

8
Evaluation Question 4: Program Sustainability
The launch of the HGSMP and the yearly transfer of thousands of pupils from the regular SFP to
the national cash-based model further underscore the Government’s commitment over these
years to take over the program from WFP.
Worthy of mention is also the remarkable relationship between WFP and MOEST, characterized
by mutual trust and respect. This will certainly play a role in the sustainability of the program
going forward. Under the new Country Program (CP), WFP also started working more closely
with Ministry of Agriculture, Livestock And Fisheries (MoALF) through a joint annual work plan.
Best practices
The hand over framework further refined during the current Country Program (2014-2018)
between WFP and the Government of Kenya (GoK) represents one of the key best practices, not
only in Kenya but worldwide.
The WFP complaint and feedback mechanism helpline proved to be quite effective in capturing
and discouraging cases of resources’ mismanagement within the program. The system should
now be extended to all counties.
Lessons learned and recommendations
The following table summarizes the main lessons learned and recommendations presented in
the report:
Table 1: Lessons Learned and Recommendations
Lessons learned
Recommendations
a) Immediate and short-term recommendations (requiring mid-course corrections or initiation of
action)
1. The SFP meal is often the most
substantial meal pupils have during
the day
1a) Consider providing the SFP meal one or two hours
earlier (11am instead of 12.30pm) to address problems of short
term hunger, particularly in counties where breakfast is not
provided (Marsabit, Turkana and West Pokot)
2. Pupils experience significant
threats to their safety in their daily
commute to school (especially in
Nairobi).
2a) WFP and his partners should consider carrying out
community-level sensitization on the threats to pupils’ safety.
SFP stakeholders should also increase awareness on these
topics during the program implementation. Strategic
partnerships with agencies focusing on Child Protection (i.e
Unicef, Plan International, Save the Children etc) would be an
added value in helping reinforcing synergies and
complementarity with the SFP. These interventions should be
prioritized in Nairobi informal settlements.

9
Lessons learned
Recommendations
3. GoK financing flows are not timely
and delay SFP implementation
3a) WFP and the GoK should consider creating a national
and independent entity (which includes the Treasury) to
manage the SFP with the aim of increasing implementing
partners’ involvement and accountability. The institutional
arrangement could be lighter at national level while increasing
the support to county-level structures. A potential disadvantage
of this option is the danger of having another autonomous
agency that doesn’t integrate closely enough with the core
ministries. In this regard, an open discussion to seek a proper
balance is encouraged.
3b) GoK should consider ring-fencing the SFP budget line
to secure funds allocation for the program. In this regard, a
strategy could be to bring the SFP under the National Safety
Net Programs (NSNP). This will enhance coordination; help the
SFP program to work more coherently, efficiently and
effectively with the others Kenya’s safety net programs and in
addition it could ensure a “ring-fenced” budget.
This can be done integrating the SFP with the National Social
Protection Secretariat (and the Council when the bill is
enacted) within the NSNP. MOEST should participate in the
national steering committee and, at Director level, in the
management and technical working groups. Synergies could
be sought by integrating the MOEST data (NIEMIS) into the
social protection single registry for example.
3c) In order to further secure funds for the future
implementation of the SFP program in a sustainable manner, a
scale-up of the current advocacy campaign is recommended
especially targeting the National Assembly Budget Committee,
the Council of Governors and the Treasury. Student Councils
formed at school level could be also involved for an effective
advocacy campaign.
4. Inaccurate methods of distributing
food rations at school level
4a) Provide a unified scoop measure to all supported
schools
5. Increased attendance alone does
not translate into good literacy
outcomes in the arid counties
5a) WFP should continue to synergise and support
activities with partners who are supporting the Government to
address issues related to the quality of education and teaching,
particularly in the context of the two recently launched national
programs – the Global Partnership for Education (GPE) and
Tusome
b) Medium to long-term recommendations
6. Low coordination at county level
between MOEST and MoH
6a) Strengthen county level school committees to support
coordination and implementation and increase accountability
6b) Same as 3a and 3b above.

10
Lessons learned
Recommendations
7. Multiple reporting lines related to
SFP implementation: teachers
report to the TSC and the program
is under MOEST
7a) Strengthen the Technical School Feeding Committee
by involving additional partners (i.e. TSC and the Treasury)
and enlarging its operational budget
8. High staff turnover within schools
and ministries at county level. One
SFP management training per
project cycle may not be effective,
despite the additional
supplementary visits and on-the-job
training carried out by WFP.
8a) Consider increasing the frequency of training,
especially for officials that have not yet been trained in the
context of the SFP.
9. Record keeping and filing within
schools appeared to be a challenge
9a) Engage in capacity building activities at the school
level to strengthen record-keeping and filing practices through
ad –hoc training or during monitoring visits. Consider making
commodity delivery conditional upon reconciled records.
10. Joint monitoring between WFP,
MOEST and MoH is a challenge
due to lack of funds at county level.
In addition, government officials
were not fully aware of the joint
monitoring arrangements in place
with WFP
10a) Strengthen the joint monitoring system by increasing
awareness of it at county level and considering a cost-sharing
mechanism between WFP, MOEST and MoH. Consider
involving additional partners in the joint monitoring scheme.
11. Inflation of enrolment figures 11a) Finalize a common MIS to reflect real-time changes in
school enrolment and attendance figures
12. The WFP helpline/complaint
mechanism proved to be quite
effective in the County where it was
piloted.
12a) GoK should prioritize the implementation of a hotline in
all counties covered by SFP and HGSMP.
c) Recommendations for the final evaluation
Indicator calculations: Consider calculating Indicator 8, the regular attendance of
pupils (where “regular” is defined as a 80% attendance as
per USDA guidelines), based on school records of a
minimum sample of 10 pupils per school;
Consider raising the passing threshold of the safe food
preparation and storage test for cooks from 50% to 80%
(Indicator 32).
Include the Ministry of Agriculture, Livestock And Fisheries
(MoALF) among the Key Informant stakeholders to interview

11
In addition, the evaluation suggests simplified communication channels between WFP Kenya
and USDA (Kenya and Washington offices). In the current set up WFP Washington office to act
as an intermediary for communication between WFP Kenya and USDA.

12
1. Scope of the consultancy
The evaluation covers the period from September 2013 to December 2014. The purpose of the
evaluation is for accountability and program strengthening. As such, the evaluation focussed on
assessing the quality of implementation with an eye to generating recommendations as to how
the program implementation can be enhanced. .
Specifically, the mid-term evaluation:
1. Assessed performance against set targets, determined successes and identified challenges
and areas that need improvement based on the evaluation questions
2. Determined factors that have affected the results and drew lessons and best practices
3. Outlined how these lessons can be applied to inform future interventions
4. Identified changes required to enable the achievement of program objectives and targets
within the established timeframes

13
2. The WFP school feeding program in Kenya
2.1. Overview
The benefits of school feeding programs are widely advocated. Firstly, school feeding aims to
have an effect on pupils’ education and learning in terms of attendance and enrolment
indicators and rates of primary completion (WFP School Feeding Policy 2013, p.13-14). Secondly,
it aims to reduce hunger and increases pupils’ nutritional intake, which in turn leads to
improved educational outcomes. School feeding programs may also have a safety net effect:
they can reduce household expenditures on food and keep children occupied during the day
allowing parents to engage in other livelihood strategies; in addition they can also contribute to
a “reverse flow effect”, whereby the children who complete primary school and continue their
studies later support their household, community and the education of their younger siblings,
thus breaking the cycle of poverty (WFP Impact Evaluation 2010, p.54). School feeding programs
also contribute to closing the gender gap in schools and empowering women by improving their
access to the labour market. Finally, school feeding acts as a platform for creating other socio-
economic benefits.
The quality of the learning environment (including the status of school facilities) and the support
of parents and the community are key factors in the success of school feeding programs. The
positive impacts attributable to school feeding are limited if one views it in isolation from other
interventions. The Impact Evaluation of WFP SFP in Kenya (1999-2008) found that “a school
feeding program which does not systematically incorporate other strategic programmatic
interventions that reduce the economic, social, and cultural constraints to health and learning
will not generate the stated goals and objectives that substantiate and justify school feeding
investments”. Hence inter-institutional and inter-sectoral cooperation and coordination are
crucial factors to its success (WFP Impact Evaluation 2010, p.56).
WFP has been providing school meals in Kenya since 1980, addressing food insecurity and
boosting educational indicators. At its peak in 2007, the SFP benefited 1.85 million children. In
2009 the Government of Kenya launched the national HGSMP, managed and financed by the
Ministry of Education, Science and Technology (MOEST), which gradually started taking over
some of the semi-arid areas of the country which were previously covered by WFP, and now
moving to the arid areas with one arid County (Isiolo) transitioned to the Government led
HGSMP.
According to the WFP Country Program 2014-18 (p. 11) and considering the transitional cash
transfer (CT) to schools in Samburu County, the SFP currently provides schools meals to 791,000
children in all public schools in the arid lands and in targeted schools in the informal settlements
of Nairobi, where food insecurity continues to be widespread and education indicators are
below the national average. WFP also prioritizes capacity development of the Government to
manage and extend the HGSMP to the arid lands.

14
For arid Counties SFP covers 100% of all public pre- primary and primary schools. However, it is
worth noting that in 2016, all pre-primaries will be handed over to the County Government as
this is a devolved function of the County Government as per the new Constitution.
In Nairobi, schools benefiting from the feeding program must meet targeting criteria agreed
jointly by WFP, FTC, NCG and MOEST, particularly because the program also benefits informal
schools. The program currently only supports a total of 92 primary schools (65 public and 27
informal schools). The targeting criteria used in Nairobi include: a) the school must be a -profit
entity; b) the school should be registered by a recognized government agency (MOEST or
Ministry of Gender, Children and Social Development); c) the school should follow the national
curriculum and at least one third of the primary school-level teachers are trained and registered
with TSC (as per the APBET guidelines); d) the school can only charge levies that are equal to or
below 3, 600 shillings per term, inclusive of all costs, with no levies formally charged for school
meals; e) the school must have the necessary structures for food storage and meals preparation;
vi) the school must have a Board of Management (drawn as per the Education Act); f) the school
should not be receiving school feeding support from other donors; g) the school has been in
existence for at least 5 years and has at least 200 pupils enrolled at the time of incorporation
into the school feeding program.
Regular hot mid-day meals are provided in primary and pre-primary schools for a total of 195
school days per year. Primary school pupils receive a lunch of 198grams comprising 150 grams
of cereals, 40 grams of pulses, 5 grams of fortified vegetable oil and 3 grams of iodized salt
which accounts for 30 percent of the recommended daily energy intake, providing around
703.25 kCal of energy (Arid Lands Strategy 2013, p.68). Pre-primary children receive a smaller
meal of 128 grams, comprising 100 grams of cereals, 20 grams of pulses, 5 grams of fortified
vegetable oil and 3 grams of iodized salt (WFP Country Program 2014-18, p.11). In addition, the
pre-primary school pupils also receive a morning porridge made from SuperCereal.
WFP conducts monitoring of SFP performance on a monthly basis in 10 percent of the
supported schools. During these visits, WFP staff do on-the-job-training on aspects that need
strengthening.
Commodities are transported by WFP from Mombasa port to the DEO warehouse at county
level. The GoK (through MOEST) is then in charge of the secondary transport up to school level.
For Nairobi informal settlements, the administrative structure is different, since the coverage of
informal schools was not agreed with the GoK. In this case WFP has an agreement with an
international NGO called Feed the Children (FTC) whereby WFP delivers the commodities in
their Nairobi warehouse and then FTC delivers the commodities to the schools.
The decision-making structure is represented by the Technical School Feeding Committee which
is chaired by MOEST and partners meet to deliberate on SFP and HGSMP issues. Partners
include MOEST, MOH, MOALF, WFP, PCD, SNV.

15
The United States Department of Agriculture (USDA) manages the McGovern-Dole Food for
Education program (MGD), a major funding mechanism for school feeding worldwide. The MGD
program aims to reduce hunger and improve literacy and primary education and has recently
incorporated goals related to boosting teacher attendance and capacity and students’ academic
performance. The program provides US-produced agricultural commodities and financial
assistance and supports capacity development and enhanced monitoring and reporting.
Sustainability of the program is a key consideration for USDA and grantees are expected to work
to support local ownership, at the government and community levels.
McGovern-Dole is one of the most long-standing donors to the SFP in Kenya. Its most recent
contribution of US$20million supports the SFP during the period 2013-2015. Under this
agreement USDA intends to provide about 3,770 MT of split yellow peas, 540 MT of vegetable
oil and 14,700 MT of bulgar. This period spans two WFP Country Programs (CPs). During the
design of the new CP, there were many decisions made with the GoK, which altered plans and
sequencing of the SFP program.
The key goals of the WFP-USDA agreement, as stated in the Project Level Framework, are two:
1) improved literacy of school-age children and 2) increased use of health and dietary practices.
The first objective has three outcomes: improved quality of teaching (through more consistent
teacher attendance, improved literacy instructional materials and increased knowledge and
skills of teachers), improved student attentiveness and higher attendance. The second objective
focuses on improving the knowledge of health, hygiene, safe food preparation and storage
practices, increasing knowledge of nutrition, increasing access to clean water and sanitation
services, and increased access to food and storage tools and equipment.
WFP had originally requested US$ 30,624,996, including commodity costs (approximately $21
million) and associated costs (approximately $10 million, including $500,000 for M&E and
$300,000 for capacity building) over a three year period. The $20 million agreement between
USDA and WFP was signed in September 2013 while the food commodities arrived between
January and March 2014. This caused some delays in the consignment related to Term 1 for the
year 2014.
Through this support, WFP provides school meals, raises awareness on the importance of
education, trains stakeholders on appropriate food preparation and storage practices and
supports capacity building. The objectives of MGD support include boosting pupils’ enrolment,
attendance, literacy and attentiveness, reducing short term hunger and guaranteeing access to
food for school children. The project also aims to enhance teacher attendance, spread
awareness on the benefits of education among the community, engage local organizations and
community groups, increase knowledge about safe food preparation and storage and provide
equipment for this purpose. Finally, to ensure sustainability, the objectives include building
government capacity and improving the policy and regulatory framework in support of child
health and nutrition.

16
2.2. Handover process
In 2009 the Government of Kenya launched the HGSMP to increase national ownership and
sustainability of the program and initially took over 540,000 pupils from selected semi-arid
counties. In subsequent years, about 60,000 pupils were transferred to the HGSMP annually,
reaching a total of 760,000 pupils by the end of 2013. The new WFP Country Program 2014-
2018 introduced further changes defining, among others, the handover of pre-schools, the
transition strategy for all Counties, the transition period through Cash Transfer before handing
over.
The national HGSMP is based on a cash transfer (CT) model in which schools in semi-arid areas
locally procure the food for the daily meals based on a fixed rate per meal (KES 10). The recent
WFP pilot project of cash transfers to schools in arid counties (2013/14) tested a strategy to
strengthen and expand the HGSMP model into the arid lands of Kenya. The pilot established a
three-band system in Isiolo County with transfer values between KES 10-12, to account for the
higher costs brought about by the schools’ distance from the nearby markets (DFATD 2015,
p.11). Even though the HGSMP implementation is still being refined, it provides a series of
additional benefits compared to the regular SFP. Firstly, CTs are, in general, more cost-efficient.
In-kind contributions are more expensive than contributions provided in cash-for-food
purchases. The External Evaluation of WFP’s Cash Transfers to Schools Pilot Project found that
“the cost of providing cash to schools directly was 76 percent of the cost of providing in-kind
assistance” (DFATD 2015, p.39). Secondly, the HGSMP has the potential to increase integration
of the community around the education of its children by creating opportunities for increased
community participation. It also creates a fixed and predictable demand for substantial
quantities of food, thus stimulating the local economy, and it helps to introduce a wider range of
fresh commodities within the SFP meal (WFP Impact Evaluation 2010, p.49).
A joint strategy (2013) was developed by WFP and MOEST for strengthening and expanding the
HGSMP into the arid lands of Kenya, which present additional challenges for program
implementation when compared to the semi-arid counties, including poor transportation
networks and inferior school infrastructure facilities. As of January 2013, all of Kenya’s semi-arid
areas had been handed over to the government. Isiolo County was the first arid county that
transitioned completely to the HGSMP in January 2015, following one year of CTs implemented
by WFP. Samburu County is currently undergoing the one year WFP-supported transition to the
CT model and will shift to the HGSMP in January 2016. Plans have been made for the handover
of the other arid counties over the next three years, until the current WFP Country Program
ends in 2018. The full handover of the Early Childhood Development centres (ECDC) is
anticipated to take place by 2016. The CT model should be introduced in the Nairobi informal
settlement schools in September 2015; however, the final handover date for these schools to
the HGSMP has yet to be determined because of different administrative arrangements for
urban schools in Kenya. At the current rate of transition, the expected coverage of the SFP in
2018 is approximately 410,000 pupils under the in-kind program and 83,000 pupils under the
transitory CT model for a total of 493,000 pupils (WFP Country Program 2014-18, p.11).

17
3. Survey Plan
3.1. Methodology
The methodology used for this mid-term evaluation involved the use of mixed methods and
triangulation of primary qualitative and quantitative data with secondary data from different
sources to enhance the reliability of findings. The quantitative data was collected from 48
primary schools in the six sampled Counties (Garissa, Marsabit, Nairobi, Tana River, Turkana,
West Pokot) while the qualitative data was collected both at the county level and at the national
level through Key Informant (KI) interviews.
The mid-term evaluation covered the period from September 2013 to December 2014
(academic year 2014).
Eight schools per county were selected for a total of 48 schools. The study selected the same
schools from the baseline and the remaining schools were selected through systematic random
sampling. For more information about the sampling strategy and details about training to
enumerators please see Annex 8.
The data collected was used to calculate the 33 specific USDA MGD performance indicators and
conduct a comparative analysis with the baseline findings4. Please refer to Annex 4 for the list of
performance indicators, their mid-term values and how they were calculated.
3.1.1. Secondary data
In addition to collecting primary data, the evaluation team also carried out a literature review of
secondary data. The majority of this data was obtained from WFP (including monitoring data)
and MOEST data. For the Nairobi informal settlement schools, secondary data was retrieved
from Feed the Children (FTC).
The key documents that were reviewed include: the WFP Country Program 2014-18; the WFP
School Feeding Policy; previous evaluation reports of the Kenya SFP; the baseline report and
Kenya national child health and nutrition polices and guidelines (please see Annex 1 for the
Bibliography).
3.1.2. Quantitative data
Quantitative data was collected at county level in each of the sampled schools using six types of
questionnaire (please refer to Annex 7):
4 Three indicators were only included during this mid-line survey and these indicators cannot, therefore be compared with
baseline estimates.

18
School Questionnaire, administered to the school’s head teacher, which also collected
data from the school records
Teacher Questionnaire, administered to a teacher from each class
Cook Questionnaire, administered to the Cook which also included the Safe Food
Preparation and Storage Test that was administered during the Baseline
Storekeeper Questionnaire, administered to the person responsible for the storage of
SFP food
Pupil Questionnaire, administered to ten randomly selected pupils across the school;
and
Household Questionnaire, administered to the ten parents of the randomly selected
pupils (one parent per pupil).
These Questionnaires were administered by a team of trained enumerators in the six sampled
counties using tablets and ki-projectsTM (Kimetrica software). Two enumerators per county
carried out the data collection exercise.
Data collected at school level included the following:
Enrolment and attendance figures, number of meals provided each day during the
academic year 2014
Average daily portion of food provided to pupils
Weight of food rations to 10 randomly selected student per school
Performance of pupils
Total commodity tonnage received by WFP
Delivery dates of the food, data on community and government contributions (cash,
additional food items, water, firewood and cooking utensils)
Overall school performance and the impact the SFP has on it
Pupils’ attentiveness.
In addition, crosscutting WFP indicators were calculated (physical and/or emotional threats and
safety of the pupil).
3.1.3. Qualitative data
Kimetrica also collected qualitative data at different levels: in the sampled schools through
interviews with teachers and parents; through KI interviews in Garissa and Turkana Counties;
and through KI interviews with several SFP stakeholders in Nairobi (please refer to Annex 6 for
the list of interviewees). All KI interviews were guided by pre-defined checklists and were used
to triangulate findings from the quantitative data (please refer to Annex 7).
At the school level, head teachers, teachers and parents were asked qualitative questions
regarding the lessons learnt and recommendations to improve the SFP program. These findings
reflect those emerging from the analysis of primary and secondary data.

19
Key informant interviews were also carried out in Garissa and Turkana with a range of different
stakeholders. These interviews aimed to identify best practices, the main challenges and lessons
learnt of the program, as well as avenues for improving it and making it more sustainable, in
particular through the handover to the HGSMP. The stakeholders interviewed included WFP
Field Officers, education officials (DEOs, the County Director for Education (CDE), the School
Meals Program Officer (SMPO), representatives from the Teachers Service Commission (TSC))
and health officials (Public Health Officers (PHOs)).
Several SFP stakeholders were also interviewed in Nairobi during April and May 2015. These
included WFP Officials, Unicef, USDA (Nairobi and Washington), DFATD-Canada, City Education
Department, FTC, MOEST & MoH officials, SNV, PCD, Evidence Action.
3.2. Key evaluation questions
The evaluation questions are structured around four main categories:
Strategy of the program
Program performance at mid-term
Factors affecting the results
Sustainability of the program.
Design of the data collection tools was informed by the following evaluation questions,
according to which findings will be presented in Section 4. Particular attention was given to
gender disaggregation.
Strategy of the program
1. Is the program relevant to children’s needs and national government policies and
strategies?
2. Was it designed to complement and be coherent with the work of major partners in the
field, including the government and non-governmental organizations (NGOs) working on
school health, nutrition and school feeding?
3. Was it designed to reach the right people with the right type of assistance?
Program performance at mid-term
1. What were the outputs and progress towards outcomes (insofar as these can be assessed at
the mid-term point)?
2. How efficient is the program, in terms of transfer cost, cost per beneficiary, logistics and
timeliness of delivery?
3. Has the right quantity and quality of assistance reached the right beneficiaries, at the right
time? Particular attention will be given to gender disaggregation.

20
Factors affecting the results
1. Which external factors outside the project implementers’ control have affected the results
(e.g. outbreak of conflict, change in government policy, changes in funding levels, etc.)?
2. Which internal5 factors within project implementers’ control have affected the results (e.g.
management, delivery mechanisms and systems, coherence between plans and resources
available, link of monitoring system to decision-making processes, partnerships, etc.)?
Sustainability of the program
1. To what extent is the government taking ownership of, demonstrating commitment and
contributing to the program?
2. What is the level of national readiness and capacity at central and sub-national levels to
implement the program?
l
5 The mid-term evaluation considers “internal” any factors related to the SFP implementing partners, thus including WFP,
GoK, MOEST, MoH and other implementing partners

21
4. Findings
This section presents the findings of the mid-term evaluation according to the key evaluation
questions.
It should be noted that although this is an evaluation of USDA MGD funds and given that the SFP
is a multi-donor program, it is difficult to attribute results to specific donor contributions. The
findings presented in this section should therefore be seen as a result of multiple donor efforts.
4.1. Strategy of the program
The relevance and importance of the WFP-supported SFP to children’s needs was confirmed at
Nairobi level through various stakeholders KI interviews and at the County level, through
interviews with MOEST and MoH officials, and within sampled schools through interviews with
head teachers, teachers and parents.
Both the KI interviews and the data collected in the field confirm that the SFP is extremely
relevant to children’s needs, as it targets all schools in the arid lands and provides about a third
of pupils’ daily nutritional intake.
Our primary data collection found that eight percent of pupils interviewed had not had an
evening meal in the preceding five school days. Moreover, 56.1 percent of parents reduce the
portions of the evening meal when lunch is provided in schools. This percentage is particularly
high in Marsabit. This means that for many pupils in the arid lands, the SFP meal is the most
substantial meal they have during the day and this affects pupils’ net benefit.
Several stakeholders agree that the provision of school meals directly influences pupils’ daily
attendance. Ninety-one percent of teachers interviewed believe that school attendance would
drop drastically (over 30 percent) if meals were no longer provided. KI interviews in Turkana for
example, mentioned that in the region children will not go to school unless they see smoke
coming from the school kitchen, signalling the preparation of food.
Some other key indicators calculated from primary and secondary data sources (covered in
more detail through the key indicators in Section 4.2.1) that further reinforce the relevance of
the program are as follows:
The main reason cited by teachers for pupils’ inattentiveness was hunger. Therefore
pupils’ attentiveness tends to decrease as pupils get hungry; this coincides with the days
when school meals are not provided (in most cases a consequence of late delivery).
The percentage of students who regularly attend school (at least 80 percent of the time)
is about 70 percent while on average 88 percent of the enrolled students attend school.
The percentage of students regularly consuming meals varies between 70 percent and
80 percent (the difference is mainly caused by late delivery to schools, security and, to
some extent, teachers’ strikes).
22
In regard to the relevance to the national government policies, the mid-term evaluation
confirmed that the SFP fits within and adheres to existing national government policies and
strategies. In particular, the SFP is based on the right to nutrition, as outlined in the new
Constitution of Kenya (2010). The SFP is also aligned with several Kenyan policies, including the
National School Health Policy (2009), the National Food and Nutrition Security Policy (2011), the
National Social Protection Policy (2011) and the Basic Education Act (2013) to name a few.
Findings from the mid-term evaluation confirm that the program was designed to complement
and be coherent with the work of major partners, including the government and NGOs. Firstly,
given the GoK’s high level of commitment and the involvement of several ministries including
MOEST, MoH and MoALF, the program implementation is cohesive with government policies.
Secondly, the SFP complements the work of other partners working in the fields of education,
health and water, sanitation and hygiene (WaSH) and de-worming. In addition to FTC (the
implementing partner for the SFP in the Nairobi informal settlements), three NGOs (Evidence
Action, The Netherlands Development Organization (SNV) and Partnership for Child
Development (PCD)) and UNICEF were interviewed in the mid-term evaluation. All these
organizations engage in complementary activities and projects that enhance the effectiveness
and impact of the SFP as shown below. This is in line with the WFP School Feeding Policy (2013)
which encourages linkages with other interventions in order to enhance the impact of the SFP.
Evidence Action was established in 2013 to take on two of Innovations for Poverty Action’s
projects: deworming and the dispensers for safe water. EA works with MOEST's School Health,
Nutrition and Meals program in the context of the National School-Based Deworming Program
in primary schools of Kenya. The deworming program covers 27 counties and coverage is
determined based on the prevalence of worms. Among the sampled counties, Garissa and Tana
River were included in the program. However, KI interviews with WFP officials in Garissa
indicated the need to re-introduce the deworming program in the counties signifying that the
respondents were not aware of deworming activities going in the county. This may require
further understanding. In any case, deworming is widely recognized to have a positive impact on
the SFP by maximizing the children’s nutrient intake. The 27 counties being covered by the EA
deworming program represent areas with the highest need for this intervention and good
overall coverage (almost 60 percent of the counties). This seems adequate to create synergy
between EA and the SFP.
SNV supports the HGSMP in the areas of procurement and governance. It also supports farmers
in accessing school markets, ensuring that procurement procedures are farmer-friendly and the
community is engaged. SNV is also one of the members of the national level Technical School
Feeding Committee, along with WFP and other partners. SNV thus works with WFP to
strengthen the government’s and local structures’ capacity to implement the HGSMP.
PCD is also part of the Technical School Feeding Committee, playing an advisory role and
working with WFP and other partners to provide capacity building and support to the program.
PCD was also a strong partner in the development of the National School Health Policy.

23
UNICEF is active within both the Education and WaSH sectors. Within the Education sector,
UNICEF works in close collaboration with the GoK at policy level and works in synergy with WFP
within the UNDAF framework. In particular, UNICEF is working with the GoK to update the
current national curriculum, an essential step to improve the quality of teaching and pupils’
learning experience. WFP is supporting this process and providing inputs to the review of the
national curriculum. UNICEF also aims to increase enrolment, through awareness campaigns
sensitizing communities about the importance of education and increasing literacy under the
GPE program. UNICEF is also active in the WaSH sector, providing toilets and running water at
school level. In addition, the Tusome program, funded by USAID, aims at increasing the pupils’
literacy rate. These activities complement the SFP and contribute to increasing its overall
impact.
In regard to the program reaching the right people with the right type of assistance, the SFP
currently targets the most food insecure areas of Kenya with the lowest educational indicators.
KI interviews (at both Nairobi and County level) have confirmed that the program beneficiaries
do indeed rely on the support provided. The program is inclusive, as it covers all public schools
in the targeted counties and selected schools in the Nairobi informal settlements that meet the
basic requirements for participation in the program. Based on this, the mid-term evaluation
confirmed that the program reaches the right people.
Considering that the SFP is designed to provide a basic basket of commodities covering 30
percent of pupils’ daily energy intake and considering that the program is well complemented
with other programs (as shown above), Kimetrica found the SFP to provide the right type of
assistance.
In theory, the community and the schools are meant to contribute additional fresh food items to
expand the food basket’s nutritional value. This is particularly challenging in the ASALs, where
food insecurity is high. Notwithstanding, based on our primary data, the challenging situation,
non-food items contributions to the program were found to be very high in the sampled
schools: at least 87 percent of schools provided water, firewood, cooking utensils, cleaning
products and plates for children in 2014. Remarkably, observations during the survey
implementation showed that two schools in Turkana also provided vegetables.
Worthy of mention is the excellent relationship that was developed between MOEST and WFP
over the years.

24
4.2. Program performance at mid-term
Please note that given the short time interval between the baseline and mid-term surveys, care
should be taken in determining causality for changes in the indicator values.
4.2.1. Outputs and progress towards outcomes
This section evaluates the SFP program performance based on the 33 performance indicators
jointly identified by WFP and USDA (please refer to Annex 4 for the detailed results presented in
table format). In addition to the 30 indicators used during the baseline survey, WFP accepted
USDA’s suggestion to add three indicators for this mid-term evaluation. It should be noted that
the baseline was conducted only a year ago and therefore the time interval is quite short to
establish measurable improvements for some of the indicators.
Figure 2 shows some of the key indicators measured during this mid-term evaluation and their
improvements from the baseline survey.
Figure 2: Program Performance at Mid-Term
MGD SO 1: Improved literacy of school age children
Indicator 1 - Proportion of students who by the end of two grades of primary schooling,
demonstrate that they can read and understand the meaning of grade level text.
Administering a comprehensive literacy test was not feasible within the scope of this
consultancy. The MOEST also discouraged this approach. However, UWEZO released an updated
report for the year 2014, providing a good comparison point for the UWEZO report 2012 that
had been used during the baseline report. The baseline survey recorded a value of between 33.8
percent (Samburu) and 62.6 percent (Baringo). On average, at national level the test pass rate
for children aged 10-16 at national level is 68 percent for numeracy skills, 78 percent for literacy
0%10%20%30%40%50%60%70%80%90%
100%
Attendance Percent ofstudents
identified asinattentive bytheir teachers
Teachersattending atleast 90% ofschool days
Communityknowledge of
the benefits ofeducation
Improved foodpreparation
Improvedstorage
procedures
Percent ofcooks passingthe test (50%
threshold)
Program Performance at Mid-Term
Baseline Survey Mid-Term Evaluation

25
and 64 percent for the two skills combined. The difference in the mean pass rate between the
top and bottom districts is quite large (nearly 70 percent). Mandera West and Central, Wajr,
Laisamis (Marsabit) and Turkana North recorded the lowest pass rate (between 17 and 23).
Samburu East scored 30.6 percent while Baringo scored 63.7 percent. Mandera East scored
71.4 percent.
As mentioned by the UWEZO assessment, the results have not significantly changed since 2009.
The poor results are further confirmed when compared with the SDI report (2012) and the KCPE
results collected from the sampled schools: 188.21(from our survey) and 234.94 (MOEST data
2013) compared to the national average performance of 250.05).
Indicator 2 - Number of total individuals benefiting directly from USDA-funded interventions.
Based on information provided by WFP, the SFP reached 753,139 direct beneficiaries in 2014.
The baseline figure was higher (767,108) and this difference is accounted for by the fact that
WFP handed over pupils to the HGSMP and in 2012/2013 WFP stopped providing food to
satellite ECDCs that were not officially registered by the Ministry of Education. This was to
ensure school feeding support was provided to educational institutions and not to informal
‘feeding centres’ established ad-hoc.
Indicator 3 - Number of indirect beneficiaries supported by USDA-funded interventions.
The mid-term survey used the same methodology that was adopted for the baseline survey. This
was done by identifying the number of households benefiting from school meals (the average
number of school-going children per household is 2.84 as established by the primary data
collection), and then multiplying this number by the difference between the average household
size of six minus the average number of school going children. For 2014 this yielded a result of
838,0006 indirect beneficiaries, compared with 536,758 in 2013.
MGD 1.1.1: More consistent teacher attendance
Indicator 4 - Percent of teachers in target schools who attend school and teach at least 90
percent of scheduled school days per year.
This indicator was calculated through primary data. This indicator improved from 51 percent in
2013 to 74.8 percent in 2014. Nairobi and Turkana counties achieved exceptionally high values
for this indicator (97.7 percent and 98.6 percent respectively) while Garissa County showed a
poor performance (42.2 percent). Security in Garissa is one of the main variables explaining this
disparity.
6 The survey revealed that on average 2.84 children per household are going to school. Household average size is 6, i.e. an average of 3.16 household members indirectly benefit from the program. The number of households is identified by dividing the total number of direct beneficiaries by 2.84 (753,139 / 2.84 = 265,190 HHs). The number of indirect beneficiaries is calculated by multiplying the number of households by 3.16 (266,190 x 3.16 = 838,000).

26
Figure 3: Percent of teachers attending at least 90% of scheduled days
General attendance of teachers was 88.8 percent on average, and during the three-day survey it
was slightly lower at 81.9 percent. This is roughly in line with the World Bank’s SDI report where
teachers’ absence from public schools was 16.4 percent in 2012.
Indicator 5 - Number of MOEST officers trained in promoting consistent teacher attendance
Indicator 5 was calculated from the WFP Training Reports and triangulated with information
from MOEST and WFP KI interviews. In 2014, a total of 200 MOEST officers were trained on SFP
management and promoting consistent teacher attendance, thus achieving the target value of
200 trainees.
Indicator 6 – Number of trainings in promoting teacher attendance conducted for MOEST
officers
Indicator 6 was calculated from the WFP Training Reports and triangulated with information
from the MOEST and WFP KI interviews. A total of seventeen (17) trainings sessions in six
counties were carried out in 2014 (East Pokot, Garissa, Marsabit, Tana River, West Pokot and
Samburu Counties). This exceeded the target value of four (4) trainings.
MGD 1.2: Improved attentiveness
Indicator 7 – Percent of students in classrooms identified as inattentive by their teachers
This indicator was calculated through the teachers’ questionnaire. The 2014 value for indicator 7
remained unchanged from the baseline value of 20 percent. The main reason cited by teachers
for pupils’ inattentiveness was hunger. This is mainly attributable to missed school meals,
especially at the beginning of the term due to late delivery by MOEST at County level as
mentioned earlier (for more details please see indicator 16). Results at county level showed that
42.20%
87.03%
97.70%
68.30%
98.60%
76.60%
0%
10%
20%
30%
40%
50%
60%
70%
80%
90%
100%
Garissa Marsabit Nairobi Tana River Turkana West Pokot

27
the level of inattentiveness differs between counties. West Pokot and Marsabit have the highest
percentage of inattentiveness, whilst, surprisingly, Garissa has the lowest rate.
Figure 4: Percent of students identified as inattentive
MGD 1.3: Improved student attendance
Indicator 8 – Percent of students (girls/boys) regularly attending supported schools
WFP monitoring data revealed that percentage of girls and boys regularly attending supported
schools is 88 percent, which is higher than the aggregated baseline value of 85.6 percent.
According to USDA guidelines, “regularly” attending implies a minimum attendance rate of 80
percent.
This evaluation calculated the percentage of students regularly attending school (at least 80
percent of school time) by collecting data on the annual school attendance of 10 randomly
selected pupils per school. Using this methodology, the values drop down to 72.5 percent ( 73
percent for girls and 72 percent for boys). Kimetrica recommends considering these values for
comparison purposes during the end-line survey.
This discrepancy compared to the WFP data is attributable to three main reasons:
1. Different calculation of the indicator between baseline and mid-term survey: During the
mid-line survey this indicator was measured through interviews carried out with 10
sampled pupils selected in each school where their annual records of attendance were
traced back. This is the most accurate way to be able to calculate regular attendance
(above 80 percent of school days). During the baseline survey, this methodology was not
used and WFP data was used instead reporting “the attendance rate for assisted schools”.
WFP collects data on attendance and enrolment observed during the monitoring missions.
The value at baseline thus is likely to have reported the general attendance rate of
11.95%
25.26%
15.58%
19.87% 20.73%
26.37%
0%
5%
10%
15%
20%
25%
30%
Garissa Marsabit Nairobi Tana River Turkana West Pokot
Percent of students identified as inattentive by their teachers
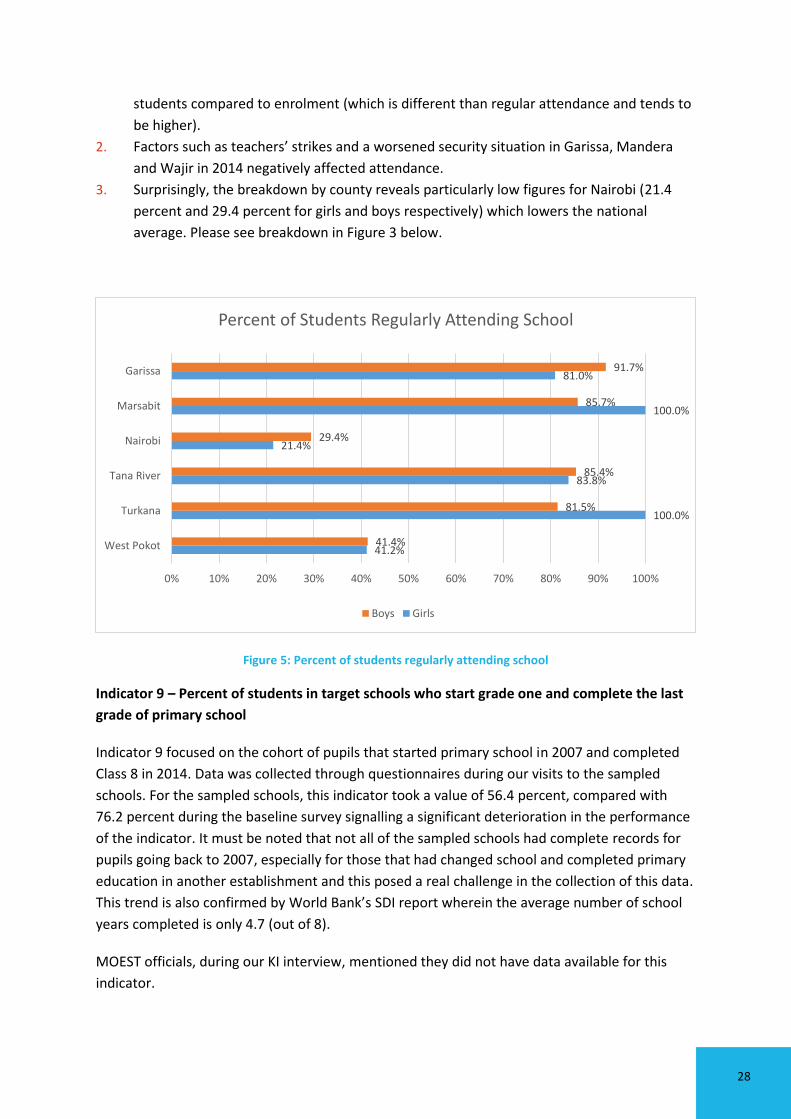
28
students compared to enrolment (which is different than regular attendance and tends to
be higher).
2. Factors such as teachers’ strikes and a worsened security situation in Garissa, Mandera
and Wajir in 2014 negatively affected attendance.
3. Surprisingly, the breakdown by county reveals particularly low figures for Nairobi (21.4
percent and 29.4 percent for girls and boys respectively) which lowers the national
average. Please see breakdown in Figure 3 below.
Figure 5: Percent of students regularly attending school
Indicator 9 – Percent of students in target schools who start grade one and complete the last
grade of primary school
Indicator 9 focused on the cohort of pupils that started primary school in 2007 and completed
Class 8 in 2014. Data was collected through questionnaires during our visits to the sampled
schools. For the sampled schools, this indicator took a value of 56.4 percent, compared with
76.2 percent during the baseline survey signalling a significant deterioration in the performance
of the indicator. It must be noted that not all of the sampled schools had complete records for
pupils going back to 2007, especially for those that had changed school and completed primary
education in another establishment and this posed a real challenge in the collection of this data.
This trend is also confirmed by World Bank’s SDI report wherein the average number of school
years completed is only 4.7 (out of 8).
MOEST officials, during our KI interview, mentioned they did not have data available for this
indicator.
41.2%
100.0%
83.8%
21.4%
100.0%
81.0%
41.4%
81.5%
85.4%
29.4%
85.7%
91.7%
0% 10% 20% 30% 40% 50% 60% 70% 80% 90% 100%
West Pokot
Turkana
Tana River
Nairobi
Marsabit
Garissa
Percent of Students Regularly Attending School
Boys Girls

29
MGD 1.3.4: Increased student enrolment
Indicator 10 – Percent increase in girls enrolled in schools
Indicator 11 – Percent increase in boys enrolled in schools
Indicators 10 and 11 measure the percentage increase in girls and boys enrolled in schools.
During the baseline, both indicators had a value of three percent and were calculated using
MOEST/WFT data.
For this study, we used survey primary data and calculated the difference in enrolment from
2013 to 2014 as a percentage of the 2013 enrolment for each school, and then we calculated
the average percentage increase across sampled schools. For 2014, the percentage increase in
primary school girls and boys enrolled were 7.7 percent and 9.4 percent respectively while for
pre-primary pupils the values are 2.7 percent and 7.4 percent respectively.
An analysis of WFP data reveals that the percentage increase for girl is quite similar to one
found in the study (8 against 7.7 percent) while for boys the percentage drops by more than half
(4 against 9.4 percent).
If we consider the changes in enrolment for primary school children, the SFP has in any case
definitely performed better compared with the baseline year.
Finally, data was also collected from MOEST on the Net Enrolment Ratio (NER)7 for the sampled
counties and for the national average in 2014. The average value across the sampled counties
was 61.7 percent, which is significantly lower than the national average of 84.2 percent (with
Garissa and Turkana counties performing particularly poorly with 39.9 percent and 54.4 percent
respectively).
Indicator 12 – Number of events, radio spots and campaigns held
Indicator 13 – Number of community members benefiting from events, radio spots, and
campaigns held
Indicators 12 and 13 were calculated from secondary data received by WFP. In 2014, 20 radio
spots were held. This indicator did not meet its target value of 44. Indicator 13 measures the
number of community members benefiting from events, radio spots and campaigns held which
7 UNESCO defines the NER as “Enrolment of the official age group for a given level of education expressed as a percentage
of the corresponding population” (UNESCO 2009, p.10).

30
amounted to 65,2048. Unlike indicator 12, it greatly surpasses its target for 2014 which was of
8,800 people.
While the number of events was below the target, the means used by WFP still enabled the
campaign to reach more people than originally targeted.
MGD 1.3.5: Increased community understanding of benefits of education
Indicator 14 – Percent of parents in target communities who can name at least three benefits
of primary education
Kimetrica used a pre-defined standard list of education benefits to evaluate this indicator and
data was collected through the school questionnaire. However, during the baseline the question
was left open, so the methodology used for calculating indicator 14 was consistent with the
baseline survey.9 Data from Garissa was not included in the analysis since enumerators
misinterpreted the way they were supposed to ask the related question. On average, 87.8
percent of the parents interviewed could name at least three benefits of primary education. At
the baseline, the value of this indicator was 66 percent.
MGD 1.2.1: Reduced short-term hunger
Indicator 15 - Percent of students in target schools who regularly consume a meal before the
school day
The value for indicator 15 amounted to 59.1 percent. Turkana and West Pokot counties
performed particularly poorly, with 24.3 percent and 36.2 percent, respectively. This indicator
was measured during the primary data collection by asking pupils whether they had eaten a
meal before the school day in the past 5 working days (their answer qualified only if it was five)
and was then triangulated with information collected during the parent interviews (only 49.3
percent of parents said that their child had had breakfast in the past 5 days). This indicator
compares favourably with the baseline value (41 percent).
8 This number was obtained summing up 35,000 community members reached through 20 radio spots in Kiswahili and Maa
local dialects through Kenya Broadcasting Corporation, 29,428 people in Mandera, 447 in Samburu and 329 in Isiolo sensitized on hotline issues. 9
For the pre-defined standard list of education benefits please refer to Section 4 of the Household Questionnaire in Annex 7.
The list includes the following: 1) Improved literacy rate; 2) social skill development; 3) increased ability to learn new
skills, (adoption of technology); 4) girls remain more in school and early marriages are delayed; 5) improved cohesion in the community; 6) help to break the cycle of poverty; 7) Increased chances of the pupils' future economic self-reliance; 8) through girls' education, improved general wellbeing of households (nutrition, health etc).

31
Figure 6: Percent of students who regularly consume a meal before the school day
As for the Corn-Soya Blend (CSB), even though all pre-primary pupils received it when it was
available, the survey found (through the SMP6 form) that in 2014 it was only provided on 38
percent of school feeding days. The main reason for this is explained by the lower quantity of
CSB received by WFP (due to insufficient funding) compared to the quantity planned. WFP in
fact planned 591mt of CSB but received and distributed only 388mt (66 percent of the planned
quantity).
These poor results are further corroborated by the fact that more than 50 percent of parents
(56.1 percent) reduce the portions of the evening meal when lunch is provided in schools. This
percentage is particularly high in Marsabit while Nairobi performs slightly better (44 percent).
This has a negative effect on the overall nutritional status of the pupils.
Indicator 16 - Percent of students in target schools who regularly consume a meal during the
school day
Indicator 16 measures the percentage of students in target schools who regularly consume a
meal during the school day. This indicator value was determined using data from the SMP 6
forms from each of the sampled schools. The analysis calculated the percentage of school
feeding days for which food was actually provided in 2014 across the sampled schools. It was
found that 68.1 percent of students regularly consumed a meal during the school day. This value
falls slightly below the baseline value of 70 percent. The percentages of school feeding days in
2014 as reported in the SMP 6 forms in each county were: Garissa: 66.1 percent, Marsabit: 69.8
percent, Nairobi: 75.7 percent, Tana River: 50.9 percent, Turkana: 71.6 percent and West Pokot:
74.6 percent.
If we consider WFP monitoring data for 2014 (which assessed all arid Counties under the SFP
program), this figure increases to 76 percent. The values for some of the counties were similar
to those found by the mid-term evaluation (Garissa: 50 percent, Marsabit: 69 percent and
78.80% 78.80%
54.10%
73.80%
24.30%
36.20%
0%
10%
20%
30%
40%
50%
60%
70%
80%
90%
100%
Garissa Marsabit Nairobi Tana River Turkana West Pokot
Percent of students who regularly consume a meal before the school day

32
Turkana: 65 percent), while others were higher (94 percent in Nairobi, 74 percent in Tana River
and 66 percent for West Pokot).
Figure 7 shows the percentage of students who regularly consume a meal during the school
days. The values marked as “SMP6 data” were collected during this survey from the sampled
schools; those marked as “WFP data” correspond to WFP monitoring data for all schools in the
sampled counties.
Figure 7: Percentage of students who regularly consume a meal during the school day
The main reasons attributable to the proportion of days during which children did not have food
are as follows:
Late delivery of food at school level by MOEST due to delays in paying the transporters
Security issues, especially in Counties like Garissa, Pokot, Wajir and Mandera
Teacher strikes that occurred during 2014 resulting in school closure (the survey
however did not collect data to verify if food were distributed to pupils during the
strikes).
MGD 1.2.1.1 : Increased access to food (school feeding)
Indicator 17 - Number of daily school meals (breakfast, snack, lunch) provided as a result of
USDA assistance.
74.6%
71.6%
50.9%
75.7%
69.8%
66.1%
66.0%
65.0%
74.0%
94.0%
69.0%
50.0%
West Pokot
Turkana
Tana River
Nairobi
Marsabit
Garissa
Percentage of students who regularly consume a meal during the school day
WFP data SMP6 data

33
The number of school meals provided as a result of USDA assistance was calculated based on
secondary data received from WFP and amount to 76,000,00010.
Indicator 18 - Total quantity of commodities provided for school meals provided to students
as a result of USDA assistance
The total quantity of commodities provided for school meals as a result of USDA assistance
amounted to 14,810mt (WFP data), greatly surpassing the 2014 target of 6,364mt. This is
because although the agreement between USDA and WFP was signed in September 2013, the
first shipment arrived in early 2014 and exceeded the 2014 target as it also covered the 2013
target.
It is worth mentioning that USDA assistance is part of a multi-donor effort and that USDA does
not cover all the school days but only a portion. When delays occur (as mentioned above), WFP
uses other donor funds to mitigate.
Indicator 19 - Number of students receiving school meals as a result of USDA assistance
Indicator 19 was calculated from secondary data received by WFP. The figure totalled 753,139
students, and exceeded the 2014 target of 584,000.
Indicator 20 - Percent of students in targeted schools consuming daily meals (lunch)
Indicator 20 amounted to 100 percent, as in the baseline survey. In all the schools visited, all
children present in school consumed the daily meals provided under the SFP.
Indicator 21 – Number of trainings provided in food preparation and storage practices
Indicator 21 was calculated from the WFP Training Reports. In 2014, seventeen (17) SFP
Management trainings sessions were provided in six counties, exceeding the 2014 target by
seven trainings.
It is worth mentioning the fact that when the project was designed, trainings were planned
according to Kenya’s district-level administrative boundary system, which has since changed to
the county-level system. Consequently, WFP provided the trainings at county and sub-county
level. Incidentally, the number of teachers trained (indicator 22) also exceeded its set target.
Indicator 22 – Number of teachers trained in food preparation and storage practices
Indicator 22 was calculated using WFP Training Reports. Data revealed that 1,753 teachers had
been trained in 2014. The target for 2014 (600 teachers) was therefore greatly surpassed.
10 USDA provided 14,810 mt of food in FY 2013 and FY 2014. Each child needs 195 grams per day. This is about half of the total feeding days (195 days) of the academic year. Please note that the figure is rounded to the nearest whole figure

34
From interviews with the head teachers of the 48 sampled schools, analysis shows that some
120 teachers were trained in food preparation and storage practices (on average, 2.5 teachers
per school).
Indicator 23 – Number of social assistance beneficiaries participating in productive safety nets
as a result of USDA support
Indicator 23 is the Feed the Future indicator and measures the number of social assistance
beneficiaries participating in productive safety nets as a result of USDA assistance. For 2014 this
figure was 753,139 (WFP data), compared with the baseline value of 767,108. The reduction
reflects the number of students who were handed over at the end of 2014, which is therefore a
positive development.
MGD 1.4.1: Increased capacity of government institutions
Indicator 24 –Percent of districts in which food procurement and distribution procedures and
infrastructure are in place
For indicator 24, MOEST data confirms that all districts have food procurement and distribution
procedures and infrastructure in place. The KI interviews in Garissa and Turkana counties also
verified that there is a system of record keeping and monthly physical inventory records in place
at the county level.
Indicator 25 - Number of MOEST officers benefiting from home-grown school feeding manuals
distributed
In 2013 WFP provided MOEST with 4,000 copies of the manual. Interviews with MOEST revealed
that in 2014 a total of 1,360 manuals were distributed at county level (most likely the remaining
copies not distributed in 2013). In addition, 756 HGSMP manuals were distributed by WFP
during the CTS training in Isiolo (306) and Samburu Counties (450). This brings to a total number
of 824 manuals distributed (indicator 27).
This indicator was obtained by multiplying the number of manuals distributed (i.e. 2,116) by an
average number of MOEST officers at the county level benefiting from the manuals. The number
of beneficiaries is estimated to be two people per manual.
This calculation yielded a value of 4,232 MOEST officers. The target for 2014 was zero, so this
was an unplanned benefit.
MGD 1.4.2: Improved Policy and Regulatory Framework
Indicator 26 – Number of child health and nutrition policies, regulation and/or
administrative procedures in place
In 2014, there were nine child health and nutrition policies, regulations and/or administrative
procedures in place. According to the USDA framework, two were at Stage two (drafted and

35
presented for public/stakeholder consultation) and eight at Stage five (passed for which
implementation has begun). The former include the Child Health Policy (being finalized in 2015)
and the National School Health, Nutrition and Meals Program Strategy (drafted in 2011). The
latter include: 1) The National Education Sector Plan –NESP (finalized in 2014); 2) the School
Health Nutrition Policy (being reviewed in 2015); 3) the Diarrhoea Policy (updated in 2014); 4)
the Basic Education Act (2014); 5) the National Food and Nutrition Security Policy (2011) (being
reviewed in 2015); 6) the Kenya National Social Protection Policy (2011); 7) the National School
Health Policy (2009); and 8) the Kenya Health Policy 2012-2030.
During the design stage of the WFP-USDA agreement, the parties agreed that WFP would have
contributed NESP and the National School Health, Nutrition and Meals Program Strategy, during
the course of the project. The NESP was finalized in 2014 and WFP is now engaged in preparing
the SHNM strategy.
Indicator 27 – Number of home-grown feeding manuals distributed
As mentioned under Indicator 25, sixty-eight (68) home-grown feeding manuals were
distributed in 2014: 62 in the sub-counties, three in Isiolo and three in Samburu. This data was
retrieved from MOEST. In addition, 756 HGSMP manuals were distributed by WFP during the
CTS training in Isiolo (306) and Samburu Counties (450). This brings the total number of manuals
distributed to 824.
MGD 1.4.4: Increased Engagement of Local Organizations and Community Groups
Indicator 28 - Number of PTAs and SMCs contributing to their school (use percentage)
This indicator was calculated from the interviews with head teachers and parents. According to
the interviewees’ perceptions, 93.8 percent of PTAs and 66.7 percent of SMCs were found to be
contributing to their school, compared with a baseline value of 70 percent. A more detailed
analysis of the community’s contribution revealed that basic items such as water and firewood
were provided to the majority of schools. Remarkably, observations during the survey
implementation showed that two schools in Turkana also provided vegetables.
Indicator 29 - Number of public-private partnerships formed as a result of USDA assistance
Indicator 29 was calculated from secondary data received by WFP. In 2014, 13 new public-
private partnerships were formed as a result of USDA assistance. These include the following
organizations: International Paper, DSM, FEED, Caterpillar, Earth Holdings, Government of
Kenya, Unilever, Drew Barrymore, Princess Haya WPD, IRB, JAWFP, LG Electronics and Goodeed
Association.
Indicator 30 – Value of new public and private sector investments leveraged as a result of
USDA assistance

36
As with indicator 29, indicator 30 was calculated from secondary data received by WFP. The
value of new public and private sector investments leveraged as a result of USDA assistance
amounted to US$15,381,303.
Both indicators 29 and 30 were not calculated during the baseline survey and were added
during the mid-term evaluation following an agreement between USDA and WFP.
MGD SO 2: Increased use of health and dietary practices
Indicator 31 – Percent of schools in target communities that store food off the ground
Indicator 31 was calculated from data collected during interviews with the store keeper and
through enumerator observations during the three day survey. Compared with the baseline
value of 67 percent, the mid-term evaluation found that this indicator value had improved
significantly to a value of 96 percent.
MGD 2.2: Increased knowledge of safe food preparation and storage practices
Indicator 32 – Percent of food preparers at target schools who achieve a passing score on a
test of safe food preparation and storage
For Indicator 32 the same test used in the baseline survey was administered, with some slight
modifications. The threshold for passing the test was 50 percent during the baseline. Using this
threshold, 97.9 percent of cooks passed the test.
The mid-term evaluation recommends raising the passing threshold to 80 percent in the future.
According to the evaluators, following the training, cooks should be able to respond correctly to
all questions, allowing for a 20 percent margin of error.
MGD 2.6: Increased access to requisite food preparation and storage tools and equipment
Indicator 33 – Percent of target schools with improved food preparation and storage
equipment
Indicator 33 was calculated from data obtained through interviews with head teachers and
cooks and through enumerator observations. The main criterion used for measuring the schools
with improved storage equipment is the availability of raised wooden pallets for food storage,
as references in the Program Monitoring Plan (PMP) document. In addition the availability and
use of dedicated food storage space was also used and compared with the value calculated
during the baseline. The main criterion used to calculate the number of schools with improved
food preparation equipment is the availability of a kitchen within school premises
complemented by an energy-saving stove.
In reference to the first component of this indicator (storage equipment), data from the
sampled schools shows that 95.8 percent of schools used raised wooden pallets for food
storage. In addition, primary data collected in the sampled schools shows that 80 percent of

37
schools use a dedicated food storage space. This corresponds to an increase in the indicator
value compared to the baseline (67 percent).
As for the second component, during the baseline survey, the indicator for food preparation had
a value of 60 percent and was based on the availability of a kitchen within school premises.
Primary data collected during the survey shows an improvement compared to the baseline
value since 81 percent of the sampled schools have a kitchen within their premises. The schools
without a kitchen within the premises are mainly located in Marsabit, Turkana and partly in
Tana River Counties. In this case, the food is usually prepared in open spaces.
According to the primary data collection only 37.5 percent of schools used energy-saving stoves.
Schools in Garissa, Tana River and Turkana Counties performed poorly, achieving only 12.5
percent. Nairobi and West Pokot counties had the highest values at 87.5 percent and 62.5
percent respectively.
Data from WFP shows that to date a total of 822 energy-saving stoves have been distributed in
various arid and semi-arid counties.
4.2.2. Additional findings
In addition to the 33 performance indicators agreed upon by USDA and WFP, this mid-term
evaluation also collected additional information to shed light on the functioning and efficiency
of the SFP.
Firstly, the mid-term evaluation measured WFP cross-cutting indicators related to the physical
and/or emotional safety of pupils. Parents were asked whether their child had been exposed to
specific threats in the past 30 days while walking to and from school and how many times this
occurred (zero to four times). Results revealed that the respective percentages for which pupils
had been exposed to these threats at least once were:
Rape: 4.9 percent
Sexual harassment: 4.9 percent
Robberies: 3.7 percent
Animal attacks: 8.2 percent
Bullying: 3.5 percent
Abuse of drugs: 4.4 percent.
The results indicate that, generally speaking, pupils have experienced significant threats to their
safety. These findings are consistent with the WFP Country Program 2014-2018 Baseline Study,
which found that 96 percent of pupils were able to access school feeding programs safely.
The threats are more prevalent in Nairobi (all threats reported except bullying). Threats to
pupils in Turkana were related to animal attacks, in Garissa to rape and Tana River to animal
attack and bullying. Please find below Table with the breakdown of threats by County.

38
Table 2 - Threatening cases experienced by children of the respondents, by County (%)
County Rape Sexual Harassment
Robbed Animal attacks
Bullying Abuse of drugs
Garissa 1.2% 0% 0% 0% 0% 0%
Marsabit 0% 0% 0% 0% 0% 0%
Nairobi 12.7% 14.5% 5.4% 9.1% 0% 11.0%
Tana River 0% 0% 0% 2.5% 2.5% 0%
Turkana 0% 0% 0% 22.7% 0% 0%
West Pokot 0% 0% 0% 0% 0% 0%
Given that the quality of teaching is a major issue in Kenya as reported in the UWEZO 2014 and
SDI 2012 reports, Kimetrica also collected primary data on the qualification of teachers. Within
the sampled schools, only 2.3 percent of teachers are senior graduates, 48.4 percent had a P1
qualification and 6.3 percent were untrained11. KI interviews revealed that in some cases,
schools recruit untrained volunteers to teach due to the shortage of human resources. The low
level of teacher qualifications can explain the poor performance of teachers in the SDI-
implemented knowledge tests, conducted by Kimetrica in 2012.
Another finding of the mid-term review is that schools often inflate their enrolment figures, as
was verified by WFP in Samburu County, where the difference between enrolment figures and
actual pupil enrolment was 19 percent (secondary data from WFP 2015). This indicator was also
measured using primary data from our survey and found that the average inflation of enrolment
figures for 2015 among the sampled schools amounted to 13.56 percent. The tendency to
inflate enrolment figures can be explained by the fact that they are a determining factor for the
schools’ budget for primary education and schools report the same figures for the SFP. Efforts
are underway by the government to launch a management information system (MIS) for a
common database, which is expected to greatly reduce these differences in addition to allowing
for real-time updates of enrolment figures (to reflect, for example, temporary movements of
project beneficiaries due to conflicts and insecurity) and consequent budget adjustments.
Gender analysis
The mid-term evaluation also paid particular attention to gender differences in the achievement
of outputs and outcomes. The UWEZO 2014 Report found that Kenya has achieved 100 percent
gender parity in basic education (UWEZO 2014, p.14). This should not mask in any case the
regional disparities that are known to exist in Kenya.
In terms of enrolment, survey data showed that the percent increase in girls enrolled in 2014
compared to 2013 was 7.7 percent, while the corresponding figure for boys was higher (9.2
percent). Data on NER for the sampled counties, received by MOEST, on the other hand, shows
11 From highest to lowest, teacher qualifications are as follows: Senior Graduate, GT1, GT2, ATS 1, ATS 2, ATS3, ATS4, P1
and untrained.

39
a lower figure for girls compared to boys (58.4 percent and 67.1 percent respectively). Garissa
County has the lowest enrolment value and, together with Turkana Counties, has the highest
disparity between boys and girls.
In terms of pupils regularly attending supported schools there are no significant differences
between girls and boys (73.0 percent and 72.3 percent, respectively). WFP data used to
calculate attendance compared to enrolment shows also no major disparities between boys and
girls (91 percent and 90 percent respectively).
Finally, in terms of student performance in the sampled Counties (KCPE 2013 from MOEST data),
boys performed better than girls on average (241.8 and 228.1 respectively). Garissa and Tana
Rivers are the two Counties showing the worst performance results and the highest boys/girls
disparities.
4.2.3. Program efficiency
Program efficiency has, in general, been high, though it could be enhanced further if the
program is able to overcome some of the major challenges which will be highlighted in this
section.
At the county level, program efficiency is hindered by logistical and financial issues related to
the secondary transport of food and the late arrival of funding from the central government
(which is an issue across all sectors, not just the Education sector), which also affects the timely
payment of transporters, as confirmed by KI interviews with MOEST and WFP officers in Garissa
and Turkana Counties. This is within the sharing agreement framework between MOEST and
WFP.
The Nairobi informal settlements’ schools are characterized by a different administrative
arrangement compared with other counties (there is no MOEST oversight), hence the need for a
counterpart, FTC. Interviews with WFP in Nairobi and an analysis of FTC secondary data have
revealed that logistics are not a challenge for the Nairobi informal settlement schools and that
FTC has proved to be highly efficient in managing the SFP.
At the county level another issue which was highlighted during the KI interviews is that MOEST
does not always have the necessary funds for warehouse fumigation. In such cases WFP has
stepped in to ensure that no food was lost, even though this was not WFP’s responsibility once
handed over to Government.
There have been no major WFP’s pipeline breaks in 2014. USDA assistance did not arrive in 2013
and in 2014 arrived later for Term 1. However, thanks to the contribution of other donors, WFP
managed to have a smooth pipeline. The main delay occurred is attributable to the challenges
posed by the secondary transport. In 2014 the average delay in arrival of commodities to the
sampled schools was 28 days for Term 1, 28 days for Term 2 and 20 days for Term 3. In
calculating these delays, it was assumed that the expected delivery date should be the day
before the start of term. As mentioned earlier, based on the MoU established with the

40
government, this is under GoK responsibility as their contribution to the program. These issues
must be addressed to ensure smooth program implementation.
The efficiency of the program in terms of the quantities of food cooked on a daily basis was
quite high. Findings from observation and interviews during the mid-line survey suggest that
cooks often cook daily quantities of food based on the official enrolment and not based on
actual daily pupil attendance. Related issues include the fact that the majority of the schools
visited, do not have functioning weighing scales, and that pulses need to be soaked several
hours before being cooked (i.e. before the actual attendance is known). Despite these minor
issues, WFP monitoring data from 2014 found that the average ration size for food cooked was
of 149.21 grams for cereals, 5.0 grams for vegetable oil and 40.4 grams for pulses12; our findings
confirm this with the average cereal ration size ranging between 147 and 154 grams (dry ration
equivalent). This means that the amount of food provided is in line with the quantity envisaged
by the program.
Currently, food distribution during the lunch break among children varies between schools.
Observations during the survey in the sampled schools revealed that some schools use a
centralized distribution system through the school cook while others distribute food by classes
(using large buckets). The exact percentages of these two distribution systems are not available
since these results came out from direct observations from the enumerators and supervisors.
The absence of a common measure for the pupils’ rations and the fact that children use food
containers of different sizes means that that rations distributed are not accurate and
distribution methods could be significantly improved. The average wet ration provided during
the survey varied between 303 grams in Marsabit to 622 grams in Garissa. In Nairobi it was
recorded an average of 498 grams.
Based on a WFP study on school feeding cost benchmarks conducted at the global level, the
average standard annual cost per recipient for “meals only” in Kenya amounts to U$33 (based
on 2013 data).
Finally, KI interviews revealed that there have been communication delays between WFP Kenya,
USDA Kenya and Washington offices. Currently, communication between USDA Washington and
the WFP Kenya Country Office only happens with WFP Washington office acting as an
intermediary. Open and direct communication will enhance program efficiency
12 WFP does not weigh the commodities but collects information on the average ration in grams used during the day of monitoring (through the cook) and this is compared with the official ration for each commodity.

41
4.3. External and internal factors affecting results
External Factors. The recent devolution of power to Kenya’s 47 County governments as part of
the national government’s decentralization process has changed the responsibilities and
reporting lines of different Ministries involved in the SFP. With the new administrative structure,
the MOEST has not been devolved and still holds power at central level. Devolution, however,
has not significantly affected the implementation of the program even though certain
procedures remain to be defined such as the most efficient way of transferring funds from the
central government to the schools under the HGSMP.
Teachers’ strikes and insecurity in certain counties (Garissa, Mandera, Wajir), as mentioned in
the previous section, had a negative impact on the attendance rate of pupils and the percentage
of students who regularly consume a meal during the school day.
Interviews with WFP officials in Nairobi revealed that fundraising for the SFP has proven to be
more challenging in recent years, with contributions from other donors fluctuating and the need
to find additional financing sources emerging. This is partly because the SFP has been
operational in Kenya for many years and there are other education programs on-going at the
same time. There is increasing interest from the private sector, which provides an opportunity
to bridge the gap in funding.
The poor quality of teaching could be one of the main factors affecting the achievement of one
of the program impacts (literacy). This is corroborated by both the latest UWEZO Report on
literacy and numeracy across East Africa (2014) and MOEST data 2013 have revealed low
performance of students (particularly the poorest) as indicated in Section 4.2.1 (indicator 1). In
addition, the Service Delivery Indicators (SDI) Report for Kenya (2012) shows that on average
teachers spend 2 hours and 40 minutes teaching during a normal day, which is only about half of
the scheduled time. Moreover, only 35.2 percent of teachers have scored more than 80 percent
on general knowledge tests that combine mathematics, English and pedagogy, highlighting very
low quality of teaching (The World Bank 2013, p.10-14). This hypothesis may however deserve
further investigation.
These results are negatively impacting the key SFP objectives, especially considering that the
areas targeted by the program are also the poorest. Improvements in the national curriculum
being carried out by UNICEF, GoK and other partners including WFP, will have a long term
impact on the level of teaching and consequently on pupils’ performance.

42
Internal Factors13. The SFP’s performance and progress towards the achievement of outcomes
has also been affected by a series of internal events and/or factors, within the project
implementers’ control.
Firstly, the late disbursement of Government funds, due to complicated institutional
arrangements within MOEST and the National Treasury, has proven to be one of the greatest
hindrances to program implementation – this issue was emphasized in all interviews. According
to one MOEST official, the disbursement of funds can take up to two months once it has been
approved, causing delays in the implementation of the program. This affects also the HGSMP
with even greater implications. It should be noted however, that this delay is not specific to the
SFP, but affects all other programs implemented by the GoK jointly with other development
partners.
Secondly, the insufficient level of funding for the program appeared to significantly affect
county level officials’ capacity to implement and monitor activities. This includes the lack of
resources at county level for transporting commodities to the schools. This is mainly influenced
by the previous point, i.e. funds not arriving on time. In Turkana County, for example, KI
interviews revealed that the local DEO only has one available truck to transport food
commodities to targeted schools and therefore relies on private transporters, without having
readily available funds to pay them. This problem affects both MOEST and MoH officials.
Thirdly, interviews at the county level have drawn attention to the issue of accountability linked
to the current reporting structures. An independent government committee, the Teacher
Service Commission (TSC), was established under the Constitution of Kenya to manage human
resource within the education sector. In the current framework, the SFP is under the purview of
MOEST, while all teachers report to the TSC (which is not represented in the MOEST-led
Technical School Feeding Committee). Given that the person responsible for the
implementation and monitoring of the SFP within schools is a teacher, accountability related to
program management is a concern.
Fourthly, several stakeholders interviewed at County level agree that there is a low level of
collaboration between MOEST and MoH officials at the county level, negatively affecting
program implementation. This does not reflect their relationship at the national level, where the
degree of interaction is much higher.
Fifthly, KI interviews in Garissa and Turkana Counties both revealed that, in practice, MOEST
monitoring at the school level does not occur due to lack of funding and that there is low
awareness among MOEST and MoH officials of the joint monitoring mechanism which is in place
13 The mid-term evaluation considers “internal” any factors related to the SFP implementing partners, thus including WFP,
GoK, MOEST, MoH and other implementing partners.

43
with WFP. WFP and MOEST staff in fact conducts joint monitoring at school level once a term in
both WFP supported areas and HGSMP areas. It is worth noting that in 2013, with funding from
USDA, WFP purchased 60 motorcycles to facilitate the implementation of the HGSMP by MOEST
field staff. These motorcycles were provided to semi-arid counties handed over in the previous
years. In addition, WFP purchased nine motorcycles for Isiolo, Marsabit and Tana River which
are scheduled for handover during the current program, and is in the process of procuring an
additional 50 motorcycles to further support monitoring in HGSMP counties.
KI interviews in Garissa and Turkana counties revealed that SFP training is not done frequently
enough (one per County during the project duration) to accommodate government staff
turnover rates. The low frequency of training is also a problem at school level, where WFP staff
undertakes on-the-job training during their termly monitoring visits.
Data collected in the field also demonstrated that proper and consistent reporting of food
utilization by the schools is a challenge, as was confirmed by the WFP officers in the field. While
the monthly WFP monitoring in 10 percent of supported schools is commendable, the schools’
record-keeping capacity is low and school records were found to be disorganized and missing.
To give an idea of the magnitude, about 7 out of 48 sampled schools did not have SMP 6 forms
available (for multiple months). This posed a serious challenge for the data collection processes
and consequent calculation of SFP performance indicators and for any future data collection
exercise.
Given that, as mentioned earlier, the food allocation system is based on enrolment figures and
there is currently no mechanism in place for the real-time update of these figures, schools often
need to redistribute commodities based on modified pupil numbers, affecting the actual ration
size. Such a situation would arise, for example, with the temporary migration of families due to
insecurity or seasonal migration of pastoralists.
Finally, a positive internal factor is the effective accountability system established by WFP and
the main partners (in particular MOEST) for resource mismanagement. The complaint and
feedback mechanism helpline established by WFP has worked quite well and there is a high level
of awareness among communities of this service. WFP reports cases of mismanagement to
MOEST, who subsequently channels the case to the TSC which then takes appropriate action.
WFP have had several examples of actions taken on teachers in the past year. Further, with
county governments now in place, WFP and MOEST also alert the counties so they can take
action. The main weakness found in this system, is that the counties are not well integrated into
the SFP management structure.

44
4.4. Sustainability of the program
This mid-term evaluation also investigated the extent to which the SFP is sustainable and how
committed the GoK is in contributing to and taking over the program. All project stakeholders
interviewed agree that the Government is highly dedicated to it, as demonstrated by its
continuous support since the program’s inception and by a policy framework that is conducive
for program implementation. Worthy of mention is also the healthy relationship between WFP
and MOEST, characterized by mutual trust and respect. Under the new CP, WFP is working more
closely with MoALF through a joint annual work plan. This will certainly play a role in the
sustainability of the program going forward.
The launch of the HGSMP and the yearly transfer of thousands of pupils from the regular SFP to
the national cash-based model further underscore the Government’s commitment. The
takeover of the program has not been without complications, but the GoK has strived to address
arising issues by requesting WFP support where possible. For example, in January 2013 it
requested WFP’s support to develop a strategy for expanding the HGSMP implementation in the
arid lands.
Looking ahead, ring-fencing the SFP budget line in the national budget would further enhance
the commitment of the GoK and increase the sustainability of the program.
As mentioned in previous sections, the survey revealed the following challenges at county level
which hinders sustainability and should be therefore addressed:
The monitoring capacity of government institutions at county level remains weak, even
more so for the rollout and implementation of the HGSMP in other arid counties.
The financing flows under which SFP operates significantly delay the implementation of
the program.
The level of funding and resources at county level is insufficient.
The level of coordination between MOEST and MoH at county level is low, and does not
reflect their relationship at the national level, where the degree of interaction is much
higher.
As suggested by the External Evaluation of WFP’s Cash Transfers to Schools Pilot Project (2015),
the effectiveness and sustainability of the HGSMP is dependent on consistent and timely
funding by the central government, and on effective oversight and monitoring of the program
(DFATD 2015, p.41). Moreover, given that responsibilities for programs within MOEST have not
yet been devolved to the county levels, a high degree of collaboration between county and
central level will be essential to ensure sustainability.

45
45
5. Best practices, lessons learned and recommendations
Best practices
The hand over framework further refined during the current Country Program (2014-2018)
between WFP and the GoK represents one of key best practice not only in Kenya but worldwide.
The WFP hotline/complaint line proved to be quite effective in capturing and discouraging cases
of mismanagement of resources within the program. The system should be extended to all
counties.
Lessons learned and recommendations
Immediate and short-term key recommendations (requiring mid-course corrections or initiation
of action) are as follows:
1. For many pupils in the arid lands the SFP meal is the most substantial meal they have
during the day. In fact, 56.1 percent of parents reduce the portions of the evening meal
when lunch is provided in schools and only 59 percent of pupils consume a meal before
school.
Recommendation: Consider providing the SFP meal one or two hours earlier (11am
instead of 12.30pm) to address problems of short term hunger, particularly in counties
where the intake of breakfast at household level is low. Particular attention should be
given to Marsabit, Turkana and West Pokot Counties since they performed more poorly
than the other Counties for the above mentioned indicators.
2. Results indicate that pupils experience significant threats to their safety while walking to
and from school. This is particular prevalent in Nairobi.
Recommendation: SFP stakeholders should increase awareness on these topics during
program implementation. WFP should consider carrying out community-level
sensitization on the threats to pupils’ safety. Strategic partnerships with agencies
focusing on Child Protection (i.e Unicef, Plan International, Save the Children etc) would
be an added value in helping reinforcing synergies and complementarity with the SFP.
These interventions should be prioritized in Nairobi informal settlements.
3. The GoK financing flows under which SFP operates are very inefficient and not timely
and this significantly delays program implementation. This affects both the government-
led HGSMP and the in-kind program supported by WFP (due to commodity delivery
delays by MOEST at county level).
Recommendations:
WFP and the GoK should consider establishing a national and independent entity to
manage the SFP, housed outside of MOEST, with the aim of increasing implementing
partners’ involvement and accountability. The Treasury should be represented within

46
46
this independent entity to ensure that any arising issues related to funding channels are
promptly addressed. The institutional arrangement could be lighter at national level
while increasing the support to county-level structures. A potential disadvantage of this
option is the danger of having another autonomous agency that doesn’t integrate
closely enough with the core ministries. In this regard, an open discussion to seek a
proper balance is encouraged.
In addition, GoK should consider ring-fencing the SFP budget line in order to secure
funds allocation for the program. In this regard, a strategy could be to bring the SFP
under the National Safety Net Programs (NSNP). This will enhance coordination; help the
SFP program to work more coherently, efficiently and effectively with the others Kenya’s
safety net programs and in addition it could ensure a “ring-fenced” budget.
This can be done integrating the SFP with the National Social Protection Secretariat (and
the Council when the bill is enacted) within the NSNP. MOEST should participate in the
national steering committee and, at Director level, in the management and technical
working groups. Synergies could be sought by integrating the MOEST data (NIEMIS) into
the social protection single registry for example.
In order to further secure funds for the future implementation of the SFP program in a
sustainable manner, a scale-up of the current advocacy campaign is recommended
especially targeting the National Assembly Budget Committee, the Council Governance
and the Treasury. Student Councils formed at school level could be also involved for an
effective advocacy campaign.
4. There is high degree of variance and inaccuracy in the methods used to distribute food
among pupils.
Recommendation: Provide a unified scoop measure to all supported schools, both under
the SFP and the HGSMP. Implementers should also consider providing weighing scales to
all supported schools along with adequate training on how to use them.
5. Even though the SFP increases the attendance rate, this alone does not translate into
good literacy outcomes of the pupils in the arid counties. Other factors impacting
negatively on literacy outcomes include poor quality of teaching as documented by the
SDI Report 2012.
Recommendation: This evaluation recognizes that influencing the quality of teaching is
beyond WFP’s mandate and responsibility. Recognizing WFP efforts in the review of the
Kenya national curriculum alongside other development partners, Kimetrica
recommends continued synergy with partners who are supporting the GoK to address
issues related to the quality of education and teaching, particularly in the context of the
two recently launched national programs – the Global Partnership for Education (GPE)
and Tusome – that are principally funded by the World Bank and USAID.
Medium to long-term recommendations are as follows:
47
47
1. There is a low level of coordination between MOEST and MOH at county level.
Coordination may be increased through more frequent and regular meetings of MOEST
and MoH officials and through their involvement in the joint monitoring activities.
Recommendation: Strengthen county level school committees, with a wide
representation of program stakeholders, to increase coordination and accountability. In
addition, MoH should ensure that food inspections are carried out in the District
Education Officer (DEO) warehouses as soon as WFP delivers the commodities,
especially if there is insufficient funding to carry out food inspection at school level. The
establishment of a national independent entity beyond MOEST and integrating SFP into
the NSNP, as outline in point 3, would help to increase the involvement and
participation of other Ministries (including MoALF), ring-fence the funds and foster
coordination.
2. Multiple reporting lines related to the SFP implementation create issues of
accountability. Teachers, including the SFP Teacher, report to the TSC while the program
is under the purview of MOEST.
Recommendation: Strengthen the Technical School Feeding Committee by involving
additional partners, such as the TSC, to address issues of accountability and multiple
reporting lines, and enlarging its operational budget. The involvement of the Treasury
within the Technical School Feeding Committee would also be beneficial to address
lesson learned number 3 mentioned above.
3. There is high staff turnover, both within schools and ministerial offices. One SFP
management training per project cycle (once every 2.5 years) may not be effective,
despite the additional supplementary visits and on-the-job training carried out by WFP.
Recommendation: Consider increasing the frequency of training (once a year), especially
for officials that have not yet been trained in the context of the SFP.
4. Record-keeping at school level is poor and this affects the monitoring process.
Recommendation: Project implementers should engage in capacity building activities at
the school level to strengthen record-keeping and filing practices. More frequent SFP
management trainings at the county level (recommendation number 6) would increase
the schools’ and government’s capacity to implement the HGSMP and in-kind
contribution program. Project implementers should consider making commodity delivery
conditional upon reconciled records (both SFP and School records).
5. KI interviews in Garissa and Turkana revealed that monitoring at the school level by
MOEST is a challenge due to lack of funds at county level. In addition, government
officials were not aware of the joint monitoring arrangements in place with WFP.
Recommendation: SFP implementing partners should raise awareness of the joint
monitoring arrangement at county level. WFP should consider involving the MoH, and
MoALF in addition to MOEST during their field visits. Furthermore, MoH should ensure

48
48
that food inspections are carried out in the District Education Officer (DEO) warehouses
as soon as WFP delivers the commodities, especially if there is insufficient funding to
carry out food inspection at school level. A cost-sharing mechanism between WFP,
MOEST and MoH should be considered to cover the expenses related to joint
monitoring. This evaluation recommends developing a Memorandum of Understanding
(MoU) between WFP, MOEST, MoH and MoALF (and TSC) to determine the cost-sharing
mechanism: a possible solution could include WFP providing transport means (as is
already happening) with MOEST and MoH ensuring their officials’ daily allowance and
fuel is covered.
MOEST and WFP should also consider involving additional partners in their monitoring
activities (such as UNICEF) to increase complementarity of activities with key partners.
They should use this opportunity to conduct joint sensitization sessions of pupils and
teachers on the issues addressed by their programs.
6. The schools often inflate their enrolment figures, as verified by WFP in Samburu County.
Recommendation: Finalize the already initiated process of creating a common MIS to
reflect real-time changes in school enrolment and attendance figures.
7. The WFP helpline/complaint mechanism proved to be quite effective in the County
where it was piloted.
Recommendation: Following the pilot exercise conducted by WFP, the GoK should
prioritize the implementation of a helpline/complaint mechanism in all counties covered
by the SFP and HGSMP, with a dual objective of increasing community knowledge and
awareness of the program and creating an avenue for raising complaints and issues.
Kimetrica further proposes the following recommendations for the final evaluation:
Calculating Indicator 8, the regular attendance of pupils (where “regular” is defined as a
80% attendance as per USDA guidelines), based on school records of a minimum sample
of 10 pupils per school. This can also stimulate the desired path of improvement for
record keeping at school level (recommendation number 7).
Raising the passing threshold of the safe food preparation and storage test for cooks
from 50% to 80% (Indicator 32).
Include the Ministry of Agriculture, Livestock And Fisheries (MoALF) among the Key
Informant stakeholders to interview
In addition, this evaluation suggests a simplification of communication channels between WFP
Kenya and USDA (Kenya and Washington offices) to increase program efficiency.

49
49
Annex 1: Bibliography
Department of Foreign Affairs, Trade and Development Canada (DFATD) (2015). External
Evaluation of WFP’s Cash Transfers to Schools Pilot Project – March 2013-March 2015.
Department of Foreign Affairs, Trade and Development Canada (DFATD), Ministry of Education
Kenya, WFP (2013). Strategy to Strengthen & Expand the Home Grown School Meals (HGSM)
Program into the Arid Lands of Kenya.
Government of Kenya (2005). Kenya Education Sector Support Program 2005 - 2010. Delivering
quality education and training to all Kenyans. Ministry of Education Science and Technology.
Government of Kenya (2009). National School Health Policy. Ministry of Public Health and
Sanitation and Ministry of Education.
Government of Kenya (2011). Kenya National Social Protection Policy. Ministry of Gender,
Children and Social Development.
Government of Kenya (2011). National Food and Nutrition Security Policy. Reporting Period: 1
January - 31 December 2013.
Government of Kenya (2011). National School Health, Nutrition And Meals Program Strategy
(First Draft). Ministry of Education, Ministry of Public Health and Sanitation and Ministry Of
Agriculture.
Government of Kenya (2012). A Policy Framework for Education and Training - Reforming
Education and Training in Kenya. Ministry Of Education And Ministry Of Higher Education
Science and Technology.
Government of Kenya (2012). Kenya Health Policy 2012-2030. Ministry of Medical Services-
Ministry of Public Health and Sanitation.
Government of Kenya, Ministry of Education and WFP (2014). External Evaluation of Kenya´s
Home-Grown School Meals Program, 2009 – 2013. Final Report.
Government of Kenya (2014). National Education Sector Plan, Volume One: Basic Education
Programme Rationale and Approach, 2013/2014 – 2017/2018 (Draft for Consultation 31 January
2014). Ministry of Education Science and Technology.
WFP (2009). Country Programme Kenya 106680 (2009–2013).
WFP (2010). Feed Minds, Change Lives – School Feeding: Highlights and New Directions.
WFP (2010). Impact Evaluation of WFP School Feeding Programmes in Kenya (1999-2008): A
Mixed-Methods Approach. Vol 1. Full Evaluation Report. Office of Evaluation.

50
50
WFP (2010). School Feeding Handbook.
WFP (2011). Kenya: An Evaluation of WFP’s Portfolio (2006-2010).
WFP (2013). WFP School Feeding Policy, WFP, Rome, Italy.
WFP (2014). Baseline Survey for the USDA McGovern-Dole International Food for Education and
Child Nutrition Programme’s Support (2013-2015) to WFP Kenya Country Programme. Period of
assistance: September 2013 – September 2015.
WFP (2014). Country Programme Kenya 200680 (2014–2018).
WFP (2014). Evaluation Quality Assurance System: Guidelines for Operation Evaluations, WFP,
Rome, Italy.
WFP (2014). Kenya Country Programme 200680 (2014-2018) Baseline Study.
WFP (2014). Standard Project Report 2013, Kenya Country Programme.
The World Bank (2009). Rethinking School Feeding: Social Safety Nets, Child Development, and
the Education Sector.
The World Bank (2013). Service Delivery Indicators (SDI) Report 2012, Kenya.
UNESCO (2009). Education Indicators - Technical Guidelines.
USDA (2013). Annex IV: Monitoring and Evaluation Policy. USDA FAS, Washington, DC.
USDA (2013). Commitment Letter for Agreement #FFE-615-2013/041-00 Kenya.
UWEZO (2014). Are Our Children Learning? Literacy and Numeracy Across East Africa.

51
51
Annex 2: Sampled Schools by County
No. School Name Sub-County Division
Nairobi County
1 Mbagathi Road Primary Dagoretti Riruta
2 Kinyanjui Rd Primary Dagoretti Riruta
3 Riruta Satelite Dagoretti Riruta
4 Toi Primary Dagoretti Riruta
5 Shadrack Kimalel Primary Karen Riruta
6 Ayany Primary School Karen Langata
7 Joseph Kangethe Karen Riruta
8 Kibera Primary School Karen Riruta
West Pokot County
1 Kacheliba Mixed North Pokot Kacheliba
2 Kacheliba Girls North Pokot Kacheliba
3 AIC Asilong North Pokot Kacheliba
4 Kodich Secondary North Pokot Kacheliba
5 Kodich AIC North Pokot Kacheliba
6 Nakuyein North Pokot Kacheliba
7 Cherangan North Pokot Kacheliba
8 Kalukuna North Pokot Kacheliba
Turkana County
1 Nakwamekwi Turkana Central Central
2 Loyo Turkana Central Central
3 St. Monica - Lodwar Girls Turkana Central Central
4 Lorugum Loima Kainuk
5 Namoruputh Loima Lorugum
6 Lorengippi Loima Lorugum
7 Lobei Loima Lorugum
8 Kospir Loima Lorugum
Garissa County
1 Modika Garissa Central
2 ADC Garissa Central
3 Afwein Lagdera Modogashe
4 Barkuke Lagdera Modogashe
5 Ama Lagdera Modogashe
6 Dhilenur Lagdera Modogashe
7 Madina Lagdera Modogashe
8 Janju Lagdera Modogashe
Marsabit County
1 Al Hidaya Marsabit Central Central
2 Segel Marsabit Central Central
3 Jaldesa Marsabit Central Gadamoji

52
52
14 Elmolo Bay was replaced by Russo Primary following advice given by the Marsabit DEO due to security reasons.
4 Forole Primary Chalbi Maikona
5 Helmer Memorial Chalbi North Horr
6 Ulauli Laisamis Laisamis
7 Lependera Laisamis Korr
8 Russo Primary14
Laisamis Loiyangalani
Tana River County
1 Kilelengwani Tana Delta Garsen Coast
2 Nduru Tana Delta Garsen South
3 Onwardei Tana Delta Garsen South
4 Gamba Tana Delta Garsen Central
5 Gururi Tana River/North Hola-Waldena
6 Wayuboru Tana River/North Hola-Waldena
7 Maweni Tana River/North Hola-Mkomani
8 Dukanotu Tana River/North Bura-Darime

53
53
Annex 3: Pupil Sampling Methodology
This sampling procedure was used to select 10 random pupils in each school. It was distributed
to the sampled schools ahead of the survey.
Instructions: Schools should follow this methodology to select a random sample of 10 pupils
across the 8 classes of the school. These pupils will undergo a brief interview during the survey.
The parents of these pupils will also be interviewed (a total of 10 parents - 1 for each of the
pupils in the random sample). Schools should inform the parents of these pupils to report to the
school during the survey dates for their interview, ahead of the arrival of enumerators.
For the classes that have at least 20 pupils, use these index numbers in the register to select
the pupils.
For the classes that have less than 20 pupils, use these index numbers in the register to select
the pupils.
Pupil No. Sampled Pupils Pupil's index in the class
register
1 Sample pupil in class 1 7
2 Sample pupil in class 2 5
3 Sample pupil in class 3 10
4 Sample pupil in class 4 16
5 Sample pupil in class 5 18
6 Sample pupil in class 6 4
7 Sample pupil in class 7 3
8 Sample pupil in class 8 12
9 Sample pupil in class 4 11
10 Sample pupil in class 7 15
Pupil No. Sampled Pupils Pupil's index in the class
register
1 Sample pupil in class 1 7
2 Sample pupil in class 2 5
3 Sample pupil in class 3 10
4 Sample pupil in class 4 8
5 Sample pupil in class 5 9
6 Sample pupil in class 6 4
7 Sample pupil in class 7 3
8 Sample pupil in class 8 6
9 Sample pupil in class 4 1
10 Sample pupil in class 7 2
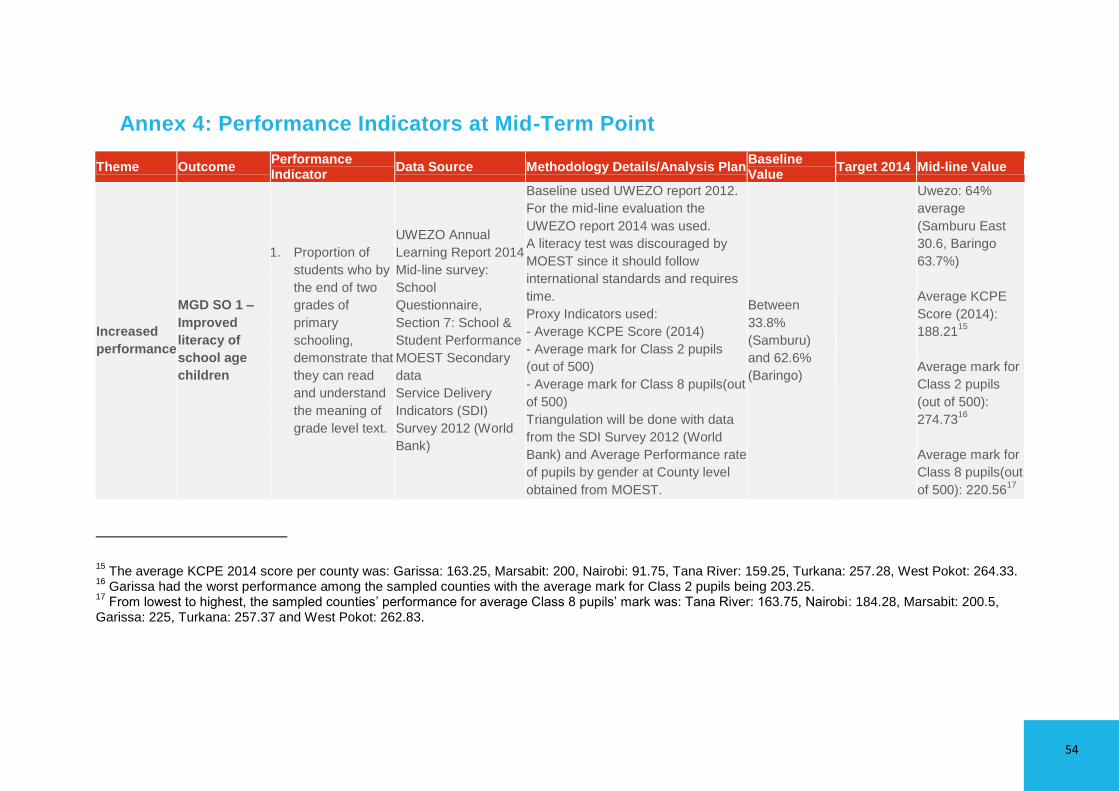
54
Annex 4: Performance Indicators at Mid-Term Point
Theme Outcome Performance Indicator
Data Source Methodology Details/Analysis Plan Baseline Value
Target 2014 Mid-line Value
Increased
performance
MGD SO 1 –
Improved
literacy of
school age
children
1. Proportion of
students who by
the end of two
grades of
primary
schooling,
demonstrate that
they can read
and understand
the meaning of
grade level text.
UWEZO Annual
Learning Report 2014
Mid-line survey:
School
Questionnaire,
Section 7: School &
Student Performance
MOEST Secondary
data
Service Delivery
Indicators (SDI)
Survey 2012 (World
Bank)
Baseline used UWEZO report 2012.
For the mid-line evaluation the
UWEZO report 2014 was used.
A literacy test was discouraged by
MOEST since it should follow
international standards and requires
time.
Proxy Indicators used:
- Average KCPE Score (2014)
- Average mark for Class 2 pupils
(out of 500)
- Average mark for Class 8 pupils(out
of 500)
Triangulation will be done with data
from the SDI Survey 2012 (World
Bank) and Average Performance rate
of pupils by gender at County level
obtained from MOEST.
Between
33.8%
(Samburu)
and 62.6%
(Baringo)
Uwezo: 64%
average
(Samburu East
30.6, Baringo
63.7%)
Average KCPE
Score (2014):
188.2115
Average mark for
Class 2 pupils
(out of 500):
274.7316
Average mark for
Class 8 pupils(out
of 500): 220.5617
15 The average KCPE 2014 score per county was: Garissa: 163.25, Marsabit: 200, Nairobi: 91.75, Tana River: 159.25, Turkana: 257.28, West Pokot: 264.33.
16 Garissa had the worst performance among the sampled counties with the average mark for Class 2 pupils being 203.25.
17 From lowest to highest, the sampled counties’ performance for average Class 8 pupils’ mark was: Tana River: 163.75, Nairobi: 184.28, Marsabit: 200.5,
Garissa: 225, Turkana: 257.37 and West Pokot: 262.83.

55
Theme Outcome Performance Indicator
Data Source Methodology Details/Analysis Plan Baseline Value
Target 2014 Mid-line Value
Average KCPE at
national level for
2013: 250.05
(253.23 for boys
and 246.88 for
girls) (MOEST
2013)
2. Number total
individuals
benefiting
directly from
USDA-funded
interventions
School monitoring
data (SFP 8)
WFP Reports
Secondary data review of WFP
records
2013-
Girls: 341,673
Boys: 425,435
Total: 767,108
753,139
3. Number of total
individuals
benefiting
indirectly from
USDA-funded
interventions
WFP reports
Mid-line Survey:
HH/Parent
Questionnaire, Q104.
We shall use same method applied
during the baseline survey.
Interviews with parents will determine
the average number of children per
HH going to school. HH average size
is 6. Number of HHs= direct
beneficiaries (Indicator No. 2) /the
number of children per HH going to
school (obtained from HH
questionnaire Q104).
Number of indirect beneficiaries =
number of HHs * (6 - number of
children per HH going to school).
536,758
Average number
of children per HH
going to school:
2.84.
Indirect
beneficiaries =
838,000

56
Theme Outcome Performance Indicator
Data Source Methodology Details/Analysis Plan Baseline Value
Target 2014 Mid-line Value
MGD 1.1.1 –
More
consistent
teacher
attendance
4. Percent of
teachers in
target schools
who attend
school and teach
at least 90
percent of
scheduled
school days per
year.
Mid-line Survey:
School
Questionnaire,
Section 4 Teacher-
Head Teacher (Q410)
and Section 5:
Observation School
Survey (Q504-Q506)
SDI Survey 2012 –
World Bank
Data will be collected directly from
the Headteacher and will be
triangulated with data from the SDI
2012 survey. It will also be compared
with teacher attendance during the
field survey.
51%
Attendance of at
least 90% of
scheduled days:
74.8% (323
teachers)18
General
attendance of
teachers:
88.79%19
Average teacher
attendance during
the 3 day
surveys:
81.88%20
Average pupil
teacher ratio from
MOEST data for
Kenya: 34.521
5. Number of WFP reports The baseline data reported zero 0 200 200
18Nairobi and Turkana counties achieved exceptionally high values for this indicator, while Garissa’s performance was quite low. Breakdown by county:
Garissa: 42.2%, Marsabit: 87.03%, Nairobi: 97.7%, Tana River: 68.3%, Turkana: 98.6%, West Pokot: 76.6%. 19
The breakdown by county is as follows: Garissa: 56.95%, Marsabit: 88.27%, Nairobi: 96.88%, Tana River: 81.7%, Turkana: 97.08%, West Pokot: 92.57%. 20
Average teacher attendance during the survey, by county: Garissa: 97.91%, Marsabit: 69.66%, Nairobi: 97.19%, Tana River: 68.12%, Turkana: 81.66%, West Pokot: 88.15%. 21
Average pupil teacher ratios in the sampled counties for 2014 (MOEST): Garissa 46.5, Marsabit 37.4, Nairobi 36.2, Tana River 36.6, Turkana 71.7, West Pokot 37.2.

57
Theme Outcome Performance Indicator
Data Source Methodology Details/Analysis Plan Baseline Value
Target 2014 Mid-line Value
MOEST officers
trained in
promoting
consistent
teacher
attendance
meaning that no teachers’ trainings
on promoting consistent teacher
attendance were conducted.
For the mid-line value, secondary
data from WFP will be analysed.
6. Number of
trainings in
promoting
teacher
attendance
conducted for
MOEST officers
WFP reports 0 4 1722
MGD 1.2 –
Improved
Attentiveness
7. Percent of
students in
classrooms
identified as
inattentive by
their teachers
Mid-line Survey:
Teachers
Questionnaire
The data will be collected using the
teachers’ perception. Teachers from
all classed will be interviewed. The
average percentage will be
calculated for this indicator.
20%
20.05%23
Main reason for
inattentiveness:
hunger (43.7%)
Participation
in Education
MGD 1.3 –
Improved
student
attendance
8. Percent of
students
(girls/boys)
regularly
attending
Mid-line survey:
School
Questionnaire,
Section 7. School &
Student Performance
School data on attendance will be
captured for the ten sampled pupils
in each school.
85.6%
88% (attendance
vs enrolment as
for baseline)
22 In 2014, the SFP Management Training was carried out in East Pokot, Garissa, Marsabit, Tana River, West Pokot and Samburu Counties. 23
Percent of inattentive students by county: Garissa: 11.95%, Marsabit: 25.26%, Nairobi: 15.58%, Tana River: 19.87%, Turkana: 20.73%, West Pokot: 26.37%.

58
Theme Outcome Performance Indicator
Data Source Methodology Details/Analysis Plan Baseline Value
Target 2014 Mid-line Value
supported
schools
72.5% regularly
attending
(Girls: 73.02%24
Boys: 72.28%25
)
9. Percent of
students in
target schools
who start grade
one and
complete the last
grade of primary
school
Mid-line Survey:
School
Questionnaire,
Section 6: Student
record (Q614-Q621)
SDI Survey 2012 –
World Bank
At school level the calculation will be
based on school records and
interviews with headteachers
following backwards the co-hort of
pupils who graduated in the year
2014. In the count, students who
initially enrolled in the sampled
school but completed the Primary
Education with another school should
be considered. Average % will be
applied.
This will be triangulated with data
from the SDI Report.
2013:
Girls 72.8%
Boys 78.7%
Total 76.2%
56.44%
MGD 1.3.4 –
Increased
student
enrolment
10. Percent increase
in girls enrolled
in schools
Mid-line Survey:
School
Questionnaire,
Section 6: Student
record (Q601-Q613)
At school level, the trend will be
calculated from the enrolment figure
for the last 4 years (2012-2015) from
headmaster records.
This data will be triangulated with
3%
7.7%26
11. Percent increase
in boys enrolled 3% 9.2%
27
24 The breakdown by county was: Garissa : 80.95%, Marsabit: 100%, Nairobi: 21.42%, Tana River: 83.78%, Turkana: 100%, West Pokot: 41.17%.
25 The breakdown by county was: Garissa: 91.66%, Marsabit: 85.71%, Nairobi: 29.41%, Tana River: 85.36%, Turkana: 81.48%, West Pokot: 41.37%.
26 This figure is only for pupils in primary school. The corresponding value for the increase in enrolment from 2012 to 2013 is 17.3% and for 2014 to 2015,
0.9%. The percent increase in enrolment for pre-primary girls from 2013 to 2014 was 2.7%. 27
This figure is only for pupils in primary school. The corresponding value for the increase in enrolment from 2012 to 2013 is 13.4% and for 2014 to 2015,14.9%. The percent increase in enrolment for pre-primary boys from 2013 to 2014 was 7.4%.

59
Theme Outcome Performance Indicator
Data Source Methodology Details/Analysis Plan Baseline Value
Target 2014 Mid-line Value
in schools MOEST data at
county level
MOEST data at county level.
12. Number of
events, radio
spots, and
campaigns held
WFP reports
Secondary data from WFP.
0 44 20 radio spots
13. Number of
community
members
benefiting from
events, radio
spots, and
campaigns held
WFP reports 0 8,800 65,204
MGD 1.3.5 –
Increased
community
understanding
of benefits of
education
14. Percent of
parents in target
communities
who can name
at least three
benefits of
primary
education.
Mid-line survey:
HH/parent
Questionnaire,
Section 3: School
related questions
(Q301)
Parents will be asked to name the
benefits of education they are aware
of. Parents should mention at least 3
benefits. This is consistent with
baseline but we shall use a pre-
defined standard list (while baseline
was kept open). The average % from
respondents will be used to calculate
this indicator.
66% 80% 87.8%28
Provision of
school
MGD 1.2.1
Reduced
15. Percent of
students in
Mid-line survey: Pupil
Questionnaire
Data to be collected through pupils
interviews in each sampled school as
Always: 41%
Sometimes:
59.1%2930
Girls: 57.3%
28 Data from Garissa were not included in the analysis as enumerators misinterpreted the way they were supposed to pose the question. 29
The percent of students who regularly consume a meal before the school day by county: Garissa: 78.8%, Marsabit: 78.8%, Nairobi: 54.1%, Tana River: 73.8%, Turkana: 24.3%, West Pokot: 36.2%. 30
Only 49.3% of parents said that their child had had breakfast in the last 5 days.

60
Theme Outcome Performance Indicator
Data Source Methodology Details/Analysis Plan Baseline Value
Target 2014 Mid-line Value
meals short term
hunger
target schools
who regularly
consume a meal
before the
school day
(Section 2 – Q205);
HH/Parent
questionnaire
(Section 2: Questions
are related
exclusively to the
pupil through which
this HH member was
selected – Q203)
well as from interviews with parents.
Students consuming a meal before
the school day are considered those
who regularly had that meal during
the last 5 days (answer is 5).
39% Boys: 61.5%
16. Percent of
students in
target schools
who regularly
consume a meal
during the
school day
Mid-line survey:
School
Questionnaire,
Section 8. Record
attendance & Food
Utilization (SMP Form
6)
WFP reports: SMP
monitoring system
Data collected from all terms on a
daily basis from form SMP Form 6
Data will be triangulated with WFP
Monitoring data.
70% 68.1%31
MGD 1.2.1.1 –
Increased
access to
food (school
feeding)
17. Number of daily
school meals
(breakfast,
snack, lunch)
provided as a
result of USDA
assistance*
WFP reports Secondary data from WFP N/A 76,000,000
31 The percentage of school feeding days in 2014 as reported in the SMP 6 forms in each county were : Garissa: 66.1%, Marsabit: 69.8%, Nairobi: 75.7%,
Tana River: 50.9%, Turkana: 71.6%, West Pokot: 74.6%.

61
Theme Outcome Performance Indicator
Data Source Methodology Details/Analysis Plan Baseline Value
Target 2014 Mid-line Value
18. Total quantity of
commodities
provided for
school meals
provided to
students as a
result of USDA
assistance
WFP reports: SMP
monitoring system,
WFP SPRs
Review of WFP secondary data and
reports. 19,017mt 6,364mt 14,810mt
19. Number of
students
receiving school
meals as a result
of USDA
assistance
WFP reports: SMP
monitoring system,
WFP SPRs
Secondary data review of WFP
records 767,108
Girls:
262,800
Boys:
321,200
Total:
584,000
753,139
20. Percent of
students in
targeted schools
consuming daily
meals (lunch)
WFP Records
Mid-line Survey using
the school’s records
related to school
At school level we shall take
information from interviews with
teachers and headteachers. In
addition, observations will be made
during the school survey to verify
what proportion of students present
in school eat a meal.
100% 100%
21. Number of
trainings
provided in food
preparation and
storage
WFP Training reports
The data will be obtained from the
WFP training reports.
This data will be triangulated and
counterchecked though interviews at
school level with cooks and
54 11 1732
32 In 2014, the SFP Management Training was carried out in East Pokot, Garissa, Marsabit, Tana River,West Pokot and Samburu which covered also food
preparation and storage practices.

62
Theme Outcome Performance Indicator
Data Source Methodology Details/Analysis Plan Baseline Value
Target 2014 Mid-line Value
practices headteacher.
22. Number of
teachers trained
in food
preparation and
storage
practices
Mid-line Survey
through interview with
headteacher, cooks
and store keeper,
WFP Training reports
3,455 600 1,753
Feed the
Future
indicators
23. Number of social
assistance
beneficiaries
participating in
productive safety
nets as a result
of USDA support
WFP reports: SMP
monitoring system,
WFP SPRs
Analysis from secondary data 767,108 753,139
Increased
national
capacity
MGD 1.4.1 –
Increased
capacity of
government
institutions
24. Percent of
districts in which
food
procurement and
distribution
procedures and
infrastructure are
in place.
MOEST data
Ministry of Education
through the county
education office
Key informant
interviews through
visit at Turkana and
Garissa Counties
Analysis of secondary data from
MOEST. 85.4% 100%
25. Number of
MOEST officers
benefiting from
MOEST data Analysis of secondary data from
MOEST. 6,000 0 4,232
33
33 This indicator was calculated by multiplying the number of home grown school feeding manuals distributed (2,116) times an average of two beneficiaries
per manual.
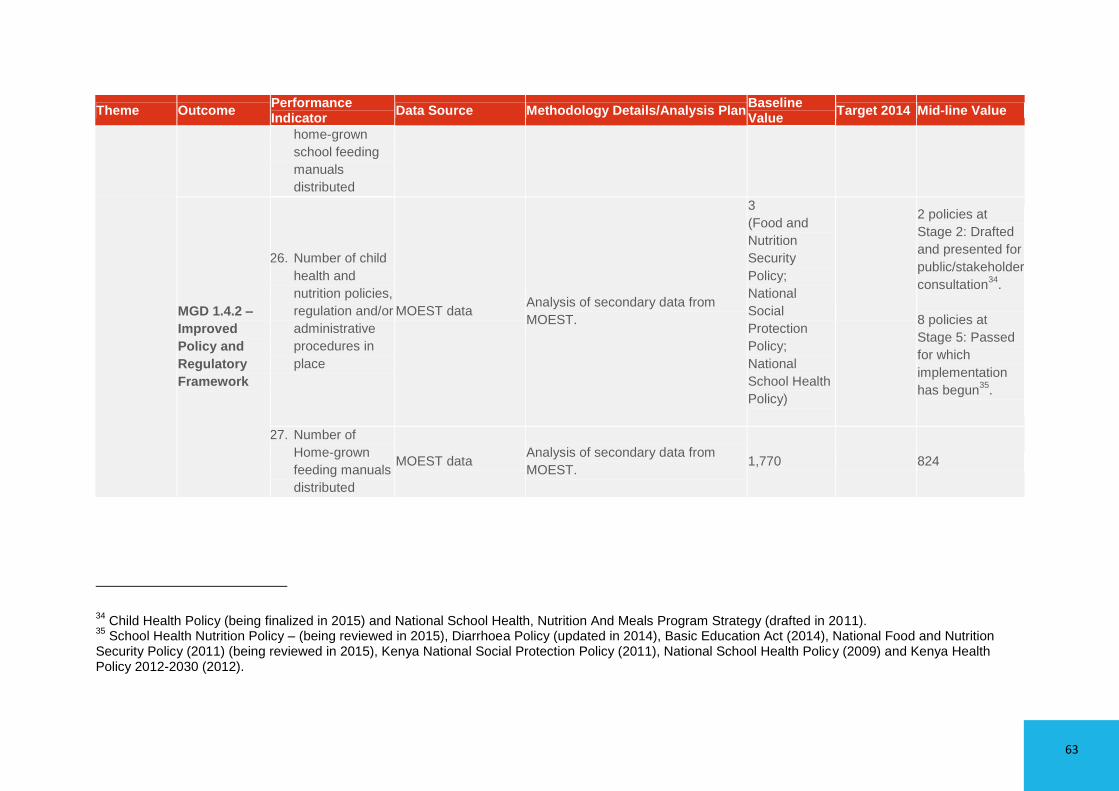
63
Theme Outcome Performance Indicator
Data Source Methodology Details/Analysis Plan Baseline Value
Target 2014 Mid-line Value
home-grown
school feeding
manuals
distributed
MGD 1.4.2 –
Improved
Policy and
Regulatory
Framework
26. Number of child
health and
nutrition policies,
regulation and/or
administrative
procedures in
place
MOEST data Analysis of secondary data from
MOEST.
3
(Food and
Nutrition
Security
Policy;
National
Social
Protection
Policy;
National
School Health
Policy)
2 policies at
Stage 2: Drafted
and presented for
public/stakeholder
consultation34
.
8 policies at
Stage 5: Passed
for which
implementation
has begun35
.
27. Number of
Home-grown
feeding manuals
distributed
MOEST data Analysis of secondary data from
MOEST. 1,770 824
34 Child Health Policy (being finalized in 2015) and National School Health, Nutrition And Meals Program Strategy (drafted in 2011).
35 School Health Nutrition Policy – (being reviewed in 2015), Diarrhoea Policy (updated in 2014), Basic Education Act (2014), National Food and Nutrition
Security Policy (2011) (being reviewed in 2015), Kenya National Social Protection Policy (2011), National School Health Policy (2009) and Kenya Health Policy 2012-2030 (2012).

64
Theme Outcome Performance Indicator
Data Source Methodology Details/Analysis Plan Baseline Value
Target 2014 Mid-line Value
1.4.4 –
Increased
Engagement
of Local
Organizations
and
Community
Groups
28. Number of PTAs
and SMCs
contributing to
their school (use
percentage)
Survey through
interview with
Headteacher and
HH/Parents
Data obtained through interview with
headmaster and HH/Parents.
Particular emphasis will be given in
understanding the frequency and
type of the contribution (food and
non-food items).
70% 93.8% of PTAs,
66.7% of SMCs36
29. Number of
public-private
partnerships
formed as a
result of USDA
assistance*
WFP reports Secondary data from WFP N/A N/A 1337
30. Value of new
public and
private sector
investments
leveraged as a
result of USDA
assistance*
WFP reports Secondary data from WFP N/A N/A USD 15,381,303
Food
utilization
MGD SO 2 –
Increased use
31. Percent of
schools in target
Mid-line survey at
school level through
Interview store keeper and
observation of storage. Criteria that 67% 96%
38
36 While water, firewood, cooking utensils, cleaning products and plates were provided for children in 2014 in at least 87% of cases, during the survey, no
fruits and meat were contributed and vegetables in only 2 schools in Turkana. 37 New partnerships with: International Paper, DSM, FEED, Caterpillar, Earth Holdings, Government of Kenya, Unilever, Drew Barrymore, Princess Haya WPD, IRB, JAWFP, LG Electronics and Goodeed Association. 38
The break down by county is as follows: Garissa: 100%, Marsabit: 96%, Nairobi: 87.5%, Tana River: 100%, Turkana: 100%, West Pokot: 100%.

65
Theme Outcome Performance Indicator
Data Source Methodology Details/Analysis Plan Baseline Value
Target 2014 Mid-line Value
and food
safety
of health and
dietary
practices
communities that
store food off the
ground
physical
observations,
interviews with
person in charge of
the store.
will be used: off ground/on ground,
aeration, vermin and pest free.
MGD 2.2 –
Increased
knowledge of
safe food
preparation
and storage
practices
32. Percent of food
preparers at
target schools
who achieve a
passing score on
a test of safe
food preparation
and storage
Mid-line survey
through interview with
cooks
WFP records
Kimetrica will administer the same
test to cooks used during the
baseline survey with some
improvements. Threshold for
passing: 50% correct answers.
87% 97.9%39
MGD 2.6
Increased
access to
requisite food
preparation
and storage
tools and
equipment
33. Percent of target
schools with
improved food
preparation and
storage
equipment
Mid-line survey
through interviews
with headmaster
(School
Questionnaire) and
cook and physical
observations
Data obtained from interviews with
Headteachers and cooks through
questionnaires. Indicators will be
calculated from our sample by
dividing the schools with improved
storage equipment by the total
number of schools visited
Food
preparation:
60%
Food stores:
67%
-Energy saving
stoves: 37.5% of
schools4041
-Food preparation
(schools with
kitchens) 81%.
-Food store 80%.
-Raised wooden
pallets: 95.8% of
schools.
39 The mid-term evaluation recommends to use in the future a passing threshold should be 80%. Using this threshold, only 29.2% of cooks passed the test.
The break down by county is as follows: Garissa: 12.5%, Marsabit: 14.3%, Nairobi: 50%, Tana River: 37.5%, Turkana: 33.3%, West Pokot: 25%. 40
The break down by county is as follows: Garissa: 12.5%, Marsabit: 37.5%, Nairobi: 87.5%, Tana River: 12.5%, Turkana: 12.5%, West Pokot: 62.5%. 41
27.1% of cooks confirmed that they use energy saving stoves.

66
Theme Outcome Performance Indicator
Data Source Methodology Details/Analysis Plan Baseline Value
Target 2014 Mid-line Value
WFP
Protection
indicator
Proportion of
assisted people
who experiences
threats to safety
problems
travelling to,
from and/or at
WFP program
site
Mid-line survey
through Household
Questionnaire
Parents were asked whether their
child had been exposed to any
threats to his/her safety in the past
month.
N/A N/A
rape: 4.9%,
sexual
harassment:
4.9%, robberies:
3.7%, animal
attacks: 8.2%,
bullying: 3.5%,
abuse of drugs:
4.4%42
42 Rape: Nairobi 12.7%, Garissa 1.2%. Sexual harassment: Nairobi 14.5%. Robbed: Nairobi 5.4%. Animal attacks: Turkana: 22.7%, Nairobi 9.1%, Tana River
2.5%. Bullying: Tana River 2.5%. Abuse of drugs: Nairobi 11%.

67
67
Annex 6: List of Interviewees
Name Position
WFP
Paul Turnbull Deputy Country Director
Lara Fossi Head of Country Program Unit
Charles Njeru and Alex Muhindi School Meals Proramme Team
Beatrice Mwongela and Ruth Musili M&E Team
Konjit Kidane Head of Logistics Team
Nancy Thuo, Olive Wahome, Francis
Mbuvi and Daniel Njenga Logistics Team
Charisse Tillman Donor Relations Officer
John Nelson Donor Relations Officer, Washington
Josphat Wafula Deputy Head of Lodwar Office
Thomas Chika Senior Logistic Assistant, Lodwar
Silvester Nzuki Program Assistant, Garissa
Josphat Ruhia Logistics Assistant, Garissa
Irene Opwora Field Monitoring Assistant, Garissa
MOEST
Paul Mungai Head of School Health Nutrition and Meals (SHNM) Unit
Kibet Lagat School Health Nutrition and Meals (SHNM) Unit
Polycarp Otieno MIS Data System Manager
Nicodemus O. Anyang CDE Turkana
Muthengi Muvea DEO Turkana Central
Wycliffe Kaibei Kironget DEO Loima
Sammy Eloiloi SMP Officer, Lodwar
Adan CDE Garissa
Nur Sub County Director of Education Garissa
Muthui SMP Officer, Garissa
Abdinoor Quality Assurance Officer, Garissa
Fatuma Inspection Officer, Garissa
Hassan Haji Hassan CEC, Garissa
MoH
Erastus N. Karani School Health Specialist Program Officer
Rael Public Health Officer, Lodwar
Abubakar O Jirow Public Health Officer, Garissa
City Education Department
Andrew N. Mwanthi Chief Officer – Education, Children and Youth Affairs
Feed the Children
Ben Mbaya Head of Program
Esther Onyango SFP Coordinator
Rosemary Nyaga M&E Officer
USDA
Kate Snipes Agricultural Counselor

68
68
Kennedy T. K. Gitongs Agricultural Specialist
Niru Pradhan Program Analyst
Amy Ritualo M&E Specialist
Erika Beltran Program Analyst
DFATD
Laurence Morrissette First Secretary for Development
Kimani Mungai Development Officer
PCD
Angela Gituara Kenya Program Manager
Charles Mwandawiro Deputy Director Partnerships and Collaborations KEMRI
and Senior Strategic Adviser to PCD
Evidence Action
Caroline Teti Senior Program Manager
Lorina Kagosha Program Manager
SNV
Eliud Nkunja Business Development Advisor, HGSFP-BMGF
UNICEF
Daniel Baheta Chief of Education
Other
James Kipkan Turkana Rehabilitation Project Program Manager
Kiembi Director TSC Garissa

69
69
Annex 7: Survey Instruments
KI Checklists
WFP Officers Nairobi
Logistics Team:
What are the main reasons for the pipeline breaks when they occur? Does WFP ever
experience delays in the dispatch of food due to customs and clearance issues?
Discussion point: tender process for identification of trucks for primary transport -
experiences and lessons learned.
Confirm the pipeline supply chain, particularly the secondary transport - are the logistics
teams in Nairobi able to control the timely delivery of the secondary transport?
How is the quantity of food to be distributed to the schools calculated at DEOs' level? Is
it based on enrolment information received from the schools or on food availability
only?
Regarding the Distribution Plans, is data on actual food received by the schools recorded
following the delivery?
In terms of the handover of the program to the government (HGSMP), are there any
plans for WFP to hand over some of the logistics aspects/arrangements? If so, which
ones?
What are the procedures adopted for pest control and management in the DEOs
warehouse? How common is it for these warehouses to incur food losses due to
pest/insect attacks?
What are the main reasons for food losses in DEOs warehouses?
Has WFP experienced food losses is in its own warehouses? If so, due to what reasons?
Do you have any recommendations regarding specific aspects that should be addressed
by the Kimetrica Evaluation Team?
Donor Relations:
In terms of USDA assistance, what is the likelihood that its support to WFP will be
renewed for the SFP?
Is the current support provided by USDA sufficient to cover the identified school needs?
What other donors are supporting WFP Kenya in the SFP? What are their roles and
synergies with USDA?
Kindly reiterate the modes of communication to be used with USDA in Washington.
Do you have any recommendations regarding specific aspects that should be addressed
by the Kimetrica Evaluation Team?

70
70
School Meal Program Team:
Brainstorm main points for benefits of primary education (related to the
questionnaires).
Regarding the meal rations, what are the schools' coping mechanisms if they receive less
food? Do they re-calculate the rations based on food available?
According to your observations, is there an actual difference in the ration size of pre-
primary and primary children or do they all receive the same amount of food? Do the
schools record these different ration sizes distributed to children?
According to your observations, what has been the general experience with teachers'
attendance?
Community contributions to the SFP - if yes, food/non-food items.
What are WFP's generic impressions on the hygiene conditions of the different schools
across counties? Are the basic standards generally met?
Do schools usually have both a cook and a store keeper or are these functions covered
by the same person?
According to your experience, do schools have energy efficient stoves?
Do you have any recommendations regarding specific aspects that should be addressed
by the Kimetrica Evaluation Team?
Deputy Country Director:
Hand over process to government - How is this going? Is it going according to the WFP
Country Program? Any changes?
Capacity building to GoK related to secondary transport in particular Commodity
Management and Bidding process to select transporters as well as Quality Assurance for
the HGSMP. This came out as a possible need from interview with logistics. Is it
something feasible to recommend? Pros and cons.
How feasible would it be to recommend a meal for teachers (like the students) to
increase their motivation and attendance?
Any recommendations or suggestion you may have for the evaluators
M&E Team:
Clarification about the calculation of the following indicators
o Percentage of students who regularly consume a meal - how is this calculated? is
this just a measure of students that attend school? (when there is food, all kids
get the meal). 80 percent in the baseline survey.
o Percentage of students in targeted schools consuming daily meal. What is the
difference with the previous one? 100 percent Baseline survey
Indicator “proportion of students who by the end of two grades of primary schooling,
demonstrate that they can read and understand the meaning of grade level text”. We
developed a test which lasts 30-40 minutes. However the challenge is that SFP benefits

71
71
all primary (and pre-primary) students. So picking only grade 2 students might not be
relevant. We suggest to calculate this by collecting the performance (average score per
term) of 10 pupils randomly selected in each school. And triangulate with SDI survey
2012 from World Bank. Is this acceptable to you? Baseline used Uwezo report.
Indicator on MO2 “Increase use of health and dietary practices”. Based on PMP we
calculate this with percent of schools in target communities that store food off the
ground - is this ok?
WFP did the actual counting of pupils in Samburu and Isiolo. Do you have a report with
the difference between official number of pupils enrolled and the one counted?
SFP 6 forms - do you have a copy (or manage to get a copy) for each month of academic
year 2014 for the sampled schools?
Data from monthly monitoring form (related to Flavio's email yesterday) - we are
interested in the ration sizes, school feeding, hygiene and pupils' perceptions sections.
We intend to interview the following people: 1 cook (including the test on safe food
preparation), 1 storekeeper, 10 pupils, 1 parent per pupil (=10 parents), 1 headmaster, 1
teacher. Just to agree on this.
Any recommendations or suggestion you may have for the evaluators
Head of Country Program Unit
Discussion about the two main findings from last week’s meetings: inflation of
enrolment figures and pipeline breaks due to USDA procedures - implication for
evaluation findings/recommendations and SFP;
Current delays for Term 2 and expected effects on pupils’ attendance;
Discussion of potential capacity building role for WFP in handover process – commodity
management and tendering procedures for selection of transporters (secondary
transport GoK) and quality assurance of food for HGSMP – feasible recommendation?
General impressions on handover process and commitment of GoK.
Clarification of handover strategy for Nairobi schools using Australian funding –
difference between formal and informal schools.
Considering the SFP funding constraints (USDA and other donors) and GoK’s
commitment, discuss the possible implications on the continued handover process to
the GoK.
Discussion of potential WFP monitoring role following handover to GoK (frequency,
duration, etc.).
Given the lengthy bureaucratic procedures within GoK and the consequences this will
have on the implementation of CTs for HGSMP, is there a role for WFP in addressing
these potential constraints?
Suggested teleconference with WFP Washington Office to better understand USDA
procurement and shipping processes – confirmation of whether this is necessary.
Any recommendations or suggestion you may have for the evaluators.

72
72
MOEST Officials
Relationship and collaboration with WFP. Lesson learnt, areas of improvement.
Discussion of the handover strategy and sustainability of the SFP.
Relationship and interaction with MoH regarding SFP.
Involvement of MOEST in the design of WFP M&E tools and selection of USDA indicators.
Number of education policies updated, issued or under discussion in 2014 and 2015.
Discussion of SFP’s position and relevance within the broader education policies and
programs.
Pipeline breaks and management of DEO warehouses and secondary transport –
challenges, lessons learnt and recommendations.
Enrolment versus attendance – issue of inflated figures and how to address this.
Attendance of teachers and quality of teaching.
Training of MOEST officers by WFP in 2014 – frequency, type of trainings and perceived
impacts.
Discussion concerning the methods used to assess literacy levels.
Lessons learnt and suggestions for improvement of the SFP.
Any recommendations or suggestions you may have for the evaluators.
MoH Officials
Child health and nutrition policies updated, issued or under discussion in 2014 and 2015.
Consolidated data on training received at county level through the support of WFP in
2014 – frequency, type, number of people trained (if available).
Relationship and collaboration with WFP and the SFP.
Relationship and interaction with MOEST, including at the county level.
Roles and responsibilities of MoH within the SFP.
Any recommendations or suggestions you may have for the evaluators.
City Education Department (government counterparts for school feeding, Nairobi)
Checklist:
Confirmation of CED roles and responsibilities within the SFP in Nairobi.
Collaboration and relationship with WFP and FTC counterparts.
Elaboration of CED role within the joint termly monitoring process of SFP in Nairobi –
main issues that arise and correction mechanisms.
Perceived opinion regarding the effect of SFP on attendance and literacy levels of pupils
(including any data, if available).
Discussion of any planned handover strategy.

73
73
Lessons learnt and suggestions for improvement of the SFP.
Any recommendations or suggestions you may have for the evaluators.
Feed the Children
Checklist:
Confirmation of FTC's roles and responsibilities within the SFP in Nairobi.
Delivery timelines by FTC once the food is received from WFP.
Pipeline breaks - delays in food deliveries, average delay time, reasons.
Storage facilities in Nairobi - any issues? Pest infestation and fumigation procedures?
Relationship with WFP and schools (and government institutions?) for the preparation of
Distribution Plans.
Monitoring procedures - FTC's role, if any at all. If yes, FTC's general experience on SFP's
performance and implementation issues (ration size, enrolment versus attendance,
actual school feeding days, hygienic standards and storage procedures, etc.).
Clarification of data received for 2014 - planned versus actual food delivered in schools.
Pre-testing of questionnaires - possibility of arranging this in Nairobi with one of the
non-sampled schools during the third week of April (please see attached the list of
sampled schools for Nairobi). Since the schools are closed, explore possible solutions.
Any recommendations or suggestion you may have for the evaluators.
USDA representatives in Nairobi and Washington (Donor)
Checklist:
Experience with WFP for management of current agreement – lessons learnt and
recommendations.
Discussion about the main challenges related to SFP implementation.
Pipeline breaks and delay of commodity arrivals in Mombasa – lessons learnt and
recommendations.
Handover strategy and future involvement of USDA in the SFP beyond 2016 (cash versus
in-kind).
Any recommendations or suggestions you may have for the evaluators.

74
74
Department of Foreign Affairs, Trade and Development Canada (DFATD) – (Donor)
Checklist:
Confirmation of DFATD roles and responsibilities within the SFP.
Synergies with other donors for SFP.
Relationship with WFP – lessons learnt and recommendations.
Discussion of handover strategy – status, perceptions and suggestions for improvement.
Future DFATD funding plans for SFP.
Areas of improvement in SFP.
Any recommendations or suggestions you may have for the evaluators.
SNV (complementary partner)
Checklist:
Confirmation of SNV’s roles and responsibilities and how it complements the SFP.
Relationship with WFP and other donors.
SNV role in the Technical School Feeding Committee, lesson learnt, main issues
encountered and suggestions.
Perceived impact of SFP in Kenya.
Suggestions for the handover strategy.
Future SNV funding plans for complementary activities.
Any recommendations or suggestions you may have for the evaluators.
PCD – Partnership for Child Development (complementary partner)
Checklist:
Confirmation of PCD’s main role and activities implemented within the education and
child support sector, how PCD’s activities complement the SFP and contribute to its
relevance.
PCD role in the Technical School Feeding Committee, lesson learnt, main issues
encountered and suggestions.
Relevance of the WFP SFP within PCD activities.
Relationship with WFP– lessons learnt and recommendations.
Future trends of fundraising. Effect on continuation of PCD Programs.
Any recommendations or suggestions you may have for the evaluators.

75
75
Evidence Action - Deworm the World Initiative (complementary partner)
Checklist:
Confirmation of Evidence Actions’ main role and activities implemented within the
education and child support sector, how their activities complement the SFP and
contribute to its relevance.
Frequency and geographic coverage of Evidence Action activities linked to the SFP; main
issues and recommendations.
Relationship with WFP – lessons learnt and recommendations.
Future fundraising trends. Effect on continuation of Evidence Action Programs
Any recommendations or suggestions you may have for the evaluators.
UNICEF (UN counterpart in education)
Checklist:
Confirmation of UNICEF’s main role and activities implemented within the education and
child support sector in Kenya, including relationship with MOEST and other government
structures.
Complementarity and synergies between UNICEF’s programs and WFP’s SFP.
Geographical coverage.
Issue of inflated enrolment figures to receive government funding for primary education
– UNICEF’s experience.
General discussion of UNICEF’s experience with school level interventions – main issues
and challenges.
Relationship with WFP – lessons learnt and recommendations.
Any recommendations or suggestions you may have for the evaluators.
County Level KI Interviews: Garissa and Turkana
County Directors of Education (CDE) and District Education Officers (DEOs) (MOEST):
Overall discussion on implementation of SFP;
Challenges encountered, if any, in the management of DEO warehouses and secondary
transport of commodities to schools;
Perceived impact of SFP on pupils’ attendance and education;
Handover process for Garissa and Turkana counties – are the timeline and processes
clearly established?
In your opinion, are there any areas where WFP could provide additional support? i.e.
procurement and logistics aspects, technical assistance

76
76
Relationship with WFP – lessons learnt and recommendations, including other possible
areas of support.
Interaction with MoH officials in the county.
Handover strategy. Comments and recommendations.
Any recommendations or suggestions you may have for the evaluators.
Education officials (Quality Assurance Standard Officer, School feeding Officer, Inspectors, TSC) :
Relationship with WFP and SFP implementation – discussion on frequency/type of
interaction, confirmation of roles and responsibilities, lessons learnt and
recommendations;
Perceived impact of SFP on pupils’ attendance and education;
Discussion on main education constraints in the county and how these are addressed by
SFP;
Discussion of status of facilities in SFP schools (store room, kitchen, etc).
Lesson learnt, areas of improvements, suggestions and recommendations to improve
SFP.
In your opinion, are there any areas where WFP could provide additional support?
Handover strategy. Comments and recommendations.
Any recommendations or suggestions you may have for the evaluators.
Public Health Officers (PHOs) (MoH):
Relationship with WFP and SFP implementation – discussion on frequency/type of
interaction, confirmation of roles and responsibilities, lessons learnt and
recommendations.
Training received through the support of WFP in 2014 – frequency, type, number of
people trained.
Discussion of status of facilities (store room, kitchen, etc) and storing procedures in SFP
schools.
Discussion of monitoring procedures for quality of the food delivered and main
challenges, if any.
Lesson learnt, areas of improvements, suggestions and recommendations to improve
SFP.
In your opinion, are there any areas where collaboration with WFP could be
strengthened?
Any recommendations or suggestions you may have for the evaluators.

77
77
WFP Field Officers in Garissa and Turkana:
Overall discussion on implementation of SFP;
Challenges encountered, if any, in the management of DEO warehouses and secondary
transport of commodities to schools;
Perceived impact of SFP on pupils’ attendance and education;
General experience with teachers' attendance and quality of teaching;
Trainings of local officials/teachers – frequency and perceived impact.
Interaction and relationship between MOEST & MoH officials in the county related to
SFP.
Handover process for Garissa and Turkana counties – are the timeline and process
clearly established?
In your opinion, are there any areas where WFP could provide additional support? i.e.
procurement and logistics aspects, technical assistance
Relationship with DEO and local government officials – lessons learnt and
recommendations.
Any recommendations or suggestions you may have for the evaluators.
Turkana Rehabilitation Project:
Discussion on project objectives and implementation progress;
Cooperation and synergies with SFP, if any (actual or potential);
Relationship with WFP;
Any recommendations or suggestions you may have for the evaluators.
School level KI Interviews: Headteacher, Teachers and Parents:
Lesson learnt, areas of improvements, suggestions and recommendations.

78
Questionnaires
School Questionnaire
Respondent Identification
# Question Response Code
Q101 County
Q102 Sub-County- District
Q103 Zone
Q105 School name
Q106 Latitude
Q107 Longitude
Q108 Respondent name
Q109 Which Position do you occupy in this school
___
1. Head Teacher/Principal 2. Deputy Head Teacher 3. Teacher 4. Administrative officer 5. Other
Q110 Director/Headmaster name (only if Respondent is not the Head Teacher)
Q111 What is the school category
___
1. Boys School 2. Girls School 3. Mixed gender School
Q112 Please can we have your Mobile Phone number
Q113 Date of Interview ____/____/____
Day/Month/Year (e.g. 15 / 04 / 2015)
Q114 Name of Enumerator

79
Section 2: School Feeding Program Question Response Code
Q201 What are the avenues or
communication channels through which
parents and pupils get information
about SMP or make complaints about
the program (WFP: Protection and
Accountability to affected
population)?
(Circle all that apply)
1. None
2. Regular meetings with SMC
3. Regular meetings with School Administrators
4. Suggestion Box
5. Helpline
6. Other (specify)________
Q202 How many people are involved in the
preparation of the food (food preparers,
cook and store keeper)
____
Q203 Does the school have a Parent
Teacher Association (PTA)? ____
1. Yes
2. No
Q204 Does the school have a School Meal
Committee (SMC)? ____
1. Yes
2. No (skip to Q206)
Q205 What is the level of participation and
engagement of the SMC in the SFP? ____
1. High
2. Medium
3. Low
Q206 What is the distance by road (km) to
the nearest food market? ____
Q207 What is the distance by road (Km) from
school to the nearest educational
office?
____
Q208. Non-food contribution
ID Non-food item contribution by School/Parents
Contributed during academic year 2014? 1. Yes 2. No (go to Next)
Who Contributed? 1. School 2. Parents 3. External Donors 4. Combination (specify)
Approximate % of requirement met. 1. More than 100% 2.100% 3.50% 4.25% 5.10% 6. 0%
Q208_1 Q208_2 Q208_3 Q208_4 Q208_5
1 Water
2 Firewood
3 Cooking Utensils
4 Cleaning Products
5 Plates and cutlery for
pupils
6 Cooks Salary
7 Other
(specify)_____________
8 Other
(specify)_____________
9 Other

80
(specify)_____________
Section 3: School Facilities Question Response Code
Q301 Number of classrooms ________
Q302 Does the school have a Library or a
place where books are stored? ________
1. Yes
2. No (go to Q304)
Q303 If yes, how many supplementary books
does the school have? ________
Q304 Does your school have a kitchen? ________
1. Yes (go to Q306)
2. No
Q305 If not, where is the food normally
prepared? ________ 1. In a classroom
2. Open space
3. Other
Q306 Does your school use energy saving
stoves? ________
1. Yes
2. No
Q307 What is the main source of DRINKING
water?
________
1. Piped water into dwelling,
plot, or yard
2. Public tap/standpipe
3. Tube well/borehole
4. Protected dug well
5. Protected spring
6. Rainwater collection
7. Unprotected spring
8. Cart with small tank/drum
9. Tanker truck
10 Surface water (river, dam,
lake, pond, stream, canal, or
irrigation channel)
11 Bottled water
12. Children carry water from
home
13. Other
Q308 Does the school have toilets for pupils?
ONLY FOR OBSERVATION
________ 1. Yes
2. No (go to section 4)
Q309 Do the toilets have hand washing
facilities within or nearby?
ONLY FOR OBSERVATION
________
1. Yes
2. Some of them
3. No
Q310 How many toilets blocks have hand
washing facilities within or nearby?
________
Q311 Do girls have separate toilets from
boys?
ONLY FOR OBSERVATION
________
1. Yes
2. No

81
What type of toilet does the school have
Does your school have this type of toilet? 1. Yes 2. No (go to next)
Number of boys’ toilets
Number of girls’ toilets
Number of mixed toilets
Q312 Q313 Q314 Q315 Q316
1 Flush or pour/flush facilities
connected to a: (Piped sewer,
septic, pit latrine)
2 Flush or pour/flush toilets without a
sewer connection
3 Pit latrines with a slab
4 Pit latrines without slab/open pit
5 Ventilated improved pit latrines
6 Composting toilets
7 Bucket latrines
8 Hanging toilets/latrines
9 No facilities, open defecation

82
Section 4: Teacher-Head Teacher Teacher ID
Teacher Name (Optional)
Sex 1. Male 2. Female
Age Qualification 1. Senior Graduate 2. GT1 3. GT2 4. ATS 1 5. ATS 2 6. ATS3 7. ATS4 8. P1 9. Untrained 10. Other
Position in the school 1. Head teacher/ principal 2. Deputy head teacher 3. Senior teacher 4. Teacher (government) 5. Teacher (paid contract) 6. Teacher (volunteer) 7. Other (specify)
Years of teaching experience
Years of experience as Head Teacher (for Head-Teacher only)
Full time/ Part time 1. Full-time 2. Part-time
Teachers' attendance in 2014 (in percent)
Teachers trained in safe food preparation and storage practices 1. Yes 2. No
Q401 Q402 Q403 Q404 Q405 Q406 Q407 Q408 Q409 Q410 Q411
1
2
3
4
5
6
7
8
9
10
11
12
13
14

83
Section 5: Observation School Survey
Pupils attending class during survey
Day 1 Day 2 Day 3
Q501 Q502 Q503
Teachers present in school during survey
Day 1 Day 2 Day 3
Q504 Q505 Q506
The enumerator weighs ten random pupils' rations (in grams)
Observations Day 1 Day 2 Day 3
Q507 Q508 Q509
1
2
3
4
5
6
7
8
9
10
How many teachers eat lunch with food coming from the same pot used to feed the pupils? (FROM OBSERVATION)
Day 1 Day 2 Day 3
Q510 Q511 Q512

84
The enumerator weighs commodities cooked on each school survey day (distinguish between commodities provided by WFP and by School/Parent contribution) (in grams)
No. Items
Day 1 Day 2 Day 3
WFP School/Parents WFP School/Parents WFP School/Parents
Q513 Q514 Q515 Q516 Q517 Q518
1 Maize
2 Bulgar Wheat/Rice
4 Pulses
5 Vegetable Oil
6 CSB/CSM/UNIMIX
7 Salt
8 Fruits
9 Vegetables
10 Meat
11 Other (specify)
12 Other (specify)
No Non-food item contribution by School/Parents
Day 1 1. Yes 2. No
Day 2 1. Yes 2. No
Day 3 1. Yes 2. No
Q520 Q521 Q522
1 Water
2 Firewood
3 Cooking Utensils
4 Cleaning Products
5 Plates and cutlery for pupils
6 Cooks Salary
7 Other (specify)____________________

85
Section 6: Student record # Acade
mic year
Total number of students enrolled: (Male)
Total number of students enrolled: (Female)
Total number of students: Transferred OUT (Male)
Total number of students: Transferred OUT (Female)
Total number of students: Dropout (Male)
Total number of students: Dropout (Female)
Q601
Pre-Primary
Primary
Pre-Primary
Primary
Pre-Primary
Primary
Pre-Primary
Primary
Pre-Primary
Primary
Pre-Primary
Primary
Q602 Q603 Q604 Q605 Q606 Q607 Q608 Q609 Q610 Q611 Q612 Q613
1 2015
2 2014
3 2013
4 2012
2014 class 8 cohort
Q614 Total number of students enrolled in 2007: (Male)
Q615 Total number of students enrolled in 2007: (Female)
Q616 Students cohort who completed Primary within the same school: (Male)
Q617 Students cohort who completed Primary within the same school (Female)
Q618 Total number of students: Transferred OUT but completed Primary elsewhere between
2007-2014 (Male)
Q619 Total number of students: Transferred OUT but completed Primary elsewhere between
2007-2014 (Female)
Q620 Total number of students: Dropout between 2007-2014 (Male)
Q621 Total number of students: Dropout between 2007-2014 (Female)

86
Section 7: School & Student Performance
Q700 Average KCPE Score (2014)
Term 1 (2014)
Term 2 (2014)
Term 3 (2014)
Average Mark for 2014 (out of 500)
Q701 Q702 Q703 Q704
Average mark for Class 2 pupils (out of 500)
Average mark for Class 8 pupils(out of 500)
No. Pupils Name
(Optional)
Sex 1. Male 2. Female
Class
School Attendance (days)
Average Pupil Mark (out of 500)
Term 1 Term 2 Term 3 Term 1 Term 2 Term 3
Q705 Q706 Q707 Q708 Q709 Q710 Q711 Q712 Q713
1
2
3
4
5
6
7
8
9
10

87
Section 8: Record attendance & Food Utilization (SMP Form 6) Term Day Date
Pre-Primary Attendance
Primary Attendance
Total Attendance
School Feeding Provided 1. Yes 2. No (go to Q815)
Maize / bulgar wheat (Kg)
Pulses (Kg)
Veg. Oil (Kg)
Salt (Kg)
CSB (Kg)
Top 3 reasons for missed meals. (Use code below)
What was the source of lunch eaten on those days when meal was not provided? (Use code below)
Boys Girls Boys Girls
Q801 Q802 Q803 Q804 Q805 Q806 Q807 Q808 Q809 Q810 Q811 Q812 Q813 Q814 Q815 Q816
Codes for Q815 Codes for Q816
1. Over scooping
2. Less food was delivered to the school than required
3. Lack of firewood therefore did not cook on certain days
4. No cook to prepare the food
5. Food was not delivered on time
6. Lack of cooking utensils
7. Other (Specify)___________
1. Pupils brought their own lunch from home
2. Pupils were sent home to eat during lunch time
3. Lunch purchased by school using school fees
4. Pupils did not eat lunch at all
5. Other (specify)_____________

88
Section 9: Delivery Record What quantity of food was received during the academic year 2014?
Was there any carryover stock for this item at the beginning of Term 3 of 2014 (September)? 1. Yes 2. No (skip to Q904)
Amount in kg
Did school receive this item in Term 3 of 2014? 1. Yes 2. No(skip to Q906)
Amount in kg
Any loss incurred during Term 3 of 2014? 1. Yes 2. No(skip to Q908)
Amount in kg
Actual Delivery Date
Expected delivery date (based on Distribution Plan)
Q901 Q902 Q903 Q904 Q905 Q906 Q907 Q908 Q909
1 Maize
2 Bulgar
Wheat/Rice
3 Pulses
4 Vegetable Oil
5 CSB/CSM/UNIMIX
6 Salt
7 Other
8 Other
#2__________
9 Other
#3__________

89
Section 9: Delivery Record (CONTINUE) What quantity of food was received during the academic year 2014?
Was there any carryover stock for this item at the beginning of Term 2 of 2014 (May)? 1. Yes 2. No (skip to Q912)
Amount in kg
Did school receive this item in Term 2 of 2014? 1. Yes 2. No(skip to Q914)
Amount in kg
Any loss incurred during Term 2 of 2014? 1. Yes 2. No(skip to Q916)
Amount in kg
Actual Delivery Date
Expected delivery date (based on Distribution Plan)
Q901 Q910 Q911 Q912 Q913 Q914 Q915 Q916 Q917
1 Maize
2 Bulgar
Wheat/Rice
3 Pulses
4 Vegetable Oil
5 CSB/CSM/UNIMIX
6 Salt
7 Other
8 Other
#2__________
9 Other
#3__________

90
Section 9: Delivery Record (CONTINUE) What quantity of food was received during the academic year 2014?
Was there any carryover stock for this item at the beginning of Term 1 of 2014 (January)? 1. Yes 2. No (skip to Q920)
Amount in kg
Did school receive this item in Term 1 of 2014? 1. Yes 2. No(skip to Q922)
Amount in kg
Any loss incurred during Term 1 of 2014? 1. Yes 2. No(skip to Q924)
Amount in kg
Actual Delivery Date
Expected delivery date (based on Distribution Plan)
Q901 Q918 Q919 Q920 Q921 Q922 Q923 Q924 Q925
1 Maize
2 Bulgar
Wheat/Rice
3 Pulses
4 Vegetable Oil
5 CSB/CSM/UNIMIX
6 Salt
7 Other
8 Other
#2__________
9 Other
#3__________

91
Teacher Questionnaire
Respondent Identification
# Question Response
Q101
County
Sub-County- District
Zone
School name
Q102 Date of Interview ____/____/____
Q103 Name of Enumerator
# Teacher Name (optional)
Class In your observation, on average in 2014, what percentage of students in your classes were inattentive?
According to you, what is the main reason for students' inattentiveness? 1. Hunger 2. Tiredness from domestic or income-generating work 3. Sickness 4. Perceived unimportance of primary education 5. Other (specify)
According to you, if WFP SFP would stop today, what would be the consequence on pupil attendance? 1. No consequence, attendance remains the same 2. Attendance will drop slightly (10%) 3. Attendance will drop drastically (over 30%)
Q104 Q105 Q106 Q107 Q108 Q109
1
2
3
4
5
6
7
8
9
10

92
Pupil Questionnaire
Respondent Identification
# Question Response Code
Q101 County
Q102 Sub-County- District
Q103 Zone
Q101 School name
Q102 Student name
Q103 Sex
1=Male
2=Female
Q104 Age
Q105 Current Grade/Class
Q106 Father' name
Q107 Mother's name
Q108 Date of Interview _____/_____/_____
Day/Month/Year (e.g. 15 / 04 /
2012)
Q109 Name of Enumerator
(alias/code name)

93
Section 2
Question Response Code
Q201 Did you eat a meal during
lunch time yesterday/last
school day?
1=Yes
2=No (go to Q205)
Q202 Where did this meal come
from?
1. Lunch provided by school
2. Bring own food and eat at
school
3. Pay for lunch e.g. kiosk or school
canteen
4. Went home for lunch and then came
back
5. Other
Q203 Were you still hungry after the
meal?
1=Yes
2=No
Q204 Did you leave anything on the
plate?
1=Yes
2=No
Q205 In the past 5 school days, how
many days did you eat
breakfast before going to
school?
0 to 5
Q206 In the past 5 school days, how
many days did you eat a meal
after going to school (and
before going to bed)?
0 to 5
Q207 Normally, if you become
aware that the school food is
finished, do you come to
school the next day?
1=Yes
2=No
Q208 How long does it take to
get to school?
1=less than 15 minutes,
2=between 15 and 30 minutes,
3=between 30 and 60 minutes,
4=more than 1 hour
Q209 How do you travel to school? 1=on foot,
2=by bicycle,
3=by car,
4=by bus,
5=by motorbike,
6=other

94
Household Questionnaire
Respondent Identification
# Question Response Code
Q101 County
Sub-County- District
Zone
School Name
Q102 Household address
Q103 Household size
Q104 Number of pupils in pre-primary and
primary school within the HH
Q105 Number of school years attended by the
head of the household?
Q106 What is the main occupation of the head
of the household?
1=Too old to work
2= Student
3= Farmer
4= Pastoralist
5= Salaried Employee
6= Casual Labourer
7= Self-employed
business
8= Not currently working
9= Other
Q107 What is the head of the household’s
current marital status?
1 = Married or living
together
2 = Divorced or separated
3 = Widowed
4 = Single
Q108 Date of Interview
Q109 Enumerator Name

95
Section 1: Demographics
# Name of Respondent Age of Respondent
Sex 1=Male 2=Female
Phone Number
Relationship to the head of the household 1= head 2=spouse 3=elder son/daughter 4=brother/sister 5=other relative
Q110 Q111 Q112 Q113 Q114 Q115
1
2
3
4
5
6
7
8
9
10
11
12
13
14
15

96
Section 2: Questions are related exclusively to the pupil through which this HH member was selected Respondent ID (from previous section)
Which class/grade does child attend?
In the past 5 school days, how many days did the child eat breakfast before going to school? (0 to 5)
In the past 5 school days, how many days did the child eat a meal after going to school (and before going to bed)? (0 to 5)
On school days, when school meals are provided, do you reduce the portion of food provided to the pupil compared to the week end? 1. Yes 2. No (go to Q207)
On average how much do you reduce the portion compared to the week end? 1. 25% 2. 50% 3. 75%
Was there a time in 2014 when the school did not provide a meal? 1. Yes 2. No (go to Q209) 3. I don’t know
If yes, how did the child eat lunch at school? 1. Child brought own food and eat at school 2. Gave cash to child to buy lunch 4. Child came home for lunch and then went back to school 5. Child remained home and eat home 6. No lunch 7. Other (Specify)
Q201 Q202 Q203 Q204 Q205 Q206 Q207 Q208
1
2
3
4
5
6
7
8
9
10

97
Section 3: Questions are related exclusively to the pupil through which this HH member was selected (CONTINUE)
Respondent ID (from previous section)
Did the school asked payment specific for school meals during the academic year 2014? 1. Yes (go to Q210) 2. No (go to Q211)
How much? (In Kshs)
During the academic year 2014, approximately how many days was the child absent from school?
Days absent for school closure during the school terms
Days absent for child work on farm or livestock tending
Days absent for child looking after siblings or domestic work
Days absent because of lack of food
Days absent because of insecurity, fear of going to school
Days absent for sickness
Days absent for ceremonies and family events
Days absent due to skipping school
Q201 Q209 Q210 Q211 Q212 Q213 Q214 Q215 Q216 Q217 Q218 Q219
1
2
3
4
5
6
7
8
9
10

98
Section 4: School related questions
Question Response Code
Q301 Please list at least 3 benefits of Primary
education?
1. Improves literacy rate
2. Social Skill Development
3. Increases ability to learn new skills (adoption of technology)
4. Girls remain more in school and early marriages are delayed
5. Improves cohesion in the community
6. Helps break the cycle of poverty
7. Increases the chances of the pupils' future economic self-reliance
8. Through girls' education, improves the general wellbeing of households (nutrition,
health etc)
Q302 Do any avenues exist through which you
can get information or make complaints
on the SFP?
____ 1=Yes
2=No (go to Q304)
Q303 If yes, which avenues exist? 1 .Regular meetings with SMC
2. Regular meetings with School Administrators
3. Suggestion Box
4. Hotline
5. Other (specify)________
Q304 Are you aware of the existence of the
School Meal Committee (SMC)?
1=Yes
2=No (go to Q306)
Q305 If Yes, what is your perception of the
SMCs involvement in the SFP.
1=High
2=Medium
3=Low

99
Q306: In the past 30 days, please indicate the number of cases of physical and/or emotional threats to the safety of your child that he/she was exposed to when walking to and from school or at school.
ID Type of threat Number of cases child was exposed to this
threat
Q306_1 Q306_2 Q306_3
1 Rape
2 Sexual Harassment
3 Robbed
4 Animal Attacks
5 Bullying
6 Abuse of drugs

100 100
Cook Questionnaire
Respondent Identification
# Question Response Code
Q101
County
Sub-County- District
Zone
School name
Q102 Respondent name
Q103 Sex of the Respondent: ___
1. Male
2. Female
Q104 Respondent's Position:
1. Cook
2. Food Preparer
Q105 Date of Interview ____/____/____
Day/Month/Year (e.g. 15 / 04 /
2015)
Q106 Name of Enumerator

101 101
Section 2: School feeding program information
# Question Response Code
Q201 Are you trained in safe food preparation
and storage practices (confirm with any
records, if available)?
1. Yes
2. No (go to Q203)
Q202 If Yes, how many times have you
received training in 2014?
__________
Q203 Do you have a valid health certificate? 1. Yes (go to Q205)
2. No
Q204 if no, what is the main reason? 1. Cannot afford the fee
2. Didn't have time to go to the
health centre
3. Don't know how to get one
4. Don't think I need one
5. Other (specify)
Q205 Do children wash their hands before the
meal?
1. Yes
2. No
Q206 When is the last time you received your
salary?
_____/_____ MONTH/YEAR
Q207 Do you receive your salary regularly
every month?
1. Yes
2. No
Q208 Do you use energy saving stoves? 1. Yes
2. No
Q209 Are the cooks clean and well groomed?
DIRECT OBSERVATION
1. Yes
2. No
Section 3: Safe Food Preparation Practices (for Cook)
# Question Response Code
Q301 Do you have a uniform or apron for use
in the kitchen?
1. Yes
2. No
Q302 When do you clean your kitchen? 1. Every morning before food
preparation, often during the day
and after use
2. After food preparation
3. At the end of the week
Q303 Which is the best source of water for
cleaning and cooking food?
1. Piped water, rain water and
boreholes which are well
protected
2. Water from the river/streams
3. Water from a pond
Q304 When do you usually wash your hands
for food preparation?
1. Before handling food and
often during food preparation
2. After using the latrine
3. After finishing food
preparation
4. Never

102 102
Q305 How do you ensure that food is clean
before cooking?
1. Rinse it in water and cook
2. Remove foreign matters then
cook
3. Use clean containers to
collect it from the store, remove
foreign matters and then wash it
with clean water thoroughly
before cooking
Q306 When do you wash your cooking utensils
(cooking pots, lids, scoops, knives,
plates etc.) with clean water and soap
1. After use
2. Prior to using them
3. Prior to, after using them and
drying them in a rack before
storage
Q307 Are there measures in place to prevent
food from contamination from pests and
rodents? Name them:
1. ____________________________
2. ____________________________
Q308 What is the most important thing to
check in food before cooking?
1. Expiry date, packaging, color
of the food, presence of pests
2. Source of food
3. Colour of the package
Q309 How do you store cooked food prior to
serving the pupils?
1. Store cooked food in covered
cooking pots in a clean, safe
place before serving the pupils
2. Store cooked food in open
containers
3. Store cooked food outside the
kitchen without covers
Answers
Q301. Yes
Q302. Every morning before food preparation, often during the day and after use
Q303. Piped water, rain water and boreholes which are well protected
Q304. Before handling food and often during food preparation
Q305. Use clean containers to collect it from the store, remove foreign matters and then wash it with clean
water thoroughly before cooking.
Q306. Prior to, after using them and drying them in a rack before storage.
Q307. One score for any measures
Q308. Expiry date, packaging, color of the food, pests
Q309. Store cooked food in covered cooking pots in a clean, safe place before serving the pupils.

103 103
Storekeeper Questionnaire
Respondent identification
# Question Response Code
Q101
County
Sub-County- District
Zone
School name
Q102 Respondent name
Q103 Sex of the Respondent: ___
1. Male
2. Female
Q104 Date of Interview ____/____/____
Day/Month/Year (e.g. 15 / 04 /
2015)
Q105 Name of Enumerator

104 104
Section 2: School feeding program information
# Question Response Code
Q201 Does your school have a dedicated food store room? 1. Yes
2. No
Q202 Is the food store room lockable?
ASK QUESTION + OBSERVATION
1. Yes
2. No
Q203 Is the store room properly ventilated?
DIRECT OBSERVATION
1. Yes
2. No
Q204 Is there any evidence of presence of rodents in the store?
ASK QUESTION + OBSERVATION
1. Yes
2. No
Q205 Is there any evidence of presence of insects (weevil and
others)?
ASK QUESTION + OBSERVATION
1. Yes
2. No
Q206 Is there any evidence of mould and excess of humidity?
ASK QUESTION + OBSERVATION
1. Yes
2. No
Q207 Is there any evidence of spillage or leakage?
ASK QUESTION + OBSERVATION
1. Yes
2. No
Q208 Is the food stored off the ground?
ASK QUESTION + OBSERVATION
1. Yes
2. No (go to Q210)
Q209 If yes, does the school use improvised raised pallets for
commodities' storage?
ASK QUESTION + OBSERVATION
1. Yes
2. No
Q210 Does the school carry out pest/insects control measures?
1. Yes
2. No
Q211 Are you trained in safe food preparation and storage
practices?
1. Yes
2. No (End of
interview)
Q212 If Yes, how many times have you received training in 2014?
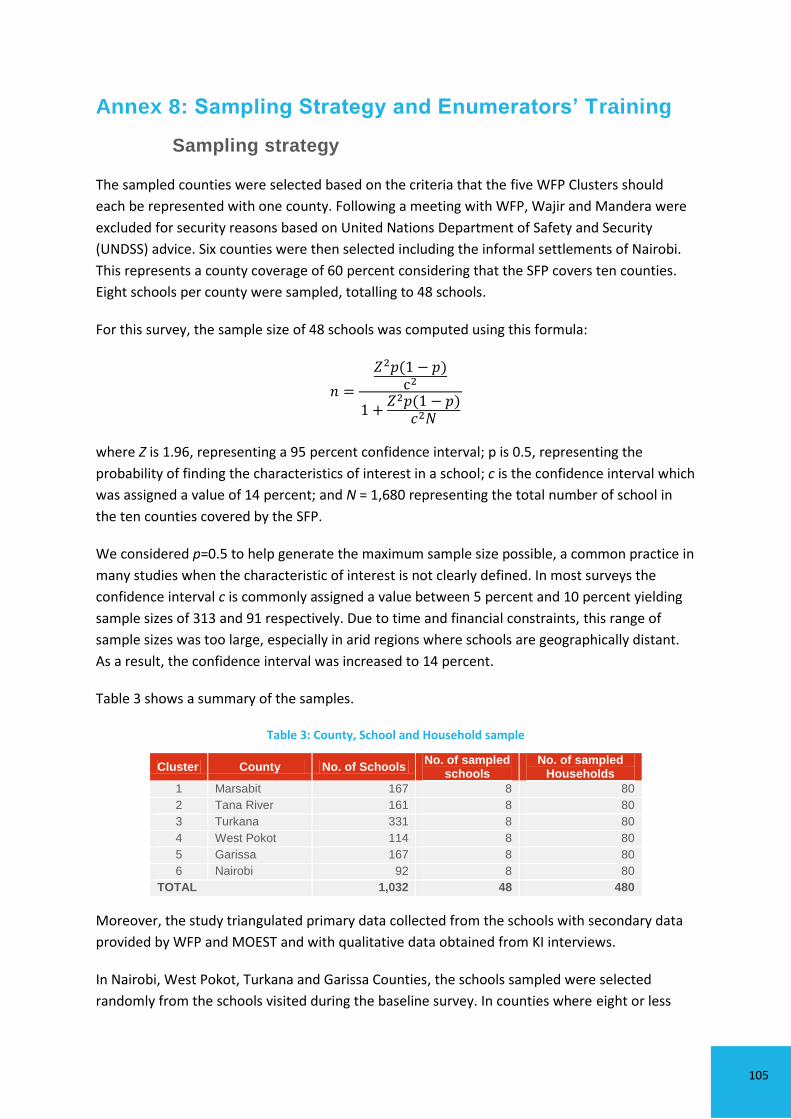
105 105
Annex 8: Sampling Strategy and Enumerators’ Training
Sampling strategy
The sampled counties were selected based on the criteria that the five WFP Clusters should
each be represented with one county. Following a meeting with WFP, Wajir and Mandera were
excluded for security reasons based on United Nations Department of Safety and Security
(UNDSS) advice. Six counties were then selected including the informal settlements of Nairobi.
This represents a county coverage of 60 percent considering that the SFP covers ten counties.
Eight schools per county were sampled, totalling to 48 schools.
For this survey, the sample size of 48 schools was computed using this formula:
where Z is 1.96, representing a 95 percent confidence interval; p is 0.5, representing the
probability of finding the characteristics of interest in a school; c is the confidence interval which
was assigned a value of 14 percent; and N = 1,680 representing the total number of school in
the ten counties covered by the SFP.
We considered p=0.5 to help generate the maximum sample size possible, a common practice in
many studies when the characteristic of interest is not clearly defined. In most surveys the
confidence interval c is commonly assigned a value between 5 percent and 10 percent yielding
sample sizes of 313 and 91 respectively. Due to time and financial constraints, this range of
sample sizes was too large, especially in arid regions where schools are geographically distant.
As a result, the confidence interval was increased to 14 percent.
Table 3 shows a summary of the samples.
Table 3: County, School and Household sample
Moreover, the study triangulated primary data collected from the schools with secondary data
provided by WFP and MOEST and with qualitative data obtained from KI interviews.
In Nairobi, West Pokot, Turkana and Garissa Counties, the schools sampled were selected
randomly from the schools visited during the baseline survey. In counties where eight or less
Cluster County No. of Schools No. of sampled
schools No. of sampled
Households
1 Marsabit 167 8 80
2 Tana River 161 8 80
3 Turkana 331 8 80
4 West Pokot 114 8 80
5 Garissa 167 8 80
6 Nairobi 92 8 80
TOTAL 1,032 48 480

106 106
school were sampled during the baseline survey, all of them were selected for this mid-term
evaluation. In counties where more than 8 schools were interviewed during the baseline survey,
we randomly sampled eight of them.
Tana River and Marsabit counties were not sampled during the baseline survey. The sampled
schools were therefore selected randomly from the entire list of schools which benefit from the
SFP. The selection process took into account the geographical coverage. The list of sampled
schools was finalized after consultation with WFP Field Officers (please see Annex 2).
In each sampled school, a total of 10 pupils were randomly selected using the sampling
procedure found in Annex 3. The selected students’ parents (or close relatives in the absence of
the parents) were also invited for an interview session on the school premises. Head teachers
were informed of the pupil sampling methodology through the WFP field officers ahead of the
data collection period to ensure that parents could make themselves available.
Enumerator training and data collection
In preparation of the data collection in Nairobi and other counties, Kimetrica, through the
support of WFP Field Offices, distributed an introduction letter prepared by MOEST to all DEOs
who forwarded it to the schools in their respective counties. The purpose of this letter was to
inform the schools of the ongoing mid-term evaluation and survey. Once the schools were
sampled, the WFP Field Offices shared the Pupil Sampling Methodology as well as a list of
interviewees and records required for the survey with the head teachers. This allowed the data
collection process to be carried out more smoothly, as schools were prepared for the survey
ahead of the enumerators’ arrival.
The data collection was carried out by 20 enumerators who were trained in Nairobi from 3rd to
5th May 2015. They were provided with a Training Manual containing specific instructions for the
survey. The enumerators were selected through a vacancy announcement and through an
existing Kimetrica roster of candidates previously used for others national surveys. Enumerators
familiarized themselves with the data collection tools and ki-projectsTM off-line tool, Kimetrica’s
data collection software, through practical exercises and training sessions conducted by
Kimetrica staff. The software and questionnaires had been pre-tested before the enumerators’
training at New Kihumbuini Primary School in Nairobi to test and troubleshoot the data capture
system. Pre-testing was organized by Feed the Children (FTC) in the week preceding the re-
opening of schools for the second term.
Data collection ensued in the Nairobi informal settlements immediately after the enumerator
training, from 6th to 8th May 2015. The survey was organized with the assistance of FTC, whose
representatives were also present in the schools during the survey. All the enumerator teams
had on-site supervision of one Kimetrica staff member during the 3 day survey. Enumerators
collected the data using tablets and also on paper questionnaires as a backup.

107 107
Data collection continued at the county level during the following three weeks. WFP Field
Officers provided assistance in the organization of the field work, and in particular for the
courtesy call meeting with local Education Officials (the DEO). A total of eight schools were
covered in each county, with teams of two enumerators surveying four schools each. The survey
lasted three days per school.
Each team of enumerators conducted interviews with the head teacher and deputy head
teacher, teachers (one per class or all those employed by the school if less than 8), 10 pupils, 10
parents, the cook and the person in charge of the store room. Enumerators also recorded daily
observations on pupils’ attendance during the survey, the weight of the food rations and the
status of school facilities (storeroom, kitchen, toilets, etc.). Moreover, enumerators asked
teachers and parents qualitative questions on lessons learnt and possible improvements of the
SFP. In addition to collecting enrolment data for the 2014 academic year, data for the period
2012-2015 was also included to show trends in enrolment.
The team of 20 enumerators reported directly to the Survey Supervisor based in Nairobi for any
issues related to the data collection tools or to the implementation of the survey itself (for
example, unavailability of interviewees). For any issues related to logistical arrangements and
security of the team, enumerators also reported to the Field Survey Supervisors, who were
recruited locally in each county due to their high level of familiarity with the data collection
areas. All enumerator teams met with their respective field survey supervisors at the beginning
of the data collection period, and maintained regular contact (via phone) throughout. Field
survey supervisors were also responsible for checking with head teachers to confirm their teams
had carried out the survey following the established procedures – including verifying that the
parents interviewed had received a pre-determined transport allowance for participating in the
survey (this was also done from the Kimetrica office in Nairobi). They each carried out one back-
check per team, accompanying enumerators on a daily trip in one school to oversee the data
collection. Five field survey supervisors were engaged for Garissa, Marsabit, Tana River, Turkana
and West Pokot. The field supervisor in West Pokot was however unable to do the physical
back-check in the schools due to time constraints resulting from other ongoing assignments.
Closer supervision of the West Pokot teams was carried out from the Kimetrica Nairobi office.
Data quality control was conducted at the Kimetrica Nairobi office as data was being synced to
the online database from the field. Syncing the School Questionnaire proved to be challenging
given the high amount of data it recorded (including all of the SMP 6 Forms for the academic
year 2014). To address this issue and avoid data loss, enumerators were asked to fill in the
School Questionnaires on the backup paper version, which were then entered into the system
by data entry clerks in the Kimetrica Nairobi office.
Within each team, the workload was divided among enumerators: each person was responsible
for carrying out the same type of questionnaire in all of the schools in order to maximize their
familiarity with the data collection tools and to ensure consistency in the way questions were
asked and data was collected. These responsibilities were assigned during the enumerator
training in Nairobi.

108 108
Enumerators used the following tentative schedule, which was based on the data collection
exercise carried out in Nairobi:
Day One:
Introductory meeting with the head teacher (both enumerators) and administration of
the School Questionnaire to the head teacher and Deputy head teacher (Enumerator 1)
– this questionnaire was administered first given the high amount of data and records it
required
Daily observations: pupil and teacher headcount at school level (Enumerator 2);
weighing of food rations and food utilized and observations on status of facilities (both
enumerators)
Teacher Questionnaire to one teacher per class (Enumerator 2)
Cook Questionnaire (Enumerator 2)
Storekeeper Questionnaire (Enumerator 2).
Day Two:
Continuation of School Questionnaire (Enumerator 1). Where possible, enumerators
asked the person responsible for the school records to borrow the SMP 6 forms. This
allowed the data-entry process to continue in the evenings and minimized the process in
the schools. In general, all enumerators had a positive experience in this regard and
their requests were received with a high level of collaboration
Daily observations: pupil and teacher headcount at school level (Enumerator 2),
weighing of food rations and food utilized and observations on status of facilities (both
enumerators)
Household Questionnaire (Enumerator 1 or 2 depending on availability): parents had
previously been selected and informed by the school to report for their interview on the
second day of the survey
Pupil Questionnaire (Enumerator 1 or 2 depending on availability): the ten sampled
pupils were interviewed during the school day trying to minimize disruptions to their
daily schedule (preferably during the mid-morning breaks or during the lunch break).
Enumerators were instructed to re-sample the students and their parents in case they
were absent or did not report to the school.
Day Three:
Continuation of School Questionnaire and any other remaining questionnaires (both
enumerators)
Daily observations: pupil and teacher headcount at school level (Enumerator 2),
weighing of food rations and food utilized and observations on status of facilities (both
enumerators).