usda ers meat price spread data product review
TRANSCRIPT

USDA ERS Meat Price Spread Data Product Review
Contractor and Cooperator ReportCCR-71 April 22, 2019
AbstractThe meat price spread data published by the Economic Research Service is an important product monitoring vertical market price relationships. The price spread data are used by a wide array of market observers spanning policy makers, market analysts, and academic researchers. This study proposes modifications to the beef and pork price spread data to modernize the prices utilized to better reflect current industry trade practices. Assessment of using retail scanner as an alternative to Bureau of Labor Statistics retail price data is suggested. We also recommend periodic review of the spread data procedures be conducted as changes in livestock and meat markets occur.
The views expressed are those of the authors and should not be attributed to the Economic Research Service or USDA.
Ted C. Schroeder,Glynn T. Tonsor,
Lee L. Schulz, Bradley J. Johnson,
andChristopher Sommers*
Final Report Submitted to Economic Research Service
U.S. Department of Agriculture
Date: April 22, 2019
*Schroeder is University Distinguished Professor, Tonsor is Professor, Agricultural Economics,Kansas State University; Schulz is Associate Professor, Economics, Iowa State University; Johnsonis Gordon W. Davis Regent’s Chair in Meat Science and Muscle Biology, Animal and Food Sciences,Texas Tech University; and Sommers is Livestock, Poultry, and Grain Market News Division Manda-tory Price Reporting Market News Reporter, U.S. Department of Agriculture, Agricultural Market-ing Service. We acknowledge funding from the Economic Research Service. Any opinions, conclu-sion, findings, or recommendations expressed in this publication are those of the authors anddo not necessarily reflect the view of the U.S. Department of Agriculture.
USDA ERS Meat Price Spread Data Product Review

1 | Page
BackgroundOne of the most widely used data products published by the Economic Research Service (ERS) of the U.S. Department of Agriculture (USDA) is the farm-wholesale-retail meat price spread series. Price spread data for beef and pork are published on the web dating back to 1970 and broilers back to 1980 (ERS, USDA 2018); though the history of the beef and pork spread calculations date back to at least 1949 as directed and authorized in The Research and Marketing Act of 1946.
Over the years, the meat price spread data have undergone a variety of modifications because of changes in the marketplaces the series attempts to reflect. For example, beef and pork price spread calculation procedures were modified in 1969 to better reflect retail product price specials (Duewer 1969). Prior to 1980, ERS collected primary retail price data directly from cooperating retailers for constructing spreads, but this was revised to using published Bureau of Labor Statistics (BLS) retail price data since 1980 (Hahn 2004). Major changes were also made in 1990 to several components of beef price spread reporting data sources (White et al. 1991). Such changes often provide revised data that goes back in time several years if feasible to enable data users to compare the revised series to the old series (e.g., Marsh 1992). This is a valuable strategy since this data product is often used for time series trend or change analysis.
Procedures for constructing the meat price spread data products have been relatively unchanged since 2000. In contrast, marked changes have occurred in livestock and meat markets over the last two decades, motivating this project to review procedures used in the price spread data product calculations. The purpose of this cooperative agreement was to review the methods, procedures, source data, and presentation of the ERS Meat Price Spreads data product.
ObjectivesThe review team’s task in evaluating the price spread data product was to:
1. Provide perceptions of the usefulness of the data product.2. Discuss alternative methods that might be used in developing estimates for the product.3. Provide insights on alternative data sources that might be of use in developing estimates.4. Discuss presentation of the data product.
2 | Page
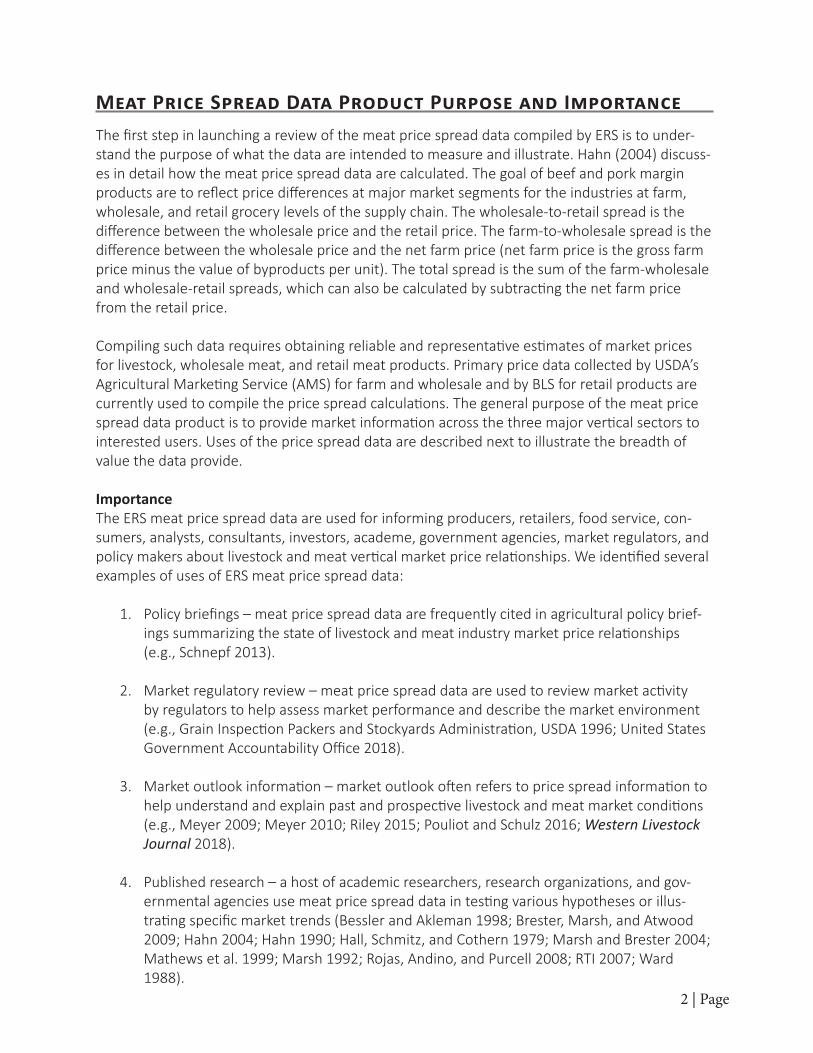
Meat Price Spread Data Product Purpose and ImportanceThe first step in launching a review of the meat price spread data compiled by ERS is to under-stand the purpose of what the data are intended to measure and illustrate. Hahn (2004) discuss-es in detail how the meat price spread data are calculated. The goal of beef and pork margin products are to reflect price differences at major market segments for the industries at farm, wholesale, and retail grocery levels of the supply chain. The wholesale-to-retail spread is the difference between the wholesale price and the retail price. The farm-to-wholesale spread is the difference between the wholesale price and the net farm price (net farm price is the gross farm price minus the value of byproducts per unit). The total spread is the sum of the farm-wholesale and wholesale-retail spreads, which can also be calculated by subtracting the net farm price from the retail price.
Compiling such data requires obtaining reliable and representative estimates of market prices for livestock, wholesale meat, and retail meat products. Primary price data collected by USDA’s Agricultural Marketing Service (AMS) for farm and wholesale and by BLS for retail products are currently used to compile the price spread calculations. The general purpose of the meat price spread data product is to provide market information across the three major vertical sectors to interested users. Uses of the price spread data are described next to illustrate the breadth of value the data provide.
Importance The ERS meat price spread data are used for informing producers, retailers, food service, con-sumers, analysts, consultants, investors, academe, government agencies, market regulators, and policy makers about livestock and meat vertical market price relationships. We identified several examples of uses of ERS meat price spread data:
1. Policy briefings – meat price spread data are frequently cited in agricultural policy brief-ings summarizing the state of livestock and meat industry market price relationships(e.g., Schnepf 2013).
2. Market regulatory review – meat price spread data are used to review market activityby regulators to help assess market performance and describe the market environment(e.g., Grain Inspection Packers and Stockyards Administration, USDA 1996; United StatesGovernment Accountability Office 2018).
3. Market outlook information – market outlook often refers to price spread information tohelp understand and explain past and prospective livestock and meat market conditions(e.g., Meyer 2009; Meyer 2010; Riley 2015; Pouliot and Schulz 2016; Western LivestockJournal 2018).
4. Published research – a host of academic researchers, research organizations, and gov-ernmental agencies use meat price spread data in testing various hypotheses or illus-trating specific market trends (Bessler and Akleman 1998; Brester, Marsh, and Atwood2009; Hahn 2004; Hahn 1990; Hall, Schmitz, and Cothern 1979; Marsh and Brester 2004;Mathews et al. 1999; Marsh 1992; Rojas, Andino, and Purcell 2008; RTI 2007; Ward1988).

3 | Page
5. Corporate earnings reports – meat industry production, processing, retailing, and food ser-vice companies often reference meat margin or price spread data in earnings summary re-ports (e.g., McCormick & Schmick’s Seafood Restaurants, Inc. 2009; Singh 2017; TB&P 2013).
The web page containing the price spread information (ERS, USDA 2018) is the second most visited data page of the Market and Trade Division of ERS with more than 100,000 visits over the 2016-17 fiscal year. The distribution of types of users of the web site containing the spread data over the 2014-17 are summarized in Figure 1. The most common web visitor is Network domains mostly from the U.S. representing 42% of web visits. Commercial web visits are next at 30% and US Educational Institutions represent 5% of the data site visits.
The wide array of users of meat price spread data reveal its importance as an indicator of changes in livestock and meat markets over time. Likewise, the myriad of uses of the price spread data demon-strates its importance and value to industry, government, and academe. In light of widespread use of the price spread information, it is imperative that the information be accurate and representative of what it is intended to measure.
The sheer number of uses and users also makes defining the specific intended use of the product and its purpose ever more important. For example, if the intended use of the price spread data is to demonstrate how farm producers are faring relative to wholesalers or retailers, the current data product is not well suited for that. However, it has at times been used for that purpose (e.g., Taylor 2002). High and increasing price spreads often lead to controversy as producers tend to blame low livestock prices on high price spreads, and consumers blame high retail prices on high price spreads. Increasing price spreads can both inflate retail prices and deflate farm prices (Pouliot and Schulz 2016). Brester, Marsh, and Atwood (2009) discuss other misuses of the price spread data.
42.3%
30.2%
5.0%
0.6%
0.6%
0.6%
0.8%
0.9% 1.9%16.0%
Network
Commercial
US Educa�on Ins�tu�on
Japan
Brazil
Mexico
Canada
US Govt
Organiza�ons
Other Interna�onal
Source: Unpublished data provided to authors by ERS, USDA
Figure 1. Meat Price Spread Data Web Page Visitors by Domain, 2014-17

4 | Page
Price spreads are also referred to as “marketing margins,” and are defined as “... the costs of performing marketing functions required to get live animals from the producer to the consumer” (Ikerd and Ward, 1983). This definition is intuitive since it recognizes that cost must be incurred, and reflected in the final product price, in transforming live animals into consumable products. If the intended use of the price spread data is to demonstrate how marketing costs between farm, wholesale, and retail markets are changing over time, the current data product is at best a rough indicator of that. As we discuss later, the prices in current spread calculations are not representa-tive of the prices farmers sell livestock for or retailers receive for meat they sell.
Occasionally, ”gross margin” is mistakenly substituted for price spread. The two are different. A gross margin is the difference between dollars paid and dollars received by a participant in the marketing system. For example, a rough calculation of a gross margin for a meat packer is meat revenue plus by-product value minus livestock cost. Because the gross margin only applies for one specific stage in marketing, e.g., meat packing, it does not include other costs, such as transpor-tation, that are included in the price spread. The price spread essentially lumps together costs for several segments, while gross margins apply only to costs for specific segments (Ross 1984).
Determining the farm-to-retail spread is cumbersome because a representative “market basket” of meat products at retail must be first developed. The price spread data is calculated based on composite meat products with definitions remaining constant throughout the series. This means that although grocery stores are selling increasing quantities of boneless and value-added meat products, the definitions of the meat products used in the price spread data calculations remain constant over time. In addition, the definitions of the composite products remain constant with-in the supply chains so that farm and wholesale prices are all reported given the composition of products sold at retail. Because price spread calculations are made using constant definitions, the data serve as a barometer of marketing margins for an industry and are not intended to represent any one production system or particular supply chain within an industry.
Furthermore, it is widely recognized retailers tend to have sticky prices relative to wholesale and farm level suggesting spread data at any point in time are unlikely to reflect contemporaneous marketing costs. Likewise, meat packer and livestock producer margins fluctuate over time as market leverage ebbs and flows meaning price spreads between wholesale and farm levels are not precise reflections of marketing costs at any point in time. Over a long-run horizon, price spread data should, if accurately codified, reflect marketing costs plus economic profits. However, because of rigidities and lags present, at any point in time, the spreads are not useful for monitoring short- or likely even intermediate-run marketing cost changes.
There is little, beyond cautionary disclaimers and complete transparency in procedures, ERS can do to curtail misunderstanding or misuses of price spread data. Our assumption in preparing this re-port is that the intended purpose of the price spread series is to provide a consistently calculated set of broad market valuations at the farm, wholesale, and retail levels that approximately portray how aggregate prices across these levels are changing relative to each other. The data are of use to industry participants to monitor and anticipate change in the industry. They are not measures of economic well-being for any industry segment.
5 | Page
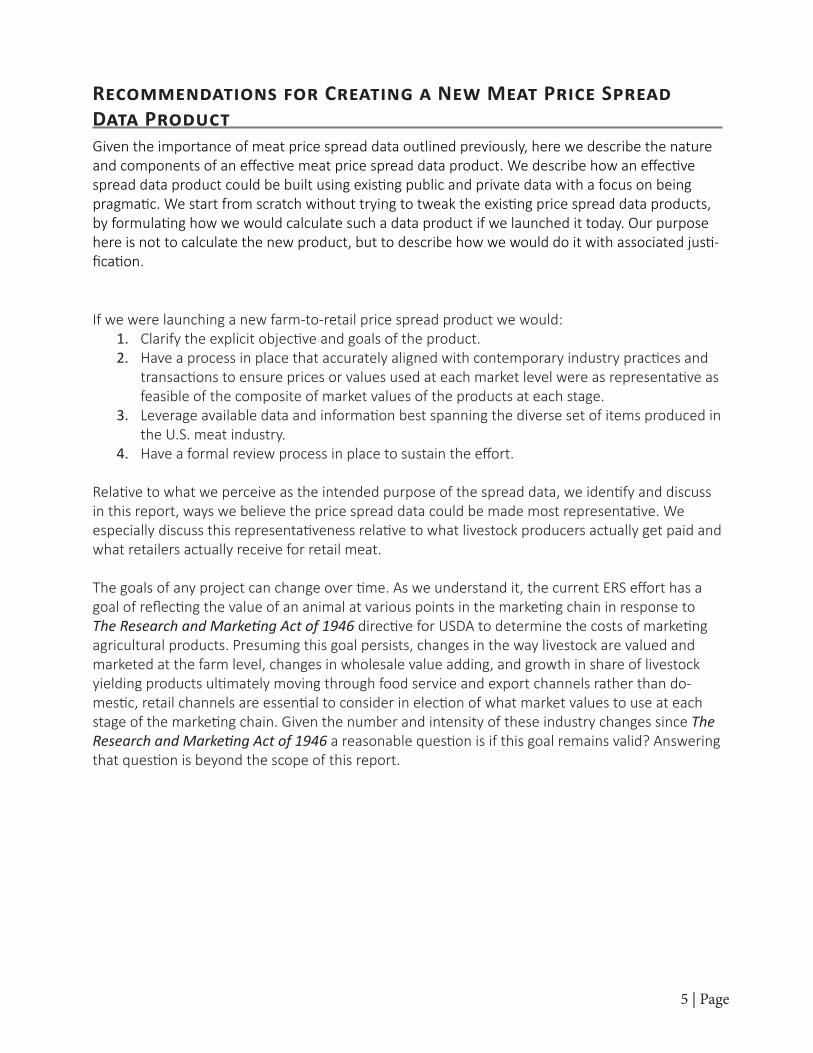
Recommendations for Creating a New Meat Price Spread Data Product Given the importance of meat price spread data outlined previously, here we describe the nature and components of an effective meat price spread data product. We describe how an effective spread data product could be built using existing public and private data with a focus on being pragmatic. We start from scratch without trying to tweak the existing price spread data products, by formulating how we would calculate such a data product if we launched it today. Our purpose here is not to calculate the new product, but to describe how we would do it with associated justi-fication.
If we were launching a new farm-to-retail price spread product we would: 1. Clarify the explicit objective and goals of the product.2. Have a process in place that accurately aligned with contemporary industry practices and
transactions to ensure prices or values used at each market level were as representative asfeasible of the composite of market values of the products at each stage.
3. Leverage available data and information best spanning the diverse set of items produced inthe U.S. meat industry.
4. Have a formal review process in place to sustain the effort.
Relative to what we perceive as the intended purpose of the spread data, we identify and discuss in this report, ways we believe the price spread data could be made most representative. We especially discuss this representativeness relative to what livestock producers actually get paid and what retailers actually receive for retail meat.
The goals of any project can change over time. As we understand it, the current ERS effort has a goal of reflecting the value of an animal at various points in the marketing chain in response to The Research and Marketing Act of 1946 directive for USDA to determine the costs of marketing agricultural products. Presuming this goal persists, changes in the way livestock are valued and marketed at the farm level, changes in wholesale value adding, and growth in share of livestock yielding products ultimately moving through food service and export channels rather than do-mestic, retail channels are essential to consider in election of what market values to use at each stage of the marketing chain. Given the number and intensity of these industry changes since The Research and Marketing Act of 1946 a reasonable question is if this goal remains valid? Answering that question is beyond the scope of this report.
6 | Page
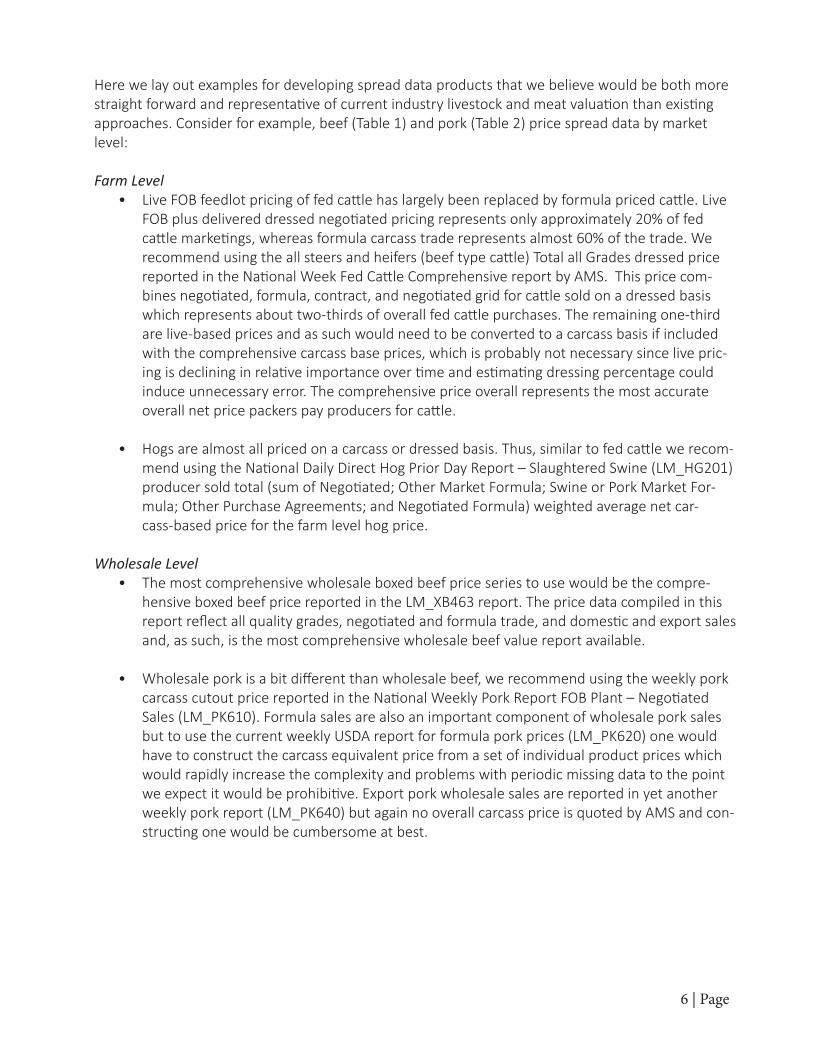
Here we lay out examples for developing spread data products that we believe would be both more straight forward and representative of current industry livestock and meat valuation than existing approaches. Consider for example, beef (Table 1) and pork (Table 2) price spread data by market level:
Farm Level• Live FOB feedlot pricing of fed cattle has largely been replaced by formula priced cattle. Live
FOB plus delivered dressed negotiated pricing represents only approximately 20% of fedcattle marketings, whereas formula carcass trade represents almost 60% of the trade. Werecommend using the all steers and heifers (beef type cattle) Total all Grades dressed pricereported in the National Week Fed Cattle Comprehensive report by AMS. This price com-bines negotiated, formula, contract, and negotiated grid for cattle sold on a dressed basiswhich represents about two-thirds of overall fed cattle purchases. The remaining one-thirdare live-based prices and as such would need to be converted to a carcass basis if includedwith the comprehensive carcass base prices, which is probably not necessary since live pric-ing is declining in relative importance over time and estimating dressing percentage couldinduce unnecessary error. The comprehensive price overall represents the most accurateoverall net price packers pay producers for cattle.
• Hogs are almost all priced on a carcass or dressed basis. Thus, similar to fed cattle we recom-mend using the National Daily Direct Hog Prior Day Report – Slaughtered Swine (LM_HG201)producer sold total (sum of Negotiated; Other Market Formula; Swine or Pork Market For-mula; Other Purchase Agreements; and Negotiated Formula) weighted average net car-cass-based price for the farm level hog price.
Wholesale Level• The most comprehensive wholesale boxed beef price series to use would be the compre-
hensive boxed beef price reported in the LM_XB463 report. The price data compiled in thisreport reflect all quality grades, negotiated and formula trade, and domestic and export salesand, as such, is the most comprehensive wholesale beef value report available.
• Wholesale pork is a bit different than wholesale beef, we recommend using the weekly porkcarcass cutout price reported in the National Weekly Pork Report FOB Plant – NegotiatedSales (LM_PK610). Formula sales are also an important component of wholesale pork salesbut to use the current weekly USDA report for formula pork prices (LM_PK620) one wouldhave to construct the carcass equivalent price from a set of individual product prices whichwould rapidly increase the complexity and problems with periodic missing data to the pointwe expect it would be prohibitive. Export pork wholesale sales are reported in yet anotherweekly pork report (LM_PK640) but again no overall carcass price is quoted by AMS and con-structing one would be cumbersome at best.

7 | Page
Retail Level• At the retail level the complexity certainly increases because of the number of different
products involved and alternative market outlets. Ideally the retail level would include gro-cery store, food service, internet on-line shopping, and export sales to more completelycapture the “end user” value of meat products.
o Food service data are not available and cannot be feasibly estimated given infor-mation currently available publically, so eliminating this important outlet is un-avoidable.
o For internet on-line shopping, some type of internet data scraping and collectioncould be considered and is worth continuing to revisit as feasibility seems likely toimprove over time. However, without sales volumes to accompany prices, all thatcould be collected from internet sources would be prices and they would not beable to be volume-weighted making them of limited use.
o Relative to retail grocery prices, we recommend using scanner data instead ofcurrent BLS retail price data. Rojas, Andino, and Purcell (2008) include a summa-ry of literature documenting upward biases in BLS retail prices. The authors notethis bias leads to an understatement of retailer response to changes in wholesalebeef prices which alters the empirical evidence used to initiate legislation aroundfirm behavior in the vertically-connected U.S. meat-livestock industry. Lensingand Purcell (2006) note key differences in demand elasticity estimates from usingquantity-weighted average retail beef prices rather than simple-average prices.Quantity-weighted prices were lower and more volatile. The authors summarizeimplications concluding (p. 239): “if the errors in elasticity calculations using BLSdata are confirmed to be as big in more complete analyses as they appear tobe in this limited effort, much of our historical demand analysis may need to berethought and redone.” Brester and Wohlgenant (1993) note (p. 355): “It is oftenthe case that (economic) welfare analyses are sensitive to the choice of demandelasticities.” This highlights importance of retail prices being accurate reflections ofactual transactions occurring.

8 | Page
Table 1. Example Schematic of Recommended Beef Price Spread Calculation Data SourcesMarket Level Price Data Source
FarmPrice: All Steers and Heifers (Beef Type Cattle); Purchasing Basis Dressed; Total all GradesReport: National Weekly Fed Cattle Comprehensive
WholesalePrice: Weekly National Comprehensive Boxed Beef Cutout ValueReport: AMS LM_XB463
RetailPrice: Monthly Weighted Average IRI/Freshlook Scanner PriceAdjustment: Perhaps with adjustment for exported productsReport: Obtained from IRI/Freshlook
Table 2. Example Schematic of Recommended Pork Price Spread Calculation Data SourcesMarket Level Price Data Source
FarmPrice: National Daily Direct Hog Prior Day Report – Slaughtered Swine; carcass basis; Producer Sold Average Net PriceReport: LM_HG201
WholesalePrice: National Weekly Pork Report FOB Plant – Negotiated Sales Report: AMS LM_PK610
RetailPrice: Monthly Weighted Average IRI/Freshlook Scanner PriceAdjustment: Not clear what to do with exported pork adjustments since it is not includ-ed in the negotiated wholesale price report.Report: Obtained from IRI/Freshlook

9 | Page
o Recently, comparing volume-weighted scanner prices with BLS prices over theJanuary 2011-November 2016 period, Tonsor and Schroeder (2017) foundscanner prices to be lower on average and more variable, consistent with paststudies. For this report, we updated this comparison to cover the January2012-April 2018 period. As shown in Figure 2, ERS retail beef and pork pricesare persistently higher than scanner prices which reflect the volume of prod-ucts sold. Perhaps most concerning is the upward bias in ERS/BLS prices grewsubstantially over the period pointing to an issue that is growing in importance.The bias in BLS data we consider large enough to render the spread data cal-culated using BLS retail price data misleading. The bias is not systematic, overtime or product, to be able to simply make an adjustment to BLS price databecause the bias varies pointing to an area in need of additional research.
1.00
1.10
1.20
1.30
1.40
1.50
1.60
1.70
Jan-
12
May
-12
Sep-
12
Jan-
13
May
-13
Sep-
13
Jan-
14
May
-14
Sep-
14
Jan-
15
May
-15
Sep-
15
Jan-
16
May
-16
Sep-
16
Jan-
17
May
-17
Sep-
17
Jan-
18
ERS
Pric
e Di
vide
d by
IRI P
rice
Month-Year
Figure 2. Monthly Average ERS/IRI Retail Beef and Pork Price Ra�os, Jan. 2012-April 2018
Beef: ERS Choice / IRI Beef: ERS All-Fresh / IRI Pork: ERS / IRI
Source: Author calcula�ons and Beef Checkoff, 2018
o Related to the recommendation of replacing BLS retail price data with scannerprices ERS might consider one of two alternative strategies to make that more costeffective. First, ERS could consider partnering with BLS to collect retail meat pricedata from scanner data to replace the current way BLS collects meat price data. Thiswould presumably save BLS costs of data collectors and those cost savings could beput toward scanner data collection that includes volumes sold. Alternatively, ERScould partner with meat industry associations that currently subscribe to propri-etary scanner data source providers. For instance, the beef checkoff, in coordinationwith VMMEAT Solutions and original IRI/FreshLook data, currently posts monthlyreports of the average (volume-weighted) retail price of beef, chicken, pork, turkey,lamb, and veal (Beef Checkoff 2018). Partnering with such private organizationsalready subscribing to scanner data sources would likely make it less costly for ERSto acquire.
11 | Page
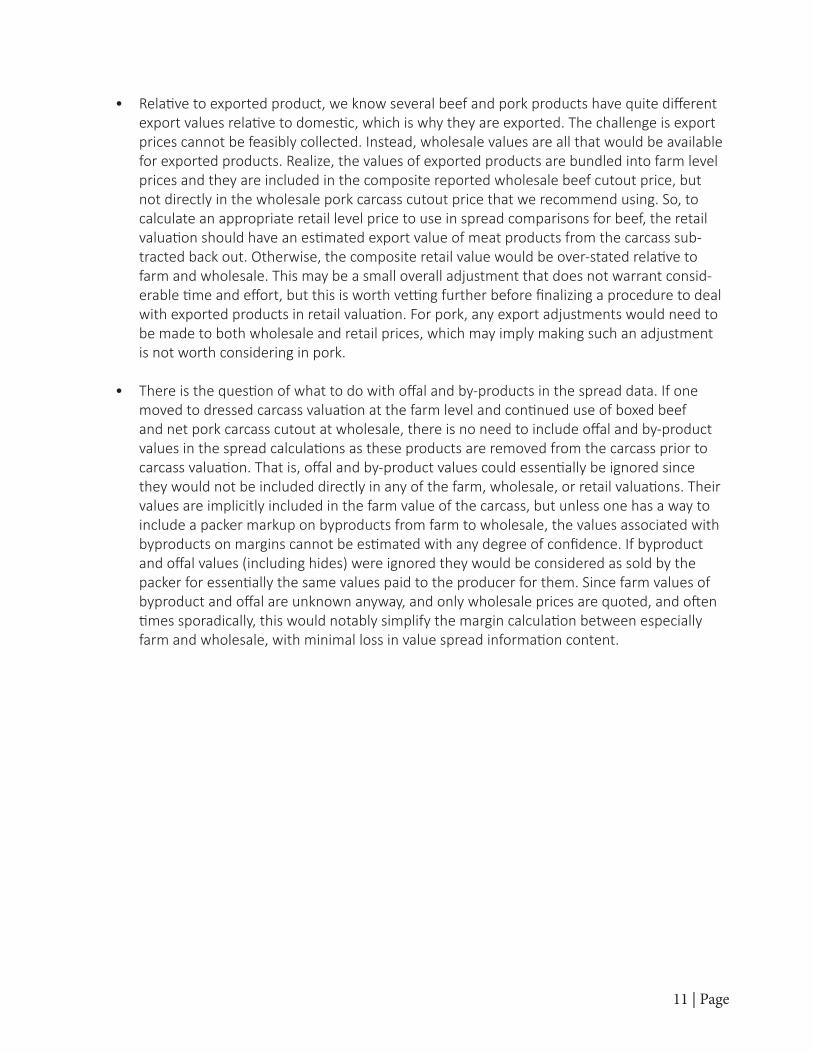
• Relative to exported product, we know several beef and pork products have quite differentexport values relative to domestic, which is why they are exported. The challenge is exportprices cannot be feasibly collected. Instead, wholesale values are all that would be availablefor exported products. Realize, the values of exported products are bundled into farm levelprices and they are included in the composite reported wholesale beef cutout price, butnot directly in the wholesale pork carcass cutout price that we recommend using. So, tocalculate an appropriate retail level price to use in spread comparisons for beef, the retailvaluation should have an estimated export value of meat products from the carcass sub-tracted back out. Otherwise, the composite retail value would be over-stated relative tofarm and wholesale. This may be a small overall adjustment that does not warrant consid-erable time and effort, but this is worth vetting further before finalizing a procedure to dealwith exported products in retail valuation. For pork, any export adjustments would need tobe made to both wholesale and retail prices, which may imply making such an adjustmentis not worth considering in pork.
• There is the question of what to do with offal and by-products in the spread data. If onemoved to dressed carcass valuation at the farm level and continued use of boxed beefand net pork carcass cutout at wholesale, there is no need to include offal and by-productvalues in the spread calculations as these products are removed from the carcass prior tocarcass valuation. That is, offal and by-product values could essentially be ignored sincethey would not be included directly in any of the farm, wholesale, or retail valuations. Theirvalues are implicitly included in the farm value of the carcass, but unless one has a way toinclude a packer markup on byproducts from farm to wholesale, the values associated withbyproducts on margins cannot be estimated with any degree of confidence. If byproductand offal values (including hides) were ignored they would be considered as sold by thepacker for essentially the same values paid to the producer for them. Since farm values ofbyproduct and offal are unknown anyway, and only wholesale prices are quoted, and oftentimes sporadically, this would notably simplify the margin calculation between especiallyfarm and wholesale, with minimal loss in value spread information content.

12 | Page
Recommendations on Presentation / Publication of Meat Price Spread Data Product
• We recommend the intended purpose of the meat price spread series be added in a visibleplace on the ERS Meat Price Spreads web site (https://www.ers.usda.gov/data-products/meat-price-spreads/). We do not see an explicit purpose of the products described on theweb site. This would illuminate intent of producing price spread data and could reducemisuses or at least condition them.
• We recommend adding discussion on the ERS web site of how to correctly interpret theinformation provided with associated limiting disclaimers. Users of the data product arenot well versed in the nuances of the product and how it should or should not be used sowithout these disclaimers, it is more likely to be misunderstood.
• We recommend providing a complementary data series where the dollar values used tocalculate the price spread data are adjusted for inflation. Purcell et al. (1999) provides therationale for doing so and summarized by stating, “Removing the influence of inflation andthen examining the patterns is a more nearly correct way to look at the spreads.”
• We recommend documenting the current processes of generating the price spread data.This includes sources of underlying raw data, constant definitions used, calculations, as-sumptions, etc. Beyond providing clarity to spread data the generation process, this doc-umentation would be helpful in subsequent reviews of the data product and may identifypotential pitfalls before they arise. Two examples of this type of documentation are the“Detail of Procedures for Estimating Historic and Projecting Future Fed Cattle FinishingReturns” on the Ag Manager website (https://www.agmanager.info/detail-procedures-es-timating-fed-cattle-finishing-historical-and-projected-returns) and the “Procedures forEstimating Returns” files on the Iowa State University Estimated Livestock Returns website(http://www2.econ.iastate.edu/estimated-returns/).
13 | Page
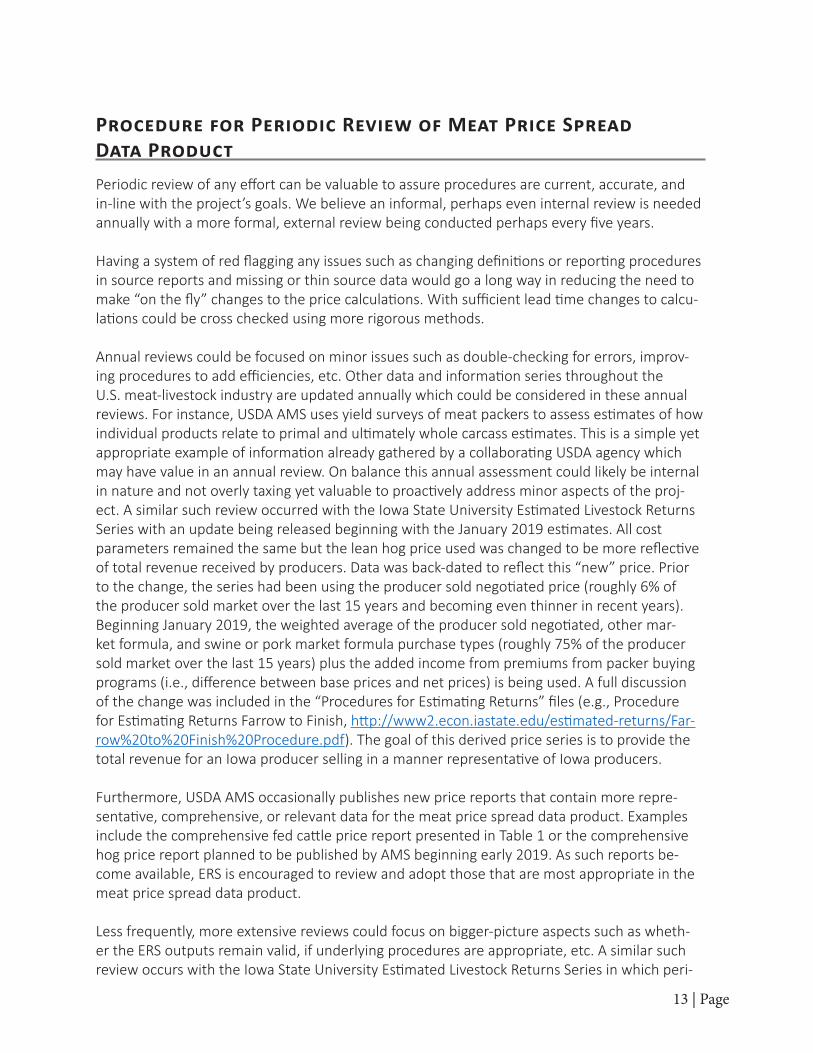
Procedure for Periodic Review of Meat Price Spread Data Product Periodic review of any effort can be valuable to assure procedures are current, accurate, and in-line with the project’s goals. We believe an informal, perhaps even internal review is needed annually with a more formal, external review being conducted perhaps every five years.
Having a system of red flagging any issues such as changing definitions or reporting procedures in source reports and missing or thin source data would go a long way in reducing the need to make “on the fly” changes to the price calculations. With sufficient lead time changes to calcu-lations could be cross checked using more rigorous methods.
Annual reviews could be focused on minor issues such as double-checking for errors, improv-ing procedures to add efficiencies, etc. Other data and information series throughout the U.S. meat-livestock industry are updated annually which could be considered in these annual reviews. For instance, USDA AMS uses yield surveys of meat packers to assess estimates of how individual products relate to primal and ultimately whole carcass estimates. This is a simple yet appropriate example of information already gathered by a collaborating USDA agency which may have value in an annual review. On balance this annual assessment could likely be internal in nature and not overly taxing yet valuable to proactively address minor aspects of the proj-ect. A similar such review occurred with the Iowa State University Estimated Livestock Returns Series with an update being released beginning with the January 2019 estimates. All cost parameters remained the same but the lean hog price used was changed to be more reflective of total revenue received by producers. Data was back-dated to reflect this “new” price. Prior to the change, the series had been using the producer sold negotiated price (roughly 6% of the producer sold market over the last 15 years and becoming even thinner in recent years). Beginning January 2019, the weighted average of the producer sold negotiated, other mar-ket formula, and swine or pork market formula purchase types (roughly 75% of the producer sold market over the last 15 years) plus the added income from premiums from packer buying programs (i.e., difference between base prices and net prices) is being used. A full discussion of the change was included in the “Procedures for Estimating Returns” files (e.g., Procedure for Estimating Returns Farrow to Finish, http://www2.econ.iastate.edu/estimated-returns/Far-row%20to%20Finish%20Procedure.pdf). The goal of this derived price series is to provide the total revenue for an Iowa producer selling in a manner representative of Iowa producers.
Furthermore, USDA AMS occasionally publishes new price reports that contain more repre-sentative, comprehensive, or relevant data for the meat price spread data product. Examples include the comprehensive fed cattle price report presented in Table 1 or the comprehensive hog price report planned to be published by AMS beginning early 2019. As such reports be-come available, ERS is encouraged to review and adopt those that are most appropriate in the meat price spread data product.
Less frequently, more extensive reviews could focus on bigger-picture aspects such as wheth-er the ERS outputs remain valid, if underlying procedures are appropriate, etc. A similar such review occurs with the Iowa State University Estimated Livestock Returns Series in which peri-

14 | Page
odically, the procedures are evaluated and revised to more accurately reflect the enterprises the model is trying to represent. While price changes are incorporated monthly, production variables (e.g., feed ration formulation, feed efficiency, daily gain, death loss, placement and marketing weights, etc.) are revised periodically (5-7 years) to reflect changes in livestock production tech-nology. The procedures were last updated in 2014. After such a revision a report is released that provides a comparison of how the updated returns series would have looked over a past period under the new procedures (e.g., Revised Estimated Returns Farrow to Finish, http://www2.econ.iastate.edu/estimated-returns/Revised%20Estimated%20Returns%20Farrow%20to%20Finish.pdf). This is done for purposes of easing, for users, the transition for from the previous proce-dures to the new procedures for estimating returns.
Beyond external reviews, ERS is encouraged to leverage existing opportunities for garnering feedback on the status, value, and accuracy of the retail meat prices output. One key example is the opportunity presented by the annual USDA Data Users meeting. This meeting often has several USDA agencies involved as formal presenters with non-USDA parties present as attendees providing feedback and suggestions. This existing forum presents one, of likely multiple, specific opportunity ERS could leverage to systematical use in gaining feedback on the retail meat price effort.
15 | Page
References
Beef Checkoff. 2018. “Monthly Sales and Featuring Summary Reports.” Available at http://www.beefretail.org/monthlysalesandfeaturingsummaryreports.aspx
Bessler, D.A. and D.G. Akleman. 1998. “Farm Prices, Retail Prices, and Directed Graphics: Results for Pork and Beef.” American Journal of Agricultural Economics 80, 5(Dec):1144-1149.
Brester, G.W., J.M. Marsh, and J.A. Atwood. 2009. “Evaluating the Farmer’s-Share-of-the-Retail-Dollar Statistic.” Journal of Agricultural and Resource Economics 34(2):213-236. Available at: http://ageconsearch.umn.edu/record/54543/files/JARE_Aug09__01R_pp213-236.pdf
Brester, G.W. and M.K. Wohlgenant. 1993. “Correcting for Measurement Error in Food Demand Estimation.” The Review of Economics and Statistics 75, 2(May):352-356.
Duewer, L.A. 1969. “Revised Price Spreads for Beef and Pork”. Economic Research Service, US Department of Agriculture, ERS-435. December.
Economic Research Service, US Department of Agriculture. 2018. “Meat Price Spreads.” Available at https://www.ers.usda.gov/data-products/meat-price-spreads/
Grain Inspection Packers and Stockyards Administration, US Department of Agriculture. 1996. “Concentration in the Red Meat Packing Industry.” February.
Hahn, W.F. 1990. “Price Asymmetry in Pork and Beef Markets.” Journal of Agricultural Economics Research 42,4:21-30.
Hahn, W. 2004. “Beef and Pork Values and Price Spreads Explained.” Economic Research Service, US Department of Agriculture, LDP-M-118-01. May.
Hall, L., A. Schmitz, and J. Cothern. 1979. “Beef Wholesale-Retail Marketing Margins and Concen-tration.” Economica 46:295-300.
Ikerd, J.E. and C.E. Ward. 1983. Price spreads: Cattlemen’s share and effects on cattle prices. Okla-homa State University Extension Facts, No. 470.
Lensing, C. and W.D. Purcell. 2006. “Impact of Mandatory Price Reporting Requirements on Level, Variability, and Elasticity Parameter Estimations for Retail Beef Prices.” Review of Agricultural Economics 28, 2:229-239.
Marsh, J.M. and G.W. Brester. 2004. “Wholesale-Retail Marketing Margin Behavior in the Beef and Pork Industries.” Journal of Agricultural and Resource Economics 29(1):45-64. Available at: http://ageconsearch.umn.edu/record/31139/files/29010045.pdf
Marsh, J.M. 1992. “USDA Data Revisions of Choice Beef Prices and Price Spreads: Implications for Estimating Demand Responses.” Journal of Agricultural and Resource Economics 17(2):323-334. Available at: http://ageconsearch.umn.edu/bitstream/30943/1/17020323.pdf

16 | Page
Mathews, K.H. Jr., W.F. Hahn, K.E. Nelson, L.A. Duewer, and R.A. Gustafson. 1999. “The U.S. Beef Industry Cattle Cycles, Price Spreads, and Packer Concentration.” U.S. Department of Agriculture, Economic Research Service, TB-1874. April. Available at: http://www.themarketworks.org/sites/default/files/uploads/studies/US-Beef-Industry-Cattle-Cycles-Price-Spreads-Packer-Concentra-tion-Economic-Research-Service.pdf
McCormick & Schmick’s Seafood Restaurants, Inc. 2009. Integrated Corporate Relations ICR Xchange Conference – Final. January 15.Available at: https://advance.lexis.com/document?crid=-499121fa-3c15-4ff0-acb1-cc286a51c940&pddocfullpath=%2Fshared%2Fdocument%2F-news%2Furn%3AcontentItem%3A4VDG-FRW0-TWD2-Y0R5-00000-00&pdcontentcomponen-tid=254610&pdmfid=1516831&pdisurlapi=true
Meyer, S.R. 2009. “A Brief Lesson in Pork Sales and Margins.” National Hog Farmer. December 28. Available at: http://www.nationalhogfarmer.com/weekly-preview/1228-lesson-pork-sales-margins
Meyer, S.R. 2010. “Pork Demand Data Sends Mixed Message.” 2010. National Hog Farmer. May 28. Available at: http://www.nationalhogfarmer.com/weekly-preview/0531-pork-demand-date-mixed-messages
Pouliot, S. and L. Schulz. “Measuring Price Spreads in Red Meat.” Agricultural Policy Review. Iowa State University Center for Agricultural and Rural Development. Winter 2016.
Purcell, W.D., C.E. Ward, T.C. Schroeder, R. Jones, J. Mintert, J.N. Trapp, B.K. Goodwin, M.T. Holt, and D. Bailey. “Status, Conflicts, Issues, Opportunities, and Needs in the U.S. Beef Industry.” White paper. May 1999.
Riley, J.M. 2015. “In the Cattle Markets.” Livestock Marketing Information Center. July 23. Available at: http://lmic.info/sites/default/files/publications/cattlemarkets072315.pdf
Rojas, C., A. Andino, and W.D. Purcell. 2008. “Retailers’ Response to Wholesale Price Changes: New Evidence from Scanner-Based Quantity-Weighted Beef Prices.” Agribusiness 24(Janu-ary):1-15.
Ross, J.W. 1984. “Farm-to-Retail Price Spreads for Livestock.” Reciprocal Meat Conference Proceedings, Volume 37, pages 129-133. Available at: https://www.meatscience.org/docs/de-fault-source/publications-resources/rmc/1984/farm-to-retail-price-spreads-for-livestock.pdf?s-fvrsn=ac1fbbb3_2.
RTI. 2007. “GIPSA Livestock and Meat Marketing Study Final Reports.” Available at: https://www.gipsa.usda.gov/psp/publication/live_meat_market.aspx
Schnepf, R. 2013. “Farm-to-Food Price Dynamics.” Congressional Research Service. September 27, 2013. Available at: https://fas.org/sgp/crs/misc/R40621.pdf
17 | Page
Singh, S.D. 2017. “American Beef Boom is Probably Over: Packers are Facing Margin Squeeze.” Farm Futures. January 30. Available at: http://www.farmfutures.com/beef/ameri-can-beef-boom-probably-over
Taylor, C.R. 2002. “Where’s the Beef? Monopoly and Monopsony Power in the Beef Industry.” Agricultural and Resource Policy Forum, College of Agriculture, Auburn University.
TB&P. 2013. “Tyson Foods Says Challenges Persist in Beef, Pork.” February 26. Available at: https://talkbusiness.net/2013/02/tyson-foods-says-challenges-persist-in-beef-pork/
Tonsor, G.T. and T.C. Schroeder. 2017. “Creating and Assessing Candidate Food Service and Retail Beef Demand Indices.” Report prepared for the Cattlemen’s Beef Board. February 3. Available at: https://www.beefboard.org/news/files/FY2017/Demand%20Indices%20Report%20-%20full.pdf
United States Government Accountability Office. 2018. “Additional Data Analysis Could Enhance Monitoring of U.S. Cattle Market.” GAO-18-296. April. Available at: https://www.gao.gov/as-sets/700/691178.pdf
Ward, C.E. 1988. Meatpacking Competition and Pricing. Blacksburg, VA: Research Institute on Livestock Pricing.
Western Livestock Journal. 2018. “Ranchers’ Cut of Retail Beef Value Grows.” February 26. Available at: https://www.wlj.net/top_headlines/ranchers-cut-of-retail-beef-value-grows/arti-cle_11d90dbc-1b46-11e8-a438-c3c843bef88b.html
White, F.T., L.A. Duewer, J. Ginzel, R. Bohall, and T. Crawford. 1991. “Choice Beef Prices and Price Spread Series, Methodology and Revisions.” Economic Research Service/USDA, Washington DC, February 1991.