usda 2017 budget summary
TRANSCRIPT

United States Department of Agriculture
FY 2017
BUDGET SUMMARY

CONTENTS i
PREFACE ........................................................................................................................................ iii
OVERVIEW .......................................................................................................................................1
BUDGET HIGHLIGHTS .....................................................................................................................3
MISSION AREA/AGENCY DETAILS: FARM AND FOREIGN AGRICULTURAL SERVICES: Farm Service Agency .............................................................................................................15 Risk Management Agency .....................................................................................................26 Foreign Agricultural Service ..................................................................................................29
RURAL DEVELOPMENT: Rural Business-Cooperative Service ......................................................................................37 Rural Utilities Service ............................................................................................................41 Rural Housing Service ...........................................................................................................44 Rural Development Salaries and Expenses ............................................................................47
FOOD, NUTRITION, AND CONSUMER SERVICES: Food and Nutrition Service ....................................................................................................48
FOOD SAFETY: Food Safety and Inspection Service .......................................................................................58
NATURAL RESOURCES AND ENVIRONMENT: Natural Resources Conservation Service ...............................................................................63 Forest Service .........................................................................................................................68
MARKETING PROGRAMS AND REGULATORY PROGRAMS: Animal and Plant Health Inspection Service .........................................................................76
Agricultural Marketing Service ..............................................................................................81 Grain Inspection, Packers and Stockyards Administration ....................................................84
RESEARCH, EDUCATION, AND ECONOMICS: Agricultural Research Service ................................................................................................87 National Institute of Food and Agriculture ............................................................................92 Economic Research Service ...................................................................................................98 National Agricultural Statistics Service .................................................................................99
DEPARTMENTAL STAFF OFFICES ...................................................................................................100
OFFICE OF CIVIL RIGHTS ...............................................................................................................105
OFFICE OF INSPECTOR GENERAL ...................................................................................................106
APPENDIX: Staff Years by Agency ..............................................................................................................107 Budget Authority by Agency ....................................................................................................108 Program Level by Agency ........................................................................................................110 Outlays by Agency ....................................................................................................................112 Discretionary Outlays by Agency .............................................................................................113 User Fee Proposals ....................................................................................................................114 Proposed Budget-Related Legislation.......................................................................................116

ii

PREFACE iii
This Budget Summary describes the fiscal year (FY) 2017 Budget for the U.S. Department of Agriculture (USDA). All references to years refer to fiscal year, except where specifically noted. Throughout the Budget Summary, the “2014 Farm Bill” is used to refer to the Agricultural Act of 2014. Pursuant to the Balanced Budget and Emergency Deficit Control Act of 1985, sequestration is included in the numbers for mandatory programs in 2015 and 2016. The sequestration rate for 2015 is 7.3 percent and the rate for 2016 is 6.8 percent.
The Budget Summary is organized into three sections:
Overview - provides an overview of USDA’s funding.
Budget Highlights – describes key budget proposals and changes in budget authority and outlays.
Mission Area/Agency Details - summarizes agency funding and programs, and performance goals.
Budget and Performance Plan Terms:
Budget Authority (BA) is the authority to commit funds of the Federal Treasury. Congress provides this authority through annual appropriations acts and substantive legislation which authorizes direct spending. The President's budget requests the Congress to appropriate or otherwise provide an amount of budget authority sufficient to carry out recommended government programs.
Obligations are commitments of Government funds that are legally binding. In order for USDA to make a valid obligation, it must have a sufficient amount of BA to cover the obligation.
Outlays are cash disbursements from the Federal Treasury to satisfy a valid obligation.
Program Level (PL) represents the gross value of all financial assistance USDA provides to the public. This assistance may be in the form of grants, guaranteed or direct loans, cost-sharing, professional services such as research or technical assistance activities, or in-kind benefits such as commodities.
Performance Goal is the target level of performance at a specified time or period expressed as a tangible, measurable outcome against which actual achievement can be compared, including a goal expressed as a quantitative standard, value, or rate. A performance goal comprises a performance measure with targets and timeframes.
Performance Measures are indicators, statistics, or metrics used to gauge program performance. Program performance measures include outcome, output, and efficiency measures.
The Budget is described in budget authority measures in most instances. However, there are some cases when other measures are used and the reader should take care to note which measure is being used. Also, note that the budget authority tables contained in this document reflect operating levels. In addition, performance goals reflect performance levels at ongoing funding levels and do not include the effect of supplemental appropriations. Performance data for 2016 and 2017 are estimates and subject to change.
The 2015 Annual Performance Report and 2016 Annual Performance Plan which provides performance information concerning USDA achievements in 2015 and plans for 2016 can be

iv PREFACE
found at http://www.obpa.usda.gov. According to the requirement in the GPRA Modernization Act (P.L. 111-352), to address Federal Goals in the agency Strategic Plan and Annual Performance Plan, please refer to http://www.performance.gov for information on Federal Priority Goals and the agency’s contributions to those goals, where applicable.
The 2017 Cuts, Consolidations, and Savings Volume of the President’s Budget identifies the lower-priority program activities per the GPRA Modernization Act. The public can access the volume at: http://www.whitehouse.gov/omb/budget.
Questions may be directed to the Office of Budget and Program Analysis via e-mail at [email protected] or telephone at (202) 720-6176.

OVERVIEW 1
Mission Statement USDA provides leadership on food, agriculture, natural resources, rural development, nutrition, and related issues based on sound public policy, the best available science, and efficient management.
Vision Statement To expand economic opportunity through innovation, helping rural America to thrive; to promote agriculture production sustainability that better nourishes Americans while also helping feed others throughout the world; and to preserve and conserve our Nation’s natural resources through restored forests, improved watersheds, and healthy private working lands.
2017 Funding Overview The 2017 request for discretionary budget authority to fund programs and operating expenses is about $25 billion, about $1 billion below 2016. Discretionary budget authority includes funding for Special Supplemental Nutrition Program for Women, Infants, and Children (WIC), Rural Development, food safety, Forest Service, research and conservation activities.
$92$103
$118$128 $132 $133
$118
$138$130
$24$27
$25$24 $23 $25
$24
$26$25
$116$130 $143
$152 $155 $158$142
$164 $155
-45.000
5.000
55.000
105.000
155.000
0
20
40
60
80
100
120
140
160
180
2009 2010 2011 2012 2013 2014 2015 2016 2017
$ B
illio
ns
Fiscal Year
USDA Budget Authority
Mandatory Discretionary
Funding for mandatory programs is estimated at $130 billion, about $8 billion below 2016. The change in mandatory funding is largely due to reductions in the Commodity Credit Corporation Fund.
USDA’s total outlays for 2017 are estimated at $151 billion. Roughly 83 percent of outlays, about $126 billion, are associated with mandatory programs that provide services as required by law. These outlays include crop insurance, nutrition assistance programs, farm commodity and trade programs, and a number of conservation programs. The remaining 17 percent of outlays, estimated at about $25 billion, are associated with discretionary programs such as WIC; food safety; rural development loans and grants; research and education; soil and water conservation technical assistance; animal and plant health; management of national forests, wildland fire, and other Forest Service activities; and domestic and international marketing assistance.

2 OVERVIEW
$131 $118 $115 $127 $126
$25$24 $24
$27 $25
$156$142 $139
$154 $151
0
20
40
60
80
100
120
140
160
180
2013 2014 2015 2016 2017
$ B
illio
ns
Fiscal Year
USDA Outlays
Mandatory Discretionary
Nutrition Assistance 71%
Conservation and Forestry
7%
Farm and Commodity Programs
16%
All Other* 6%
2017 Outlays
*Includes Rural Development, Research, Food Safety, Marketing and Regulatory, and Departmental Management

BUDGET HIGHLIGHTS 3
Support for Agriculture – Farmers, ranchers and those working in supporting industries maintain an agriculture sector that has seen strong growth over the past seven years. Agriculture and related industries account for about $775.8 billion in economic activity, support one out of every twelve jobs in the economy, and help to maintain vibrant, thriving rural communities. America’s farmers and ranchers are expanding into new markets around the world, spurring innovation, and creating jobs and opportunity on and off the farm. Agricultural exports have climbed more than 45 percent in value since 2009, totaling $911.3 billion over the past seven years and set a new record in 2014 at $152.3 billion, more than $11 billion above the previous record. The 2017 Budget continues a strong farm safety net and makes investments to meet challenges of a competitive global market, changing climate, and making agriculture a reality for new and beginning farmers. The Budget will continue to ensure the tools are in place to address animal disease outbreaks that threaten agriculture productivity. The 2017 Budget provides:
• Funding for an in-country presence in Cuba to cultivate key relationships, gain firsthand knowledge of the country’s agricultural challenges and opportunities, and develop programs for the mutual benefit of both countries. U.S. agricultural exports have grown significantly since trade with Cuba was authorized in 2000. In 2014, Cuba imported over $2 billion in agricultural products including $300 million from the U.S., and an in-country presence will capitalize on opportunities this nearby market provides for U.S. agricultural exporters.
• Assistance to support agricultural trade, which reached a record $152.3 billion in 2014, including more than $6.4 billion in trade preserved through resolution of foreign market access issues in 2014. Agriculture exports have had the strongest seven-year period of growth in our Nation’s history, with U.S. agricultural product exports totaling $911.3 billion between 2009 and 2015. Since 2009, USDA has helped challenge 2,098 sanitary and phytosanitary, technical, and other barriers to the export of American agricultural products, helping to spur record exports of American agricultural products. In countries without access to adequate commercial credit, the 2017 Budget provides $5.5 billion for the Export Credit Guarantee program.
• Direct and guaranteed loans to support about 43,000 producers, 80 percent of whom will be beginning farmers and ranchers, including veterans, and socially disadvantaged producers. Includes a total loan level of about $6.4 billion for Farm Service Agency direct and guaranteed farm ownership and operating loans. Since 2009, USDA has provided about 237,000 loans totaling over $33 billion to farmers and ranchers. Additional lending opportunities are provided for Indian Country, including $20 million in loan level for Indian Land Acquisition loans and $10 million in loan level for the Highly Fractionated Indian Land intermediary re-lending program.
• Resources to assist the next generation of new and beginning farmers and ranchers, including military veterans, overcome barriers they face when entering agricultural production. This investment will support three overarching goals: assisting new producers in overcoming the most commonly-cited barriers – the inability to access sufficient capital and to acquire land; expanding financial literacy and business training tools to help support the development of financially sustainable operations; and, expanding access and awareness of available resources. Increases include $10 million for the Outreach and Assistance for Socially Disadvantaged Farmers and Ranchers and Veteran Farmers and Ranchers Grant Program; $4 million for the Farm Service Agency

4 BUDGET HIGHLIGHTS
to support regional coordinators within StrikeForce States to facilitate and coordinate producer outreach and provide support for USDA employees in their region; $5 million under the Sustainable Agriculture Research and Education Program to support beginning farmers and ranchers in the adoption of sustainable agricultural practices; $2.5 million for a new competitive Food and Agriculture Resilience Program for Military Veterans (FARM-Vets) that will focus on projects involving research, education, and extension activity for veterans; $3 million under the National Agricultural Statistics Service to survey beginning farmers on unmet needs or barriers to access to USDA programs; and, about $0.5 million for the Economic Research Service to expand analysis to examine differences in adoption of new approaches to meeting changing consumer needs by new farmers and ranchers, including socially disadvantaged, women, and veterans.
• Assistance to the Nation’s farmers and ranchers take advantage of emerging marketing opportunities for local and regional foods through on-farm research, support for value-added production and processing, farm-to-school efforts, and venues such as food hubs. Also includes funding to increase the availability of healthy foods in underserved areas, which will expand demand for locally and regionally produced food. Between 2009 and 2014, USDA invested more than $800 million in more than 29,100 local and regional food businesses and infrastructure projects. As a result, the market for local food has grown to at least $12 billion in 2014 from $5 billion in 2008.
• A total of $2.9 billion for agricultural research and related activities, including: $1.1 billion that will support approximately 700 research projects in over 90 laboratories of the Agricultural Research Service; $1.4 billion for extramural research, education, and extension programs of the National Institute of Food and Agriculture; $177 million for the National Agricultural Statistics Service, and $91 million for the Economic Research Service. The Budget provides $700 million for Agriculture and Food Research Initiative (AFRI) competitive research grants, including $375 million in discretionary funding and $325 million in mandatory funding to address key research needs. Research has been shown to significantly boost agricultural productivity. Recent outcomes include: new ways to deal with the influenza virus in pigs; increased milk production with fewer resources; innovative and effective ways to manage pests; innovations in irrigation technologies resulting in water savings and improved nitrogen use efficiency; and increased profitability of farmers and livestock producers despite droughts and increasing temperatures.
• Resources necessary to strengthen animal disease response capabilities. In recent years, USDA has responded to outbreaks of swine enteric coronavirus disease and highly pathogenic avian influenza. These outbreaks caused significant industry impacts. While the Animal and Plant Health Inspection Service has a strong track record of addressing animal diseases, these two outbreaks have highlighted the need for enhanced staffing to better respond to animal disease outbreaks and to improve regulation of select agents. The Animal and Plant Health Inspection Service has experienced a reduction of more than 200 animal health professionals over the last decade, which has resulted in challenges implementing response plans. For this reason, the Budget includes an increase of an increase of approximately $31 million to strengthen animal disease capabilities.
• Funding to continue efforts to control feral swine, a harmful and destructive invasive species. The feral swine population is estimated to be responsible for $1.5 billion in damage annually. In 2015, APHIS successfully eliminated feral swine from four States. The Budget includes approximately $20 million for this effort.

BUDGET HIGHLIGHTS 5
• Funding to continue efforts to increase the demand for biofuels. The Budget includes $43 million in Commodity Credit Corporation funding to fulfill USDA’s commitment to assist in the development and support of a commercial advanced drop-in biofuel to be used for both Department of Defense and private sector transportation. In 2015, USDA invested $100 million in the Biofuel Infrastructure Partnership (BIP), a partnership between the Government and States and private partners, to install nearly 5,000 pumps offering higher blends of ethanol nationwide. With the matching commitments by State and private entities, the BIP is investing a total of $210 million to nearly double the number of fueling pumps nationwide that supply renewable fuels to American motorists. These investments will help to create new markets for agricultural commodities, support demand and increase prices paid to farmers.
• Support for crop insurance coverage on an estimated $92 billion in crop production. Since the 2009 crop year, USDA has provided crop insurance protection for nearly $725 billion in crop production. As of January 15, 2016, indemnities paid for losses on the 2009-2015 crops have totaled about $64 billion.
• A proposed legislation to make smart and targeted reforms to the crop insurance program that reduce the cost of the program, while still maintaining a quality safety net for farmers.
Rural Opportunities – Rural America makes significant contributions to the security, prosperity, and economic strength of the country but faces significant challenges from declining population, lagging job growth and persistent poverty. While poverty is a rural, suburban and urban challenge, the reality is that nearly 85 percent of America's persistent poverty counties are in rural areas. Of particular concern, rural childhood poverty rates are at their highest point since 1986; over 25 percent of rural children live in poverty compared to 21 percent of children in urban areas. USDA continues to focus on promoting economic opportunity, creating jobs, and enhancing the quality of life for those who live in rural America. For example, in the past seven years, the Department helped more than 1.1 million rural families buy or refinance a home, helping over 141,000 rural Americans become homeowners in 2015 alone. Since 2009, nearly 18 million rural residents were able to get access to clean drinking water and better waste water disposal. USDA has supported nearly 112,000 rural businesses through grant and loan support, creating or saving nearly 450,000 jobs between 2009 and 2015. The 2017 Budget strengthens USDA support for rural America with a comprehensive set of loan and grant programs and innovative means to enhance program delivery through a mobile Rural Corps that can more effectively deliver assistance to persistent and high poverty areas.
The 2017 Budget provides:
• A total of $1.2 billion to support rural business creation and expansion through loans and grants, which will lead to the creation or preservation of over 55,000 jobs in rural communities. This funding will support revolving loan funds and microentrepreneur development activities in rural areas. Additionally, funding is provided to support agricultural producers develop and market value added products that provide higher returns for producers and create jobs in rural areas. The Budget also supports start-up capital and business expansion in rural areas for high priority activities, including biobased manufacturing and renewable energy development. USDA will continue to facilitate private equity investments in agriculture-related businesses through the Rural Business Investment Company. Currently, USDA programs exist to help

6 BUDGET HIGHLIGHTS
provide loans or loan guarantees to help rural businesses grow, but many small cutting-edge businesses also need equity support in addition to or instead of borrowed funds.
• Funding that facilitates the growth of the bioeconomy with a $25 million increase in competitive research funding under AFRI to support development of biobased energy sources. Funds would be used to link feedstock development, production, conversion, and markets in the creation of commercial-scale, advanced biofuels and biobased products that are compatible with existing infrastructure.
• A total of $6.5 billion in loans for rural electric improvements that will benefit 6 million rural residents, while increasing renewable energy generation and loans and grants for telecommunications projects to improve services for 100,000 households and businesses.
• More than triple the current funding for broadband grants that serve the neediest, most rural communities, which are least likely to have access to high-speed broadband infrastructure which is a critical foundation to foster job creation. This support is needed because nearly 20 percent of Americans living in rural areas lack access to advanced broadband compared to 2 percent in urban areas.
• Improved health, safety and educational facilities that provide critical services to rural residents. Continued funding for community facilities grants will address emerging priorities such as Promise Zones, Energy Sector Transition, Generation Indigenous, and StrikeForce Communities. These funds will allow USDA to be responsive to community needs, such as modern healthcare facilities and libraries.
• Support for over 166,000 families with homeownership opportunities. Since 2009, the Rural Housing Service has financed approximately 1.1 million home loans for very low and low income rural residents.
• Resources to implement innovative strategies to combat rural child poverty, including $25 million in grants for two-generation demonstration projects – intentionally aligning high-quality early childhood education with high-quality workforce development for parents to put the entire family on a path to permanent economic security and positive life outcomes. These projects will be conducted to address the fact that over 25 percent of rural youth live in poverty. The Budget also introduces a new rural home visiting program to serve more high-risk, high-need children and families in remote rural areas.
• Support for the Healthy Food Financing Initiative, which will provide funding to improve access to affordable, healthy foods in underserved areas. Nationwide, USDA estimates that 23.5 million people, including 6.5 million children, live in low-income areas that are more than a mile from a supermarket. This effort will complement work to help our Nation’s farmers and ranchers take advantage of emerging marketing opportunities for local and regional foods through on-farm research, support for value-added production and processing, farm-to-school efforts, and venues such as food hubs.
• Strengthened program delivery through creation of a Rural Corps pilot to provide mobile technical assistance to needy communities and supports additional staffing for program delivery in StrikeForce areas.
Conservation for Private Working Lands and National Forests – Farms and forests help generate rural wealth through agriculture, recreation and tourism, the creation of green jobs and the production of wood products and energy. These lands are also critical in offering benefits of

BUDGET HIGHLIGHTS 7
clean air, clean and abundant water and critical wildlife habitat. Continued prosperity and benefits rely upon careful stewardship of these lands, particularly in the face of a changing climate. More than half of the Nation’s freshwater flows from public and private forest lands, with 60 million Americans relying on drinking water originating on the National Forest System. Improved agricultural production practices generate important environmental benefits for producers and the public, including quality improvement of ground and surface water, wildlife habitat, air quality, and soil quality. With regard to wildlife habitat, a noteworthy achievement was observed in 2015. As a result of our Working Land for Wildlife efforts and the work of our many partners, 90 percent of the greater sage-grouse’s breeding habitat in the western United States is protected. Due to this achievement, the U.S. Fish and Wildlife Service has determined this species does not warrant protection under the Endangered Species Act. The work that led to this achievement as well as the many other conservation efforts of the Department ensure that private working lands and national forests are conserved, restored, and made resilient to climate change, while enhancing the Nation’s water resources.
The 2017 Budget provides:
• A total of $6.7 billion in funding for Farm Bill conservation programs to bring cumulative enrollment to a historic high of 444 million acres. Includes $1.9 billion in funding for the Conservation Reserve Program. The Conservation Stewardship Program (CSP) and Environmental Quality Incentives Program (EQIP) are funded at authorized levels. This will allow 10 million more CSP acres to be enrolled and will support several critical efforts including the Sage Grouse Initiative, the EQIP Organic Initiative, and the Conservation Innovation Grants program. Also, $500 million in funding is provided to preserve land in agriculture and support habitat for fish and wildlife through the Agricultural Conservation Easement Program (ACEP). ACEP fosters public-private partnerships with landowners, Indian Tribes, State and local governments, and nongovernmental organizations through the use of cooperative agreements or contracts for easements.
• A total of $263 million, an increase of $35.9 million for the Regional Conservation Partnership Program (RCPP). RCPP facilitates the delivery of conservation on a broader scale, while providing additional opportunities for diverse partners to implement innovative and cooperative conservation projects. RCPP leverages private and public funds to implement projects across the country to improve the Nation’s water quality, support wildlife and enhance the environment. Through RCPP, USDA has leveraged $800 million to support 115 high-impact conservation projects across the Nation that will improve the Nation’s water quality, support wildlife habitat and enhance the environment.
• A budget-neutral alternative funding approach to wildland fire suppression that would end the practice of fire transfers and would mitigate the impact of the growing cost of fire suppression on the Forest Service budget. The growth of the fire programs as a percent of the agency’s budget and the compounding problem of transfers have a significant impact on the agency’s ability to accomplish critical work including restoration work that can reduce fire threats, protection of drinking water source areas, and recreation investments that support thousands of recreation-related jobs. In this proposed approach, the 10-year average for the cost of wildfire suppression is fully funded through a combination of the Forest Service’s discretionary budget and additional emergency budget resources to provide the necessary funding for wildland fire suppression, while promoting program integrity within the Forest Service’s other,

8 BUDGET HIGHLIGHTS
mission critical activities. Additional budget resources are made available to USDA through a budget cap adjustment to cover wildland fire suppression above the base appropriation. This approach will allow the Forest Service to stabilize and invest in programs that restore forested landscapes and prepare the 70,000 communities in the Wildland Urban Interface to avert and minimize damage from future wildfires.
• The maintenance of 193 million acres of Forest and Grasslands thereby enabling 166 million visitors to enjoy the beauty and serenity of these forests and lands. Visitation to our national forests and grasslands supports approximately 194,000 jobs and contributes over $13 billion to the Nation’s economy. This includes continued support for the President’s America’s Great Outdoors Initiative, helping America’s young people and our returning veterans become actively engaged in protecting and enhancing our extraordinary natural and cultural heritage.
• A total of $228 million in discretionary and mandatory funding for Forest Service Forest Legacy and Land Acquisition as part of the Administration’s full funding of the Land and Water Conservation Fund (LWCF). In total, for USDA and the Department of the Interior this request will provide $900 million in discretionary and mandatory funding for LWCF. The Budget proposes to permanently authorize $900 million in annual mandatory funding. LWCF provides critical support to States to protect high priority forests from conversion and enhance recreation and support the 194,000 jobs created through recreation, hunting and fishing on Forest Service lands.
• A total of $40 million for the Collaborative Forest Landscape Restoration Program (CFLRP). CFLRP funds multi-year, landscape scale restoration projects on the National Forest System, taking an all-lands approach to create a more resilient landscape while increasing the pace and scale of restoration. CFLRP projects are designed to reduce the risk of catastrophic fire, while improving water quality, increasing carbon sequestration, and encouraging the creation of sustainable jobs in rural America.
• An increase of $4.5 million to enhance the enforcement of the Lacey Act. This funding will be used to make submission of mandated declarations easier for importers, providing law enforcement agencies improved access to declarations, thereby facilitating enforcement.
Food Security and Safety – A plentiful supply of safe and nutritious food is essential to the healthy development of every child in America and to the well-being and productivity of every family. USDA has collaborated extensively with other Federal partners to safeguard the food supply, prevent foodborne illnesses and improve consumers’ knowledge about the food they eat. Since 2009, the number of illnesses attributed to products regulated by the Food Safety and Inspection Service (FSIS) declined by more than 46,000 on an annual basis, or nearly 11 percent. USDA’s nutrition assistance programs help reduce food insecurity, improve nutrition and reduce obesity by ensuring that children and families have access to healthy diets in schools and child and adult care facilities and ensuring that families have the means to purchase food. Over the course of a year, one in four Americans will be served by one of USDA’s nutrition assistance programs designed to prevent hunger and obesity. Successful implementation of the Healthy, Hunger Free Kids Act has provided significant improvements in the nutritional quality of school meals, with 97 percent of participating schools meeting the improved meal standards. In addition to improving access to healthy foods, USDA provides nutrition education and engages in targeted outreach to ensure Americans are equipped to make healthy choices. USDA has also made significant improvements in program delivery, with a

BUDGET HIGHLIGHTS 9
reduction in Supplemental Nutrition Assistance Program (SNAP) payment errors by about 15 percent between 2009 and 2014.
Food security is important for sustainable economic growth of developing Nations and the long-term economic prosperity and security of the United States. Unfortunately, food insecurity is expected to rise. In 2000, USDA estimated that 37.4 percent of the population of 76 low- and middle-income developing countries were food-insecure. By 2012, this dropped to 20.6 percent, largely due to increases in the total area harvested, while yields remained constant or declined. Continued growth in the area harvested is not sustainable, thus food insecurity is expected to rise to 24.4 in 2018. USDA’s Food for Progress and the McGovern-Dole International Food for Education and Child Nutrition Program have provided benefits to millions of people overseas. These programs have helped to engage recipient countries not only by delivering food assistance, but also by fostering stronger internal production capacity and infrastructure, generating employment, boosting revenue, and developing new markets and productive economic partnerships. The 2017 Budget provides:
• Funding for projected participation in nutrition assistance programs, including: o Average monthly participation of 44.5 million in SNAP.
o 32 million children to be served school lunches and about 15 million to be served school breakfast each day.
o Average monthly participation of 8.1 million women, infants, and children who will get better nutrition through the WIC program.
• Better means to address child hunger during the summer. Based on the success of the Summer Electronic Benefit Transfer for Children (SEBTC) demonstration projects, the Budget proposes an increase of $12.2 billion over 10 years to make the program permanent and begin phased-in nationwide expansion. With an initial investment in 2017 of $146 million, almost one million children would receive benefits in the first year. In a related effort to address hunger in the summer, the Budget provides $10 million for the Summer Food Service Program for demonstration projects of non-congregate meal services by States and Indian Tribal Organizations in rural areas. Further, it provides $26 million to expand SEBTC demonstration projects.
• Easier access to SNAP by the elderly by helping States use data matching in lieu of reporting requirements for these generally stable households. The Budget also proposes an almost $14 million increase in the Commodity Supplemental Food Program to support the current number of elderly individuals served and expand caseloads in States by 20,000 slots.
• Improved program integrity for Child Nutrition Programs and SNAP aimed at reducing waste, fraud and abuse and ensure that program resources are targeted to those most in need. The Budget provides increased funding to develop and manage a framework related to reducing improper and erroneous payments while also ensuring proper implementation of the school meals programs. The Budget also increases funding to improve the accuracy and effectiveness of SNAP’s quality control system and provides funding to States to promote integrity education to SNAP clients.
• Support for development of the first-ever dietary guidelines for children birth to two years. The dietary guidelines have a significant impact on nutrition in the United

10 BUDGET HIGHLIGHTS
States because it forms the basis of Federal nutrition policy and programs; helps guide local, State, and national health promotion and disease prevention initiatives; and informs various organizations and industries. The DGA has traditionally focused on adults and children 2 years of age and older. Infants and toddlers from birth to 24 months of age and pregnant women have not been a focus in previous versions of the DGA because of their unique nutritional needs, eating patterns, and developmental stages.
• Better protection for Americans from foodborne illnesses with close to 30,000 fewer illnesses projected in 2017 from 2015 as a result of FSIS food inspection. The Budget includes $8.5 million for FSIS to further modernize its science-based decision-making process by developing and deploying new tools to reduce the prevalence of foodborne illnesses.
• $182 million for the McGovern-Dole Food for Education and Child Nutrition program, which will support assistance to 3.4 million individuals in food insecure countries in 2017. In addition, the Budget includes $20 million for the Local and Regional Food Aid Procurement program, which includes $5 million within McGovern-Dole, to support development projects that will assist 68,000 individuals.
Innovation – USDA has a long history of fostering research and innovation that has helped agricultural production thrive to the benefit of all Americans. In 1929, approximately 20 percent of disposable personal income went to paying for food consumed in the home. By 2014, the latest year for which data are available, this amount stood at approximately 6 percent. Economic analysis shows that long-term agricultural productivity is fueled by innovations in animal/crop genetics, chemicals, equipment, and farm organization that result from public and private research and development. Progress continues in support of technological development and the biobased economy. As a result of research by USDA scientists, between 2009 through 2015, USDA filed 883 patent applications with the U.S. Patent and Trademark Office and was issued 429 patents. In 2015, USDA held 421 income-bearing licenses. It also had 301 cooperative research and development agreements, of which 106 involved small businesses. Agricultural innovation is increasingly important as rural America faces the evolving threat of a changing climate.
The 2017 Budget provides:
• A total of $2.9 billion for agricultural research, education, and extension activities, including $700 million for competitive grants through the AFRI including $325 million in mandatory AFRI funding for research and development that would bring the program up to its authorized level. In addition, ARS scientists will work on about 700 research projects.
• About $61 million to address antimicrobial resistance in pathogens of humans and livestock, and to seek answers to key questions about the relationships among microbes and livestock, the environment, and human health as part of a coordinated Federal strategy.
• Additional research on the effects climate change and to develop adaptive strategies and technologies to address its impacts. Related research on water resources will increase water use efficiency; improve water management practices; improve the sustainability of key groundwater resources; and enhance the development of technologies for use of non-traditional waters, such as treated wastewaters, salty waters, and agricultural return flows.

BUDGET HIGHLIGHTS 11
• $36 million for research to address the decline of pollinator health with a goal of ensuring the recovery of pollinators in consultation with EPA and other relevant Federal partners. Pollinators are critical to our Nation’s economy, food security, and environmental health. Honey bee pollination alone adds more than $15 billion in value to agricultural crops each year, and provides the backbone to ensuring the availability of a variety of fruits, nuts, and vegetables.
• An increase of $7 million to enhanced research and extension efforts in tribal areas through 1994 Institutions and the Federally Recognized Tribes Extension Program (FRTEP). This latter increase will effectively double the number of FRTEP staff engaged in 4-H activities to 72, helping to serve more tribal youth.
• Strengthened USDA abilities to examine the relationships between food programs, policies, and food choices, and address emerging interests in sustainable food systems, by funding an update to the 2012 National Household Food Purchase and Acquisition Survey. The Survey will enhance information on the food purchase patterns of Americans by adding representative populations of participants from the Special Supplemental Nutrition Program for Women, Infants and Children (WIC) and school meal programs, and integrating the purchased foods to their equivalent agricultural food commodities.
Modernization – While providing record levels of service to rural America, USDA has improved the management operations of the Department. Through the Blueprint for Stronger Service, USDA has taken proactive steps to reduce spending, streamline operations and cut costs. These proactive steps have enhanced the ability to carry out the Department’s mission-critical work, while ensuring that USDA's millions of customers across America receive stronger service. Through the Blueprint, USDA has achieved over $1.4 billion in savings and cost avoidance in the management and administrative areas that support Departmental operations. Continuing this work, the Department is focused on improving management of its real property assets and by increasing the efficiency of procurement through enhanced strategic sourcing – particularly in the areas of information technology and fleet. The 2017 Budget builds on the success achieved to date and proposes other program reforms.
The 2017 Budget provides:
• Funds to strengthen SNAP Employment and Training by proactively engaging, supporting, and guiding State agencies and their partners in developing innovative, demand-driven training programs that empower SNAP recipients to attain self-sufficiency.
• Resources to continue modernization of the headquarters facilities to eliminate leased space and address critical life/safety deficiencies through a phased modernization of the USDA headquarters complex, including the 80 year old South Building.
• Expanded cyber security assets to protect the USDA network through the acquisition of more robust scanning tools and services to better protect the data and sensitive information of employees and customers of the Department.
• Key research infrastructure investments include addressing the backlog of USDA’s key laboratory construction and renovation needs, consistent with the 2012 Capital Investment Strategy, including the Agricultural Research Technology Center in Salinas,

12 BUDGET HIGHLIGHTS
CA, where research is done on alternatives to methyl bromide and development of scientifically based organic crop production practices for weed, insect, and disease control, as well as the Foreign Disease-Weed Science Research Laboratory in Ft. Detrick, MD.

FARM AND FOREIGN AGRICULTURAL SERVICES 13
MISSION AND RELATIONSHIP TO STRATEGIC GOALS The Farm and Foreign Agricultural Services (FFAS) mission area has responsibility for the delivery of programs and services that focus on supporting a sustainable and competitive U.S. agricultural system. According to a report by the Economic Research Service, cash receipts for all commodities are expected to fall by nearly $41.5 billion in 2015. This decline largely reflects falling commodity prices, which are lower for a broad set of agricultural commodities in 2015 relative to recent years. This decrease in cash receipts shows the importance of the USDA farm safety-net and farm credit programs. These programs assist America’s farmers and ensure that agriculture continues to provide the foundation for prosperity in rural areas as well as being a critical element of the Nation’s economy. Sixteen million Americans are employed directly in agriculture, or in agriculture related industries. Fourteen percent of all manufacturing jobs are related to food processing and food manufacturing.
American agriculture set the three highest records for agricultural exports in 2013, 2014, and 2015. Exports for 2015, the third highest record, were $139.7 billion. Exports helped agriculture to be one of the bright spots in the economy. U.S. agricultural exports continue to outpace U.S. agricultural imports since 1960, generating a surplus in U.S. agricultural trade. The period of 2009 to 2015 stands as the strongest seven-year period for agricultural exports in our nation’s history, with a total export value of more than $911 billion. The 2009 to 2015 U.S. agricultural exports totaled over $411 billion more than the previous seven fiscal years.
Crop insurance is a critical component of the farm safety net. It is designed to ensure that farmers and ranchers effectively manage their risk through difficult periods, helping to maintain America's food supply and the sustainability of small, limited resource, socially disadvantaged and other traditionally underserved farmers. Since 2009, farmers have collected approximately $63 billion in crop insurance indemnities. As of December 31, 2015, USDA has paid out $4.5 billion for 2015 crop year losses. Throughout 2015 RMA continued the initiatives set forth by the 2014 Farm Bill, including expansion of Supplemental Coverage Option (SCO) and Stacked Income Protection Plan (STAX), making available the Yield Exclusion Option for producers, and rolling out Whole Farm Revenue Protection, which will be available in every county in the U.S. in 2016.
In 2015, USDA enrolled 1.76 million farmers in the Agriculture Risk Coverage (ARC) and Price Loss Coverage (PLC) programs by conducting an unprecedented education campaign. ARC and PLC are a part of the farm-safety net, providing assistance only when there are year-to-year crop revenue or commodity downturns. As of January 7, 2016, ARC and PLC have provided nearly $5.2 billion in financial assistance for crop year 2014, to more than 900,000 farms.
USDA continues to provide tools for America’s farmers to be good stewards of the land. The Conservation Reserve Program (CRP) marked 30 years of protecting and conserving environmentally sensitive land in 2015. CRP is protecting more than 170,000 stream miles with riparian forest and grass buffers, enough to go around the world 7 times. Since 1985, the program has sequestered an annual average of 49 million tons of greenhouse gases, equal to taking 9 million cars off the road; prevented 9 billion tons of soil from erosion, enough to fill 600 million dump trucks; and reduced nitrogen and phosphorous runoff by 95 and 85 percent, respectively. As of November 30, 2015, 23.5 million acres were enrolled in CRP. CRP offers participants the opportunity to reduce atmospheric greenhouse gas concentrations to mitigate climate change, while achieving other environmental benefits.

14 FARM AND FOREIGN AGRICULTURAL SERVICES
Since 2009, USDA has significantly expanded the availability of farm credit. USDA has provided about 237,000 loans totaling over $33.3 billion to family farmers, including beginning, underserved, and veteran farmers and ranchers. USDA operates a microloan program to better serve the unique financial operating needs of beginning, niche and the smallest of family farm operations. Operating under the authorities of the direct operating loan program, the microloan program offers more flexible access to credit and serves as an attractive loan alternative to credit cards for smaller farming operations like specialty crop producers and operators of community supported agriculture. These smaller farms, including non-traditional farm operations, often face limited financing options. Since program inception in 2013, USDA has assisted 16,000 small, underserved and new farmers though the microloan program. In FY 2015, about 6,600 microloans were made, with 70 percent of the loans made to new farmers.
The FFAS mission area contributes to multiple USDA Strategic Goals. Specifically, to assist rural communities, the FFAS mission area: (1) supports a strong financial safety net including providing access to credit for farmers and ranchers who are temporarily unable to obtain commercial credit such as beginning farmers and socially disadvantaged farmers and ranchers; and (2) promotes the vitality of rural America by improving access to international markets, providing credit guarantees for U.S. farm exports, and supports industry efforts to develop new markets. In support of ensuring private working lands are preserved, the FFAS area: (1) protects watershed health to ensure clean and abundant water; and (2) enhances soil quality to maintain productive working cropland. Finally, in support of agricultural production, FFAS promotes the international acceptance of new technologies, and promotes sustainable, productive agricultural systems and trade in developing countries to enhance global food security. The work of the FFAS mission area is carried out by its three agencies, the Farm Service Agency (FSA), the Risk Management Agency (RMA), and the Foreign Agricultural Service (FAS).

FARM AND FOREIGN AGRICULTURAL SERVICES 15
FARM SERVICE AGENCY (FSA) FSA supports the delivery of farm loans, commodity, conservation, and disaster assistance, and related programs. FSA provides administrative support for the Commodity Credit Corporation (CCC), which funds most of the commodity and export programs, and some of the USDA conservation programs. FSA delivers its programs through more than 2,100 local and regional Service Centers, 50 State Offices, and an area office in Puerto Rico.
2015 2016 2017Enacted Estimate Budget
$1,200 $1,200 $1,210310 310 310
1,510 1,510 1,519
(307) (307) (307)79 69 838 8 10
87 77 933 3 36 7 0
1,606 1,597 1,616
1 1 02 2 09 108 03 6 0
15 117 01,621 1,713 1,616
1 1 115 16 1628 30 3044 47 47
1,664 1,760 1,662
a/
b/
Dairy Indemnity Program............................................................
Provided through general provisions.
Pima Agriculture Cotton Trust Fund.............................................Agricultural Wool Apparel Manufacturers Trust Fund...................
Total, Mandatory Programs......................................................Total, Farm Service Agency...........................................................
In addition, the 2014 Farm Bill provides FSA with $100 million in FY 2014 for implementation costs and $10 million in FY 2015 and in FY 2016 contingent upon the implementation of the Acreage Crop Reporting Streamlining Initiative.
Emergency Conservation Program............................................Emergency Forest Restoration Program....................................
Total, Other Funding.............................................................Total, Discretionary Programs..................................................
Mandatory:
Grassroots Source Water Protection Program...............................Total, Ongoing Discretionary Programs.....................................
Other Funding: b/Reforestation Pilot Program......................................................Geographically Disadvantaged Farmers and Ranchers................
Farm Service AgencyBudget Authority(Dollars in Millions)
Program
Discretionary:FSA Salaries and Expenses:
Salaries and Expenses (Direct Appropriation)............................Transfer from Program Accounts.............................................
Total, Salaries and Expenses a/..............................................Agricultural Credit Insurance Fund Program Account:
Transfer to FSA Salaries and Expenses.....................................Loan Subsidy...........................................................................Loan Program Expenses..........................................................
Total, Agricultural Credit Insurance Fund Program Account....State Mediation Grants................................................................

16 FARM AND FOREIGN AGRICULTURAL SERVICES
PL BA PL BA PL BAFarm Operating Loans:
Guaranteed Unsubsidized...................................... $1,393 $15 $1,393 $14 $1,432 $15Direct.................................................................. 1,252 63 1,252 54 1,460 62
Total, Operating Loans....................................... 2,645 78 2,645 68 2,892 77Farm Ownership Loans:
Guaranteed Unsubsidized...................................... 2,000 0 2,000 0 2,000 0Direct.................................................................. 1,500 0 1,500 0 1,500 0
Total, Ownership Loans..................................... 3,500 0 3,500 0 3,500 0Emergency Loans.................................................... 35 1 35 1 23 1Indian Land Acquisition Loans.................................. 2 0 2 0 20 0Indian Fractionated Land Loans................................ 10 0 10 0 10 3Boll Weevil Eradication............................................ 60 0 60 0 60 0Conservation Loans:
Guaranteed.......................................................... 150 0 150 0 150 0Total, Ongoing Farm Loan Programs........................ 6,402 79 6,402 69 6,655 81Grants:
Individual Development Grants.............................. 0 0 0 0 2 2Total, Farm Loan and Grant Programs...................... 6,402 79 6,402 69 6,657 82
Enacted Estimate Budget
Agricultural Credit Insurance FundFarm Loan and Grant Programs
Program Level (PL) and Budget Authority (BA)(Dollars in Millions)
2015 2016 2017Program
Farm Loan and Grant Programs – The farm loan programs serve as an important safety net for America’s farmers by providing a source of credit when they are temporarily unable to obtain credit from commercial sources. In order to meet the continued demand for farm credit, the 2017 Budget provides $6.7 billion for farm loans, $255 million higher than the level provided in 2016. FSA anticipates continued strong demand for its farm loan programs in 2017 as a result of relatively high production costs and increased operating capital needs.
The 2014 Farm Bill gave FSA more flexibility in setting the criteria for types of entities eligible for farm loans, allowed FSA to provide more favorable terms for certain farm loans, raised the maximum loan amount for microloans to $50,000, and provided the authority for FSA to offer a relending program for purchasers of Highly Fractionated Indian Land.
The 2017 Budget supports an estimated 43,000 farmers and ranchers by financing operating expenses and providing opportunities to acquire a farm or keep an existing one. The availability of farm operating loans provides farmers with short-term credit to finance the costs of continuing or improving their farming operations, such as purchasing seed, fertilizer, livestock, feed, equipment, and other supplies. For farm operating loans, the 2017 Budget provides about $1.5 billion for direct loans and $1.4 billion for guaranteed loans. The requested loan levels will serve an estimated 29,800 farmers, about 24,000 of whom will receive direct loans and 5,800 will

FARM AND FOREIGN AGRICULTURAL SERVICES 17
receive guarantees. For farm ownership loans, the 2017 Budget requests $1.5 billion in direct loans and $2.0 billion for guaranteed loans. The 2017 loan levels will provide about 12,800 people with the opportunity to either acquire their own farm or keep an existing one; about 8,300 borrowers will receive direct loans and 4,500 will receive guaranteed loans.
$2,859 $2,859 $3,075$3,543 $3,543 $3,582
0
500
1,000
1,500
2,000
2,500
3,000
3,500
4,000
FY 2015 FY 2016 FY 2017
$ M
illio
ns
Farm Loan and Grant ProgramsProgram Level
Direct Loans and Grant Programs Guaranteed Loans
A portion of both direct and guaranteed farm operating and ownership loan funds is targeted to beginning and socially disadvantaged borrowers. Key performance metrics for the farm loan programs measure the programs' success in providing access to credit for beginning farmers, racial and ethnic minority farmers, and women farmers.
Key Performance Measure Actual Target
2012 2013 2014 2015 2016 2017 Percentage Direct and Guaranteed lending to Socially Disadvantaged Farmers (SDA) 13.3 13.6 14.2 15.0 14.0 14.1
Percentage Direct and Guaranteed lending to Beginning Farmers (BF) 68.8 70.0 79.2 85.6 76.5 77.5 Note: Metric is calculated by dividing the total number of SDA (or BF) borrowers in FSA’s loan portfolio at the end of a fiscal year by the total number of SDA (or BF) farmers identified in the 2007 Ag Census who had $10,000 or more of gross farm sales and any interest expense.
The 2017 Budget includes $22.6 million loan level for emergency (EM) loans. Demand for EM loans is difficult to predict; funding is requested to ensure that support is available in the event of a natural disaster. The Highly Fractionated Indian Land (HFIL) loan program will continue to be funded at $10 million. As authorized in the 2014 Farm Bill, FSA will offer this program as an intermediary re-lending program providing loans to eligible lenders to establish a revolving loan fund, which will be used to make loans to Tribes and tribal members to purchase fractionated

18 FARM AND FOREIGN AGRICULTURAL SERVICES
interests of real estate. The Budget requests a loan level of $20 million for Indian Land Acquisition loans, an increase in $18 million from 2016. No additional budget authority is required to provide the increased loan level. The program level funding for boll weevil eradication loans remains at $60 million, the same level provided in 2016.
The Consolidated Farm and Rural Development Act authorizes an Individual Development Account (IDA) pilot program to provide for matching-fund savings accounts for beginning farmers or ranchers to be used for certain farm-related expenses. The 2017 Budget funds IDAs at $1.5 million.
Funding for State mediation grants is proposed at $3.4 million, the same level provided in 2016. These grants are made to States to help support certified programs that provide alternative dispute resolution on a wide variety of agricultural issues. Mediation benefits family farmers, including many low-income and socially disadvantaged farmers who, because of mediation, are often able to resolve credit and other issues and remain on the farm.
2015 2016 2017Enacted Estimate Budget
$2,077 $20,545 $12,81298 0 0
$2,175 $20,545 $12,812
a/ The program expired at the end of FY 2014, but funds sequestered in FY 2014 were restored in FY 2015. These funds were made available to carry out corrective actions, process pending payments for existing contracts, and de-obligate funds for contracts with unpaid obligations to close out the program. There is no authorization to collect funds after FY 2015.
Mandatory:Commodity Credit Corporation Fund............................................Tobacco Trust Fund a/................................................................
Commodity Credit CorporationBudget Authority(Dollars in Millions)
Total, Commodity Credit Corporation........................................
Program
Commodity Credit Corporation – The Commodity Credit Corporation (CCC) provides funding for commodity programs administered by FSA and many Farm Bill programs such as the conservation programs administered by FSA and the Natural Resources Conservation Service (NRCS) and export programs administered by Foreign Agricultural Service (FAS). CCC borrows funds needed to finance these programs from the U.S. Treasury and repays the borrowings, with interest, from receipts and from appropriations provided by Congress.
The commodity programs are critical components of the farm safety net, serving to expand domestic market opportunities and provide risk management and financial tools to farmers and ranchers. Net CCC expenditures for commodity payments in 2016 are significantly above the 2015 level, primarily as a result of timing differences associated with the 2014 Farm Bill commodity programs. Prior to enactment of the 2014 Farm Bill, the 2015 commodity program payments would have been primarily composed of 2014-crop direct payments and 2013-crop counter-cyclical payments from the Direct and Counter-Cyclical Program (DCP), and Average Crop Revenue Election (ACRE) payments. However, the 2014 Farm Bill terminated the DCP and ACRE programs effective with the 2014 crop and authorized in their place the Agriculture Risk Coverage (ARC) and Price Loss Coverage (PLC) programs. Under the terms of the 2014 Farm Bill, the 2014 crop year ARC and PLC payments could not be made until after October 1, 2015 (i.e. fiscal year 2016). As a result, the 2016 commodity program payments reflect an

FARM AND FOREIGN AGRICULTURAL SERVICES 19
increase of about $5.5 billion above the 2015 level due to this timing shift. The final Counter-Cyclical and ACRE payments available under the 2008 Farm Bill are reflected in the 2015 commodity program payments.
In addition, 2015 commodity program payments for upland cotton reflect about $484 million in payments for the 2014 crop year under the Cotton Transition Assistance Payment (CTAP) program for upland cotton. CTAP was authorized in the 2014 Farm Bill for crop years 2014 and 2015 to provide payments to growers of upland cotton as they transition from direct payments to the new Stacked Income Protection Plan (STAX) administered by the Risk Management Agency. Most cotton-producing counties had STAX available for the 2015 crop year and therefore were not eligible for CTAP payments. CTAP payments decreased from $484 million in 2015 (for the 2014 crop year) to just $1 million in 2016 (for the 2015 crop year).
2015 2016 2017Enacted Estimate Budget
$24 0 0279 0 0174 $121 $169
0 5,545 9,618484 1 0
a/ 1 180306 1,075 239
1,266 6,743 10,2052,626 636 482
125 147 1540 43 437 10 24
658 636 3934,682 8,214 11,300
1,736 1,836 1,917
5 6 61,741 1,841 1,923
2 3 3192 185 19231 32 33
Program
Total, Conservation Programs...................................................Export Programs:
Quality Samples Program ..........................................................Market Access Program (MAP).................................................Foreign Market Development (Cooperator) Program.....................
Total, CCC Commodity Programs ............................................Conservation Programs:
Conservation Reserve Program...................................................Emergency Forestry ConservationReserve Program........................................................................
Commodity Credit CorporationNet Outlays
(Dollars in Millions)
Loan Deficiency Payments.......................................................Agriculture Risk Coverage/Price Loss Coverage.......................
Commodity Programs:Commodity Payments
Direct.....................................................................................ACRE.....................................................................................
Cotton Transition Assistance Program.......................................Dairy Margin Protection Program ............................................Other......................................................................................
Subtotal, Commodity Payments..............................................Disaster.....................................................................................Noninsured Crop Disaster Assistance Program.............................Bio-based Fuel Production...........................................................Biomass Crop Assistance Program (BCAP) ................................All Other b/................................................................................

20 FARM AND FOREIGN AGRICULTURAL SERVICES
2015 2016 2017Enacted Estimate Budget
6 8 9230 228 237
6,654 10,283 13,460
10 13 10261 0 015 16 1629 30 30
315 59 566,969 10,342 13,516
a/
b/
Total, Other CCC Activities .....................................................Total, CCC ...................................................................................
Includes minor commodity program costs, reimbursable agreements, interest, working capital, CCC operating expenses, ocean transportation for export donation, and all other miscellaneous expenses.
Commodity Credit CorporationNet Outlays – continued
(Dollars in Millions)
Program
CCC Export Loans (including Liquidating Account) ....................Tobacco Trust Fund ...................................................................Pima Agriculture Cotton Trust Fund ...........................................Agricultural Wool Apparel Manufacturers Trust Fund .................
Total, Export Programs ...........................................................Total, CCC Fund ...........................................................................Other CCC Activities:
Technical Assistance for Specialty Crops Program.......................
Funding is less than $500,000.
Commodity Programs – The commodity programs are critical components of the farm safety net, serving to expand domestic market opportunities and provide risk management and financial tools to farmers and ranchers. These programs provide protection against adverse market fluctuations; hence, outlays for many of these programs vary significantly from year to year as market conditions change.
The 2014 Farm Bill authorized the Agriculture Risk Coverage (ARC) and Price Loss Coverage (PLC) programs, replacing provisions from previous programs including the counter-cyclical portion of the Direct and Counter-Cyclical Program (DCP), the Supplemental Revenue Assistance Payments (SURE) and the Average Crop Revenue Election (ACRE) programs. Unlike DCP, ARC and PLC provides assistance only when there are revenue or price downturns. Under ARC, producers were given the choice to elect ARC–County (ARC-CO) or ARC-Individual (ARC-IC). ARC-CO offers revenue production on a county basis and ARC-IC offers revenue protection on an individual farm basis. In 2015, all operators on a farm were required to make a one-time election of ARC and/or PLC for each of their covered commodities. Producers were able to elect PLC or ARC-CO on a commodity-by-commodity basis, but ARC-IC had to be elected on a farm basis. Payments under PLC occur if the U.S. average market price for the crop is less than the reference price set in statute, therefore offering price protection. Payments under ARC-CO occur when actual crop revenue is below the ARC revenue guarantee for a crop year. Under ARC-IC, payments are issued when the actual individual crop revenues, summed across all covered commodities on the farm, are less than ARC individual guarantees summed across those covered commodities on the farm. ARC and PLC provide protection against adverse commodity price and yield fluctuations; hence, outlays for the programs may vary significantly from year to year as market and growing conditions change. ARC and PLC payments are issued on October 1 of the subsequent crop year or when the Marketing Year Average for the covered commodity is published by USDA, whichever is later. The first ARC and PLC payments were made in fiscal year 2016 for the 2014 crop year.

FARM AND FOREIGN AGRICULTURAL SERVICES 21
In addition, the 2014 Farm Bill authorized the Margin Protection Program for Dairy (MPP-Dairy) replacing provisions from the Milk Income Loss Contract (MILC) Program. MPP-Dairy offers protection to dairy producers when the difference between the all milk price, as reported by the National Agricultural Statistics Service, and the average feed cost – “the margin” – falls below a certain dollar amount selected by the producer. Participating dairy operations establish their production history upon initial registration, and all producers in the participating dairy operation must provide adequate proof of the dairy operation’s quantity of milk marketed commercially. For existing dairy operations, the production history was established using the highest annual milk production marketed during the full calendar years of 2011, 2012 or 2013. Catastrophic Coverage (CAT) of $4 margin coverage level at 90 percent of the established production history requires no premium payment, but the dairy operation must pay the $100 administrative fee. For increased protection, dairy operations may annually select a percentage of coverage from 25 to 90 percent of the established production history in five percent increments and a coverage level threshold from $4.50 to $8 in 50 cent increments, for an additional premium payment. Dairy operations may only select one coverage level percentage and coverage level threshold for the applicable calendar year.
The Cotton Transition Assistance Payment (CTAP) program for upland cotton was authorized in the 2014 Farm Bill to provide payments to growers of upland cotton as they transition from direct payments to the new Stacked Income Protection Plan (STAX) insurance coverage administered by the Risk Management Agency. CTAP was only available for the 2014 and 2015 crop years.
2015 2016 2017Enacted Estimate Budget
$247 $4,128 $5,152143 682 1,514
18 463 4361,013 548 597-225 0 0
-66 -37 17330 370 1,28674 504 8706 65 131
21 17 296 3 16
1,266 6,743 10,205a/b/ Table contains net outlays by commodity for several CCC programs, including the commodity payment programs (such as
ARC/PLC, CTAP, MPP-Dairy, etc.) and commodity purchases for domestic and foreign food aid programs.
Rice .............................................................................................Upland and Extra Long Staple Cotton .............................................
Commodity Credit Corporation FundCommodity Payments Net Outlays
(Dollars in Millions)
Total, Commodity Payments b/...................................................Negative amounts reflect excess of receipts versus outlays.
Program
Vegetable Oil Products ...................................................................Other Commodities.........................................................................
Tobacco a/.....................................................................................Dairy a/........................................................................................Soybeans and Products...................................................................Peanuts ........................................................................................Minor Oilseeds ..............................................................................
Commodity:Feed Grains...................................................................................Wheat ..........................................................................................

22 FARM AND FOREIGN AGRICULTURAL SERVICES
2015 2016 2017Enacted Estimate Budget
$1,736 $1,836 $1,9175 6 6
$1,741 $1,841 $1,923
Commodity Credit Corporation
Budget Authority
Total, Conservation Programs......................................................
Program
(Dollars in Millions)
Conservation Reserve Program......................................................Emergency Forestry Conservation Reserve Program.......................
Farm Service Agency Conservation Programs
Conservation Programs – Conservation programs administered by FSA and NRCS are funded through the CCC. These programs help farmers adopt and maintain conservation systems that protect water and air quality reduce soil erosion, protect and enhance wildlife habitat and wetlands, conserve water, and sequester carbon.
Conservation Reserve Program (CRP) – The purpose of CRP is to assist farm owners and operators in conserving and improving soil, water, air, and wildlife resources by converting highly erodible and other environmentally sensitive acreage normally devoted to the production of agricultural commodities to a long-term resource-conserving cover. CRP participants enroll in contracts for periods from 10 to 15 years in exchange for annual rental payments and cost-share and technical assistance for installing approved conservation practices. Amounts for CRP include financial and technical assistance. In addition to highly erodible cropland, CRP also can enroll cropland and marginal pastureland in areas adjacent to lakes and streams that are converted to buffers, and cropland that can serve as restored or constructed wetlands, cropland contributing to water quality problems, and cropland converted to valuable wildlife habitat. CRP offers participants the opportunity to reduce atmospheric greenhouse gas concentrations to mitigate climate change, while achieving other environmental benefits.
The 2014 Farm Bill reauthorized CRP through September 30, 2018, and replaced the previous 32 million acre enrollment cap with caps declining to 24 million acres in 2017 and 2018. Also included is authority for up to $10 million in incentive payments through 2018 to encourage tree thinning and $33 million for Transition Incentive Payments (TIP) through 2018. TIP provides retiring land owners and operators with an incentive to return land to production on an expiring CRP contract in a way that preserves established conservation practices. It also provides an opportunity for beginning and socially disadvantaged farmers and ranchers to purchase their own land or rent land. The 2014 Farm Bill also allows enrollment of up to 2 million of grassland acres in CRP (contained within the total CRP enrollment cap) and removes the payment reduction required when lands are hayed or grazed under emergency conditions. CRP enrolls land through general signups and continuous signups, including the Conservation Reserve Enhancement Program (CREP). CREP agreements are Federal/State partnerships designed to address specific environmental objectives. Under general signup provisions, producers compete nationally during specified enrollment periods for acceptance based on an environmental benefits index. Under continuous signup provisions, producers enroll specified high-environmental value lands such as wetlands, riparian buffers, and various types of habitat at any time during the year without competition.
Among multiple environmental benefits, a key performance measure for the CRP program is the number of restored wetland acres. Restored wetlands and upland buffers increase prime wildlife

FARM AND FOREIGN AGRICULTURAL SERVICES 23
habitat and water storage capacity, and lead to a net increase in wetland acres on agricultural land. Wetlands filter nutrients, recharge groundwater supplies, and sequester carbon. Reduced acres of CRP eligible for enrollment may limit future restored wetland acreage. Thus, USDA has adjusted the targets for restored wetland acreage for 2016 and 2017 downward to reflect reduced enrollment for the program.
Key Performance Measure Actual Target
2012 2013 2014 2015 2016 2017 CRP restored wetland acreage (million acres) 2.29 2.09 2.00 1.93 1.90 1.90
In 2015, there were CRP contracts expiring on about 1.4 million acres, contracts were extended on about 488,000 expiring acres and 616,000 acres were placed under contract under continuous signup. Total CRP enrollment at the start of FY 2016 was 24.2 million acres.
Continuous signups are assumed to be held without interruption, with general signups and grassland enrollments assumed to occur in most years. Beginning in 2017, enrollment in any given year is bounded by the amount of acres that are expiring that year, as the 24-million-acre cap is assumed to continue throughout the baseline period.
2015 2016 2017Enacted Estimate Budget
$45 $36 $352,521 563 422
49 29 2011 8 5
$2,626 $636 $482
a/ FY 2015 figures reflect adjustments for pre-2014 Farm Bill crop disaster.
Emergency Assistance for Livestock, Honey Bees
Tree Assistance Program...............................................................Total, Supplemental Agricultural Disaster Assistance a/..............
and Farm-Raised Fish.................................................................
Program
Livestock Indemnity Payments.......................................................Livestock Forage Disaster Program................................................
Supplemental Agricultural Disaster AssistanceOutlays
(Dollars in Millions)
Supplemental Agricultural Disaster Assistance – The Livestock Indemnity Program (LIP), Livestock Forage Disaster Program (LFP), Emergency Assistance for Livestock, Honey Bees, and Farm-Raised Fish (ELAP), and the Tree Assistance Program (TAP) were authorized by the 2008 Farm Bill, through September 30, 2011, under the USDA Supplemental Disaster Assistance Program. The 2014 Farm Bill reauthorized these programs under CCC and made payments retroactive for losses from October 1, 2011. Under the terms of the 2014 Farm Bill, producers are no longer required to purchase crop insurance or Non-Insured Crop Disaster Assistance Program (NAP) coverage to be eligible for these programs.
The Livestock Indemnity Program (LIP) provides benefits to livestock producers for livestock deaths in excess of normal mortality caused by adverse weather or by attacks by animals reintroduced into the wild by the Federal Government.

24 FARM AND FOREIGN AGRICULTURAL SERVICES
The Livestock Forage Disaster Program (LFP) provides compensation to eligible livestock producers that have suffered grazing losses due to drought or fire on land that is native or improved pastureland with permanent vegetative cover or that is planted specifically for grazing.
The Emergency Assistance for Livestock, Honey Bees, and Farm-Raised Fish (ELAP) provides emergency assistance to eligible producers of livestock, honeybees and farm-raised fish for losses due to disease (including cattle tick fever), adverse weather, or other conditions, such as blizzards and wildfires, not covered by LFP and LIP. The 2014 Farm Bill capped funding for ELAP at $20 million for 2012 and each subsequent fiscal year, to remain available until expended. The 2015 outlays for ELAP in the previous table reflect payments for losses since October 1, 2011.
The Tree Assistance Program (TAP) provides financial assistance to qualifying orchardists and nursery tree growers to replant or rehabilitate eligible trees, bushes, and vines damaged by natural disasters.
Salaries and Expenses – The 2017 Budget proposes a level of $1.52 billion, about $9 million above the 2016 enacted level to support federal and non-federal staffing. Within this amount, the request provides an increase to support the StrikeForce initiative ($1.5 million) and new and beginning farmers and ranchers ($3.9 million).
To facilitate implementation of Title I of the 2014 Farm Bill, Congress authorized $100 million in 2014 to be available until expended. These funds are being used, in part, to hire additional temporary non-federal county office staff to implement the new Title I Farm Bill programs, including ARC/PLC. Since the new Farm Bill programs are expected to be fully implanted in 2016, the need for temporary staff will decrease substantially in 2017.
2015 2016 2017Enacted Estimate Budget
Federal........................................................................................ 3,930 4,142 4,172Non-Federal:
Permanent Full-Time................................................................. 7,245 7,281 7,281Temporary................................................................................ 1,149 1,050 200
Total, Non-Federal.................................................................. 8,394 8,331 7,481Total, FSA Staff Years................................................................. 12,324 12,473 11,653
Farm Service AgencyStaff Years
Program
StrikeForce Initiative – Growing the economy by investing in rural communities and increasing opportunities for families is key to our Nation's future. In 2010, Secretary Vilsack established USDA's StrikeForce Initiative for Rural Growth and Opportunity to address the specific challenges associated with rural poverty. The Budget includes $1.5 million within FSA to support a service center agency (SCA) coordination initiative to build upon the success of USDA’s StrikeForce and additional place-based activities. This funding, along with similar requests in Rural Development (RD) and Natural Resources Conservation Service (NRCS), provide a total of about $5 million that will enable the three SCAs to develop a cadre of field-based staff that will principally be focused on improving the access to USDA programs by persons and communities in persistent poverty areas. In particular, this funding will ensure

FARM AND FOREIGN AGRICULTURAL SERVICES 25
improved coordination activities supporting communities experiencing high levels of poverty and joblessness with a specific emphasis on Alaskan Native communities.
New, Beginning, and Veteran Farmers and Ranchers – According to the 2012 Census of Agriculture, 22 percent of all farmers were beginning farmers in 2012. That means one out of every five farmers operated a farm for less than 10 years. In addition, more than 5 million veterans live in rural areas, a higher concentration than in any other part of the country. Many returning service members may be looking for career opportunities in production agriculture. Minority and historically under-represented communities were a significant part of the continued growth among new and beginning farmers and ranchers.
The $3.9 million investment for beginning farmers and ranchers will provide local support to overcome several commonly cited barriers – the inability to access sufficient capital and to acquire land; the lack of mentors to provide guidance; and the lack of support for the next generation of farmers and ranchers. Specifically, this investment: provides 25 new regional coordinators to conduct outreach efforts in support Secretarial initiatives at the local level, including New and Beginning Farmers, Veterans, and StrikeForce initiatives; supports a certified training program for veteran farmers to be prequalified for FSA direct farm ownership loans; establishes a local pilot network of mentors for beginning farmers and ranchers participating in FSA loan and farm programs; supports landowners seeking to sell or rent their land to the next generation of farmers and ranchers; and supports agricultural youth-serving organizations. This investment supports local outreach and education efforts to new and beginning farmers and ranchers, and complements the Department’s efforts to support new, beginning and veteran farmers nationwide.
Information Technology – In 2015, FSA made significant progress in Information Technology (IT) modernization by moving the final business process reliant on the obsolete AS400/S36 computer system to a web-based system. In accordance with the Federal Data Center Consolidation Initiative (FDCCI) guidelines, FSA had closed 1,286 of the AS400/S36 data centers by the end of September 2015. Archival of historical data and equipment removal will continue into 2016.
The 2017 Budget provides funding to ensure core IT organizational functions and operations continue, supports improved IT management and internal controls, and provides continued enhancements to IT solutions enabling program delivery. Specifically, 2017 IT investments will: improve IT internal controls including governance, requirements management, performance management, and IT security controls; allow continued IT improvements to support current and updated business needs in response to legislative, regulatory, policy, and business function changes; and support IT solutions of having FSA offices as a bridge or connector to opportunities (Bridges-to-Opportunity) to assist customers looking for information of a full continuum of available resources provided by USDA agencies, other units of Federal, state and local governments, and not-for-profit partners.

26 FARM AND FOREIGN AGRICULTURAL SERVICES
RISK MANAGEMENT AGENCY (RMA)
2015 2016 2017Enacted Estimate Budget
$75 $75 $67
(6) (8) (9)(0) (0) (20)81 83 96
1,413 1,351 1,35253 48 471 20 0
8,678 8,867 10,1301,105 1,012 1,157
4 4 411,254 11,302 12,690-3,487 -3,444 -3,8567,767 7,858 8,8347,848 7,941 8,930
0 0 -1,259$7,848 $7,941 $7,671
a/ b/
c/
d/
The amount of premium subsidy paid by the Federal government is not reflected in the table above. The Budget for the Federal Crop Insurance Program assumes a crop year loss ratio (gross indemnities/total premium) of 1.0 for 2017. However, the fiscal year loss ratio could be higher or lower than 1.0 due to differences in the timing of certain cash flows (see discussion below on estimated indemnities). Payments to private insurance companies. The projected loss ratio for the 2014 crop year is 1.02. The 2017 underwriting gains reflect a projected 1.0 loss ratio for the 2015 crop year.
The 2017 Budget includes two proposals for program changes to crop insurance. See details in Appendix.
Total, RMA Current Law...............................................................Proposed Legislation d/...............................................................
Total............................................................................................. Reimbursements to private companies.
Subtotal, Crop Insurance Program Level...................................Less: Producer Premium and Administration Fees..................
RMA Salaries and Expenses Appropriations.................................
Mandatory:Delivery and Other Administrative Expenses a/............................Federal Crop Insurance Act (FCIA) Initiatives.............................Programs Related IT...................................................................
Reimbursements From CAT Fees.............................................Total, RMA S&E..................................................................
Mandatory Transfers:Federal Crop Insurance Act (FCIA) Initiatives..........................
Total Mandatory............................................................................
SUMMARY OF GOVERNMENT COSTS:Discretionary:
Risk Management Agency (RMA)Program Level
(Dollars in Millions)
Program
Gross Indemnities b/....................................................................Underwriting Gains c/.................................................................Farm Bill: Agricultural Management Assistance...........................
Discretionary Funding – Salaries and Expenses – Discretionary funds for the Federal crop insurance programs cover most of Federal salaries and related expenses to manage the program. The 2017 Budget includes about $67 million in direct discretionary appropriations for these costs. In addition, Section 11021 of the Agricultural Act of 2014 mandated the transfer of up to $9 million each fiscal year from the FCIC mandatory account to the RMA S&E account for program compliance and integrity reviews. Further, the discretionary appropriation would allow the transfer of up to $20 million in CAT fees into the RMA S&E account as authorized by the Federal Crop Insurance Act.
Mandatory Funding – The Federal crop insurance program provides an important safety net that protects producers from a wide range of risks caused by natural disasters, as well as the risk

FARM AND FOREIGN AGRICULTURAL SERVICES 27
of price fluctuations. Currently, about 80 percent of risk protection is provided by “revenue insurance,” which protects against losses due to low yields, low prices, or a combination of low yields and prices.
Participation in the Federal crop insurance programs by producers is voluntary and is encouraged through premium subsidies. However, the 2014 Farm Bill expanded coverage, and RMA implemented several new 2014 Farm Bill provisions in 2015, with expansion to include additional crops and counties for 2016. For example, in 2015 RMA implemented Supplemental Coverage Option (SCO) for major crops and Stacked Income Protection Program (STAX) for upland cotton in selected counties, with additional crops (SCO) and counties (SCO and STAX) available for 2016. RMA also implemented the Actual Production History Yield Exclusion Option, the Whole Farm Revenue Protection, and a new margin insurance option. RMA further modified the Whole Farm policy and Yield Exclusion option to better meet the needs of fruit and vegetable growers. RMA published regulations to better accommodate submissions of policies or plans of insurance geared toward underserved areas or producers.
RMA continued its efforts to make sure that all producers were aware of the 2014 Farm Bill’s requirement to be in compliance with conservation requirements for highly erodible lands or wetlands in order to receive premium subsidy. Through phone calls, mailings, informational sessions, and training sessions, RMA was subsequently able to report that over 98 percent of producers successfully certified conservation compliance by the June 1, 2015, deadline.
Federal crop insurance is delivered to producers through private insurance companies that share in the risk of loss and opportunity for gain. The companies are reimbursed for their delivery expenses and receive underwriting gains in years of favorable loss experience. The costs associated with the Federal crop insurance programs include premium subsidies, indemnity payments (in excess of producer paid premiums), underwriting gains paid to private companies, reimbursements to private companies for delivery expenses and other authorized expenditures.
The performance of the Federal crop insurance program is tracked on a crop year basis, which spans multiple fiscal years. As a result, the table above reflects certain assumptions about which fiscal year the costs or revenues fall. However, aggregate crop insurance data is available to the public on a crop year basis, which is generally defined as the year in which a crop is harvested.
A key performance measure for the Federal crop insurance program is the normalized value of risk protection provided by Federal Crop Insurance Corporation (FCIC) sponsored insurance – shown in the table below on a crop year basis. The value of FCIC risk protection is the actual dollar insurance liability for a given crop year. However, this value is strongly influenced by commodity price swings or trends. The normalized value of risk protection uses a five-year baseline to smooth variations caused by these trends. The baseline model uses the most recent crop insurance data, together with other USDA data on market conditions, to develop normalized value projections for major crops.
For the 2015 crop year, the Federal crop insurance programs provided about $100 billion in risk protection or about $68.7 billion in (normalized) risk protection. The 2016 and 2017 crop year targets reflect projections from the baseline model as described above.

28 FARM AND FOREIGN AGRICULTURAL SERVICES
Key Performance Measures Actual Target
2012 2013 2014 2015 2016 2017 Value of FCIC risk protection coverage provided through FCIC sponsored insurance ($ Billions) $116.2 $122.8 $109.5 $100.3 $100.3 $92.2
Normalized value of FCIC risk protection coverage provided through FCIC sponsored insurance ($ Billions)
$62.1 $66.0
$67.9 $68.7 $63.4 $63.7
Actual indemnities for fiscal year 2015 reflect crop year 2014 losses that were paid out in fiscal year 2015, plus the portion of crop year 2015 losses paid out in fiscal year 2015. As of December 31, 2015, the overall loss ratio for crop year 2015 is expected to be about 0.75. Estimated losses for crop years 2016 and 2017 reflect the statutory target loss ratio of 1.0.
In 2015, the total cost for the Federal crop insurance programs was about $7.9 billion (as shown in the RMA Program Level/Summary of Government Costs table above). Of this amount, about $5.2 billion was for net indemnities to producers (gross indemnities minus producer paid premiums/fees). A total of $1.4 billion was paid to the private insurance companies for delivery expenses and $1.1 billion for underwriting gains, and $52 million was used for other initiatives, including Federal Crop Insurance Act initiatives, programs related IT, and Agricultural Management Assistance.
The 2017 Budget re-proposes legislative changes to the Federal crop insurance program proposed in the 2016 budget request. These proposals include reducing premium subsidies to farmers for policies providing revenue protection with harvest price coverage and reforming prevented planting coverage.

FARM AND FOREIGN AGRICULTURAL SERVICES 29
FOREIGN AGRICULTURAL SERVICE (FAS)
2015 2016 2017Enacted Estimate Budget
$182 $192 $197(6) (6) (6)
(188) (198) (203)
192 202 1820 0 15
1,466 1,716 1,350
3 3 0
(7) (7) (9)1,843 2,113 1,744
1 3 3
138 136 175b/ b/ b/
186 188 2029 9 10
30 32 358 8 9
32 46 46265 283 302404 422 480
$2,247 $2,535 $2,224
a/b/ Assets of the Trust can be released any time the Administrator of the U.S. Agency for International Development
determines that P.L. 480 Title II funding for emergency needs is inadequate to meet those needs in any fiscal year.
In 2016 and 2017, $5 million can be used for local and regional procurement.
Total, Mandatory Programs............................................................Total, Foreign Agricultural Service...............................................
Market Access Program..........................................................Emerging Markets Program .....................................................Foreign Market Development (Cooperator) Program..................Technical Assistance for Specialty Crops Program....................Agricultural Wool/Pima Agriculture Cotton Trust Funds.............
Total, Farm Bill Market Development Programs...........................
Food for Progress - CCC Funded..............................................Bill Emerson Humanitarian Trust..............................................
Commodity Credit Corporation Export Credit Program Account:
Farm Bill Market Development Programs:
Transfer to FSA and FAS Salaries and Expenses.......................Total, Discretionary Programs........................................................Mandatory:
Quality Samples Program............................................................Foreign Food Assistance:
Budget Authority(Dollars in Millions)
Discretionary:FAS Salaries and Expenses:
Salaries and Expenses (Direct Appropriation)............................
Program
Transfer from CCC Export Credit Program Account.................Total, FAS Salaries and Expenses..........................................
Foreign Food Assistance:McGovern-Dole International Food for Education Program a/.....Local and Regional Food Aid Program......................................P.L. 480 Title II Donations.......................................................
P.L. 480 Title I Program Account:Transfer to Farm Service Agency Salaries and Expenses...........
Agricultural exports make a critical contribution to the prosperity of local and regional economies across rural America through increased sales and higher commodity prices. Every $1 billion worth of agricultural exports supports an estimated 7,550 jobs and $1.27 billion in economic activity. Because of this important role, the Department is working to reduce trade barriers and develop new markets throughout the world.
FAS administers a variety of programs that are designed to facilitate access to international markets and thereby help to support a competitive U.S. agricultural system. FAS also carries out activities that promote productive agricultural systems in developing countries and contribute to

30 FARM AND FOREIGN AGRICULTURAL SERVICES
increased trade and enhanced global food security. Working bilaterally and with international organizations, FAS encourages the development of transparent and science-based regulatory systems that allow for the safe development and use of agricultural goods derived from new technologies.
FAS works with other USDA agencies, the Office of the United States Trade Representative, and others in the Federal government to monitor and negotiate new trade agreements and enforce existing trade agreements. The United States has free trade agreements (FTA) with 20 countries around the world that expand export opportunities for U.S. food and agricultural producers.
FAS assisted with the recently concluded negotiations on the Trans-Pacific Partnership (TPP). In addition to the United States, the current TPP partner countries are Australia, Brunei Darussalam, Canada, Chile, Japan, Malaysia, Mexico, New Zealand, Peru, Singapore, and Vietnam. These countries account for up to 42 percent of all U.S. agricultural exports. The agreement will create new opportunities for trade in a dynamic region where populations and purchasing power are increasing, enhancing the demand for American agricultural exports.
The European Union is currently our fourth largest agricultural export market with U.S. exports valued at $12.3 billion in 2015. The Administration has agreed with its European counterparts to launch comprehensive trade negotiations to establish a Transatlantic Trade and Investment Partnership (TTIP). The next round of negotiations is scheduled for February 2016. TPP and TTIP will expand trade to drive higher commodity prices, additional farm income, and agribusiness jobs that ultimately generate more cash flow in rural economies.
PL BA PL BA PL BAGSM-102 Guarantees.............................................. $5,400 0 $5,400 0 $5,000 0Facilities Financing Guarantees................................. 100 0 100 0 500 0
Total, CCC Export Credit...................................... $5,500 0 $5,500 0 $5,500 0
Program
CCC Export Credit ProgramsProgram Level (PL) and Budget Authority (BA)
(Dollars in Millions)
2015 2016 2017Enacted Estimate Budget
CCC Export Credit Guarantee Programs – The CCC export credit guarantee programs, administered by FAS in conjunction with FSA, provide payment guarantees for the commercial financing of U.S. agricultural exports. These programs facilitate exports to buyers in countries where credit is necessary to maintain or increase U.S. sales.
The Budget includes an overall program level of $5.5 billion for CCC export credit guarantees in 2017. This estimate reflects the level of sales expected to be registered under the export credit guarantee programs. However, the actual level of programming could vary from this estimate, depending upon program demand, market conditions, and other relevant factors during the course of the year. Of the total program level for export credit guarantees expected to be issued by CCC in 2017, $5.5 billion will be made available under the GSM-102 program, which provides guarantees on commercial export credit extended with short-term repayment terms (18 months).

FARM AND FOREIGN AGRICULTURAL SERVICES 31
The Budget also includes an estimated program level of $500 million for facility financing guarantees in 2017. Under this activity, CCC provides guarantees to facilitate the financing of goods and services exported from the United States to improve or establish agriculture-related facilities in emerging markets. By supporting such facilities, these guarantees enhance sales of U.S. agricultural products to countries where demand is constricted due to inadequate storage, processing, or handling capabilities.
Quality Samples Program (QSP) – Under QSP, CCC provides funding to assist private entities to furnish samples of U.S. agricultural products to foreign importers in order to overcome trade and marketing obstacles. The program, which is carried out under the authority of the CCC Charter Act, provides foreign importers with a better understanding and appreciation of the characteristics of U.S. agricultural products. The Budget includes $2.5 million of funding for QSP in 2017.
Market Development Programs – FAS administers a number of programs, in partnership with private sector cooperator organizations, which support the development, maintenance, and expansion of commercial export markets for U.S. agricultural commodities and products. In 2015, almost 1,000 U.S. companies and organizations participated in 21 USDA endorsed trade shows in 16 countries. On-site sales totaled an estimated $421 million and the total value of agricultural exports resulting from participation in foreign food and agricultural trade shows in 2015 was $1.52 billion.
Market Access Program (MAP) – Under MAP, CCC funds are used to reimburse participating organizations for a portion of the cost of carrying out overseas marketing and promotional activities, such as consumer promotions. MAP participants include nonprofit agricultural trade organizations, State-regional trade groups, cooperatives, and private companies that qualify as small businesses. MAP has a brand promotion component that provides export promotion funding to small companies and thereby helps expand the number of small and medium-sized entities that export. For 2017, the Budget provides a $200 million program level for MAP.
Emerging Markets Program (EMP) – EMP authorizes CCC funding to be made available to carry out technical assistance activities that promote the export of U.S. agricultural products and address technical barriers to trade in emerging markets. Many types of technical assistance activities are eligible for funding, including feasibility studies, market research, industry sector assessments, specialized training, and business workshops. The 2017 Budget provides a $10 million program level for EMP.
Foreign Market Development (Cooperator) Program – This program provides cost-share assistance to nonprofit commodity and agricultural trade associations to support overseas market development activities that are designed to remove long-term impediments to increased U.S. trade. These activities include technical assistance, trade servicing, and market research. Unlike MAP, Cooperator Program activities are carried out on a generic commodity basis and do not include brand-name or consumer promotions. The CCC baseline provides a $34.5 million program level for the Cooperator Program.
Technical Assistance for Specialty Crops (TASC) Program – TASC is designed to address unique barriers that prohibit or threaten the export of U.S. specialty crops. Under the program, grants are provided to assist U.S. organizations in activities designed to overcome sanitary, phytosanitary, or technical barriers to trade. The CCC baseline provides a $9 million program level for TASC.

32 FARM AND FOREIGN AGRICULTURAL SERVICES
Foreign Food Assistance – USDA is a key member of the whole of government effort under the Feed the Future Initiative and supports global food security through in-country capacity building, basic and applied research, support for improved market information, statistics and analysis, as well as food assistance. FAS contributes to these efforts by carrying out a variety of food aid programs which support economic growth and development in recipient countries.
McGovern-Dole International Food for Education and Child Nutrition Program – The program provides for the donation of U.S. agricultural commodities and associated financial and technical assistance to carry out preschool and school feeding programs in foreign countries. Maternal, infant, and child nutrition programs also are authorized under the program. Its purpose is to reduce the incidence of hunger and malnutrition and improve literacy and primary education. These measures contribute to a healthy, literate workforce that can support a more prosperous, sustainable economy and ensure long-term food security. The 2017 Budget proposes $182 million for the McGovern-Dole program. With this funding, the program is expected to support assistance to 3.4 million individuals in food insecure countries in 2017. As in 2016, $5 million of McGovern-Dole funding will be used for Local and Regional Food Aid Procurement in 2017.
Local and Regional Food Aid Procurement – The 2014 Farm Bill authorized the Local and Regional Food Aid Procurement (LRP) program to provide for local and regional procurement of food aid commodities for distribution overseas to complement existing food aid programs and to fill in nutritional gaps for targeted populations or food availability gaps generated by unexpected emergencies. Under the program, grants are provided to private voluntary organizations, cooperatives, and the World Food Program that undertake the procurement activities. The 2017 Budget proposes $15 million to support the program with an additional $5 million from McGovern-Dole funding, the total of which is expected to be used within development projects that support 68,000 individuals in food insecure countries. Independent evaluation of LRP pilot projects authorized in the 2008 Farm Bill demonstrated that locally procured food assistance in emergency situations can provide cost savings and speed delivery time to needy populations. The program will serve as a complementary tool to support existing food aid programs, especially for the McGovern-Dole International Food for Education and Child Nutrition Program.
Food for Peace (P.L. 480) – Assistance provided under the authority of P.L. 480 is a primary means by which the United States provides foreign food assistance.
• Title I provides for sales of U.S. agricultural commodities governments and private entities of developing countries through concessional financing agreements, and donations through Food for Progress grant agreements.
• Title II provides emergency and development food assistance in foreign countries. The 2017 Budget includes $1.35 billion for P.L. 480 Title II.
Food for Peace (P.L. 480) Title II – The 2017 P.L. 480 Title II request of $1.35 billion includes funding for development of food assistance programs, complemented by resources requested in the Development Assistance (DA) account under USAID’s Community Development Fund. Together, these resources support development food assistance programs’ efforts to address chronic food insecurity in areas of recurrent crises using a multi-sectoral approach to reduce poverty and build resilience.

FARM AND FOREIGN AGRICULTURAL SERVICES 33
The majority of the FY 2017 Title II request provides emergency food assistance in response to natural disasters and complex emergencies. The request allows the use of up to 25 percent of the appropriation, valued at $337.5 million, for market-based food assistance for emergencies including interventions such as local or regional procurement of food near emergencies, food vouchers or cash transfers. This flexibility makes emergency food aid more timely and cost effective, improving program efficiencies and performance and allowing USAID to assist about two million more emergency beneficiaries annually with the same level of resources.
Food for Progress – The Food for Progress Act of 1985 authorizes U.S. agricultural commodities to be provided to developing countries and emerging democracies that have made commitments to introduce and expand free enterprise in their agricultural economies. Food for Progress agreements can be entered into with foreign governments, private voluntary organizations, nonprofit agricultural organizations, cooperatives, or intergovernmental organizations. Agreements currently provide for the commodities to be supplied on grant terms.
The Food for Progress authorizing statute provides for the use of CCC funding for commodity procurement, transportation, and associated non-commodity costs for the program. The 2017 Budget assumes that $174 million of CCC funding will be used to support the Food for Progress program, which is expected to support approximately 263,000 metric tons of commodity assistance.
Bill Emerson Humanitarian Trust – The Bill Emerson Humanitarian Trust (the Trust) is a commodity and/or monetary reserve designed to ensure that the United States can meet its international food assistance commitments under P.L. 480 Title II. The Trust’s assets can be released any time the Administrator of USAID determines that P.L. 480 Title II funding for emergency needs is inadequate to meet those needs in any fiscal year. When a release from the Trust is authorized, the Trust’s assets (whether commodities or funds) cover all commodity costs associated with the release. All non-commodity costs, including ocean freight charges; internal transportation, storage, and handling overseas; and certain administrative costs are paid for by CCC.
No assistance has been provided using the Trust’s authority in 2015 or to date in 2016. As of December 31, 2015, the Trust held $261 million of cash and no commodities. In 2016, $20 million was appropriated to reimburse CCC for the release of eligible commodities from the Bill Emerson Humanitarian Trust.
Trust Funds – The 2014 Farm Bill authorized two trust funds for payments to reduce injury to domestic manufacturers resulting from U.S. tariffs on inputs to their manufacturing processes. These include the Agricultural Wool Apparel Manufacturers Trust Fund, which provides CCC funding for up to $30 million that will be used to reduce injury to domestic manufacturers resulting from tariffs on wool fabric that are higher than tariffs on certain apparel articles made of wool fabric, and the Pima Agriculture Cotton Trust Fund, which provides CCC funding of $16 million that will be used to reduce injury to domestic manufacturers resulting from tariffs on cotton fabric that are higher than tariffs on certain apparel articles made of cotton fabric. Payments will be made to manufacturers that submit an affidavit certifying that U.S. tariffs caused them injury.

34 FARM AND FOREIGN AGRICULTURAL SERVICES
2015 2016 2017Enacted Estimate Budget
Trade Policy.................................................................................. $77 $81 $83Trade Promotion............................................................................ 65 69 71Capacity Building / Food Security ................................................... 40 42 43
Total, Appropriated Programs...................................................... 182 192 197Reimbursable Program Activities:
FAS Computer Facility and Other IRM Costs Funded by CCC....... 22 24 24USAID and Dept. of State Assistance and
Reconstruction and Stabilization................................................. 112 112 112Other Reimbursable Agreements.................................................. 31 32 32
Total, Reimbursable Program Activities..................................... 125 129 129Total, FAS Salaries and Expenses................................................... $307 $321 $326
Salaries and Expenses(Dollars in Millions)
Program
FAS headquarters staff and attaches covering more than 170 countries partner with other U.S. government agencies, trade associations, as well as regional and international organizations in a coordinated effort to negotiate trade agreements; establish transparent, science-based standards; and resolve trade barriers.
Unnecessarily restrictive regulations to address risks to human, animal, and plant health (SPS) are major barriers to the expansion of global agricultural trade. The proliferation of labeling, registration, certification, and quality standards requirements for routinely consumed food products can also result in unnecessary technical barriers to trade (TBT). World Trade Organization (WTO) members are obligated to notify fellow members of changes in SPS, and TBT related measures that may affect trade via the WTO committees on Agriculture, SPS and TBT. FAS reviews notifications to assess their potential impact on trade and challenges measures that are unnecessarily trade restrictive. Since 2009, FAS has helped challenge 2,098 barriers to the export of U.S. agricultural products through this process, helping to spur record exports. Working in concert with other U.S. trade and regulatory agencies and in frequent communication with private sector stakeholders, FAS works to improve market access for U.S. agricultural products and reduce the harm to the industry resulting from unnecessarily restrictive regulations by monitoring and enforcing international rules, strengthening the global regulatory framework, and encouraging the adoption of international standards.
FAS promotes organic standards and supports trade in U.S. agricultural products produced with new technologies by monitoring worldwide developments in technologies, including their adoption and regulation by trading partners, and promoting the use of new technologies in support of food security and sustainable agriculture. A proactive stance is critical, because the development of divergent regulatory systems for new technologies could bring a virtual halt to trade in some commodities with a potential trade impact reaching billions of dollars.

FARM AND FOREIGN AGRICULTURAL SERVICES 35
Key Performance Measure Actual Target
2012 2013 2014 2015 2016 2017
Value of agricultural exports resulting from participation in foreign food and agricultural trade shows ($ Billions)
$1.46
$1.48
$1.50
$1.52
$1.55
$1.56
Value of trade preserved through resolution of foreign market access issues such as U.S. export detainment, restrictive SPS and TBT issues, and trade regulations ($ Billions)
3.7
3.8
6.4
3.6
4.1
4.1
In 2017, FAS will conduct its activities and programs through offices in Washington, D.C. and at 94 overseas locations, including Cuba. The overseas offices represent and advocate for U.S. agricultural interests; provide reporting on agricultural policies, production, and trade for more than 170 countries; assist U.S. exporters, trade groups, and State export marketing officials in their trade promotion efforts; and help to implement technical assistance and trade capacity building programs that contribute to increased food security. The Budget provides an appropriated funding level of $197 million for FAS activities in 2017, including increased funding for International Cooperative Administrative Support Services, opening an overseas post in Cuba, and pay costs, including for locally employed staff.
Agriculture will play an important role as the U.S. and Cuba expand relations, acting as a bridge that can foster cooperation, understanding, and the exchange of ideas. USDA needs an in-country presence in Cuba to cultivate key relationships, gain firsthand knowledge of the country’s agricultural challenges and opportunities, and develop programs of mutual benefit to both countries.
In addition, the Budget assumes an estimated $168 million in funding to be made available to FAS through reimbursable agreements. The largest components of this are funding for technical assistance, training, and research activities that FAS carries out overseas on behalf of USAID, foreign governments, and international organizations, and development assistance activities that are funded by USAID and the Department of State. Although funded by other agencies, these activities are an important component of the Department’s efforts to support economic development and enhance food security in developing countries.

36 RURAL DEVELOPMENT
MISSION AND RELATIONSHIP TO STRATEGIC GOALS All across Rural America, families and communities are experiencing challenges everyday related to unemployment and poverty. Rural areas continue to lag urban areas in employment while the rural poverty rate in 2015 was 18.1 percent compared to 15.1 percent for urban areas. In addition, rural communities are less likely to have quality healthcare facilities and less access to high speed broadband than in urban areas. One result of these factors is that rural America has started to see an overall decline in population levels for the first time in history. As outmigration has outpaced the natural growth rate, nearly 300 rural counties have lost population in recent years. Together, these factors present a critical challenge that USDA has a role in addressing.
All of the funding for USDA’s Rural Development (RD) programs contributes to the Strategic Goal of assisting rural communities to create prosperity by providing financial and technical assistance to rural residents, businesses, and private and public entities for a broad range of purposes that bring prosperity and better living to Rural America. These programs are grouped within three agencies: (1) the Rural Business-Cooperative Service (RBS), which provides assistance for the development of business and industry, including small businesses, and renewable energy and energy improvement projects; (2) the Rural Utilities Service (RUS), which provides assistance for water and waste disposal, rural electric and telecommunications, including broadband access; and (3) the Rural Housing Service (RHS), which provides assistance for home ownership, multi-family housing, and essential community facilities such as health and public safety infrastructure. RD delivers its programs through a network of approximately 400 area offices and 47 State offices, a centralized servicing center and finance office in St. Louis, Missouri, and a national office in Washington, D.C.
The type of assistance offered includes direct and guaranteed loans, grants, technical assistance, and other payments. Some programs provide assistance to intermediaries that make loans or provide technical assistance to the ultimate beneficiaries. Several programs require or encourage recipients to contribute their own resources or obtain third-party financing to support the total cost of projects, thereby leveraging Government support with private sector financing.
Since 2009, USDA has helped more than 1.1 million rural families buy or refinance a home, invested in more than 7,500 critical community facilities, such as hospitals and community centers, and provided nearly 24,000 grants and loans to help approximately 112,000 small rural businesses create and/or save nearly 450,000 jobs. As a leading advocate for rural America, USDA is at the forefront of developing the technology and tools necessary to transform rural America to take advantage of new opportunities. The Department has also sought new opportunities to increase investments in rural communities and infrastructure. Through the StrikeForce initiative, USDA’s field-based agencies, including Rural Development, are focusing critical financial and technical assistance in areas of persistent poverty. In addition, as a result of the Rural Opportunity Investment initiative, the Department is seeking partnerships where private sector funding can be accessed to increase overall investments in rural America.
The subsidy cost of programs that provide direct or guaranteed loans depends upon a number of factors, including default rates, the prevailing interest rates, whether the interest rate is subsidized by the Government, and whether there are fees. Coupled with the subsidy cost, the loan programs all have an administrative cost component as well. In the tables, the budget authority for each program reflects the subsidy cost to the Government to support the loan level. Several of the loan programs operate at a very low or negative subsidy rate. These less costly loan programs provide the bulk of the financial assistance in RD’s loan portfolio.
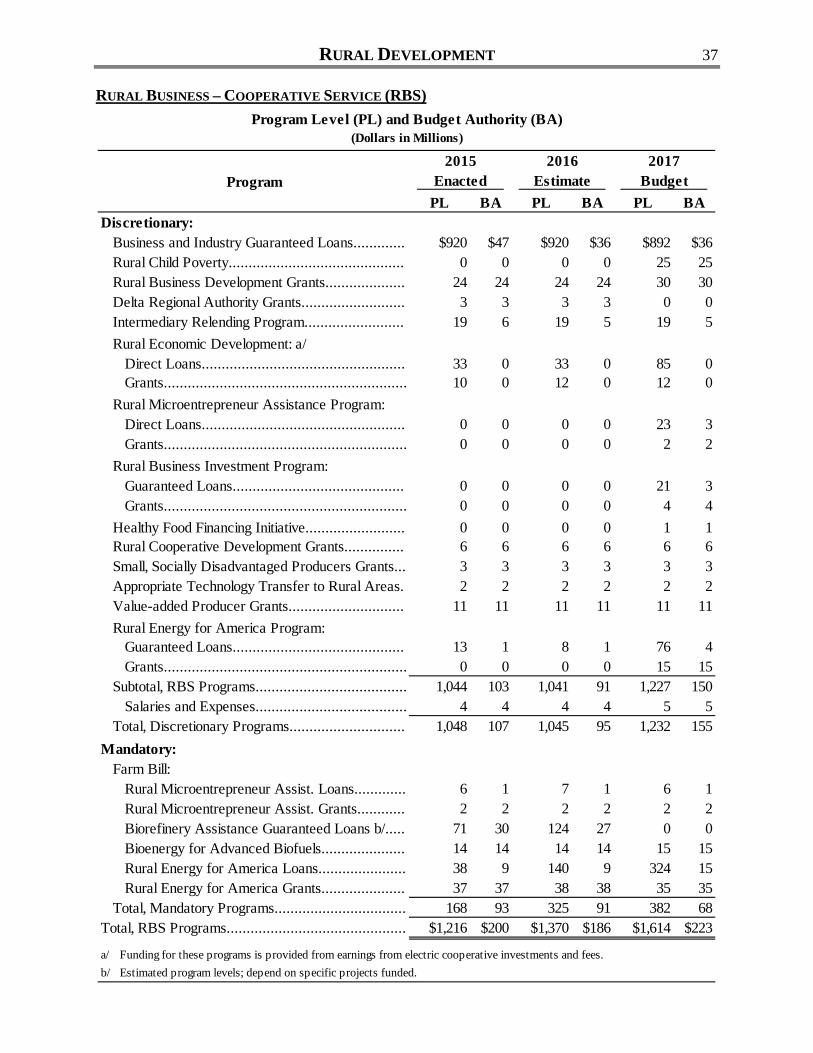
RURAL DEVELOPMENT 37
RURAL BUSINESS – COOPERATIVE SERVICE (RBS)
PL BA PL BA PL BA
$920 $47 $920 $36 $892 $360 0 0 0 25 25
24 24 24 24 30 303 3 3 3 0 0
19 6 19 5 19 5
33 0 33 0 85 010 0 12 0 12 0
0 0 0 0 23 30 0 0 0 2 2
0 0 0 0 21 30 0 0 0 4 40 0 0 0 1 16 6 6 6 6 63 3 3 3 3 32 2 2 2 2 2
11 11 11 11 11 11
13 1 8 1 76 40 0 0 0 15 15
1,044 103 1,041 91 1,227 1504 4 4 4 5 5
1,048 107 1,045 95 1,232 155
6 1 7 1 6 12 2 2 2 2 2
71 30 124 27 0 014 14 14 14 15 1538 9 140 9 324 1537 37 38 38 35 35
168 93 325 91 382 68$1,216 $200 $1,370 $186 $1,614 $223
a/b/
2015 2016 2017Enacted Estimate Budget
Delta Regional Authority Grants..........................Intermediary Relending Program.........................Rural Economic Development: a/
Discretionary:Business and Industry Guaranteed Loans.............Rural Child Poverty............................................Rural Business Development Grants....................
Rural Cooperative Development Grants...............Small, Socially Disadvantaged Producers Grants...Appropriate Technology Transfer to Rural Areas.
Direct Loans...................................................Grants.............................................................
Rural Microentrepreneur Assistance Program:Direct Loans...................................................Grants.............................................................
Rural Business Investment Program:
Biorefinery Assistance Guaranteed Loans b/.....
Salaries and Expenses......................................Total, Discretionary Programs.............................
Program
Program Level (PL) and Budget Authority (BA)(Dollars in Millions)
Value-added Producer Grants.............................Rural Energy for America Program:
Guaranteed Loans...........................................Grants.............................................................
Subtotal, RBS Programs......................................
Guaranteed Loans...........................................Grants.............................................................
Healthy Food Financing Initiative.........................
Mandatory:Farm Bill:
Rural Microentrepreneur Assist. Loans.............Rural Microentrepreneur Assist. Grants............
Funding for these programs is provided from earnings from electric cooperative investments and fees.Estimated program levels; depend on specific projects funded.
Bioenergy for Advanced Biofuels.....................Rural Energy for America Loans......................Rural Energy for America Grants.....................
Total, Mandatory Programs.................................Total, RBS Programs.............................................

38 RURAL DEVELOPMENT
Nearly 85 percent of America’s persistent poverty counties are in rural areas. Furthermore, this extreme level of poverty has disproportionately affected the youth in rural America where over 25 percent of young people live below the poverty line compared to 21 percent in urban areas. To address the economic and job factors behind these figures, RBS administers RD’s rural business and cooperative services programs. The primary purpose of these programs is to promote economic development in rural areas. The 2017 Budget provides funding to support increased technical assistance and community-based support systems aimed at alleviating poverty and increasing access to healthy foods across rural America. In addition, RBS, through the Rural Opportunity Investment initiative, has been working with industry stakeholders and private financial institutions to develop an increased focus on public private partnerships with lenders to support increased access to capital in rural areas. The 2017 Budget also provides funding to support increased capitalization of rural industries and to help diversify the rural economy through sectors such as local and regional food and bioenergy.
As described below, RD offers a range of loan and grant programs to assist rural businesses and communities create economic opportunity. Since 2009, USDA’s partnership with America’s rural communities has supported the emergence of a more vibrant, diverse rural economy led by makers, creators, and innovators. During that time, RD has helped over 112,000 businesses grow through grant and loan support, resulting in the creation or retention of nearly 450,000 jobs.
Business and Industry Guaranteed Loan Program – The Business and Industry (B&I) Guaranteed Loan Program, with the largest program level of the RBS programs, provides protection against loan losses so that lenders are willing to extend credit to establish, expand, or modernize rural businesses. The B&I program is particularly important for startup businesses like local and regional food producers where commercial lenders are new to the sector. The 2017 Budget supports a program level of $892 million in B&I loan guarantees. The total level of B&I funding will create or save 11,674 jobs. Funding for the B&I program will focus on supporting high priority areas of the Administration such as providing start-up capital and financing business expansion in rural areas for local and regional food systems, biobased businesses, and renewable energy development.
Rural Child Poverty Program – Rural childhood poverty rates are at their highest point since 1986. One in four rural children live in poverty, while overall rural poverty exceeded 18 percent compared with 15 percent in urban areas. The Budget includes $25 million to support a demonstration Rural Child Poverty program to address this significant issue. Funding will be provided through grants to rural communities to implement two generation strategies that seek to combine intensive, high-quality, adult-focused services with intensive, high-quality, child-focused programs. In addition, the funding will support the development of shared IT innovations that integrate multi-generational service delivery with States, municipalities, and Tribes. This effort to mitigate child poverty is in conjunction with other Federal agency resources targeted at reducing child poverty through the coordination of the White House Rural Council.
Rural Business Development Grant Program (RBDG) – RBDG program includes $30 million to support grants for training, technical assistance, and funding construction, land development, equipment, and capitalization of revolving loan funds to support business startups and working capital needs in rural areas. The 2014 Farm Bill consolidated the authorities of the Rural Business Enterprise Grant Program and the Rural Business Opportunity Grant Program. The proposed level of funding will create or save 8,325 jobs and assist 4,150 businesses.
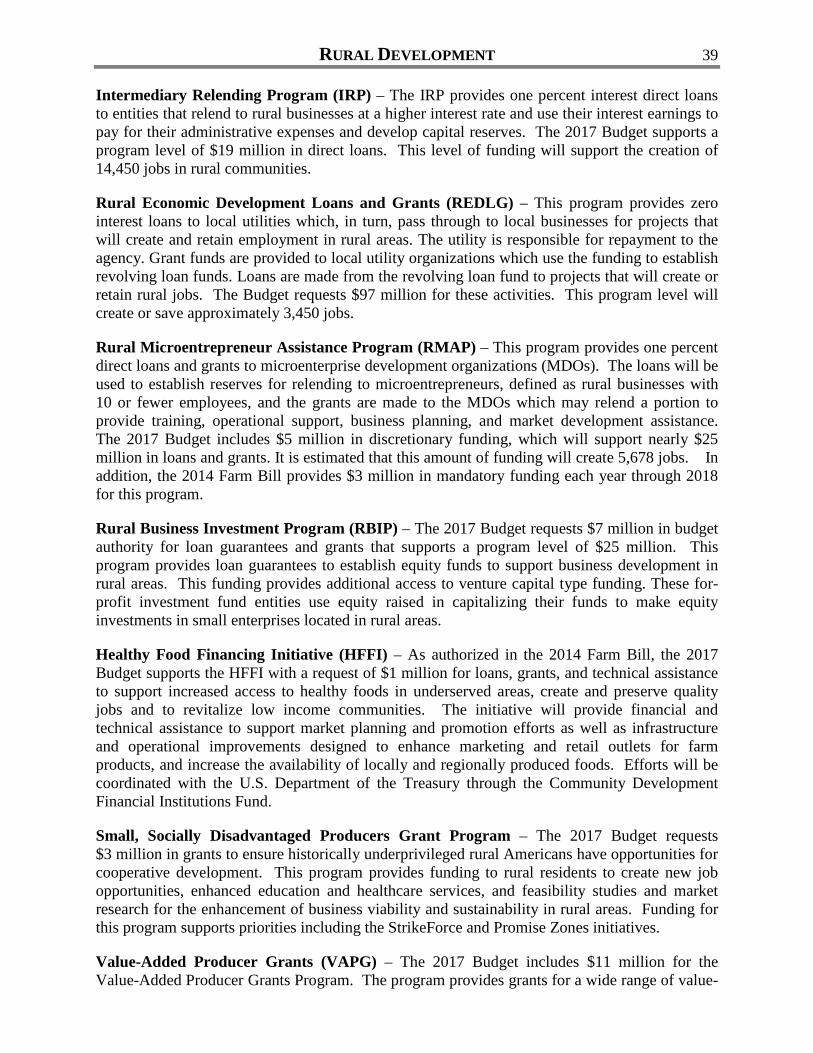
RURAL DEVELOPMENT 39
Intermediary Relending Program (IRP) – The IRP provides one percent interest direct loans to entities that relend to rural businesses at a higher interest rate and use their interest earnings to pay for their administrative expenses and develop capital reserves. The 2017 Budget supports a program level of $19 million in direct loans. This level of funding will support the creation of 14,450 jobs in rural communities.
Rural Economic Development Loans and Grants (REDLG) – This program provides zero interest loans to local utilities which, in turn, pass through to local businesses for projects that will create and retain employment in rural areas. The utility is responsible for repayment to the agency. Grant funds are provided to local utility organizations which use the funding to establish revolving loan funds. Loans are made from the revolving loan fund to projects that will create or retain rural jobs. The Budget requests $97 million for these activities. This program level will create or save approximately 3,450 jobs.
Rural Microentrepreneur Assistance Program (RMAP) – This program provides one percent direct loans and grants to microenterprise development organizations (MDOs). The loans will be used to establish reserves for relending to microentrepreneurs, defined as rural businesses with 10 or fewer employees, and the grants are made to the MDOs which may relend a portion to provide training, operational support, business planning, and market development assistance. The 2017 Budget includes $5 million in discretionary funding, which will support nearly $25 million in loans and grants. It is estimated that this amount of funding will create 5,678 jobs. In addition, the 2014 Farm Bill provides $3 million in mandatory funding each year through 2018 for this program.
Rural Business Investment Program (RBIP) – The 2017 Budget requests $7 million in budget authority for loan guarantees and grants that supports a program level of $25 million. This program provides loan guarantees to establish equity funds to support business development in rural areas. This funding provides additional access to venture capital type funding. These for-profit investment fund entities use equity raised in capitalizing their funds to make equity investments in small enterprises located in rural areas.
Healthy Food Financing Initiative (HFFI) – As authorized in the 2014 Farm Bill, the 2017 Budget supports the HFFI with a request of $1 million for loans, grants, and technical assistance to support increased access to healthy foods in underserved areas, create and preserve quality jobs and to revitalize low income communities. The initiative will provide financial and technical assistance to support market planning and promotion efforts as well as infrastructure and operational improvements designed to enhance marketing and retail outlets for farm products, and increase the availability of locally and regionally produced foods. Efforts will be coordinated with the U.S. Department of the Treasury through the Community Development Financial Institutions Fund.
Small, Socially Disadvantaged Producers Grant Program – The 2017 Budget requests $3 million in grants to ensure historically underprivileged rural Americans have opportunities for cooperative development. This program provides funding to rural residents to create new job opportunities, enhanced education and healthcare services, and feasibility studies and market research for the enhancement of business viability and sustainability in rural areas. Funding for this program supports priorities including the StrikeForce and Promise Zones initiatives.
Value-Added Producer Grants (VAPG) – The 2017 Budget includes $11 million for the Value-Added Producer Grants Program. The program provides grants for a wide range of value-

40 RURAL DEVELOPMENT
added projects, such as feasibility studies, promotion, and market expansion for agricultural products. The program is designed to assist the expansion of businesses at all stages of development. The 2014 Farm Bill provided an additional $63 million in mandatory funding that is available until expended.
Rural Energy for America Program (REAP) – The REAP loan guarantee and grant program supports the President’s Climate Action plan by providing financing for the purchase of renewable energy systems, energy efficiency improvements, energy audits and feasibility studies. Implementation of renewable energy and energy efficient technology reduces energy use, improves a farms bottom line and reduces the Nation’s dependence on foreign oil while cutting carbon emissions. The 2017 Budget supports a discretionary program level of $91 million in loan guarantees and grants. In addition, the 2014 Farm Bill provides mandatory funding of $50 million that will support a program level of $359 million in loan guarantees and grants in 2017. Since 2009, USDA REAP investments have resulted in renewable energy generation of 9.4 billion kilowatt hours of renewable energy which is enough to power 820,000 homes annually.
Other Business Programs – The 2017 Budget includes $6 million for the Rural Cooperative Development Grant program and $2 million to support Appropriate Technology Transfer in Rural Area Agreements.
The performance information is based on discretionary funding from the following programs: the Business and Industry Guaranteed Loans, Rural Business Development Grants, Delta Regional Grants, Healthy Food Financing Initiative, Rural Child Poverty, Intermediary Relending, Rural Economic Development Loans and Grants, Rural Microentrepreneur Assistance, and all Cooperative Program Grants.
Key Performance Measure Actual Target
2012 2013 2014 2015 2016 2017 Number of jobs created or saved through USDA financing of businesses
52,468 44,419 41,202 52,697 40,877 55,100

RURAL DEVELOPMENT 41
RURAL UTILITIES SERVICE (RUS)
PL BA PL BA PL BA
$5,000 0 $5,500 0 $6,500 00 0 60 $8 0 0
500 0 750 0 0 0
) )) 690 0 ) 690 a/ 345 $3) ) 345 0
0 0 0 0 b/ 11
22 $22 22 22 35 35
24 5 21 5 0 010 10 10 10 39 3910 10 10 10 0 0
1,200 0 1,200 31 804 3550 a/ 50 a/ 0 0
455 455 481 481 427 4271,705 455 1,731 512 1,231 4627,961 502 8,794 567 8,495 550
35 35 35 35 36 367,996 537 8,829 602 8,531 586
a/
b/
Rural Energy Saving Program .................
2015Enacted
2016Estimate
2017Budget
Program level is not available as subsidy rate for this program has not been determined.
Discretionary:Electric Programs:
Direct Loans...........................................
Guaranteed Loans ..................................Telecommunications Programs:
Direct Loans...........................................Treasury Loans.......................................
Guaranteed Loans...................................
Direct FFB.............................................
Distance Learning and TelemedicinePrograms:
Grants.................................................
Program Level (PL) and Budget Authority (BA)(Dollars in Millions)
Program
Direct Loans...........................................
Grants....................................................Subtotal, Water and Waste...................
Subtotal, RUS programs.............................Salaries and Expenses.............................
Less than $500,000.
Direct Loans - Modifications....................
Total, Discretionary Programs.....................
Broadband Programs:Direct Loans...........................................Grants....................................................
High Energy Costs Grants..........................Water and Waste Disposal Programs:
In many areas of rural America, families and communities lack access to the modern infrastructure, such as high-speed broadband and up-to-date water treatment facilities, that is often taken for granted in more urban and suburban areas. Such lack of access creates tremendous challenges for those people that live and work and businesses that operate in rural communities. Therefore, it is the primary mission of RUS to provide the investments in infrastructure that will enable rural America to thrive. To focus these investments, the Administration has placed a priority on a number of key initiatives, including expansion of broadband access through the Broadband Council and seeking commercial investment to modernize infrastructure projects through increased public-private partnership activities. The Budget includes a number of investments identified below to further expansion of opportunities in rural America.

42 RURAL DEVELOPMENT
Electric and Telecommunications Programs – The Electric and Telecommunications programs administered by RUS provide loans to establish, expand, and modernize vital components of the infrastructure of rural America. They are long-standing programs that brought electric and telecommunication services to rural America and ensured universal service for the Nation. RUS programs leverage private sector investments as well as fill credit gaps that still exist for some rural areas and borrowers. In addition, the programs provide financing of improvements to facilities that RUS financed in the past and still holds a lien. There are a number of ways USDA’s electric program can be used to support energy conservation and efficiency projects. Loans can be made to electric cooperatives that, in turn, offer rebates or provide loans to their customers for energy conservation and efficiency projects. The Rural Economic Development Loan and Grant (REDLG) program is administered by RBS and also provides funding for cooperatives that may support energy conservation and efficiency projects.
To support the President’s Climate Action plan to accelerate the transition to cleaner sources of energy, the 2017 Budget requests $6.5 billion for electric loans. Funds will used to finance the construction, acquisition, or improvement of electric infrastructure including renewable energy, electric transmission, distribution, smart grid technology, energy efficiency, grid resiliency, security enhancements, and to support environmental upgrades to existing fossil fuel electric generation facilities to significantly reduce carbon emissions. USDA is proposing to revise the authority for this program to support renewable generation in rural areas for all customers and for other infrastructure investments supporting various renewable and clean energy goals. RUS will work with the Environmental Protection Agency and State Governments to ensure applications adhere to the State’s Clean Power Plan. Funding can be used to support the transition from fossil fuels to cleaner technologies. Allowing financing for environmental upgrades will support the continued development of a national clean energy strategy.
The electric program performance indicator identifies the number of borrowers/subscribers receiving new and/or improved electric service. The Budget proposes levels of funding that are consistent with demand and focused efforts into supporting broader scale energy efficiency activities. The estimated performance information is based on supporting more distribution loans in 2017. If a greater number of generation and transmission (G&T) loans to upgrade existing facilities are provided, it is likely that the actual performance number will be adjusted upward as G&T projects serve a larger number of recipients.
Key Performance Measure Actual Target
2012 2013 2014 2015 2016 2017 Number of borrowers/subscribers receiving new and/or improved electric facilities (millions) 8.3 8.7 4.6 5.5 5.1 6.0
Telecommunication Loan Program – The 2017 Budget supports $690 million in telecommunications loans, of which $345 million is for direct Treasury Rate loans and $345 million is for guaranteed loans through the Federal Financing Bank (FFB). The Budget requests this split because FFB loans can be used to refinance private sector debt as well as finance new indebtedness. Both types of telecommunication loans are used for the improvement and construction of telecommunication facilities that meet broadband standards. The Budget also includes $11 million for telecommunications modifications that will enable current borrowers to make new investments in broadband infrastructure. This funding will be used to reduce interest rates for current borrowers in exchange for new investments that will improve broadband speeds

RURAL DEVELOPMENT 43
in rural areas, particularly for the last mile, fiber to home projects. While there is little RUS can do to provide certainty on future payments, they could reduce costs for their borrowers by refinancing their high interest rate debt.
Broadband, Distance Learning and Telemedicine – The broadband program provides financing to support new or improved broadband access across rural America. Broadband is fundamental to expanding economic opportunity and job creation in rural America. Improved connectivity means rural communities can offer robust business services, expand access to quality health care, and improve education. The Distance Learning and Telemedicine Grant Program is designed specifically to assist rural communities that would otherwise be without access to learning and medical services over the Internet.
The 2017 Budget includes $39 million for Broadband grants and $35 million for Distance Learning and Telemedicine grants.
The performance indicator displays information for the traditional telecommunications and broadband loan and grant programs.
Key Performance Measure Actual Target
2012 2013 2014 2015 2016 2017 Number of borrowers/subscribers receiving new or improved telecommunication services (thousands) 64 119 84 95 120 100
Water and Waste Disposal Program – The Water and Waste Disposal Program provides financing for rural communities to establish, expand or modernize water treatment and waste disposal facilities. These facilities provide safe drinking water and sanitary waste disposal for residential users, and help communities thrive by attracting new business. Projects are designed to improve the energy efficiency of the water and waste facilities and to improve water conservation efforts.
Financing is available only to those communities with low median household income levels. Priority is given to public entities serving areas with populations less than 5,500 and applying for loans to restore a deteriorating water system or to improve, enlarge or modify an inadequate waste facility. Grants are limited to a maximum of 75 percent of project costs. Program regulations stipulate that the grant amount should only be as much as necessary to bring the user rates down to a reasonable level for the area. Water and Waste Disposal grant and loan funds are usually combined based on the income levels and user costs. However, separate stand-alone grants are provided for solid waste disposal and technical assistance and training.
The 2017 Budget requests $427 million in budget authority for grants and $804 million for direct loan programs and a total of $1.2 billion for water and waste disposal programs.
Key Performance Measure Actual Target
2012 2013 2014 2015 2016 2017 Population receiving new or improved service from agency funded water facility (millions) 2.5 1.8 2.2 2.4 2.2 1.7

44 RURAL DEVELOPMENT
RURAL HOUSING SERVICE (RHS)
PL BA PL BA PL BADiscretionary:
Single Family Housing (Sec. 502):Direct Loans................................................ $900 $66 $900 $61 $900 $61Guaranteed Loans........................................ 24,000 0 24,000 0 24,000 0
Multi Family Housing:Direct Loans (Sec. 515)................................ 28 10 28 8 33 10Guaranteed Loans (Sec. 538)........................ 150 0 150 0 230 0
Very Low-Income Repair (Sec. 504):Direct Loans................................................ 26 4 26 4 26 4Grants......................................................... 29 29 29 29 29 29
Farm Labor Housing Grants (Sec. 516)............. 8 8 8 8 8 8Farm Labor Housing Loans (Sec. 514)............. 24 8 24 7 24 7All Other Direct Loans.................................... 20 0 20 0 20 1Grants and Payments:
Rental Assistance (Sec. 521)........................ 1,089 1,089 1,390 1,390 1,405 1,405Mutual and Self-Help (Sec. 523)................... 28 28 28 28 18 18Multi-Family Housing Revitalization............... 28 17 39 22 34 19Multi-Family Housing Voucher program......... 7 7 15 15 18 18Rural Housing Preservation........................... 3 3 3 3 0 0
Community Facilities Programs:Direct Loans................................................ 2,200 0 2,200 0 2,200 0Guaranteed Loans........................................ 72 3 148 3 0 0Grants......................................................... 27 27 39 39 37 37
Subtotal, RHS Programs.................................. 28,639 1,299 29,047 1,617 28,982 1,617Salaries and Expenses.................................. 415 415 418 418 427 427
Total, Discretionary Programs.......................... $29,054 $1,714 $29,465 $2,035 $29,409 $2,044
Program Level (PL) and Budget Authority (BA)(Dollars in Millions)
2015Enacted
2016Estimate
2017BudgetProgram
Through RHS, USDA offers a variety of programs to build or improve housing and essential community facilities in rural areas. Poverty remains a tremendous challenge in rural America and that challenge is experienced through the housing options available for millions of rural Americans. For example, 47 percent of rural renters are cost burdened, with nearly half of them paying more than 50 percent of their income for housing. It is with that challenge in mind that the Budget presents options to ensure that thousands of rural residents have access to safe, affordable housing.
Single Family Direct and Guaranteed Loan Programs – The Single Family Housing programs provide direct and guaranteed loans to low- and moderate-income families in rural

RURAL DEVELOPMENT 45
areas. RHS is the only Federal agency that provides direct loans for this purpose. Direct loans are limited to families with incomes less than 80 percent of area median income. The interest rate on direct loans is based on the borrower’s income and fluctuates with the current Treasury rate and may be subsidized down to one percent interest. Guaranteed loans are limited to families with incomes less than 115 percent of area median income. The interest rate on guaranteed loans is negotiated between the borrower and the private lender. Both direct and guaranteed loans are means-tested.
The 2017 Budget provides for a $900 million program level for direct loans which are used to specifically support very-low and low-income borrowers. The Budget also maintains the 2016 program level of $24 billion for guaranteed loans. These levels are expected to provide approximately 166,491 homeownership opportunities, a decrease from 2016 which reflects anticipated higher housing prices due to improved economic conditions.
The performance measure below displays the number of homeownership opportunities that Rural Development has provided during the fiscal year.
Key Performance Measure Actual Target
2012 2013 2014 2015 2016 2017 Homeownership opportunities provided 153,027 170,055 146,388 141,314 173,150 166,491
Multi-Family Housing Programs – The Multi-Family Housing program provides financing for rental housing projects and rental assistance payments for the low-income tenants of those projects. The portfolio currently includes about 14,566 projects that provide housing for about 403,000 households, consisting of approximately 674,000 low-income individuals, many of whom are elderly. There are roughly 271,000 households that benefit from rental assistance annually. The average annual income of these households is about $10,554.
The 2017 Budget requests $1.4 billion for rental assistance payments. Most multi-family housing projects that are financed with direct loans receive Rental Assistance Payments. These payments are used to reduce the rents of low income families to no more than 30 percent of their income. These payments are made through contracts with project sponsors. RHS is currently engaged in efforts to retain the availability of affordable housing, thereby protecting low-income tenants and their families. When multi-family direct loans mature, tenants in that property are no longer eligible to benefit from Rental Assistance. Through 2024, direct loans for approximately 11,500 properties will mature, resulting in a significant loss of affordable housing in rural communities that in some cases have no other affordable housing alternatives. Accordingly, the 2017 Budget includes additional budget authority to increase the program level for Section 515 direct loans for multi-family housing from $28 million in 2016 to $33 million in 2017. The Budget also includes language making rental assistance agreements eligible for multi-family housing revitalization funding, simplifying the approval process to carry out a multi-family rental housing loan restructuring program, and other incentives for owners with maturing mortgage properties to preserve affordable rental housing.
In recent years, RHS has also focused on the revitalization of existing projects. The 2017 Budget includes $19 million in budget authority for preservation activities. This funding is expected to be leveraged into a greater amount of assistance based on how it is disbursed between the various strategies available under the Multi-Family Preservation and Revitalization (MPR)

46 RURAL DEVELOPMENT
Demonstration program. In addition, the Budget includes $18 million, an increase of $3 million over 2016, for the multi-family housing voucher program. This program provides vouchers to protect the rents of tenants affected by projects leaving the program. This increase aligns with a proposed change to expand the eligibility of voucher funding to tenants displaced by properties leaving the Section 515 program due to naturally maturing mortgages. Section 538 guaranteed loans for multifamily housing would be funded at $230 million, an increase of $80 million. The Section 538 program currently operates at no subsidy cost; therefore, no budget authority is required to provide funding at this level.
Other Housing Programs – The 2017 Budget funds additional single family housing activities including $26 million for Section 504 housing repair loans and $29 million for Section 504 housing repair grants. In addition, the Budget includes $18 million for mutual and self-help housing grants that will enable critical housing services to be preserved thereby supporting approximately 600 rural families to benefit from the program.
The Budget also includes $5 million in program level for Section 524 site development and $10 million in program level for single family housing credit sales of acquired property, and $5 million for Section 523 land development.
Community Facilities Loan and Grant Programs – RHS also administers the Community Facilities programs that provide funding for a wide range of essential community facilities. Priority is given to health, public safety, and education facilities. The program serves rural communities of up to 20,000 in population.
The 2017 Budget provides funding for Community Facilities programs with $2.2 billion in direct loans, $25 million in grants, $8 million for tribal college grants, and $4 million for the Rural Community Development Initiative. Funding is provided for direct rather than guaranteed loans due to the higher subsidy cost of the guaranteed program.
The performance measure below shows the percent of the approximately 50 million total rural residents who are provided with improved essential community services such as health, safety, and educational facilities.
Key Performance Measure Actual Target
2012 2013 2014 2015 2016 2017 Percentage of customers who are provided access to new and/or improved essential community facilities –
Health Facilities 7.3 5.4 6.8 12.0 4.5 5.0 Safety Facilities 3.7 3.4 3.7 7.2 2.7 3.2 Educational Facilities 6.4 9.3 6.2 7.9 4.5 5.0
Note: Some facility types serve more than one purpose.

RURAL DEVELOPMENT 47
RURAL DEVELOPMENT SALARIES AND EXPENSES
2015 2016 2017Enacted Estimate Budget
Salaries and Expenses:Appropriation.............................................................................. $224 $226 $231Transfers:
Rural Electric and Telecomm. Loan Program............................. 35 35 36Rural Housing Insurance Fund Program..................................... 415 418 427Rural Development Loan Fund Program.................................... 4 4 5
Total, Transfers..................................................................... 454 457 468Total, Salaries and Expenses........................................................ $678 $683 $699
Program
(Dollars in Millions)Budget Authority
The 2017 Budget provides $699 million in funding for salaries and expenses needed to carry out RD programs. Since 2009, the level of financial assistance provided by Rural Development annually has gone up from $14.2 billion to $38.8 billion in 2016. At the same time, the staffing levels for RD have decreased from 5,873 in 2009 to 5,026 in 2016. To fully support effective program delivery and to maintain program integrity, the Budget provides a level of funding to support an estimated staff level of 5,168 in 2017. This staffing increase will be distributed between the field and headquarters operations. The increase will allow RD to strengthen the agency’s ability to deliver much needed programs and services and will enhance portfolio management and oversight.
Within this staffing level, funding is requested to hire 20 additional staff for a pilot called Rural Corps that will place economic development professionals in high-need areas to provide technical assistance and hands-on support at the local level. This model will increase the likelihood that investments in infrastructure and economic development are strategic, creating jobs and long-term economic benefits within the region. Additionally, this pilot will permit RD to increase the mobility of its field work force through technological enhancements along with enabling the Mission Area to better leverage its resources with other Federal agencies.
The Budget also includes $1.5 million within RD to support a service center agency (SCA) coordination initiative to build upon the success of USDA’s StrikeForce and additional place-based activities. This funding, along with similar requests in FSA and NRCS, provide a total of about $5 million that will enable the three SCAs to develop a cadre of field-based staff that will principally be focused on improving the access to USDA programs by persons and communities in persistent poverty areas. In particular, this funding will ensure improved coordination activities supporting communities experiencing high levels of poverty and joblessness with a specific emphasis on Alaskan Native communities.

48 FOOD, NUTRITION, AND CONSUMER SERVICES
MISSION AND RELATIONSHIP TO STRATEGIC GOALS The programs and funding of Food, Nutrition, and Consumer Services (FNCS), including the Food and Nutrition Service (FNS) and the Center for Nutrition Policy and Promotion (CNPP), support the USDA Strategic Goal to ensure that all of America’s children have access to safe, nutritious, and balanced meals. FNS and CNPP contribute significantly to two objectives under this strategic goal: (1) improving access to nutritious food; and (2) promoting a healthy diet and physical activity behaviors.
FNS administers USDA’s domestic nutrition assistance programs. Working in partnership with State agencies and other cooperating organizations, FNS helps ensure children and other low-income Americans have access to sufficient food, nutritious diets, and education to inform healthy choices. CNPP improves the health of Americans by developing and promoting dietary guidance that links the best evidence-based, scientific research to the nutrition needs of Americans. Over the course of a year, one in four Americans will be served by one of USDA’s 15 nutrition assistance programs designed to end hunger and reduce obesity, and even more will be reached through the Department’s nutrition education activities. FNCS is committed to continually improving the performance, efficiency, and integrity of these programs.
Federal staff leverage their efforts by working with State and local partners to deliver nutrition assistance through the Supplemental Nutrition Assistance Program (SNAP); Child Nutrition Programs, including the National School Lunch Program, the School Breakfast Program, Summer Food Service Program, and the Child and Adult Care Food Program; the Special Supplemental Nutrition Program for Women, Infants and Children (WIC); The Emergency Food Assistance Program (TEFAP); the Food Distribution Program on Indian Reservations (FDPIR); and several other programs. SNAP provides nutrition assistance to millions of eligible low-income individuals, helping them put food on the table. As the cornerstone of the USDA’s nutrition assistance programs, SNAP kept at least 4.7 million people, including nearly 2.1 million children, out of poverty in 2014. Other programs target the specific dietary needs of participant groups. The Child Nutrition Programs work with local agencies to provide balanced meals to children from early childhood child care through high school and during the summer months while WIC provides nutritious foods to low-income pregnant, breastfeeding and post-partum women, and young children.
Key Performance Measure Actual Target
2013 2014 2015 2016 2017 Prevalence of food insecurity in households with children 19.5% 19.2% 19.1%* 18.8% 18.5% *The 2015 figure is a target because actual data are not yet available.
The 2017 Budget provides funding for the major nutrition assistance programs, accounting for projected program participation and food cost inflation. It seeks to prevent and reduce food insecurity and to improve the nutritional status of recipients. The Budget improves program access and operations. To improve low-income children’s access to nutritious meals during the summer months when school is not in session and the risk of food insecurity increases, the Budget provides $26 million in discretionary funding to expand Summer Electronic Benefits Transfer for Children (SEBTC) demonstration pilots and invests $12.2 billion in mandatory funding over ten years to make the program permanent and nationwide. This proposal is based on rigorous evaluations of Summer EBT pilots, which have proven successful in reducing food

FOOD, NUTRITION, AND CONSUMER SERVICES 49
insecurity and improving nutrition among children. As part of a multi-faceted approach to summer feeding programs, the Budget also provides $10 million to support a demonstration pilot in the Summer Food Service Program that would allow for non-congregate meals sites in rural areas and Tribal lands. Additionally, the 2017 Budget provides $35 million in school equipment grants to ensure schools, 97 percent of which are successfully meeting the updated nutrition meal standards, have the equipment they need to serve healthy meals. The Budget also includes $10 million for Direct Certification grants to States for technology and system improvements or other technical assistance for the purpose of improving the rates of children being directly certified for free meals.
$6.6$21
$82
$6.4$22
$81
$6.4$23
$82
-82
-72
-62
-52
-42
-32
-22
-12
-2
8
0
10
20
30
40
50
60
70
80
90
WIC CNP SNAP
$Bill
ions
FNS Budget Authority
FY 2015 FY 2016 FY 2017
To support FNS’ aggressive work to identify and eliminate fraud, waste, and abuse, the Budget provides strategic increases in resources to strengthen program integrity efforts. The Budget includes an additional $3.8 million to build upon existing efforts which have yielded historically high payment accuracy rates for SNAP. The Budget also provides funds to support systems to reduce improper payments in Child Nutrition Programs.
Both FNS and CNPP will continue efforts to promote healthy eating and active lifestyle behaviors, in part by the use and promotion of MyPlate and the Dietary Guidelines for Americans. As CNPP works in collaboration with the Department of Health and Human Services on the Dietary Guidelines for Americans, which apply to people over two years old to promote health and prevent chronic disease, the Budget also provides funds to support the development of the first-ever dietary guidelines for children under two years old, and pregnant women.
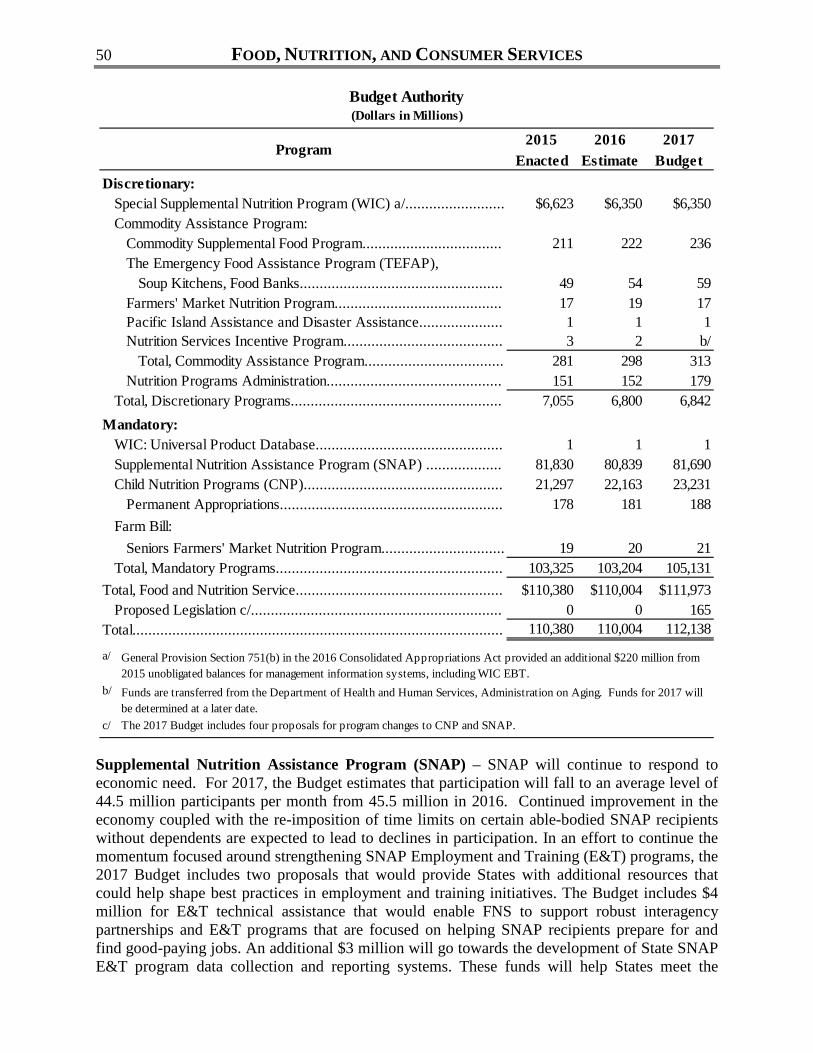
50 FOOD, NUTRITION, AND CONSUMER SERVICES
2015 2016 2017Enacted Estimate Budget
$6,623 $6,350 $6,350
211 222 236
49 54 5917 19 171 1 13 2 b/
281 298 313151 152 179
7,055 6,800 6,842
1 1 181,830 80,839 81,69021,297 22,163 23,231
178 181 188
19 20 21103,325 103,204 105,131
$110,380 $110,004 $111,9730 0 165
110,380 110,004 112,138
a/
b/
c/
Total, Mandatory Programs.........................................................Total, Food and Nutrition Service....................................................
General Provision Section 751(b) in the 2016 Consolidated Appropriations Act provided an additional $220 million from 2015 unobligated balances for management information systems, including WIC EBT.
(Dollars in Millions)Budget Authority
Farm Bill:Seniors Farmers' Market Nutrition Program...............................
Program
Discretionary:Special Supplemental Nutrition Program (WIC) a/.........................Commodity Assistance Program:
Commodity Supplemental Food Program...................................The Emergency Food Assistance Program (TEFAP),
Soup Kitchens, Food Banks...................................................Farmers' Market Nutrition Program..........................................Pacific Island Assistance and Disaster Assistance.....................Nutrition Services Incentive Program........................................
Proposed Legislation c/...............................................................
The 2017 Budget includes four proposals for program changes to CNP and SNAP.
Total.............................................................................................
Total, Commodity Assistance Program...................................Nutrition Programs Administration............................................
Total, Discretionary Programs.....................................................Mandatory:
WIC: Universal Product Database...............................................Supplemental Nutrition Assistance Program (SNAP) ...................Child Nutrition Programs (CNP)..................................................
Permanent Appropriations........................................................
Funds are transferred from the Department of Health and Human Services, Administration on Aging. Funds for 2017 will be determined at a later date.
Supplemental Nutrition Assistance Program (SNAP) – SNAP will continue to respond to economic need. For 2017, the Budget estimates that participation will fall to an average level of 44.5 million participants per month from 45.5 million in 2016. Continued improvement in the economy coupled with the re-imposition of time limits on certain able-bodied SNAP recipients without dependents are expected to lead to declines in participation. In an effort to continue the momentum focused around strengthening SNAP Employment and Training (E&T) programs, the 2017 Budget includes two proposals that would provide States with additional resources that could help shape best practices in employment and training initiatives. The Budget includes $4 million for E&T technical assistance that would enable FNS to support robust interagency partnerships and E&T programs that are focused on helping SNAP recipients prepare for and find good-paying jobs. An additional $3 million will go towards the development of State SNAP E&T program data collection and reporting systems. These funds will help States meet the

FOOD, NUTRITION, AND CONSUMER SERVICES 51
requirements of the forthcoming regulation required by statute on E&T data collection and reporting. The funds will be distributed through discretionary grants for States with demonstrated need and technical assistance in analyzing data to improve E&T service delivery.
As a cornerstone of the Nation’s nutrition assistance safety net, SNAP strives to serve all those that are eligible and wish to participate. The participation rate among eligible SNAP recipients was 85 percent in 2013, up from 83 percent in 2012. USDA’s targets reflect its goal to maintain the rate, even as economic conditions improve and the number of eligible people declines.
8.0
45.9
30.5
8.1
45.5
30.9
8.1
44.5
32.0
0.0
5.0
10.0
15.0
20.0
25.0
30.0
35.0
40.0
45.0
50.0
WIC SNAP School Lunch
Peop
le S
erve
d (M
illio
ns)
People Served Through Nutrition Assistance Programs
FY 2015 FY 2016 FY 2017
However, participation rates among elderly individuals have historically been much lower than average, in large part as a result of administrative complexities associated with applying and recertifying for SNAP. Based on the success of several State demonstrations in increasing elderly participation in SNAP, the Budget proposes creating a State option to improve SNAP access for low-income elderly individuals, with a $10 million increase in 2017 for the first year of implementation. This would allow States the option to adopt a set of policies to streamline and simplify SNAP application, reporting requirements, and recertification for low-income elderly individuals.
Key Performance Measure Actual Target
2013 2014 2015 2016 2017 Annual percentage of eligible people participating in SNAP* 85.0 85.0 85.0** 85.0 85.0 *Data are available with a two-year lag. **The 2015 figure is a target since actual data are not yet available.
The Administration has also worked hard to continually improve program integrity in SNAP and ensure that Program resources are used most effectively to reduce food insecurity. SNAP has

52 FOOD, NUTRITION, AND CONSUMER SERVICES
one of the most rigorous quality control systems of any public benefit program. The SNAP payment accuracy rate is among the best in the Federal government.
Key Performance Measure Actual Target
2013 2014 2015 2016 2017 SNAP payment accuracy rate 96.8 96.34* 96.34** 96.34 96.34 *The 2014 Farm Bill lowered the threshold level for reporting errors. ** The 2015 figure is a target since actual data are not yet available Through the quality control process, FNS measures payment error, by requiring States to randomly sample cases to verify that individuals who received benefits were eligible and received the correct amount. To better ensure a high level of compliance with quality control procedures and data reporting, the Budget requests an additional $3.8 million in 2017 to ensure that States are meeting the highest standards of program integrity in administering SNAP through additional training, oversight and monitoring of State quality control processes.
To support the Program’s role in providing nutrition education and promotion programs for low-income or disadvantaged groups, the Budget includes $2 million for the SNAP Nutrition Education/Obesity Prevention Center for Excellence which promotes innovation in education and obesity prevention. The Budget also includes $1.2 million to increase monitoring, oversight, and technical assistance resources to States for SNAP Nutrition Education. These resources will support plans that are outcome based, include evidence-based approaches, and incorporate public health approaches to ensure the Federal investment in improving health among low-income populations is spent effectively.
The Budget requests a $5 million discretionary funding increase to support the National Health and Nutrition Examination Survey (NHANES). This is the only nationally representative survey of food intake by consumers in the United States. The data are essential to understanding food choice and nutritional and health status of nutrition assistance program participants. NHANES findings are the basis for national standards for such measurements as height, weight, and blood pressure. Funding for the survey has not increased in over 20 years, reducing resources to the point where the survey is jeopardized. With additional funding, additional data collected through NHANES would be used to assess nutritional status and its association with health promotion and disease prevention.
The 2017 Budget includes two programmatic requests for the FDPIR Program. The Program provides food packages to Indian Tribal Organizations (ITOs) to improve nutrition and provide culturally appropriate sustenance. Since FY 2013, participation in FDPIR has increased by over 17 percent. Participation is expected to reach 100,000 participants per month in FY 2017, up from over 88,000 in FY 2015. However, administrative funding has been flat. The Budget requests an additional $5 million for administrative needs such as forklifts, freezers and coolers, and warehouse maintenance for roofing and flooring. The Budget also includes a discretionary increase of $2 million for a FDPIR Traditional Foods Demonstration project. This funding would provide grants to one or more ITOs for the purchase of nutritious and traditional foods, and when practicable, foods produced locally by Indian producers, for distribution to FDPIR recipients.
The Budget includes a $30 million proposal to offset declines in 2014 Farm Bill-authorized funding for commodities under The Emergency Food Assistance Program (TEFAP). These declines will contribute to increasing difficulty in effectively meeting the food needs of program

FOOD, NUTRITION, AND CONSUMER SERVICES 53
participants. Increasing funding to 2015 levels will ensure TEFAP is better able to meet those needs, including rising needs as certain adult SNAP recipients lose eligibility due to the reestablishment of time limits on their participation.
Investments to increase SNAP benefits redeemed at farmers markets and direct marketing farmers are paying off with the amount redeemed increasing over the last several years.
Key Performance Measure Actual Target
2013 2014 2015 2016 2017 SNAP benefits redeemed at farmers markets and direct marketing farmers annually (millions) $17.5 $18.8 $19.4 $20.0 $20.0
Child Nutrition Programs – Through subsidies for meals that meet nutritional standards, the National School Lunch Program (NSLP), School Breakfast Program (SBP), Summer Food Service (SFSP), and Child and Adult Care Food Program (CACFP) assist State and local governments, and private non-profit organizations in ensuring that children in schools and child care – and adults in adult day care programs – receive meals that meet their nutritional needs, foster healthy eating habits, reduce the number of overweight and obese children, and safeguard their health. The 2017 Budget funds the Child Nutrition Programs at a level that will support anticipated increases in participation and food cost inflation. The Budget projects serving 5.49 billion lunches and snacks (an increase of 59.1 million, or 1.1 percent, over the current estimate for 2016) and 2.58 billion breakfasts in schools, 2.1 billion meals in child and adult care centers, and 199.2 million meals through the SFSP.
The main driver for the expected participation increase in school meals is the community eligibility provision (CEP), a key provision of the Healthy, Hunger-Free Kids Act of 2010. CEP provides an alternative to household applications for free and reduced price meals and reduces the burden of collecting funds and maintaining accounts for the students who pay for school meals. The provision improves access to nutritious meals for low-income students while reducing administrative burdens for households and schools. In school year 2015-16, 60 percent of eligible schools are participating in CEP. This means that nearly 17,000 schools in more than 3,000 school districts across the country are easing the ability for more than 8.1 million students to obtain nutritious meals. CEP has led to a 9 percent increase in School Breakfast participation and a 5 percent increase in School Lunch participation in the districts in which it has been implemented. In addition to provisions like CEP, the Budget also supports a funding increase of $10 million for technical assistance for Direct Certification Grants, which can also assist in reducing administrative burden and improving program access for eligible children.
Key Performance Measure Actual Target
2013 2014 2015 2016 2017 Annual percentage of eligible people participating in NSLP 55.7 54.8 55.4 56.8 58.3
FNS continues to work with State agencies to help improve the integrity of Child Nutrition Programs and to minimize error. To help with this effort, the Budget provides a $2 million increase to develop and manage a framework by which to evaluate the new Administrative Review process for schools. This new process includes approaches to reduce improper and

54 FOOD, NUTRITION, AND CONSUMER SERVICES
erroneous payments and strives to ensure proper implementation of the school meal programs. With the implementation of the new Administrative Review process for school meal programs, FNS and State and Local Educational Agencies will have access to new information to inform areas of program improvement.
The Budget also provides $1 million to support Child Nutrition State Exchange activities. The primary goal of the Exchange is to develop a framework to allow States to exchange information, best practices, resources, tools, and forms, in a secure, reliable and sustainable manner. Child Nutrition State Exchange activities are expected to lead to increased coordination among States which will result in improved compliance and efficiency in program delivery.
To further enhance program integrity, the Budget provides an additional $5 million in funding for grants to States for purposes of developing or improving current automated information systems used to operate and manage Child Nutrition Programs. Funds will improve program accountability, data accuracy, program performance measurement, and the capacity to identify and target error-prone areas.
USDA is working with State administering agencies, about 100,000 schools, hundreds of thousands of school food service workers and suppliers, as well as over 50 million children, their parents and teachers to improve the school food environment. Outdated food service equipment can be a barrier to serving healthier meals on a large scale. Therefore, the Budget includes $35 million in grants to help schools purchase needed equipment to prepare and serve healthier meals. In the coming school year, FNS will continue to support schools’ implementation of the new “Smart Snacks in School" rule to ensure that children have more nutritious food choices across their school campus throughout their school day, helping to make the healthy choice the easy choice for students.
Whereas more than 22 million children receive free or reduced price meals on school days, fewer than 3 million receive free meals when school is not in session. USDA has been working to reduce food insecurity and hunger among school children in the summer. In 2015, 190.3 million meals were served during the summer, including lunches and breakfasts served in the Summer Food Service Program as well as in schools through the Seamless Summer Option, an increase of over 16 percent since 2009. Since 2009, a total of 1.2 billion summer meals have been served to children when school is out of session.
As part of this effort to reduce child food insecurity during the summer months, the Department is continuing to conduct the Summer Electronic Benefit Transfer for Children (SEBTC) demonstration projects with promising results. The projects have shown that providing a benefit through SNAP and WIC EBT systems during the summer to low-income households with school-aged children can reduce severe food insecurity among children. To further address the large number of low-income children at risk of food insecurity during the summer, the Budget provides about $26 million to continue the SEBTC demonstration pilots in several States.
Beyond the expansion of the successful SEBTC demonstration pilots, the 2017 Budget proposes an increase of $12.2 billion over ten years to make the program permanent and begin a phased-in nationwide expansion. States will be phased in over ten years with approximately 10 percent of States participating in Year 1, 25 percent participating by Year 5 and all States participating by Year 10. Eligible children will receive a $45 monthly benefit in 2017, indexed for inflation, which can be redeemed for food purchases at SNAP-authorized vendors. This proposal would reach almost one million low-income children beginning in the summer of 2017, increasing to

FOOD, NUTRITION, AND CONSUMER SERVICES 55
nearly 20 million children when all States begin offering the program in Year 10. SEBTC will supplement continued efforts to expand access to traditional summer feeding programs through intensive technical assistance to targeted States. Evaluations of SEBTC show impressive results—participation in SEBTC eliminated very low food security for about one-third of the children who would otherwise have experienced it.
As evidenced by the success of the summer meals programs since 2009, summer meals are an increasingly important part of the Child Nutrition portfolio. In addition to an increase in SEBTC efforts, the Budget also provides $10 million for a demonstration in the Summer Food Service Program that would authorize, fund, and evaluate non-congregate meal services in rural areas. The demonstration project would allow State administrators, ITO’s, and program sponsors to improve meal access by offering SFSP meals at non-congregate sites so that children could pick up meals and consume them offsite. The amount funded in the Budget would support meals for about 25,000 children over the summer months, as well as an evaluation of participation, implementation, and impacts on food security.
Key Performance Measure Actual Target
2013 2014 2015 2016 2017 Annual percentage of children participating in the free/reduced price school lunch program that participate in summer feeding programs 16.3 17.5 17.1 17.2 17.4
The Healthier US School Challenge (HUSSC) is a voluntary initiative established in 2004 to recognize NSLP schools that have created healthier school environments through promotion of nutrition and physical activity. HUSSC awards have been given to schools in 49 States and the District of Columbia. Over 6,700 schools are HUSSC certified. Funding for the HUSSC is maintained at $1.5 million so that USDA can continue to encourage schools to take a leadership role in helping students learn to make healthier eating and lifestyle choices. Team Nutrition, a tool for promoting healthy eating through training, technical assistance and education, is also maintained at $15.5 million.
Farm to School initiatives are funded at $9.1 million, with $4.1 million for the Farm to School Team and $5 million provided through the Healthy, Hunger-Free Kids Act (HHFKA) of 2010 for Farm to School grants. In fiscal year 2016, Farm to School grants were awarded to 74 projects in 39 States. These grants ensure continued support of local and regional food systems by facilitating linkages between schools and their local food producers.
Technical assistance to support the update of the CACFP meal patterns is funded at $14 million. HHFKA required that meal pattern requirements for CACFP be updated to implement nutrition and wellness requirements. In order for the implementation of these new meal patterns to be successful, additional technical assistance, training, and resources for program operators and administrators will be required. Funds will be distributed to States via grants to provide hands-on training and assistance.
WIC – WIC helps improve the health and nutritional intake of low-income pregnant, breastfeeding and postpartum women, infants and children up to their fifth birthday. WIC serves over half of all babies in the United States. It provides participants with benefits, redeemable at certified WIC retailers, for foods dense in nutrients known to be lacking in the diets of eligible

56 FOOD, NUTRITION, AND CONSUMER SERVICES
groups. The program also provides nutrition education, breastfeeding counseling, and referrals to critical health and social services.
The Budget provides $6.35 billion for WIC, continuing the Administration’s commitment to serve the projected number of eligible individuals seeking WIC benefits. In 2017, about 8.1 million low-income women, infants and children are expected to participate in the program. The Budget includes $80 million for breastfeeding peer counseling to help increase breastfeeding rates, an increase of $20 million above 2016. The Budget also includes an increase of $10 million for Program Evaluation and Monitoring to conduct studies and evaluations on the program, including longer, longitudinal analyses examining the long term impacts of WIC on key health measures, such as obesity, healthy eating, and birth weights.
Commodity Assistance Program (CAP) – For 2017, the Budget provides $313 million for CAP, including funding for the Commodity Supplemental Food Program (CSFP), which provides commodities to low-income elderly individuals. With an increase of $13.9 million, the requested level will support the current number of elderly individuals served (adjusting for increased food costs), in addition to expanding caseloads in States by 20,000 slots. The Budget also provides a $5 million increase for the administration of TEFAP to be used for the storage and distribution of USDA foods in the TEFAP and emergency food organization network.
Nutrition Programs Administration (NPA) – The Budget provides $179.4 million for NPA to support Federal management and oversight of USDA’s investment in nutrition assistance programs. This will help ensure adequate oversight and program integrity, simplify and improve the programs, and encourage healthy and nutritious diets. The Budget includes a $4 million dollar increase for activities surrounding MyPlate and the Dietary Guidelines for Americans, as well as a $1 million increase to support the development of the first-ever dietary guidelines for children from birth to two years and pregnant women, including development of the evidence-base for the guidelines and initiation of a web-based system to allow for public input throughout the project. The Budget includes $2 million in funding for the Congressional Hunger Center. The Budget also provides an increase of $18 million to fund a relocation or renovation of FNS headquarters in 2017.

FOOD, NUTRITION, AND CONSUMER SERVICES 57
2015 2016 2017Enacted Estimate Budget
45.9 45.5 44.519.8 20.8 20.830.5 30.9 32.011.0 11.7 11.914.0 14.6 15.08.0 8.1 8.1
0.00 0.00 0.000.57 0.62 0.64
0.09 0.09 0.10
$128.17 $128.32 $128.8843.52 45.80 47.2325.04 26.06 26.6121.27 22.12 22.5677.28 78.65 80.28
$3.31 $3.39 $3.472.91 2.99 3.070.59 0.59 0.61
$1.95 $2.00 $2.021.65 1.70 1.720.28 0.29 0.29
a/
b/
c/
Food and Nutrition ServiceKey Indicators
Program
At the end of FY 2015, fewer than 1,000 WIC-type participants remained in CSFP.
Excludes bonus commodities.
Average Participation, Millions:Supplemental Nutrition Assistance Program (per month)...............Free School Lunch......................................................................
Total School Lunch (per day)....................................................Free School Breakfast.................................................................
Total School Breakfast (per day)..............................................WIC (per month)........................................................................Commodity Supplemental Food Program (CSFP):
WIC (per month) a/.................................................................Elderly (per month)..................................................................
Food Distribution Program on Indian Reservations (FDPIR) (per month)...........................................
Average/Person/Month Food Benefit in $:Supplemental Nutrition Assistance Program..................................WIC..........................................................................................CSFP: WIC (FNS Funded).........................................................CSFP: Elderly (FNS Funded)......................................................FDPIR (FNS Funded).................................................................
Per Meal Subsidies Including Commodities in $: School Lunch: b/ c/
Free...........................................................................................
Effective 2013, performance-based enhanced reimbursements of 6 cents per lunch was available for lunches meeting the new meal standards and are included in these amounts.
Paid...........................................................................................
Reduced.....................................................................................Paid...........................................................................................
School Breakfast:Free...........................................................................................Reduced.....................................................................................

58 FOOD SAFETY
MISSION AND RELATIONSHIP TO STRATEGIC GOAL Foodborne illness is recognized as a significant public health problem in the United States. About 48 million people (one in six Americans) get sick, 128,000 are hospitalized, and 3,000 die each year from foodborne diseases, according to the latest estimates from the Centers for Disease Control and Prevention. USDA and other Federal agencies are working in cooperation to ensure that Americans have increased access to safe and healthy food.
The Food Safety mission area is the public health mission area of USDA that is responsible for ensuring that the Nation’s commercial supply of meat, including Siluriformes fish and products, poultry, and egg products is safe, wholesome, and properly labeled and packaged. This includes products produced domestically in Federally-inspected establishments, as well as products imported from foreign countries. Funds for the Food Safety mission area support the USDA Strategic Goal to ensure that all of America’s children have access to safe, nutritious, and balanced meals.
The mission area includes the activities of the Food Safety and Inspection Service (FSIS), which provides Federal inspection of meat, poultry and processed egg products establishments; support for similar establishments under State inspection programs; Federal inspection of Siluriformes fish and products beginning March 1, 2016; development and implementation of the Public Health Information System to enhance science-based, data-driven inspections; and determination of international equivalence of foreign systems. Additionally, FSIS coordinates the development of its policies with other USDA agencies and other Federal agencies, including the Food and Drug Administration, the Environmental Protection Agency, the Centers for Disease Control and Prevention, as well as foreign governments and international organizations, to ensure an integrated farm-to-table approach to food safety.
FSIS has seen declines in the total number of illnesses attributed to agency-regulated products as measured by the overall All-Illness Measure estimates. The number of illnesses attributed to FSIS-regulated products fell by more than 46,000 on an annual basis, or nearly eleven percent, from 2009 to 2015. FSIS continues to improve the public health effectiveness of its testing programs through new and expanded sampling of regulated products in an effort to reduce foodborne illness. The agency has set tougher standards for Salmonella and new standards for Campylobacter on poultry carcasses, and developed the first ever Salmonella and Campylobacter standards for chicken parts, which are more commonly purchased than whole carcasses. Together, USDA estimates these new standards will reduce illnesses by about 75,000 annually. Shortly after finalizing the new performance standards, increased product testing will demonstrate whether establishments are meeting the new pathogen reduction performance standards. Consistent with FSIS testing of imported beef and poultry products for pathogens, FSIS will also begin testing imported pork products for Salmonella in 2016.
Animal welfare and enforcement of the Humane Methods of Slaughter Act continues to be an important issue for FSIS. The agency correspondingly proposed new requirements in May 2015 that will ensure the humane disposition of non-ambulatory disabled veal calves.
The Food Safety mission area includes the oversight of the Office of the U.S. Manager of Codex, which is the major international mechanism for encouraging fair international trade in food while promoting the health and economic interests of consumers.

FOOD SAFETY 59
2015 2016 2017Enacted Enacted Budget
$901 $899 $91461 61 6116 17 1734 34 344 4 4
1,016 1,015 1,030
14 11 11(201) (180) (180)
$1,231 $1,206 $1,221
State Food Safety and Inspection.................................................. International Food Safety and Inspection....................................... Public Health Data Communication Infrastructure System..............
Total, FSIS Programs...............................................................
Codex Alimentarius...................................................................... Total, Discretionary Programs..................................................
Mandatory: Trust Funds (Voluntary Inspection Services).................................. User Fees (Overtime/Holiday Inspection Services)........................
Budget Authority(Dollars in Millions)
Program
Discretionary: Federal Food Safety and Inspection...............................................
Organizational Structure – To accomplish its functions, FSIS employees are located at about 6,400 slaughtering and processing establishments and import houses, and other Federally-regulated facilities. Headquarters personnel are responsible for overseeing administration of the program and ensuring that scientific and technological developments are incorporated into inspection procedures. The Codex Office coordinates all U.S. government and non-government participation in the activities of the Codex Alimentarius Commission.
Inspection, Data Infrastructure, and Outbreak Response – The 2017 Budget proposes discretionary funding of $1.03 billion, about $15.5 million above the 2016 funding level. With these funds, FSIS will support its approximately 8,000 Federal in-plant and other frontline personnel and the Federal share of State inspection programs, and continue to improve the data infrastructure supporting the Nation’s food safety system. The Budget includes increases of $8.5 million to modernize the agency’s scientific approach to food safety as described below, and $12.1 million for pay costs. FSIS continues to move forward with implementation of the New Poultry Inspection System (NPIS). The Budget reflects savings of $3.3 million from efficiencies related to adoption of NPIS and $1.8 million in savings from billing process improvements. Modernizing Approaches to Food Safety – FSIS will further modernize its science-based decision-making process by developing and deploying new tools to reduce the prevalence of foodborne illnesses. As part of this effort, the Budget includes $4.5 million to implement a whole genome sequencing initiative to characterize bacterial genomes with greater precision, and improve the speed and accuracy of outbreak investigations. This capability will also play a role in the Administration’s Antimicrobial Resistance initiative by identifying resistance to antimicrobial agents and changes in virulence attributes. The Budget also proposes $3 million to expand laboratory analysis for pathogens, adulterants and chemical contaminants. FSIS has found that verifying through sampling is one of the most effective means to decrease the contamination rate in food. Finally, an increase of $1 million is proposed to implement an initiative that will increase the capability of the agency’s analyses for the purpose of improving food safety. With the increased size of its data holdings, FSIS will be able to gain new insights

60 FOOD SAFETY
that will aid inspectors in their mission; inform policy, rulemaking and the establishment of standards; become more proactive in food defense; and help reduce foodborne illnesses.
Combating Foodborne Illness – FSIS is instrumental in helping reduce the level of foodborne illness by targeting common and dangerous pathogens, thereby reducing their prevalence in finished food product. In addition to its work ensuring safe and wholesome products are available to the consumer, FSIS also conducts public education campaigns to inform consumers about safe food handling methods to decrease the likelihood of foodborne illness from products that were improperly stored, handled, and/or prepared.
With the funding requested for 2017, FSIS aims to achieve the following performance measures:
Key Performance Measure Actual Target
2012 2013 2014 2015 2016 2017 Percent of broiler plants passing the carcass Salmonella Verification Testing Standard 90% 90% 92% 96% 95% 95%
Total illnesses from all FSIS Products 479,621 427,171 386,265 382,123 363,547 353,139
Percent of establishments with a functional food defense plan1/ 77% 83% 84% 85% 90% 90%
Percent of establishments with a systematic humane handling approach 42% 56% 64% 69% 75% 75%
1/ Functional food defense plans are voluntary written procedures that food processing establishments should follow to protect the food supply from intentional contamination with chemicals, biological agents or other harmful substances.
User Fees and Trust Funds – In 2017, FSIS estimates it will collect $191 million through existing user fee and trust fund activities for providing overtime, holiday, and voluntary inspection services. FSIS will submit a legislative proposal for a user fee to be collected from plants for additional inspections and related activities made necessary due to the failure in performance by the covered establishment. Total annual collections from this proposal are estimated at about $4 million.

NATURAL RESOURCES AND ENVIRONMENT 61
MISSION AND RELATIONSHIP TO STRATEGIC GOALS A healthy and prosperous America relies on the health of our natural resources, and particularly our forests and agricultural working lands. America’s 193 million acres of national forests and grasslands and 1.3 billion acres of private forest lands, farms, and ranches must be nurtured so that they continue to offer the environmental benefits of clean air, clean and abundant water, and important wildlife habitat while helping us adapt to a changing climate. Farms and forests help generate rural wealth through agriculture, recreation, and tourism, the creation of green jobs, and the production of wood products and energy. Our forests, farms, and ranches contribute to our cultural heritage as well.
The Natural Resources and Environment (NRE) mission area promotes the conservation and sustainable use of natural resources on the Nation's private lands and sustains production of all the goods and services that the public demands of the national forests and grasslands. The mission area includes two agencies: the Natural Resources Conservation Service (NRCS) and the Forest Service (FS).
All Other Mandatory Programs
2%
Conservation Stewardship Program
23%
Discretionary Programs
13%
Environmental Quality Incentives
Program25%
Agricultural Conservation
Easement Program7%
Conservation Reserve Program
30%
2017 Conservation BudgetTotal = $6.7 Billion
NRCS and FS are the primary contributors to achieving the Strategic Goal that ensures our national forests and private working lands are conserved, restored, and made more resilient to climate change, while enhancing water resources. Both NRCS and FS work closely with partners to leverage private resources and innovative ideas to make the landscape and critical infrastructure more resilient to climate change. NRCS has expanded its partnerships with both not-for-profit organizations and the private sector to implement regional-scale conservation in critical areas particularly vulnerable to climate change. In particular, during 2015 NRCS used its Farm Bill authorities through the Regional Conservation Partnership Program to empower local leaders to work with multiple partners, including private companies, local and tribal governments, universities, non-profit groups and other non-government partners, along with farmers, ranchers, and forest landowners to design solutions that work best for their region. NRCS has also targeted technical and financial assistance towards critical efforts such as USDA’s StrikeForce Initiative for Rural Growth and Opportunity.

62 NATURAL RESOURCES AND ENVIRONMENT
NRCS and FS continue to expand public access to Federal and private lands for hunting, fishing, and other outdoor recreational opportunities. This is accomplished through a variety of programs aimed at preserving and restoring our public and private lands, mitigating the effects of climate change, and making the landscape more resilient to wildfire. NRCS partners with private landowners to provide technical and financial assistance to help protect farm and ranch lands and private forestland. FS partners with State, Tribal, and local government agencies to sustain the health, diversity and productivity of our national forests and grasslands, and State and private forests.
USDA’s overall investment in drought disaster relief and long term conservation practices exceeded $1.2 billion in 2015. Building Blocks for Climate Smart Agriculture and Forestry consists of 10 building blocks that span a range of technologies and practices to reduce greenhouse gas emissions, increase carbon storage, and generate clean renewable energy, all aimed at fostering a more climate resilient landscape of public and private working lands. By 2025, USDA conservation activities will reduce net emissions and enhance carbon sequestration by the equivalent of taking 25 million cars off the road.
177 190 203 223 237 248 258 272 284
34 31 3130 27 26 24 24 24
1325
3850
6069 76
8696
2831
3334
3636
3840
41
0
50
100
150
200
250
300
350
400
450
500
2009 2010 2011 2012 2013 2014 2015 2016 2017
Mill
ions
of A
cres
Farm Bill Conservation ProgramsCumulative Acres Enrolled
EQIP CRP CSP All Other
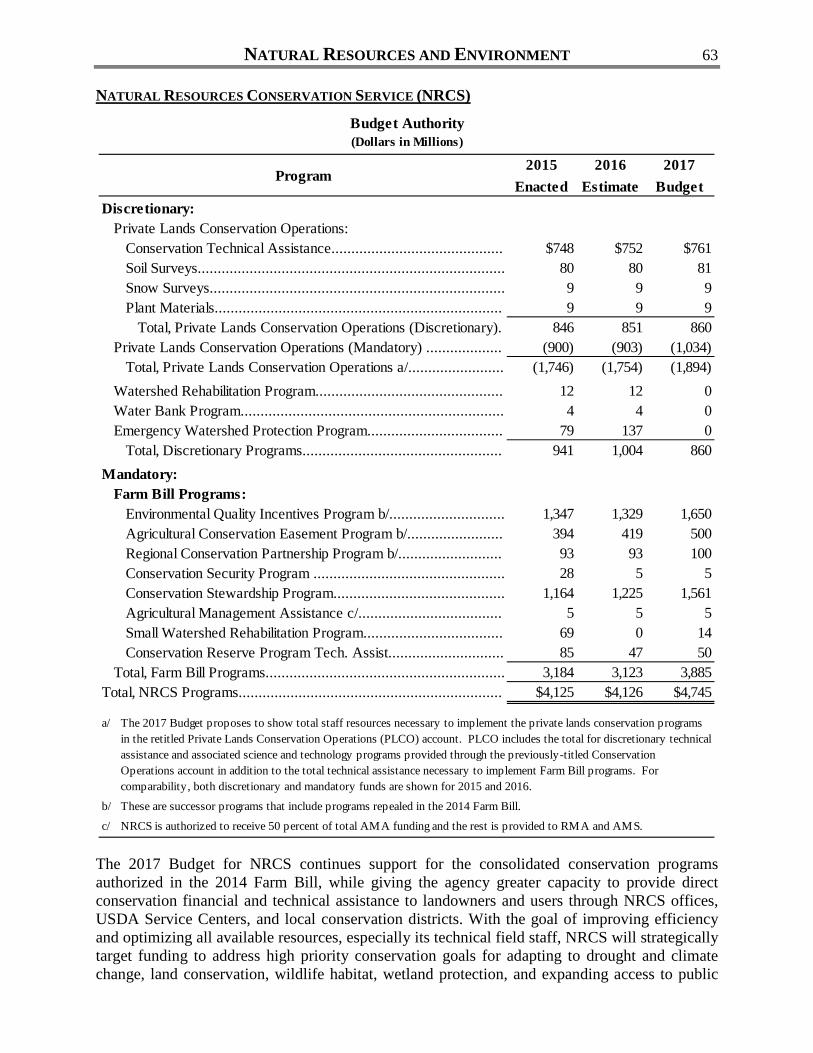
NATURAL RESOURCES AND ENVIRONMENT 63
NATURAL RESOURCES CONSERVATION SERVICE (NRCS)
2015 2016 2017Enacted Estimate Budget
$748 $752 $76180 80 819 9 99 9 9
846 851 860(900) (903) (1,034)
(1,746) (1,754) (1,894)12 12 04 4 0
79 137 0941 1,004 860
1,347 1,329 1,650394 419 50093 93 10028 5 5
1,164 1,225 1,5615 5 5
69 0 1485 47 50
3,184 3,123 3,885$4,125 $4,126 $4,745
a/
b/
c/
Total, NRCS Programs..................................................................
The 2017 Budget proposes to show total staff resources necessary to implement the private lands conservation programs in the retitled Private Lands Conservation Operations (PLCO) account. PLCO includes the total for discretionary technical assistance and associated science and technology programs provided through the previously-titled Conservation Operations account in addition to the total technical assistance necessary to implement Farm Bill programs. For comparability, both discretionary and mandatory funds are shown for 2015 and 2016.
These are successor programs that include programs repealed in the 2014 Farm Bill.
NRCS is authorized to receive 50 percent of total AMA funding and the rest is provided to RMA and AMS.
Agricultural Management Assistance c/....................................Small Watershed Rehabilitation Program...................................Conservation Reserve Program Tech. Assist.............................
Total, Farm Bill Programs............................................................
Conservation Security Program ................................................Conservation Stewardship Program...........................................
Regional Conservation Partnership Program b/..........................
Mandatory: Farm Bill Programs:
Environmental Quality Incentives Program b/.............................Agricultural Conservation Easement Program b/........................
Total, Discretionary Programs..................................................
Plant Materials........................................................................Total, Private Lands Conservation Operations (Discretionary).
Private Lands Conservation Operations (Mandatory) ...................Total, Private Lands Conservation Operations a/........................
Watershed Rehabilitation Program...............................................
Conservation Technical Assistance...........................................Soil Surveys.............................................................................Snow Surveys..........................................................................
Water Bank Program..................................................................Emergency Watershed Protection Program..................................
Program
Budget Authority(Dollars in Millions)
Discretionary:Private Lands Conservation Operations:
The 2017 Budget for NRCS continues support for the consolidated conservation programs authorized in the 2014 Farm Bill, while giving the agency greater capacity to provide direct conservation financial and technical assistance to landowners and users through NRCS offices, USDA Service Centers, and local conservation districts. With the goal of improving efficiency and optimizing all available resources, especially its technical field staff, NRCS will strategically target funding to address high priority conservation goals for adapting to drought and climate change, land conservation, wildlife habitat, wetland protection, and expanding access to public

64 NATURAL RESOURCES AND ENVIRONMENT
and private lands for diverse recreation opportunities. Funding is provided for conservation programs that focus on priority watersheds and landscapes most in need of protection, emphasize partnering with local constituents to efficiently implement programs and initiatives, and help create sustainable natural resource jobs that strengthen rural communities.
With authorities from the 2014 Farm Bill, NRCS has been able to more effectively deliver conservation on a broader scale, providing additional opportunities for diverse partners to work with NRCS to implement innovative and cooperative conservation projects. In 2015, NRCS announced the new Regional Conservation Partnership Program (RCPP). It has so far worked to empower local communities and private landowners to take control and identify the resource conservation needs in their own backyards. Through public-private partnership NRCS is bringing new resources, new partners and new ideas to the table, resulting in conservation outcomes that could not have been realized without these partnerships. There are 115 RCPP projects currently being funded in all 50 States and Puerto Rico, addressing issues ranging from water quality to soil health. Together, USDA investments and partner contributions have brought the total conservation investment through RCPP to almost $800 million. With participating partners investing along with the Department, USDA’s $1.2 billion investment in RCPP over the next five years can leverage an additional $1.2 billion.
2015 2016 2017Enacted Estimate Budget
$846 $851 $860
430 450 486118 125 14939 40 436 1 1
221 239 3041 1 1
85 47 50900 903 1,034
$1,746 $1,754 $1,894
a/
b/
c/
Total, NRCS Technical Assistance.................................................
The 2017 Budget proposes to show total staff resources necessary to implement the private lands conservation program in the retitled Private Lands Conservation Operations (PLCO) account. PLCO includes the total for discretionary technical assistance and associated science and technology programs provided through the previously-titled Conservation Operations account in addition to the total technical assistance necessary to implement Farm Bill programs.These programs are successor programs that include repealed programs in the 2014 Farm Bill.
NRCS is authorized to receive 50 percent of total AMA funding and the rest is provided to RMA and AMS.
Conservation Security Program.................................................Conservation Stewardship Program...........................................
Conservation Reserve Program Tech. Assist.............................Total, Farm Bill Programs (Technical Assistance)...................
Agricultural Management Assistance c/....................................
Regional Conservation Partnership Program b/..........................
Mandatory: Farm Bill Programs (Technical Assistance): a/
Environmental Quality Incentives Program b/.............................Agricultural Conservation Easement Program b/........................
Budget Authority(Dollars in Millions)
Private Lands Conservation Operations
Discretionary:Conservation Operations.............................................................
Private Lands Conservation Operations (PLCO) – The 2017 Budget proposes to retitle the existing “Conservation Operations” account as the “Private Lands Conservation Operations” account. PLCO would consolidate the discretionary and mandatory technical assistance (TA) funding necessary for the agency to support its core mission of delivering conservation to America’s private working lands. The total proposed funding for PLCO for 2017 is $1.9 billion.

NATURAL RESOURCES AND ENVIRONMENT 65
This includes $860 million of discretionary funding, which includes $761 million for conservation technical assistance (CTA), as well as $99 million for Soil Survey, Snow Survey, and Plant Materials Centers. A total of $1 billion in mandatory TA is estimated to be needed to support Farm Bill conservation program implementation.
In 2017 NRCS will establish, through the Conservation Effects Assessment Project, a continuing, statistically-valid producer-based survey to track progress in conservation adoption and conservation investment benefits to the nation’s water quality, soil health, and agricultural productivity. The survey will inform conservation-based decision-making through prioritized investments in science-based tools and data.
NRCS will also continue to improve technical assistance delivery to agricultural producers with continued investment in the Conservation Delivery Streamlining Initiative (CDSI). The 2017 Budget includes about $38 million for CDSI, and will build upon the success seen with the launch of the Conservation Client Gateway (CCG). The CCG is a secure website that enables agricultural producers operating as individuals to request technical assistance for developing new conservation plans, to review existing plans, and to report completed conservation practices. Clients can also use CCG to apply for Farm Bill financial assistance in conservation programs. For NRCS, CDSI implements a more effective, efficient, and sustainable business model for delivering conservation assistance through reduced document handling, reduced decision and approval times, improved access to best-available information and technology, and staffing strategies that are aligned with streamlined processes. NRCS customers benefit by reducing the number of trips that need to be made to an NRCS field office, accelerating the timeline between applying for a program and having a signed contract, and offering clients 24/7/365 service for many tasks.
Through CTA, NRCS works with land owners and managers to develop conservation plans that outline the specific conservation practices needed to improve farm operations and enhance farm environmental sustainability. Conservation planning is the critical first step before Farm Bill programs can be accessed. In 2017, NRCS expects to provide technical assistance for planning and application to cover an estimated 35 million acres. Conservation planning through CTA is a major contributor to meeting USDA’s Strategic Goal to ensure that the Nation’s forests and private working lands are conserved, restored, and made more resilient to climate change. In addition, NRCS has developed the breadth of expertise needed to aid landowners facing a wide array of conservation challenges. The conservation practices identified in these plans can be applied by land owners and managers in future years. These conservation practices will result in increased water quality, water conservation, soil quality, nutrient management, and will improve grazing and forest land.
The Budget also includes $1.5 million within CTA to support a service center agency (SCA) coordination initiative to build upon the success of USDA’s StrikeForce and additional place-based activities. This funding, along with similar requests in FSA and RD, provide a total of about $5 million that will enable the three SCAs to develop a cadre of field-based staff that will principally be focused on improving the access to USDA programs by persons and communities in persistent poverty areas. In particular, this funding will ensure improved coordination activities supporting communities experiencing high levels of poverty and joblessness with a specific emphasis on Alaskan Native communities.

66 NATURAL RESOURCES AND ENVIRONMENT
Key Performance Measure Actual Target
2012 2013 2014 2015 2016 2017 CTA: Land with conservation applied to improve water quality N/A N/A 18.2 18.1 17.9 17.9 CTA: Cropland with conservation applied to improve soil quality N/A N/A 6.2 6.0 5.9 5.9
CTA: Grazing land with conservation applied to protect and improve the resource base N/A N/A 13.1 13.1 13.0 13.0
*All numbers in millions of acres.
Environmental Quality Incentives Program (EQIP) – EQIP provides assistance to landowners who face serious natural resource challenges (such as soil erosion, air quality, water quality and quantity, and the sustainability of fish and wildlife habitat) that impact soil, water and related natural resources, including grazing lands, wetlands, and wildlife habitat. EQIP implementation will continue to be targeted to acres with the highest conservation benefit. The 2014 Farm Bill re-authorized this program through 2018. In addition, the 2014 Farm Bill moved under EQIP the activities of the Wildlife Habitat Incentive Program, a program that provided financial and technical assistance to eligible participants to develop habitats for upland and wetland wildlife, threatened and endangered species, fish, and other types of wildlife. The Agricultural Water Enhancement Program, which was operated under EQIP, was repealed by the 2014 Farm Bill, and its functions were moved to the Regional Conservation Partnership Program.
EQIP, along with the Agricultural Conservation Easement Program, has been critical for the success of key landscape scale initiatives, particularly the Sage Grouse Initiative (SGI). SGI is an unprecedented voluntary conservation effort with landowners, the results of which helped the Fish and Wildlife determine that the greater sage-grouse did not need protection under the federal Endangered Species Act. USDA has committed to invest $211 million over the next three years to maintain the momentum begun through this initiative.
EQIP’s Conservation Innovation Grant (CIG) program is authorized at $25 million in 2017. In 2015, USDA invested $20.5 million through CIG for 45 projects, including efforts to increase habitat for pollinators, develop new ways to attract private investment in natural resource conservation, give agricultural producers greater access to greenhouse gas markets, and help farmers and ranchers make their operations more resilient to climate change.
Key Performance Measure Actual Target
2012 2013 2014 2015 2016 2017 Land with conservation applied to improve water quality N/A N/A 12.3 12.7 12.0 13.5 Cropland with conservation applied to improve soil quality N/A N/A 3.1 3.0 3.0 3.0
Grazing land with conservation applied to protect and improve the resource base N/A N/A 14.8 13.9 13.9 16.0
Non-Federal land with conservation applied to improve fish and wildlife habitat quality N/A N/A 1.4 1.4 1.1 1.4
*All numbers in millions of acres.

NATURAL RESOURCES AND ENVIRONMENT 67
Agricultural Conservation Easement Program (ACEP) – ACEP has two components: agricultural land easement - under which NRCS assists eligible entities to protect agricultural land by limiting non-agricultural land uses; and wetland reserve easement - under which NRCS provides technical and financial assistance to landowners to restore, protect and enhance wetlands through the purchase of wetlands reserve easements. NRCS continues to maintain existing easements and contracts formed under the previous programs.
ACEP contributes to USDA’s Strategic Goal to ensure that the Nation’s forests and private working lands are conserved, restored, and made more resilient to climate change. ACEP’s land easement component helps farmers and ranchers keep their land in agriculture while protecting grazing uses and related conservation values by conserving grassland, including rangeland, pastureland and shrubland. The wetland easement component supports habitat for fish and wildlife, including threatened and endangered species, reducing flooding, protecting biological diversity and providing opportunities for educational, scientific and limited recreational activities. The program fosters public-private partnerships with landowners, Indian Tribes, State and local governments, and nongovernmental organizations through the use of cooperative agreements (land easements) and long term easements or 30-year contracts (wetland easements).
Regional Conservation Partnership Program (RCPP) – RCPP promotes the implementation of conservation activities by providing support for agreements between producers and partner groups. Producers receive technical and financial assistance through RCPP while NRCS and its partners help producers install and maintain conservation activities. These projects may focus on water quality and quantity, soil erosion, wildlife habitat, drought mitigation, flood control, and other regional priorities. Partners include producer associations, State or local governments, Indian Tribes, non-governmental organizations, and institutions of higher education.
Under RCPP, 35 percent of the funds and acres are reserved for eight, regional-scale Critical Conservation Areas (CCA) selected by the Secretary of Agriculture. Each of the CCAs has an overarching goal to address priority natural resource concerns common to the CCA. Competitive proposals CCA project selection were based on the degree to which they include multiple States with significant agricultural production, were covered by an existing agreement or would benefit from water quality and quantity improvement. The region’s producers need for assistance was also considered. The CCAs include the Chesapeake Bay Watershed, Great Lakes Region, Mississippi River Basin, Colorado River Basin, Longleaf Pine Range, Columbia River Basin, Prairie Grasslands Region, and California Bay Delta. Of the remaining funds and acres under RCPP, 40 percent supports projects selected through a national competitive process and 25 percent supports projects selected through a State competitive process.
Conservation Stewardship Program (CSP) – The 2008 Farm Bill replaced the Conservation Security Program with CSP, which is distinguished from the predecessor program in that it encourages participants to undertake new conservation activities in addition to maintaining and managing existing conservation activities. Also, CSP operates under an annual acreage limitation rather than a funding cap. The 2014 Farm Bill extended the authority for CSP with an annual enrollment cap of 10 million acres. In 2017, the Budget supports full enrollment for the program because CSP plays a critical role in fostering conservation efforts that address challenges posed by climate change. Through CSP, NRCS provides technical and financial assistance to producers for implementing practices on their lands that help reduce greenhouse gas emissions and sequester carbon from the atmosphere. CSP is important for addressing several critical natural resource concerns including soil quality, soil erosion, water quantity, water quality, plant resources, animal resources, and energy.

68 NATURAL RESOURCES AND ENVIRONMENT
FOREST SERVICE (FS)
2015 2016 2017Enacted Estimate Budget
$296 $291 $292233 237 234
40 40 40262 262 264
1,192 1,208 1,1971,494 1,509 1,501
1,146 1,083 1,083708 811 874362 375 384118 118 111
2,333 2,387 2,452360 364 34349 65 675 5 5
4,770 4,858 4,894303 823 0
0 700 00 0 (864)
Total, Discretionary Programs.............................................. 5,073 6,381 4,894
523 566 227102 78 84625 644 311
5,698 7,025 5,205
0 0 2250 0 380 0 62
$5,698 $7,025 $5,530
a/
Mandatory Programs:Permanent Appropriations...........................................................
FLAME Fund............................................................................
The 2017 Budget proposes to amend the Balanced Budget and Emergency Deficit Control Act of 1985, as amended, to establish a new budget framework for Wildland Fire Suppression. In this proposed new budget framework, 70 percent of the estimated 10-year average for fire suppression is funded within discretionary totals. Amounts for suppression above this level would be funded from the emergency disaster funding cap, up to a total of $864 million in FY 2017.
Trust Funds................................................................................
Transfer from mandatory LWCF funds to State & Private............Transfer from mandatory LWCF funds to Land Acquisition...........
Total, Mandatory Programs......................................................
Total, Forest Service......................................................................
Total, Forest Service Budget Authority Current Law........................
Secure Rural Schools Reauthorization..........................................
Fire Suppression Resources Under Emergency Disaster Cap a/....
Legislative Proposals:
Fire Transfer Repayment...........................................................
Total, Wildland Fire Activities................................................Capital Improvement and Maintenance.........................................Land Acquisition accounts...........................................................Other Accounts..........................................................................
Total, On-going Discretionary Programs.................................
Other Fire Operations..............................................................
Total, NFS............................................................................Wildland Fire Activities:
Preparedness...........................................................................Suppression.............................................................................Hazardous Fuels Reduction......................................................
State and Private Forestry...........................................................National Forest System:
Collaborative Forest Landscape Restoration Fund......................Recreation, Heritage and Wilderness.........................................Other NFS Activities................................................................
Budget Authority(Dollars in Millions)
Program
Discretionary Accounts:Forest and Rangeland Research ..................................................

NATURAL RESOURCES AND ENVIRONMENT 69
National Forest System
31%
State & Private Forestry
5%
Forest and Rangeland Research
6%
Capital Improvement & Maintenance
7%
Land Acquisition1%
Wildland Fire Management
50%
2017 Forest Service Discretionary Budget AuthorityTotal = $4.9 Billion
For 2017, the total request for FS discretionary activities is $4.9 billion. The 2017 Budget continues to support a strategy to address catastrophic fire risk by providing a stable source of suppression funding while increasing the capacity to reduce fire risk by making public and private forested landscapes more connected and contiguous through expanded support for the Land and Water Conservation Fund (LWCF) and healthier and more resilient to wildland fire and a changing climate with continued support for the Collaborative Forest Landscape Restoration Program. Expanded support for Landscape Scale Restoration provides support to States to achieve conservation priorities on non-Federal lands often adjacent to the National Forest System lands. The 2017 Budget provides continued support for the America’s Great Outdoors Initiative and focuses on improving water quality in priority landscapes, addressing the greatest emerging threats to forest health and sustainability, creating green jobs in rural communities, and providing a sustainable and responsible way to fund wildland fire suppression. The 2017 Budget will provide opportunities for America’s 4th graders connect to natural landscapes through the “Every Kid in a Park” program and will help young people and returning veterans to understand the importance of participation in protecting and enhancing America’s Great Outdoors while learning valuable job skills through participation in the 21st Century Conservation Service Corps (21CSC).
Forest and Rangeland Research – For 2017, $292 million is proposed for Forest and Rangeland Research. FS maintains the world's largest forest research organization. While its broad mission is to develop the knowledge and technology needed to enhance the economic and environmental values of all of the Nation's forests, the program also supports the specific research needs that arise from managing the 193 million acres of NFS. Other areas of research include forest disturbance prediction and response, watershed management and restoration, urban natural resource stewardship, and inventory and analysis. The 2017 Budget provides $77 million for Forest Inventory and Analysis (FIA). This investment will strengthen the collection, coordination, and assessment of field inventory data, creating a robust landscape scale inventory and analysis effort in all 50 States, the U.S. Territories, and continue efforts to introduce FIA in interior Alaska. In 2017, FS will continue its important work stimulating the creation of

70 NATURAL RESOURCES AND ENVIRONMENT
commercial and industrial markets for presently underutilized or un-merchantable forest resources resulting from restoration and fuel treatment operations. Coupled with the permanent authorization for Stewardship End Result Contracting from the 2014 Farm Bill, this work will create value for landowners while creating sustainable natural resource jobs in rural communities throughout the Nation.
State and Private Forestry – Through S&PF programs, FS addresses forest health concerns across more than 750 million acres of Federal, State, and private lands, creating a more connected and contiguous forest landscape. For 2017, $234 million is proposed for S&PF programs. The Budget proposes $24 million for Landscape Scale Restoration to fund nationally competitive, multi-jurisdictional projects that target issues and landscapes of national importance and require coordination among multiple S&PF programs, an increase of nearly $10 million over the 2016 enacted level. The 2017 Budget provides $8 million for FS’ International Programs to bolster the agency’s efforts to decrease illegal logging in support of the Nation’s domestic forest products industry, to protect the NFS and surrounding forested landscapes from non-native invasive species, to complement the agency’s domestic investment in habitat restoration by ensuring protected area management abroad, and to inform international policy discussions on climate change. The Forest Legacy Program (FLP), an important tool in keeping working forests as forests, cost-shares the purchase of conservation easements to protect nationally prioritized forest lands from development. FLP will be funded at just over $62 million in discretionary funding. Additionally, $38 million is proposed for FLP as a transfer from LWCF through a proposed legislation. Conserving landscapes and meeting the present-day needs of local communities requires collaboration among all stakeholders, including private landowners. LWCF supports voluntary conservation partnerships with private landowners that help keep working farms, forests and ranches in production in rural communities across America.
National Forest System (NFS) – FS manages over 193 million acres of public land in 44 States and Puerto Rico, collectively known as the NFS. These lands are managed for multiple uses and on a sustained-use basis and represent a vital natural legacy. The agency has placed a focus on working collaboratively to restore forests for the benefit of watersheds, engaging communities to help Americans reconnect to the outdoors, and re-establishing vibrant local economies.
For 2017, total funding for NFS is proposed at $1.5 billion, focusing resources on programs that ensure the lands in our care are healthier and more resilient to climate change and the impact of wildland fire. The wildfire suppression funding strategy being proposed in this Budget significantly and positively impacts funding for NFS by funding wildfires as disasters, and reducing the burden on FS conservation programs by eliminating the need for fire transfers. This strategy will minimize the shifting of NFS resources to fire suppression and thereby enable full implementation of all non-fire programs including restoration, watershed health, and recreation.
This Budget supports the initiative “Every Kid in a Park: Discover America’s Public Lands and Waters” (EKiP). By expanding the agency’s existing Conservation Education program, up to an additional 400,000 4th graders across the Nation will experience America’s public lands by learning about critical resource issues, wildlife viewing, and forest management, while having opportunities for play and physical activities. Additional support for the award winning “Project Learning Tree” and the service-learning program “Green Schools!” will mean enhanced opportunities to incorporate meaningful outdoor experiences in school programs for as many as 100,000 4th graders, particularly children in urban areas. FS support for EKiP will help develop the next generation of the Nation’s environmental stewards. In addition, NFS funding as well as other FS funding will continue to support more than 10,000 job and training opportunities for

NATURAL RESOURCES AND ENVIRONMENT 71
youth and veterans as part of the 21CSC. Through the 21CSC, Federal and non-Federal partners connect participants to meaningful natural and cultural resource work on public lands, helping agencies to accomplish resource outcomes while also developing the next generation of stewards and natural resource professionals.
The 2017 Budget increases support for Law Enforcement and Investigations by $5 million over the 2016 enacted level. These additional resources will address illegal marijuana grow site reclamation, primarily in California, with funding for critical surge and eradication operations and grow site clean-up. Clean-up activities will include the removal of irrigation pipes, the removal and disposal of hazardous materials, and the removal of any structures. These lands will be made safe once again for the public to enjoy.
Key Performance Measure Actual Target
2012 2013 2014 2015 2016 2017 Acres treated annually to sustain or restore water function and resilience (millions of acres) 2.570 2.533 2.906 3.100 2.900 2.900
Volume of timber sold (billions of board feet) 2.644 2.610 2.831 2.867 3.200 3.200
Wildland Fire Activities – Over 44 million homes in 70,000 rural communities are at risk of wildland fire. Through the Wildland Fire Activities, FS protects life, property and natural resources in these rural communities and on 193 million acres of NFS land and an additional 20 million acres of adjacent State and private lands through fee or reciprocal protection agreements. For 2017, total Federal funding for wildland fire management activities is proposed at $2.45 billion, plus an additional $864 million for suppression activities through the proposed wildfire suppression cap adjustment, for a total of $3.3 billion.
There is a need for fundamental change in how wildfire suppression is funded in order to reduce fire risk, manage landscapes more holistically, and increase resiliency of the Nation’s forests and rangelands and the communities that border them. With the cost of fire management having grown from 13 percent of the agency’s budget in the 1990s to over 56 percent in 2016, it is clear that the cost of wildland fire suppression is subsuming the agency’s budget for proactive land management and jeopardizing its ability to implement its full mission. Growth in the number and severity of fires and longer fire seasons, combined with an ever expanding wildland urban interface (WUI) where life and property are at risk, routinely cause suppression costs to exceed amounts provided in annual appropriations, requiring FS to transfer funds from other programs to cover those costs and starve non-fire accounts. The chronic depletion of critical restoration and non-fire programs as fire suppression costs rise is felt across critical programs nationwide.
The Budget proposes a budget-neutral alternative funding approach that recognizes that catastrophic wildland fires should be considered disasters, similar to hurricanes and tornados, and funded in part by additional budget authority provided through a wildfire suppression cap adjustment. In 2017, the Budget proposes discretionary funding for wildland fire suppression at a level equal to 70 percent of the 10-year average suppression costs, which reflects the level of spending associated with suppression of 98 percent of wildfires. In addition, the Budget includes up to $864 million under a disaster funding cap to meet suppression needs above the base appropriation. This strategy provides increased certainty in addressing growing fire suppression costs and allows FS to stabilize and invest in non-suppression programs that will more

72 NATURAL RESOURCES AND ENVIRONMENT
effectively restore forested landscapes, treat forests for the increasing effects of climate change, better inform decision makers on the risks and trade-offs associated with wildfire management decisions, and prepare communities in the WUI to avert and minimize the destructive impact of future wildfires. The Budget focuses hazardous fuels treatments in WUI areas that are identified in Community Wildfire Protection Plans and are highest priority, with performance plans to focus hazardous fuels treatments to reduce the risk of catastrophic fire on 1.8 million WUI acres. Restoration in WUI areas supports the direction provided by stakeholders engaged in the National Wildfire Management Strategy.
Further, FS will continue efforts to modernize its aging aviation resources. The National Defense Authorization Act of 2014 provided for the transfer of surplus aircraft directly to the FS, including up to 15 C-23B+ Sherpa and up to seven C-130H aircraft from other Executive Branch Agencies. For the 2017 fire season, with retrofits to be completed by both the Department of Defense and FS, one of the seven C-130H aircraft is expected to be in service as a next generation airtanker capable of delivering over 3,000 gallons of fire retardant, and up to 15 of the Sherpa aircraft will be delivering smokejumpers and supplies by parachute to wildland firefighters on the ground. These aircraft will be owned by FS, with contracted operation and maintenance, and supplemented with diverse, privately sourced aviation assets to create a modern and flexible fleet capable of providing critical wildland fire suppression support.
Key Performance Measure Actual Target
2012 2013 2014 2015 2016 2017 Acres of Wildland Urban Interface hazardous fuels treated to reduce the risk of catastrophic wildfire (millions of acres) 1.867 1.773 1.725 1.577 1.800 1.800
Capital Improvement and Maintenance (CIM) – The CIM account funds construction and maintenance of critical infrastructure on the NFS, including buildings, recreation sites, facilities, roads, and trails. For 2017, total funding for this work is proposed at $343 million.
By utilizing privately raised resources and an investment from CIM in 2017, FS will put considerable emphasis on improving infrastructure in the 10 national monuments administered by the agency, particularly the recently designated San Gabriel Mountains National Monument in Southern California. Maintenance on the national monuments will include improved interpretive resources, increased trash removal, trail maintenance, updated facilities, and better connections through trails and public transportation facilities.
The CIM budget contributes to a successful recreation program. Nearly half of the $71.6 million budget for Facilities directly supports over 10,000 recreation sites developed by FS. The public use of these recreation sites helps supports the 143,000 full-time and part-time jobs in communities near the national forests and grasslands. Recreation on the NFS contributes to the more than $10 billion in income that outdoor recreation generates for the communities near our national forests and grasslands. FS currently manages 372,000 miles of roads, 157,000 miles of trails, 6,200 bridges, over 26,750 recreation sites, 500 dams, 16,000 administrative buildings, and 9,575 water/wastewater systems. During 2017, FS will perform maintenance work on 12,000 miles of “high clearance” roads, 30,000 miles of passenger car roads, and 55,000 miles of trails.

NATURAL RESOURCES AND ENVIRONMENT 73
Land Acquisition – The Land Acquisition program protects a variety of resources, including important habitat for at risk game species, while conserving open space and reducing land fragmentation. Conserving landscapes and meeting the present-day needs of local communities requires collaboration among all stakeholders, including private landowners. LWCF supports voluntary conservation partnerships with private landowners that help keep working forests and ranches in production so they can support rural communities across America. Relying entirely on earnings from offshore oil and gas leases, LWCF uses no taxpayer dollars. Over the last 51 years and through FS Land Acquisition alone, LWCF has invested over $2 billion across the country, stimulating a sustainable recreation economy for our rural communities.
By connecting a fragmented NFS through the strategic acquisition of key in-holdings and Congressionally designated areas, the program provides critical administrative efficiencies to the agency, such as lowering the expenditures associated with boundary line maintenance and improving agency access to the NFS and adjacent lands for the purpose of restoration and wildland fire suppression. The public also benefits through enriched visitor access to the national forests and grasslands, resulting in a greater diversity of recreational opportunities. Nearly $28 million of discretionary funding from the LWCF will support the agency’s initiative to target high priority FS acquisitions focused on improving recreational opportunities of all kinds, restoring resilient ecosystems, and increased hunter/angler access. An additional $4.7 million will acquire recreational access parcels to improve both motorized and non-motorized access for all types of NFS recreation opportunities, including hunting, fishing, climbing, hiking, and other uses bolstering the recreation economy and the 880,000 jobs associated with outdoor recreation on all public and private lands.
For 2017, the Budget proposes $66 million for Land Acquisition accounts, plus a request for $62 million as a transfer from LWCF, including $4.7 million in discretionary and $4 million in mandatory funding for priority recreational access. This $128 million in funding will advance America’s Great Outdoors efforts to further locally-supported planning initiatives to prevent forest fragmentation while making more outdoor areas available for public enjoyment. The Budget will enable FS to acquire up to 22,539 acres with discretionary funds and up to 41,699 with mandatory funds. In a joint USDA-DOI legislative proposal, the 2017 Budget proposes that LWCF will be fully funded at $900 million in mandatory funding beginning in 2018, greatly enhancing the program’s capacity to provide funds and matching grants to Federal, State, and local governments to purchase land, water, and wetlands for the benefit of all Americans. Full and permanent funding for LWCF provides the financial certainty needed to build local and community partnerships in conservation and optimize valuable investments critical to a resilient landscape and sustainable rural communities.
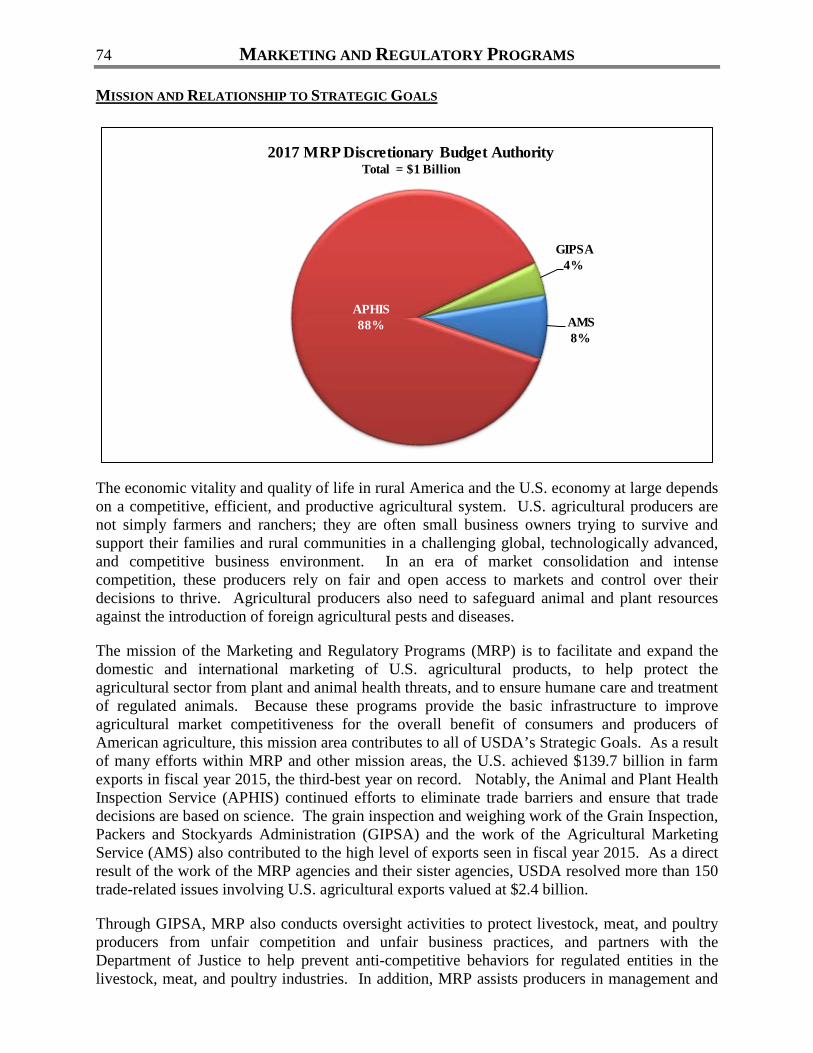
74 MARKETING AND REGULATORY PROGRAMS
MISSION AND RELATIONSHIP TO STRATEGIC GOALS
AMS8%
APHIS88%
GIPSA4%
2017 MRP Discretionary Budget AuthorityTotal = $1 Billion
The economic vitality and quality of life in rural America and the U.S. economy at large depends on a competitive, efficient, and productive agricultural system. U.S. agricultural producers are not simply farmers and ranchers; they are often small business owners trying to survive and support their families and rural communities in a challenging global, technologically advanced, and competitive business environment. In an era of market consolidation and intense competition, these producers rely on fair and open access to markets and control over their decisions to thrive. Agricultural producers also need to safeguard animal and plant resources against the introduction of foreign agricultural pests and diseases.
The mission of the Marketing and Regulatory Programs (MRP) is to facilitate and expand the domestic and international marketing of U.S. agricultural products, to help protect the agricultural sector from plant and animal health threats, and to ensure humane care and treatment of regulated animals. Because these programs provide the basic infrastructure to improve agricultural market competitiveness for the overall benefit of consumers and producers of American agriculture, this mission area contributes to all of USDA’s Strategic Goals. As a result of many efforts within MRP and other mission areas, the U.S. achieved $139.7 billion in farm exports in fiscal year 2015, the third-best year on record. Notably, the Animal and Plant Health Inspection Service (APHIS) continued efforts to eliminate trade barriers and ensure that trade decisions are based on science. The grain inspection and weighing work of the Grain Inspection, Packers and Stockyards Administration (GIPSA) and the work of the Agricultural Marketing Service (AMS) also contributed to the high level of exports seen in fiscal year 2015. As a direct result of the work of the MRP agencies and their sister agencies, USDA resolved more than 150 trade-related issues involving U.S. agricultural exports valued at $2.4 billion.
Through GIPSA, MRP also conducts oversight activities to protect livestock, meat, and poultry producers from unfair competition and unfair business practices, and partners with the Department of Justice to help prevent anti-competitive behaviors for regulated entities in the livestock, meat, and poultry industries. In addition, MRP assists producers in management and

MARKETING AND REGULATORY PROGRAMS 75
domestic marketing by providing market trend analysis and business and marketing tools through the work of the AMS. MRP also helps increase the competitiveness of the agricultural sector by working to protect the Nation’s agriculture from pests and diseases, thereby increasing the efficiency of production.
The Administration’s efforts over the years have made a lasting impact on markets important to small and mid-sized producers. Through the National Organic Program, AMS has provided critical support needed to help fuel double-digit growth in the organic consumer market. In 2015, the retail market for organic products was valued at $39.1 billion by the Organic Trade Association and continues to grow. AMS has worked to expand market access for organic farms and businesses. Today, the industry encompasses a record 19,474 certified organic businesses.

76 MARKETING AND REGULATORY PROGRAMS
ANIMAL AND PLANT HEALTH INSPECTION SERVICE (APHIS)
2015 2016 2017Enacted Estimate Budget
$35 $35 $372 2 2
52 55 5593 92 9220 20 204 4 6
24 25 2516 16 1632 37 3210 10 20
288 296 305
27 28 3011 11 89 9 9
27 27 2821 21 21
156 164 14654 54 46
305 314 288
90 101 8619 19 19
109 120 105
16 16 1619 19 1935 35 35
b/ b/ b/17 17 4517 17 45
754 782 778Total, Safeguarding and Emergency Preparedness.....................
Total, Regulatory Services..................................................Emergency Management:
Contingency Fund.................................................................Emergency Preparedness & Response...................................
Total, Emergency Management..........................................
Wildlife Services Methods Development.................................Total, Wildlife Services.......................................................
Regulatory Services:Animal & Plant Health Regulatory Enforcement.....................Biotechnology Regulatory Services........................................
Total, Plant Health.............................................................Wildlife Services:
Wildlife Damage Management...............................................
Agricultural Quarantine Inspection (Appropriated)..................Cotton Pests.........................................................................Field Crop & Rangeland Ecosystems Pests............................
Plant Protection Methods Development..................................Pest Detection......................................................................
Specialty Crop Pests a/........................................................
Total, Animal Health..........................................................Plant Health:
Equine, Cervid & Small Ruminant Health………………………National Veterinary Stockpile................................................Swine Health........................................................................
Budget Authority(Dollars in Millions)
Program
Discretionary:Safeguarding and Emergency Preparedness/Response:
Animal Health:Animal Health Technical Services..........................................Aquatic Animal Health..........................................................Avian Health........................................................................
Tree & Wood Pests..............................................................
Veterinary Biologics..............................................................
Cattle Health........................................................................
Veterinary Diagnostics..........................................................Zoonotic Disease Management..............................................

MARKETING AND REGULATORY PROGRAMS 77
2015 2016 2017Enacted Estimate Budget
14 15 2022 22 2236 37 4229 29 2952 52 52
871 900 9013 3 3
874 903 9041,007 0 01,881 903 904
167 207 2199 10 10
58 58 6358 58 63
234 275 292$2,115 $1,178 $1,196
a/
b/ Less than $500,000.
c/
d/ Total adjusted collections are $634 million in 2015, $723 million in 2016 and $754 million in 2017. Of the total, $467 million, $516 million and $535 million are transferred to the Department of Homeland Security in 2015, 2016 and 2017 respectively. Figures reflect impact of sequestration in 2015 and 2016.
Program
Plant Pest and Disease Management and Disaster Prevention....Total, Farm Bill Programs......................................................
Total, Mandatory Programs.........................................................Total, APHIS Programs.................................................................
Mandatory:Agricultural Quarantine Inspection (AQI) Fees d/........................Trust Funds and User Fees..........................................................Farm Bill:
Buildings and Facilities................................................................Total, APHIS Discretionary Programs......................................
Emergency Funding (CCC) and other transfers c/........................Total, APHIS Discretionary Programs......................................
Animal Welfare..........................................................................Agency-Wide Activities (including GSA Rent/DHS Security)........Total, Salaries and Expenses........................................................
Safe Trade and International Technical Assistance:Agriculture Import/Export.........................................................Overseas Technical & Trade Operations...................................
Total, Safe Trade and International Technical Assistance........
FY 2015 emergency transfers from the Commodity Credit Corporation (CCC) to control and eradicate highly pathogenic avian influenza and bovine tuberculosis.
Includes $5.5 million provided through General Provision 748 of the 2016 Consolidated Appropriations Act for one-time control and management and associated activities directly related to the multiple-agency response to citrus greening.
APHIS works cooperatively with State and local agencies, private groups, and foreign governments to protect the safety of the Nation’s agriculture.
The 2017 Budget proposes a discretionary appropriation of about $904 million, of which approximately $901 million is for programmatic operations and about $3 million for the Buildings and Facilities account.
APHIS supports, among others, the Department’s strategic goal to ensure all children have access to safe, nutritious, and balanced meals by minimizing major diseases and pests that would otherwise hinder agricultural production.

78 MARKETING AND REGULATORY PROGRAMS
Key Performance Measure Actual Target
2012 2013 2014 2015 2016 2017 Cumulative number of actions taken to deregulate biotechnology products based on scientific determination that they do not pose a plant risk to agriculture 93 102 109 117 122 126
Safeguarding and Emergency Preparedness/Response – The Budget includes discretionary appropriations of nearly $778 million for safeguarding and emergency preparedness and response. These safeguarding and emergency programs, specifically for animal health and specialty crops, protect $193 billion of livestock, poultry, and specialty crops on an annual basis. To combat any sudden, urgent and unforeseen pest and disease outbreaks, the Secretary retains authority to transfer funds from the CCC or other USDA accounts. The Budget provides technical and financial support to help control or eradicate a variety of animal and plant health threats:
• Animal Health-Zoonotic Disease Management – The Budget includes a $10 million increase to support APHIS’ contribution to a Government-wide initiative to address antimicrobial resistance in pathogens of humans and livestock. With the development of new antibiotics being limited and the growth of resistance to existing antibiotics, this increase is essential to stem the tide of antimicrobial resistance. With the requested increase, APHIS will enhance the understanding of on-farm levels of antibiotic usage by increasing data collection, developing monitoring programs, and leveraging other data sources from existing surveillance systems. These activities will enhance the understanding of on-farm levels of antibiotic usage and the impact on antimicrobial resistance levels. These activities will be coordinated with other Federal agencies for a more integrated Federal response effort.
• Animal Health-Other Initiatives – The Budget includes increased funding to support animal health readiness activities. Specifically, APHIS will use $1.7 million to cover the increased cost to acquire foot-and-mouth disease (FMD) vaccines for the FMD Vaccine Bank. This funding will also allow the movement away from traditional antigen stockpiles held by the government to manufacturer-held vaccine stocks. The Budget also includes $1.5 million to enable the National Select Agent Registry to accept electronic submissions from stakeholders. Both of these increases improve the knowledge available to APHIS when the agency responds to animal health outbreaks. In fiscal year 2015, USDA worked with State and industry partners to eliminate the highly pathogenic influenza virus on 232 infected premises and depopulated, disposed, and appraised the value of approximately 50 million birds. The USDA costs alone for response were about $1 billion. In light of the recent outbreak within the poultry industry, avian health funding, which supports surveillance, is being maintained. Funding for cattle health is also being maintained. APHIS will continue working with the National Animal Health Laboratory Network on the highest-priority animal health issues.
• Plant Health – The Budget includes a total of about $288 million to protect plant health. The Budget includes an increase of $1.4 million for the Agricultural Quarantine Inspection program to provide the necessary staffing, canine teams, and equipment replacement needed to adequately inspect baggage bound for the continental U.S. from Hawaii and Puerto Rico. The Budget proposes decreases to the funding provided by the Federal Government for Tree and Wood Pests and Specialty Crop Pests programs of about $8 million and $12 million, respectively. Those cooperators who directly benefit from program activities will need to

MARKETING AND REGULATORY PROGRAMS 79
increase contributions to achieve the same level of program operations. Even with the proposed decreases, APHIS will continue to pay between 47 percent and 80 percent of the costs of the programs. The Budget includes a decrease stemming from successes in reducing acreage infested with cotton pests. APHIS will continue monitoring for boll weevil to ensure quick detection of any reintroductions. Through APHIS’ cooperative work with the States and the cotton industry, USDA is conducting the final year of surveys to confirm eradication of the pink bollworm.
• Wildlife Services – The Budget includes $105 million, a decrease of $15 million, for Wildlife Services. APHIS will continue to devote $20 million to the national control program for feral swine. These invasive species are associated with an estimated $1.5 billion annually in damages to pastures, agricultural crops, and other natural areas. APHIS will continue to contribute to and provide national coordination of efforts to reduce the risks and damage caused by feral swine. In 2015, APHIS successfully eliminated feral swine in four states. The Budget includes a decrease for oral rabies vaccination in States outside the established barrier zone which will now be offered on a reimbursable status. In recent years, canine rabies has been eliminated from coyotes, gray fox rabies is nearly eliminated from Texas, and raccoon rabies are contained in the eastern United States. The Budget also includes a reduction in activities that address wildlife that are potentially damaging to natural resources and public roadways. Those localities that directly benefit from these services will need to increase contributions to achieve the same level of program operations. APHIS is committed to working with relevant States and localities to provide these services on a reimbursable basis. The Budget also requests a decrease of $5.8 million provided in 2016 as a one-time capital investment in aircraft equipment.
• Regulatory Services – The Budget includes about $35 million for Regulatory Services, which will maintain current services. This includes funding for the Animal and Plant Health Regulatory Enforcement program, which promotes the integrity of APHIS programs by providing effective investigative and enforcement services. This also funds Biotechnology Regulatory Services activities at the current level. In 2015, USDA reduced the average time to prepare a plant pest risk assessment by over a year, while almost eliminating the backlog of petitions, and completed eight petitions, surpassing its goal of five determinations of nonregulated status.
• Emergency Management – A total of almost $45 million is requested to support prevention, preparation, response, and recovery efforts resulting from animal emergencies, an increase of about $28 million. This increase will allow APHIS to improve its animal health readiness capacity by hiring additional staff to effectively address large animal health events. With recent budget cuts, this area of the agency has been diminished and the need to rebuild it is critical. In addition, APHIS will further develop activation and response plans and more fully test the readiness of their implementation which improves the depth of trained response personnel. Following the challenges faced in the 2015 highly pathogenic avian influenza (HPAI) outbreak, APHIS will develop prototypes and scalable plans focused on the depopulation, disposal, and decontamination of infected facilities. The request also funds the development of a protocol which will provide emergency use of National Guard mobile diagnostic laboratories. APHIS will provide the staff level needed to accomplish mission critical activities for the Select Agents program, such as providing inspection and training on requirements.
• Safe Trade and International Technical Assistance – The 2017 Budget includes a total of almost $42 million to facilitate safe U.S. agricultural trade. This includes a $4.5 million

80 MARKETING AND REGULATORY PROGRAMS
increase to enable importers to file Lacey Act declarations through an automated system and maximize the number of products reviewed for compliance with the 2008 amendments to the Lacey Act. These efforts should help prevent the importation of products derived from illegally harvested timber. APHIS’ technical support is key to facilitating trade. For example, 280 shipments were released during fiscal year 2015 as a direct result of APHIS intervention.
• Animal Welfare – The 2017 Budget maintains the level of funding for Animal Welfare activities. APHIS will continue to support activities related to the protection of animal species covered under the Animal Welfare Act and the Horse Protection Act.
• User Fees – In addition to discretionary funding, APHIS collects user fees to cover costs related to agricultural quarantine and inspections that occur at ports of entry. A portion of these collections are provided to the Department of Homeland Security’s Customs and Border Protection (CBP) to conduct front line inspections at points of entry. With retained funding, APHIS supports international trade by assessing the plant and animal health risks associated with such trade. APHIS also develops regulations to protect agricultural health; inspects and quarantines imported plant propagative materials; trains agricultural inspectors and detector dog teams; and provides the scientific support necessary to carry out these activities and those carried out by CBP. APHIS will submit legislative proposals to authorize the collection of about $9 million in user fees for Animal Welfare activities, about $7 million in user fees for Veterinary Biologics activities, and $4 million in user fees for Biotechnology Regulatory Services activities. As recipients of these services are the direct beneficiaries of many of the services provided by the respective division of APHIS, the proposed user fees will place a portion of the costs of providing these services on the recipient rather than the U.S. taxpayer.
• Buildings and Facilities – The Budget proposes $3 million in funding for general repairs and maintenance of APHIS buildings.

MARKETING AND REGULATORY PROGRAMS 81
AGRICULTURAL MARKETING SERVICE (AMS)
2015 2016 2017Enacted Estimate Budget
Discretionary:Marketing Services:
Market News......................................................................... $33 $34 $35Egg Surveillance and Standardization....................................... 8 8 8Market Protection and Promotion............................................ 32 31 31Transportation and Market Development.................................. 8 8 8Total, Marketing Services........................................................ 81 81 82Payments to States and Possessions........................................ 1 1 1
Total, Discretionary Programs.............................................. 82 82 83Mandatory:
Funds for Strengthening Markets, Income, and Supply (Section 32):Commodity Program Expenses................................................ 764 791 786Section 32 Administrative Funds:
Marketing Agreements and Orders (MA&O)........................ 19 20 21Commodity Purchase Services............................................. 35 34 35
Total, Section 32 Administrative Funds............................... 54 54 56Total, Section 32 Funds........................................................... 818 845 842
User Fees:Perishable Agricultural Commodities Act................................. 11 11 11Commodity Grading Services................................................... 154 155 157
Total, User Fee Funded Programs........................................ 165 166 168Trust Funds:
Wool Research, Development & Promotion ............................ 2 2 2Farm Bill:
Specialty Crop Block Grants.................................................... 67 68 73Farmers Market and Local Food Promotion Program................ 28 28 30National Organic Certification Cost-Share................................ 11 11 12Agricultural Mgmt Assistance, Organic Cost-Share.................. (1) (1) (1)
Total, Farm Bill Programs.................................................... 106 107 114Total, Mandatory Programs........................................................ 1,091 1,120 1,126
Total, AMS Programs................................................................... $1,173 $1,202 $1,209
Program
Budget Authority(Dollars in Millions)
The mission of AMS is to facilitate the competitive and efficient marketing of agricultural products in domestic and international markets, while ensuring fair trading practices. AMS programs aid producers in meeting the changing demands of consumers as well as domestic and international marketing practices.
The AMS 2017 Budget proposes a discretionary appropriation of about $83 million. The 2017 Budget maintains current activity, including an increase for pay.

82 MARKETING AND REGULATORY PROGRAMS
Marketing Services – AMS administers a variety of programs that enhance the marketing and distribution of agricultural products. Activities include the collection, analysis, and dissemination of market information; surveillance of shell egg handling operations; development of commodity grade standards; protection of producers from unfair marketing practices; statistical sampling and analysis of commodities for pesticide residues; development and enforcement of organic standards; and research and technical assistance aimed at improving efficiency of food marketing and distribution, including through the development of the strong local and regional food systems.
The Budget proposes $35 million for Market News to support data collection and reporting of commodity information. This work provides timely, accurate, and unbiased information on cotton, dairy, fruits, vegetables, specialty crops, livestock, grain, and poultry. Market News provides valuable market intelligence about emerging agricultural sectors, including organic commodities, Farm-to-School, and farmers markets and food hubs.
The Budget proposes $8 million for Egg Surveillance and Standardization. The Shell Egg Surveillance Program inspects registered shell egg facilities and monitors the disposition of restricted eggs to limit the number of restricted eggs in consumer channels. The program prevents eggs not meeting minimum U.S. standards from entering the consumer marketplace.
The Budget proposes $31 million for Market Protection and Promotion, including:
• $2.3 million for the Federal Seed Act Program, which promotes fair competition in the seed trade, by among other requirements, ensuring seed is accurately labeled.
• $4.7 million for the Country of Origin Labeling Program (COOL), which requires that retailers notify their customers of the country of origin of covered commodities, and that the method of production for fish and shellfish be noted at the final point of sale. The 2016 Consolidated Appropriations Act amended the Agricultural Marketing Act to eliminate COOL requirements for beef and pork, but origin labeling for all other covered commodities remains in effect. The program will continue education and compliance monitoring activities for all of the remaining covered commodities and address non-compliance as appropriate.
• $9.1 million for the National Organic Program (NOP), which is key to meeting the expanding consumer demand for organically-produced goods by supporting the development, maintenance, and enforcement of national standards governing the production and handling of organic agricultural products. The 2014 Farm Bill also provided funding for the National Organic Certification Cost-Share Program to support the cost of organic certification.
• $15.1 million to conduct the Pesticide Data Program (PDP), which is the main supplier of data regarding actual levels of pesticide residues on commodities. PDP works collaboratively with the Environmental Protection Agency and the Centers for Disease Control and Prevention to target residue data collection related to high risk commodities and vulnerable populations.
The Budget requests $8 million for Transportation and Market Development. Funding supports the USDA strategic goal to assist rural economies to create prosperity by better connecting consumers with local producers so they are self-sustaining, repopulating, and economically thriving. This work supports local and regional food systems that create new business opportunities for farmers and ranchers. Funding for transportation and market development will also strengthen the activities carried out under the Farmers Market and Local Foods Promotion Program as authorized by the 2014 Farm Bill.

MARKETING AND REGULATORY PROGRAMS 83
Payments to States and Possessions – Under the Federal-State Marketing Improvement Program (FSMIP), AMS provides matching funds to State Departments of Agriculture for projects aimed at improving marketing efficiency, reducing marketing costs for producers, and lowering food costs for consumers. The Budget requests a total of $1.2 million for the program.
Section 32 Funds – Section 32 of the Act of August 24, 1935, authorizes the appropriation for each fiscal year of an amount equal to 30 percent of the gross receipts from duties collected under customs laws of the United States during the preceding calendar year. These funds are used to encourage domestic consumption of non-price supported perishable commodities and re-establish farmers’ purchasing power through a variety of activities, including: purchases of commodities and removal of surplus commodities from the marketplace for distribution to Federal nutrition assistance programs such as the National School Lunch Program and diversion programs that bring production in line with demand. Section 32 funds are also used to finance the administrative costs associated with the purchase of commodities and developing the specifications used for food procurement throughout the Federal government. The 2017 Budget requests a total of about $35 million for administration of commodity purchasing.
Marketing Agreements and Orders help stabilize market prices and the supply of milk and certain specialty crops. The Orders are administered locally by marketing order committees and market administrators. Local activities are funded through assessments on regulated handlers. For 2017, $21 million will be used to finance Federal oversight activities for marketing agreements and orders at the national level.
User Fee Programs – AMS operates programs funded through license or user fees. The Commodity Grading Services program provides voluntary commodity grading and classing services for dairy products, fresh and processed fruits and vegetables, meat and meat products, poultry, eggs, tobacco, and cotton. AMS also offers certification services to verify contract specifications on quantity and quality, acceptance and condition inspection services for all agriculture commodities upon request, and export certification services for a number of commodities. AMS’ audit verification services review production and quality control systems, and verify industry marketing claims. In addition, AMS enforces the Perishable Agricultural Commodities Act which prohibits unfair and fraudulent practices in the marketing of perishable agricultural commodities by regulating shippers, distributors, and retailers. Full and prompt payment for fresh fruits and vegetables is a key objective of the program.
Specialty Crop Block Grant Program – The Specialty Crop Block Grant Program provides funds to States to enhance the competitiveness of specialty crops. Specialty crops are defined as fruits, vegetables, tree nuts, dried fruits, horticulture, and nursery crops (including floriculture). The 2014 Farm Bill provides $73 million for this program in 2017.
Farmers Market and Local Food Promotion Programs –This program supports domestic consumption of and access to locally and regionally produced agricultural products, and development of new market opportunities for farm and ranch operations serving local markets. Of the funding provided, $15 million will be used to support direct producer-to-consumers marketing efforts and $15 million will be used to support local/regional supply chain activities, including processing, aggregating, storing or distributing local and regional food.

84 MARKETING AND REGULATORY PROGRAMS
GRAIN INSPECTION, PACKERS AND STOCKYARDS ADMINISTRATION (GIPSA)
2015 2016 2017Enacted Estimate Budget
Discretionary:Salaries and Expenses:
Grain Regulatory Program..................................................... $20 $20 $20Packers and Stockyards Program.......................................... 23 23 23
Total, Salaries and Expenses............................................... 43 43 43Mandatory:
Inspection and Weighing User Fees....................................... (47) (52) (58)Total, GIPSA Programs..................................................... $90 $95 $101
Budget Authority(Dollars in Millions)
Program
GIPSA establishes the official U.S. standards and quality assessment methods for grain and related products, regulates handling practices to ensure compliance with the U.S. Grain Standards Act and Agricultural Marketing Act of 1946, and manages a network of Federal, State, and private laboratories that provide impartial, user-fee funded official inspection and weighing services. The agency regulates and monitors the activities of dealers, market agencies, stockyard owners, live poultry dealers, packer buyers, packers, and swine contractors in order to detect prohibited unfair, unjust, discriminatory, deceptive, or anti-competitive practices in the livestock, meat and poultry industries. The agency also reviews the financial records of these entities to promote the financial integrity of the livestock, meat, and poultry industries. As such, its efforts help USDA enhance international competitiveness of American agriculture and the economic viability and sustainability of rural and farm economies.
For 2017, the Budget includes a total budget authority for GIPSA of $101 million, of which $58 million is estimated to come from authorized inspection and weighing user fees. Of the discretionary appropriation request, about $20 million is allocated to the Grain Regulatory Program for standardization, compliance, and methods development activities; and about $23 million is for the Packers and Stockyards Program. GIPSA will submit a legislative proposal to authorize the collection of fees for the development of grain standards and to amend the Packers and Stockyards Act to provide authority to collect license fees to cover the cost of the program. The Budget also seeks to remove the obligation cap for inspection and weighting user fees to ensure alignment with trade activity. The 2017 Budget maintains current activity with an increase for pay costs.

RESEARCH, EDUCATION, AND ECONOMICS 85
MISSION AND RELATIONSHIP TO STRATEGIC GOALS
ARS43%
ERS3%
NIFA48%NASS
6%
2017 REE Discretionary Budget AuthorityTotal = $2.9 Billion
The World Bank reports that the world needs to produce at least 50 percent more food to feed nine billion people by 2050, but that climate change could cut crop yields by more than 25 percent. USDA is committed to addressing the challenges of food security, as well as food safety, improving human health and nutrition, building the bioeconomy, and doing this in a way that is sustainable over the long term and resilient to climate change. These priorities for research are addressed by both the intramural and extramural agencies at USDA, and each is a complex challenge that requires multi-faceted approaches to research. USDA brings together expertise from animal science, veterinary medicine, food safety, nutrition, wildlife, plant science, economics, ecology, biotechnology, and other agricultural and health disciplines to develop innovative approaches to today’s challenges.
The results of long-term research investment are striking. Whether measured as crop yield per acre, milk and meat yield per animal, or average output per farm worker, the productivity of U.S. agriculture is among the highest in the world. Economic analysis finds strong and consistent evidence that investment in agricultural research yields high returns. Net social returns in the United States are estimated to be at least 35 percent annually. These returns benefit not only the farm sector, but also the food industry and consumers in the form of more abundant commodities at lower prices. In 1929, approximately 20 percent of disposable income went to paying for food consumed at home. In 2014, the latest year for which data are available, this amount was approximately 6 percent. With a lower share of disposable income needed for food, families and individuals have more resources to spend on other goods and services. Continued investments in research will ensure sustainable, profitable agricultural production and greater choice for consumers.
Some specific results of recent USDA research include:
• Helping double milk production efficiency, while enhancing environmental sustainability by reducing greenhouse gas and waste production from dairy operations;

86 RESEARCH, EDUCATION, AND ECONOMICS
• Making advances in the development of rice and corn crops that are drought- and flood-resistant, and help improve the productivity of soil;
• Developing a series of satellite remote sensing tools that will help improve agricultural drought detection, increasing the ability to reduce and prevent the impact of drought regionally and globally;
• Developing new strategies to control mites and other major honey bee problems such as colony collapse disorder;
• Identifying ways to slow the trend of childhood obesity. USDA researchers have discovered that eating a protein-rich breakfast increases the brain's level of dopamine, a chemical that helps reduce food cravings and overeating later in the day;
• Developing procedures to remove up to 98 percent of the allergens from peanuts without affecting the flavor;
• Showing how healthy foods can often cost less than foods that are high in saturated fat, added sugar and/or sodium;
• Devising a portable method for identifying harmful bacteria in food that could improve the response to foodborne illness outbreaks; and,
• Accelerating the development of, and systems for, the production of advanced biofuels for automotive, marine and aviation use from forest and agricultural waste and non-food, non-feed dedicated biomass feedstocks (perennial grasses, woody biomass, energy cane, sorghum).
As a result of research by USDA scientists, between 2009 through 2015, USDA filed 883 patent applications with the U.S. Patent and Trademark Office and was issued 429 patents. In 2015, USDA held 421 income-bearing licenses. It also had 301 cooperative research and development agreements, of which 106 involved small businesses.
The Research, Education, and Economics (REE) mission area provides Federal leadership for the discovery, application, and dissemination of information and technologies spanning the biological, physical, and social sciences through agricultural research, education, and extension activities and economic research and statistics. REE, through its intramural and competitive grant programs and by strengthening the capacity of higher education institutions, supports all of USDA’s Strategic Goals. The 2017 REE Budget serves to ensure a safe, sustainable, and competitive U.S. food, fuel, and fiber system, and healthy individuals and communities.
REE responsibilities are carried out by four agencies: (1) the Agricultural Research Service (ARS) conducts intramural research in natural and biological sciences; (2) the National Institute of Food and Agriculture (NIFA) partners with land grant and non-land grant colleges and universities in carrying out extramural research, higher education, and extension activities; (3) the Economic Research Service (ERS) performs intramural economic and social science research; and (4) the National Agricultural Statistics Service (NASS) conducts the Census of Agriculture and provides the official, current statistics on agricultural production and indicators for the economic and environmental welfare of the farm sector.

RESEARCH, EDUCATION, AND ECONOMICS 87
AGRICULTURAL RESEARCH SERVICE (ARS)
2015 2016 2017Enacted Estimate Budget
Discretionary New Products/Product Quality/Value Added............................... $100 $101 $101Livestock Production................................................................. 87 87 89Crop Production........................................................................ 215 218 217Food Safety............................................................................... 112 112 116Livestock Protection.................................................................. 91 93 106Crop Protection ........................................................................ 191 195 192Human Nutrition........................................................................ 87 87 85Environmental Stewardship........................................................ 201 203 213
Total, Research Programs....................................................... 1,084 1,095 1,117National Agricultural Library...................................................... 24 24 24Repair and Maintenance............................................................ 20 20 20Decentralized GSA and DHS Security Payments......................... 5 5 a/Buildings and Facilities............................................................... 45 212 95
Total, Discretionary Programs................................................. 1,178 1,356 1,256Mandatory:
Trust Funds............................................................................... 30 30 30Total, Agricultural Research Service.............................................. $1,208 $1,386 $1,286
Budget Authority(Dollars in Millions)
Program
a/ Beginning in FY 2017, rent will be distributed among the various research programs.
ARS is the USDA’s chief scientific, in-house research agency. The agency conducts research to solve technical problems of broad scope and high national priority, and provides access to scientific information. This research covers a wide range of critical problems affecting American agriculture and the Nation as a whole, ranging from animal and crop protection and production to human nutrition, food safety, and natural resources conservation. ARS employs over 6,500 employees and carries out approximately 700 research projects at over 90 laboratories throughout the Nation and in several foreign countries. The agency includes the National Arboretum and the National Agricultural Library, the Nation's major information resource on food, agriculture, and natural resource sciences.
The 2017 Budget requests approximately $1.2 billion for ARS research programs and $94.5 million for priority facility design and construction in discretionary funding to address ARS’ aging infrastructure. It emphasizes research that will tackle major, crosscutting issues facing farmers, including antimicrobial resistance, climate change, use of water resources, avian influenza, and foreign animal diseases.
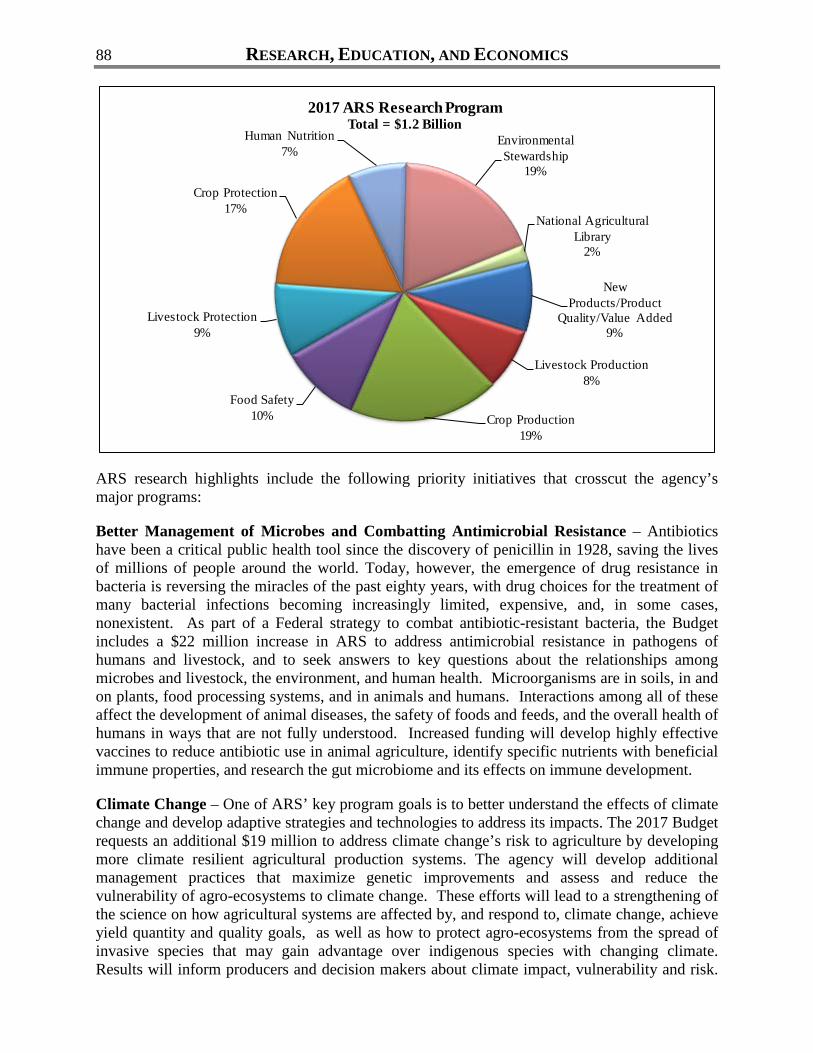
88 RESEARCH, EDUCATION, AND ECONOMICS
New Products/Product
Quality/Value Added9%
Livestock Production8%
Crop Production19%
Food Safety10%
Livestock Protection9%
Crop Protection17%
Human Nutrition7%
Environmental Stewardship
19%
National Agricultural Library
2%
2017 ARS Research ProgramTotal = $1.2 Billion
ARS research highlights include the following priority initiatives that crosscut the agency’s major programs:
Better Management of Microbes and Combatting Antimicrobial Resistance – Antibiotics have been a critical public health tool since the discovery of penicillin in 1928, saving the lives of millions of people around the world. Today, however, the emergence of drug resistance in bacteria is reversing the miracles of the past eighty years, with drug choices for the treatment of many bacterial infections becoming increasingly limited, expensive, and, in some cases, nonexistent. As part of a Federal strategy to combat antibiotic-resistant bacteria, the Budget includes a $22 million increase in ARS to address antimicrobial resistance in pathogens of humans and livestock, and to seek answers to key questions about the relationships among microbes and livestock, the environment, and human health. Microorganisms are in soils, in and on plants, food processing systems, and in animals and humans. Interactions among all of these affect the development of animal diseases, the safety of foods and feeds, and the overall health of humans in ways that are not fully understood. Increased funding will develop highly effective vaccines to reduce antibiotic use in animal agriculture, identify specific nutrients with beneficial immune properties, and research the gut microbiome and its effects on immune development.
Climate Change – One of ARS’ key program goals is to better understand the effects of climate change and develop adaptive strategies and technologies to address its impacts. The 2017 Budget requests an additional $19 million to address climate change’s risk to agriculture by developing more climate resilient agricultural production systems. The agency will develop additional management practices that maximize genetic improvements and assess and reduce the vulnerability of agro-ecosystems to climate change. These efforts will lead to a strengthening of the science on how agricultural systems are affected by, and respond to, climate change, achieve yield quantity and quality goals, as well as how to protect agro-ecosystems from the spread of invasive species that may gain advantage over indigenous species with changing climate. Results will inform producers and decision makers about climate impact, vulnerability and risk.

RESEARCH, EDUCATION, AND ECONOMICS 89
Additionally, ARS will engage the network of USDA Regional Climate Hubs to accelerate region-specific research on climate effects and ensure the transfer and adaptation of new technology.
Avian Influenza and Foreign Animal Diseases – The spring 2015 outbreak of highly pathogenic avian influenza was the worst animal disease outbreak in U.S. history. The disease is extremely deadly to chickens and turkey and caused significant losses. More than 15 States were affected, and Federal Government costs were over $1 billion in eradication efforts. The 2017 Budget requests an additional $10 million to address the threat of avian influenza and foreign animal diseases. Of this amount, ARS will use $3 million to develop improved influenza vaccines to protect flocks from the disease. The remaining $7 million will support the establishment of national and international networks to prioritize and develop immune tool kits for animal species of economic importance. This will improve detection abilities, boost vaccine response, and develop new immune interventions to treat and prevent infectious diseases.
Water Resources – Water is a precious resource and will become scarcer as the human population continues to grow. The Budget requests $15 million to increase water use efficiency; improve water management practices; improve the sustainability of key groundwater resources; and enhance the development of technologies for use of non-traditional waters, such as treated wastewaters, salty waters, and agricultural return flows. As part of this effort, ARS would address the California drought by ensuring invasive weeds no longer compete for water resources, and, in the Great Basin, increase adaptive capacities of cow/calf, stocker, and feedlot operations through the utilization of drought tolerant feed and forages, drought-based grazing management strategies, and site-specific livestock management systems.
Buildings and Facilities – The 2017 Budget requests $94.5 million to invest in the backlog of priority facility construction and renovation to maintain the quality of ARS scientific research. ARS’ aging infrastructure requires investment to sustain the capacity for conducting research on challenges to global food, agriculture, and natural resources systems. In April 2012, ARS completed a review of its laboratory portfolio and established a plan for capital investment based on facility conditions and research priorities (Capital Investment Strategy). Funding in 2017 would support the following investments:
• $30.2 million for construction of Phase I of the Agricultural Research Technology Center in Salinas, California. The research program at this facility investigates alternatives to methyl bromide as a soil fumigant for control of soilborne pests. The research also develops scientifically based organic crop production practices and methods for weed, insect, and disease control. Funding would be used for a west wing laboratory/office building.
• $64.3 million for construction of the Foreign Disease-Weed Science Research Laboratory in Ft. Detrick, Maryland. At the facility, ARS scientists research foreign plant pathogens that pose a potential threat to American agriculture, which are not yet established in the United States.
In 2016, ARS is proceeding with the design and construction of, among other facilities, its Southeast Poultry Research Laboratory in Athens, Georgia. Construction will be completed by 2023 in three phases to allow the facility to continue to operate throughout construction. Design for all phases will be completed in FY 2016. Demolition of approximately 8,000 gross square feet (GSF) in four buildings and construction of approximately 50,000 GSF in new BSL-3 facilities will start in FY 2017.

90 RESEARCH, EDUCATION, AND ECONOMICS
ARS’ major research programs include:
New Products/Product Quality/Value Added – ARS has active research programs directed toward: (1) improving the efficiency and reducing the cost for the conversion of agricultural products into biobased products and biofuels; (2) developing new and improved products for domestic and foreign markets; and (3) providing higher quality, healthy foods that satisfy consumer needs in the United States and abroad. The 2017 Budget requests a total of $101 million for this program.
Livestock Production – ARS’ livestock production program is directed toward: (1) safeguarding and utilizing animal genetic resources, associated genetic and genomic databases, and bioinformatic tools; (2) developing a basic understanding of the physiology of livestock and poultry; and (3) developing information, tools, and technologies that can be used to improve animal production systems. The research is heavily focused on the development and application of genomics technologies to increase the efficiency and product quality of beef, dairy, swine, poultry, aquaculture, and sheep systems. The 2017 Budget requests a total of $89 million for this program.
Crop Production – ARS’ crop production program focuses on developing and improving ways to reduce crop losses while protecting and ensuring a safe and affordable food supply. The research program concentrates on effective production strategies that are environmentally friendly, safe to consumers, and compatible with sustainable and profitable crop production systems. Research activities are directed at safeguarding and utilizing plant genetic resources and their associated genetic, genomic, and bioinformatic databases that facilitate selection of varieties and/or germplasm with significantly improved traits. The 2017 Budget requests a total of $217 million for this program.
Food Safety – Ensuring that the United States has the highest levels of affordable, safe food requires that the food system be protected at each stage from production through processing and consumption from pathogens, toxins, and chemical contaminants that cause diseases in humans. ARS’ current food safety research is designed to yield science-based knowledge on the safe production, storage, processing, and handling of plant and animal products, and on the detection and control of toxin producing and/or pathogenic bacteria and fungi, parasites, chemical contaminants, and plant toxins. The President’s Budget requests $116 million for these efforts.
Livestock Protection – ARS’ animal health program is directed at protecting and ensuring the safety of the Nation’s agriculture and food supply through improved disease detection, prevention, control, and treatment. Basic and applied research approaches are used to solve animal health problems, with emphasis on methods and procedures to control animal diseases. A total of $106 million is requested in the 2017 Budget for this program.
Crop Protection – ARS research on crop protection is directed toward epidemiological investigations to understand pest and disease transmission mechanisms, and identify and apply new technologies that increase understanding of virulence factors and host defense mechanisms. A total of $192 million is requested in the 2017 Budget to support these activities.
Human Nutrition – As excessive consumption replaces diseases related to malnutrition as a primary public health concern in the United States, the ARS human nutrition research program has increasingly focused on research studying the maintenance of health throughout the lifespan

RESEARCH, EDUCATION, AND ECONOMICS 91
along with prevention of obesity and chronic diseases via food-based recommendations. The 2017 Budget requests a total of $85 million for this program.
Environmental Stewardship – ARS research programs in environmental stewardship emphasize developing technologies and systems that support profitable production and enhance the Nation’s vast renewable natural resource base. ARS is currently developing the scientific knowledge and technologies needed to meet challenges and opportunities in: water availability and watershed management, climate change, gaseous and particulate matter emissions, soil health and productivity, agricultural and industrial byproducts, agricultural system competitiveness and sustainability, and conservation and restoration of range lands, pasture ecosystems, and agroecosystems. The USDA Regional Climate Hubs will contribute to this effort. The 2017 Budget requests a total of $213 million for this program.
National Agricultural Library (NAL) – NAL is the primary agricultural information resource of the United States. The Library is the premier library for collecting, managing, and disseminating agricultural knowledge. It provides services directly to the staff of USDA and to the public, primarily via the NAL web site, www.nal.usda.gov. The 2017 Budget requests a total of $24 million to continue library and information services that will provide convenient public access to agricultural information, extend Agricultural Online Access (AGRICOLA), conserve rare and at-risk items, and extend partnerships within USDA and with other Federal agencies.
Repair and Maintenance – In addition to the research funding referenced above, ARS allocates funding for the Repair and Maintenance of existing ARS facilities and infrastructure. Performing regular repair and maintenance on ARS infrastructure can extend the life span of research laboratories and facilities, provide opportunities for longer term savings, and ensure Federal scientists’ capacity to conduct safe, quality research. Funding will support specific projects such as the replacement of air handling units, boilers, and chillers that have reached the end of their service lives. The 2017 Budget requests a total of $20 million to address the backlog of ARS repair and maintenance needs.

92 RESEARCH, EDUCATION, AND ECONOMICS
NATIONAL INSTITUTE OF FOOD AND AGRICULTURE (NIFA)
2015 2016 2017Enacted Estimate Budget
$300 $300 $300244 244 24496 100 10634 34 3468 68 684 4 4
20 20 223 3 44 4 0
773 777 7810 0 100 0 20
325 350 3754 4 4
17 17 2023 25 305 5 5
34 34 3311 11 a/3 3 63 5 50 0 34 4 7
14 14 226 6 b/8 8 107 7 105 5 58 8 80 0 1
45 48 231,295 1,331 1,379Total, Discretionary Programs..................................................
Program
Budget Authority(Dollars in Millions)
Food and Ag. Defense Initiative (Regional Diagnostic Network)....Veterinary Medical Services Act.................................................Children, Youth, and Families at Risk...........................................Grants for Youth Serving Institutions............................................Other Research, Extension and Integrated Programs.....................
FARM - Vets.............................................................................Extension Services at 1994 Institutions.........................................Federal Administration................................................................
Decentralized GSA/DHS Payments..........................................Electronic Grants Administration System......................................
Sustainable Agriculture Research/Education and Extension............
STEM Programs.........................................................................Federally-Recognized Tribes Extension Program...........................Food Safety Outreach Program...................................................
Integrated Activities - Section 406 Organic Transition...................
Native American Endowment Fund Interest.................................
Crop Protection Activities Pest Management................................
Animal Health and Disease Research.......................................Total, Formula Grants...............................................................
Agriculture and Food Research Initiative......................................
Other Higher Education Programs...............................................
Home Visits for Remote Areas Program......................................1890's Capacity Coordination Initiative.........................................
Discretionary:Formula Grants:
Smith-Lever 3 (b) and (c).........................................................Hatch Act...............................................................................1890 Research and Extension...................................................McIntire-Stennis Cooperative Forestry......................................Expanded Food and Nutrition Education Program (EFNEP)........Renewable Resources Extension Act (RREA)..........................Facility Improvements at 1890 Institutions..................................Tribal Colleges Education Equity Grants Program......................

RESEARCH, EDUCATION, AND ECONOMICS 93
2015 2016 2017Enacted Estimate Budget
12 12 120 10 10
3 3 319 19 2019 19 2051 51 5523 23 250 19 205 5 5
(1) (1) (1)(9) (9) (9)
130 149 158
Agriculture and Food Research Initiative................................. 0 0 325142 171 505
$1,436 $1,502 $1,884
a/
b/
c/
d/
Total, National Institute of Food and Agriculture..............................
Beginning in 2017, GSA rent payments will be included within the Federal Administration total.
Food Insecurity Nutrition Incentive Program..............................Agricultural Risk Management Education Program....................Biodiesel Fuel Education Program c/.........................................Community Food Projects d/.....................................................
Total, Farm Bill Programs......................................................Proposed Legislation:
Organic Agriculture Research and Education Initiative...............Beginning Farmer and Rancher Development Program..............Specialty Crop Research Initiative.............................................Emergency Citrus Research and Extension Program..................
Total, Mandatory Programs.........................................................
Mandatory:Native American Endowment Fund..............................................Hispanic-Serving Ag-Colleges Endowment Fund...........................Farm Bill:
Biomass Research and Development........................................
Program
STEM funds are being requested by NSF and ED as part of a Government-wide STEM consolidation.
Funding authority delegated to the Office of the Chief Economist and administered by NIFA.
Funding authority delegated to the Food and Nutrition Service and administered by NIFA.
NIFA has primary responsibility for providing linkages between the Federal and State components of a broad-based, national agricultural research, extension, and higher education system. NIFA provides funding for projects conducted in partnership with State agricultural experiment stations, the State Cooperative Extension System, land grant universities, colleges, and other research and education institutions, as well as individual researchers. Federal funds are distributed to enhance capacity at universities and institutions by statutory formula funding and competitive grants. NIFA is responsible for administering USDA's primary competitive research grants program, the Agriculture and Food Research Initiative (AFRI), which supports investigator-initiated research with strong potential to contribute to major breakthroughs in the food, agricultural, natural resource, and human sciences.
The 2017 Budget requests approximately $1.4 billion in discretionary funding for NIFA. The Department continues to focus on the use of capacity funds and competitive grants to generate the solutions to the Nation’s most critical food and agriculture problems. To better manage the funds, the Budget request proposes to consolidate NIFA’s three accounts into a single account, mirroring the integration of research, education, and extension activities across many of NIFA’s programs.
Highlights of NIFA’s 2017 Budget request include:
Formula Programs – The 2017 Budget requests funding of $781 million for formula grants to provide the long-term, sustainable support needed to grow the capacity for agricultural research,

94 RESEARCH, EDUCATION, AND ECONOMICS
education, and extension activities at land-grant institutions and State agricultural experiment stations. These programs include Smith-Lever 3(b) and 3(c), Hatch Act, 1890’s research and extension, McIntire-Stennis Cooperative Forestry, and other grants. A total of $9 million in increases are requested for 1890’s research, extension, and facilities programs and the Tribal Colleges Education Equity Grants Program. The increased funding will support these minority-serving institutions in reaching underrepresented African American and Native American students, building partnerships, and strengthening research and extension capacity; and avoid compromising the ability of existing minority-serving institutions in continuing their effective programming.
1890’s Capacity Coordination Initiative – As the U.S. demographics change, development of a diverse agricultural sector workforce is essential to continue to provide competitive agricultural outputs. Resource-limited and small farmers, ranchers, and foresters need assistance to develop sustainable enterprises. The 1890 Institutions (historically black universities that were originally established under the Second Morrill Act of 1890) can help address these needs. As part of the President’s Budget, $10 million is requested for three centers to increase coordination and collaboration between USDA and the 1890 Institutions. Each center will focus on a specific identified need: creating an integrated center to benefit small farms, ranches and forest landowners in high poverty areas; establishing a virtual center to support the science, technology, engineering, agriculture, and mathematics pipeline of students and address the growing need for talented career candidates to meet future workforce needs; and satisfying the Nation's need in the areas of international engagement and global food security to increase international cooperation, trade and development.
AFRI – AFRI is the Nation’s premier competitive, peer-reviewed research program for fundamental and applied sciences in agriculture. It is broad in scope with programs ranging from fundamental science to farm management and community issues. The 2017 Budget proposes funding of $375 million in discretionary funding for AFRI, a $25 million increase for sustainable bioenergy issues. In addition, the Budget proposes $325 million in mandatory funding. This would fully fund the program at its authorized level. Fundamental scientific research is supported through AFRI’s Foundational Program, and focused problem-solving discoveries are supported through Challenge Area Programs.
Funding for AFRI includes support for Presidential initiatives to address critical issues. AFRI research areas include:
• Water for Food Production Systems – This water and water resources research will address challenges to irrigated agriculture, including developing alternatives to irrigation, and understanding the impacts of climate change and population growth;
• Sustainable Bioenergy Production – A sustainable bioenergy program focuses on reducing dependence on fossil fuels through the development of regional systems for the production of bioenergy and bio-based products;
• Climate Variability and Change – This research will focus on greenhouse mitigation and adaptation of agriculture to climate change variability. This program provides the information, technologies, and decision-support tools to enable crop, animal, forest, rangeland, and urban managers to account for climate variability and achieve long-term sustainability of food and fiber production;

RESEARCH, EDUCATION, AND ECONOMICS 95
• Childhood Obesity Prevention – Nutrition and obesity prevention research, education, and extension efforts focus on populations at the greatest risk for obesity, including populations eligible for USDA nutrition education and food assistance programs;
• Food Safety – An integrated food safety research program will continue to focus on minimizing antibiotic resistance transmission through the food chain and minimizing microbial food safety hazards of fresh and fresh-cut fruits and vegetables, expand food safety education to new audiences, and pursue new research strategies and technologies to create a healthier and higher quality food supply; and,
• Education and Literacy Initiative – Food, agricultural, natural resources, and human sciences education initiatives will support schools and colleges across America in the development of the food and agriculture-related workforce.
$264 $264 $276 $316 $325 $350
$375
$325
$700
0
100
200
300
400
500
600
700
800
2011 2012 2013 2014 2015 2016 2017
$ M
illio
ns
Fiscal Year
Agriculture and Food Research Initiative
Discretionary Mandatory (Proposed Legislation)
Home Visits for Remote Areas Program (HVRAP) – The Budget includes $20 million for a new competitive grants program that provides support to high-risk, high-need maternal, child, and family health in remote rural areas and Indian country. This program will complement the Department of Health and Human Services’ Maternal, Infant, and Early Childhood Home Visiting Program and capitalize on the abilities of the Cooperative Extension System by providing focused education services to rural areas through enhanced outreach. HVRAP will address healthy family functioning and building the capacity of family and home-based childcare providers. Specifically HVRAP will encourage grantees to implement programs that will demonstrate measurable outcomes in the following areas: 1) improved maternal, child, and family health; 2) prevention of child abuse, neglect or maltreatment; 3) improvement in school readiness; 4) improvement in financial capability; 5) reduced home health and safety risks; 6)ereduced risk for family conflict; 7) improved capacity of family and home-based child care providers; and 8) improved coordination and referrals for other community resources and support. HVRAP home visitors will provide service in high-poverty, rural (non-metro) counties, where at least 20 percent of the population have incomes below the Federal poverty threshold. The program will provide culturally and age appropriate in-home education to improve maternal, family and child health, focusing specifically on outcomes relevant to the unique needs of

96 RESEARCH, EDUCATION, AND ECONOMICS
children, pregnant women, expectant fathers, and parents and caregivers of children in remote rural and tribal areas.
Pollinator Health – Pollinators are critical to our Nation’s economy, food security, and environmental health. Honey bee pollination alone adds more than $15 billion in value to agricultural crops each year, and provides the backbone to ensuring the availability of a variety of fruits, nuts, and vegetables. Under the Crop Protection/Pest Management Program, an additional $3 million will support the President’s Pollinator Health Initiative and deal with new and emerging invasive pest species. Cooperative Extension assistance will help agricultural producers implement pest management strategies that increase productivity while protecting the health of pollinators and other beneficial organisms.
Beginning Farmers and Ranchers – As shifts in the age, race, and gender of farmers change agriculture in America, USDA is working to ensure that agricultural research programs are responsive and relevant to young, beginning, veteran, historically underserved and women farmers. These farmers often operate smaller and more diversified operations, engage in value-added activities, and produce for specialty markets. The Sustainable Agriculture Research and Education (SARE) Program has proven to be a critical resource for these farmers as they look for opportunities to establish and grow successful farming operations. SARE is the only USDA competitive research grant program with a consistent focus on farmer-driven research. By design, it is uniquely accessible to farmers of all types as they experiment and innovate to solve challenges facing their farm businesses. SARE also encourages mentorship between established and beginning farmers and between Extension, academic researchers, and the farm and ranch community through field days and other opportunities for peer-to-peer learning. An additional $5 million will enhance support for beginning farmers and ranchers by helping them adopt sustainable agricultural practices. NIFA will also be able to support a greater number of graduate students studying sustainable agriculture.
Science, Technology, Engineering, and Math (STEM) Programs – As part of a reorganization of STEM programs, the Administration proposes to consolidate STEM programs into the Department of Education and the National Science Foundation. Programs will be consolidated in centrally-funded government-wide programs including: Higher Education Challenge Grants, Graduate and Postgraduate Fellowship Grants, the Higher Education Multicultural Scholars Program, Women and Minorities in STEM Program, Agriculture in the Classroom, and Secondary and Postsecondary Challenge Grants.
Federally Recognized Tribes Extension Program (FRTEP) and 1994 Institutions – The President’s Budget provides assistance to Indian Country through FRTEP and research, extension, and other grants to 1994 Institutions (congressionally defined tribal colleges). An increase of $2.8 million for FRTEP will effectively double the number of staff engaged in 4-H activities to 72, helping to serve more Tribes' native youth. With an increase of $2.1 million in research funding, 1994 Institutions will be able to recruit more students for research participation and, as a result, increase the number of graduates prepared for higher degrees in science, technology, engineering, and mathematics programs. An increase of $2 million in extension for 1994 Institutions is expected to lead to long- term capacity building by increased professional training opportunities; four new tribal 4-H clubs; and a 25 percent increase in the number of Indian students working on summer internships. An increase of about $200,000 for the Tribal Colleges Education Equity Grants Program will assist the two newest tribal land-grant colleges build research and extension capacity, and serve a larger American Indian student population.
RESEARCH, EDUCATION, AND ECONOMICS 97
FARM-Vets Program – The 2017 Budget proposes $2.5 million for a new competitive Food and Agriculture Resilience Program for Military Veterans (FARM-Vets) that will focus on projects involving research, education, and extension activity for veterans. NIFA expects FARM-Vets grant projects to result in new, educational programming to help veterans develop farming and ranching skills, business plans, and agriculture systems management. This program supports Administration efforts to grow the number of beginning farmers and ranchers, and provides veterans the skills and opportunities to enter the agriculture industry.
Electronic Grants Administration System – With increased funding for AFRI, a rise in the number of applications is anticipated, requiring increased efficiency of the grant-making processes and systems. The 2017 Budget proposes a total of about $10 million to improve and consolidate its grants management systems, which will substantially lower the transaction costs of applying for an AFRI or other NIFA competitive grant, while increasing proposal receipt and acceptance speeds and accuracy.
Food and Agriculture Defense Initiative – The National Plant Diagnostic Network and the National Animal Health Laboratory Network identify and respond to high-risk biological pathogens in the food and agricultural system, protecting the nation from plant and animal disease threats through surveillance, early detection, mitigation, and recovery. The Extension Disaster Education Network is a national effort led by the State Cooperative Extension Service that provides disaster education resources for extension educators. The 2017 Budget includes an increase of $3 million to enable these networks to better utilize improved diagnostic technologies and data infrastructure; upgrade their instrumentation; expand diagnostic test capabilities and through-put potential; and develop more effective laboratory information and data management. The outcomes of these increased investments will allow better protection of U.S. livestock and crop health, as well as U.S. food and agriculture trade.
Grants to Youth-Serving Organizations – Youth engagement is a vital component of sustainable, healthy rural communities. The 2017 Budget requests $1 million for the Rural Youth Development program, which awards project grants to organizations that cultivate leadership, citizenship, and life skills in young people. Funding supports pilot-demonstration projects by youth that positively impact the communities in which they live.
Hispanic-Serving Institutions – The Food, Conservation, and Energy Act of 2008 authorized the establishment of an endowment fund for Hispanic Serving Agricultural Colleges and Universities. The 2017 Budget proposes $10 million in mandatory funds to establish the fund that will lead to significant and measurable advancement of Hispanic students in the food and agricultural sciences. Funding for program activities will come from the annual interests generated by the Endowment. This investment in the Hispanic-Serving Agricultural Colleges and Universities (HSACU) is needed to assist in the development of a skilled and marketable workforce from the HSACU for employment in the food and agriculture sector.

98 RESEARCH, EDUCATION, AND ECONOMICS
ECONOMIC RESEARCH SERVICE (ERS)
2015 2016 2017Enacted Estimate Budget
Economic Research Service.......................................................... $85 $85 $91
(Dollars in Millions)Budget Authority
Program
ERS provides economic and social science information and analysis on agriculture, food, environment, and rural development to inform policy and program decision-makers throughout USDA. ERS also provides access to the information and analyses to stakeholders and the general public. ERS’ conducts research, analyzes food and commodity markets, produces policy studies, and develops economic and statistical indicators to meet the information needs of USDA, other policy officials, and the research community. ERS provides statistical indicators for the health of the farm sector (including farm income estimates and projections), current and expected performance of agricultural industry and trade, and food security in the United States and abroad. The Budget requests approximately $91 million to fund core programs of research, data analysis, and market outlook. Highlights include:
Food Choices – Primary data on food choices by American consumers, including participants in the USDA food assistance programs and other vulnerable populations are critical for understanding the evolving dietary patterns and increasing the effectiveness and efficiency of Federal programs that address food insecurity, nutritional deficiencies, and public health issues such as obesity, diabetes, and the metabolic syndrome. The Budget includes an increase of $4 million over a base of $500,000 to update the 2012 National Household Food Purchase and Acquisition Survey. The effort will strengthen USDA’s abilities to examine the relationships between food programs, policies, and food choices and address emerging interests in sustainable food systems, among other topics. It will also add representative populations of participants in the Special Supplemental Nutrition Program for Women, Infants, and Children and school meal programs; add representative populations of children of specific age ranges; and tie purchased foods to the equivalent agricultural food commodities, better identifying farm production links to food consumption.
Beginning Farmers and Ranchers – Because the average age of the principal farm operator in the U.S. has continued to rise (58+ years), ERS is working to gain a better understanding of the next generation of agriculture. The Budget includes an increase of $500,000 over a base of $480,000 to examine differences in demographic characteristics of new farmers and ranchers, including minorities, women, and veterans, to better inform policy decisions.
Increasing Drought Resilience – Agriculture is especially sensitive to droughts due to its reliance on water for producing and transporting food, feed and fiber. Improved understanding of factors driving farmer-led actions that can improve resilience in the face of drought events is essential for informed policy approaches to enhancing incentives adopting such practices, reducing drought vulnerability, and boosting water sustainability. The Budget includes an increase of $626,000 over a base of $1.5 million to conduct research on conservation practice adoption and drought mitigation by American farmers and ranchers in drought-prone regions. In 2017, ERS will expand its research to consider groundwater resources as well as provide more regionally specific results which could consider local variation in conditions and the institutions that govern farmers’ access to water.

RESEARCH, EDUCATION, AND ECONOMICS 99
NATIONAL AGRICULTURAL STATISTICS SERVICE (NASS)
2015 2016 2017Enacted Estimate Budget
Discretionary:Agricultural Estimates................................................................ $124 $126 $135Census of Agriculture................................................................ 48 42 42
Total, National Agricultural Statistics Service.................................. 172 168 177
Program
Budget Authority(Dollars in Millions)
The mission of NASS is to provide timely, accurate, and useful statistics in service to U.S. agriculture. Each year, NASS conducts 450 surveys on 200 different commodities. These data illustrate the changing nature and needs of agriculture and provide accurate and up-to-date information necessary for decision-making by producers, agribusinesses, farm organizations, commodity groups, public officials, and others. NASS data also keeps agricultural markets stable, efficient, and fair by ensuring accessible and objective data are available to both commodity market buyers and sellers. NASS has made enhancements within its programs and operations to deliver improved results, including opening a National Operations Center that centralizes data collection and service. The 2017 Budget requests $177 million in program funding. Highlights include:
Agricultural Estimates – The 2017 Budget requests additional funding for several initiatives. As part of the Federal initiative to combat antimicrobial resistant bacteria, an additional $2 million will be used to add questions to existing NASS’ surveys (e.g., for cattle, hogs, and poultry) to establish baseline information. Based on the Department’s interest in supporting beginning producers, with an increase of $3 million, NASS would survey beginning farmers at a regional level of detail to inform policy decisions concerning use of USDA programs by this population, their unmet needs or barriers to access those programs, and the effectiveness of USDA programs. A $1 million initiative would fund a special study on modern farm structure to improve data on today’s complex farm business structures and farm characteristics. Special emphasis will be given to new data collection concerning women, new farmers, and veterans. With an additional $1 million, NASS would enhance current satellite-based agricultural monitoring to provide crop condition, soil moisture, crop progress, and crop yields, leveraging partnerships with a university partner, the National Oceanic and Atmospheric Administration Regional Climatic Centers, and USDA Climate Hubs.
Census of Agriculture – The Census of Agriculture provides comprehensive data on the agricultural economy with national, State, and county level details. The Census data are relied upon to measure trends and new developments in the agricultural sector. Base funding will be used to prepare for the 2017 Census of Agriculture.

100 DEPARTMENTAL ACTIVITIES
DEPARTMENTAL ACTIVITIES
2015 2016 2017Enacted Estimate Budget
Discretionary:Office of the Secretary.............................................................. $18 $18 $22
Office of Homeland Security and Emergency Coordination....... 1 1 2Office of Advocacy and Outreach........................................... 1 1 11Departmental Administration................................................... 25 25 27Office of Communications....................................................... 8 8 9
Total, Office of the Secretary............................................... 53 53 71Executive Operations:
Office of the Chief Economist................................................. 17 18 18National Appeals Division....................................................... 13 13 13Office of Budget and Program Analysis................................... 9 9 10
Total Executive Operations.................................................. 39 40 41Office of the Chief Information Officer....................................... 45 45 66Office of the Chief Financial Officer........................................... 6 6 9Agriculture Buildings and Facilities.............................................. 56 64 84Hazardous Materials Management.............................................. 4 4 4Office of the General Counsel.................................................... 44 44 50
Office of Ethics ..................................................................... 4 4 5Total, Discretionary Programs.............................................. 251 260 330
Mandatory:Farm Bill:
Biobased Markets Program..................................................... 3 3 3Biodiesel Fuel Education Program............................................ 1 1 1Outreach for Socially Disadvantaged Farmers.......................... 9 9 10
Total, Farm Bill Programs.................................................... 13 13 14Office of the Secretary:
Trust Fund............................................................................. 0 1 1Total, Departmental Staff Offices.................................................. 264 274 345
Budget Authority(Dollars in Millions)
Program
Departmental staff offices provide essential support, without which other Departmental agencies and programs would be unable to carry out their duties. Their functions include legal counsel, economic analysis, communications coordination, financial management, budget and policy support, and program appeal hearings for the Department’s program activities. The 2017 Budget proposes funding to ensure that these offices can support staffing levels needed to provide leadership, oversight, and coordination. The Budget also supports the Department-wide Blueprint for Stronger Service initiative, which has achieved $1.4 billion in savings, efficiencies, and cost avoidances since 2012 and saved more than 290,000 USDA staff hours through signature process improvements in 2015.
DEPARTMENTAL ACTIVITIES 101
The Office of the Secretary (OSEC), assisted by the Deputy Secretary, the Subcabinet, and members of their immediate staffs, directs and coordinates the work of the Department. This involves providing policy direction for all areas of the Department and maintaining liaisons with the Executive Office of the President, members of Congress and the public. The 2017 Budget requests $22 million for OSEC to fund ongoing policy leadership and outreach for new, beginning, and veteran farmers and ranchers. This funding level also supports an increase of $5 million for enhanced outreach services in support of new, beginning, and veteran farmers and ranchers. Funds would be provided to various USDA agencies, using a transfer authority, to implement a comprehensive, field-based outreach strategy to provide support for beginning farmers and ranchers. The request also includes an increase of $755,000 for the Office of Tribal Relations to enhance the office’s capacity to provide outreach and to support the Council on Native American Farming and Ranching.
The Office of Homeland Security and Emergency Coordination (OHSEC) provides a central homeland security oversight and assistance capability within USDA. OHSEC is responsible for providing oversight and coordination of Departmental security matters. The 2017 Budget requests $2 million for OHSEC to provide leadership and coordination of the Departmental security matters and to ensure that USDA is prepared for potential threats or emergency situations. Included within the request is an enhanced capacity for OHSEC to monitor issues of human tracking in the agriculture sector. The requested funding would support the development of training materials to enhance victim identification strategies for law enforcement and compliance personnel.
The Office of Advocacy and Outreach (OAO) was established by the 2008 Farm Bill to increase the accessibility of USDA programs to underserved constituents. OAO activities include overseeing the Advisory Committees on Minority Farmers and Beginning Farmers and Ranchers; overseeing the activities of the Office of Small Farms Coordination and the Farm Worker Coordinator; managing the 1994, 1890, and Hispanic Serving Institutions Programs; and coordinating/conducting other outreach functions. OAO also administers the Outreach and Assistance for Socially Disadvantaged Farmers and Ranchers and Veteran Farmers and Ranchers Grant Program (2501 Program) which received mandatory funding in the 2014 Farm Bill. The 2017 Budget includes an increase of $10 million to fund the 2501 Program for a total level of $20 million. Through the 2501 Program, OAO provides grants to community based organizations and other institutions that provide technical assistance to new, beginning, veteran and socially disadvantaged farmers and ranchers. USDA stakeholders have continuously stressed the importance and need for this program as it provides resources to expand the knowledge of USDA programs. The increased funding will enable OAO to double support to grantees, further extending and enhancing technical assistance and outreach for USDA programs nationwide.
Departmental Administration (DA) provides overall direction, leadership and coordination for the Department’s management of human resources, property, procurement, facilities management, small and disadvantaged business utilization programs, and the regulatory hearing and administrative proceedings conducted by the Administrative Law Judges and the Judicial Officer. The 2017 Budget requests $27 million for DA to maintain critical support activities and oversight for the Department. The request includes $2 million to improve human resources (HR) operations in support of Departmental Management and Staff Offices.

102 DEPARTMENTAL ACTIVITIES
Key Performance Measures Actual Target
2012 2013 2014 2015 2016 2017 Number of employees participating in core telework (one day per pay period) 7,926 9,723 10,455 11,798 12,000 12,500
Leased office and warehouse space controlled by USDA (millions of sq. ft.) 26.0 25.6 24.9 23.9 23.7 23.5
The Office of Communications (OC) provides leadership and coordination for the development of communication strategies for the Department and plays a critical role in disseminating information about USDA’s programs to the general public. The 2017 Budget requests $9 million for OC to continue to develop effective communications strategies that increase the visibility and the transparency of USDA programs. The 2017 Budget request includes additional funding for a Digital Asset Management Application system to provide streamlined and automated access to digital assets for Departmental stakeholders, the general public, and media outlets. Various types of multimedia files will be searchable and accessible in multiple formats and delivered using web-based browsers, limiting the need for additional resources (e.g., librarians and editors) to assist with this self-help search capability. Existing Agency archives and collections can be migrated to the centralized Digital Asset Management application saving additional resources for managing, hosting and servicing of these assets.
The Office of the Chief Economist (OCE) advises the Secretary and Department officials on the economic implications of Department policies, programs, associated regulations and proposed legislation; and serves as the focal point for the Department’s economic intelligence, analysis and review related to domestic and international food and agriculture markets. OCE also provides advice and analysis on bioenergy, global climate change, environmental services markets, sustainable development, agricultural labor, and new uses of agricultural products. The 2017 Budget requests $18 million for OCE to continue its support of USDA policy officials and to continue dissemination of agricultural economic information. Included in this request is $500,000 for a new initiative, Preparing Rural America for the Impacts of Climate Change. This initiative will enable the Department to develop the analytic capacity needed to provide projections of greenhouse gas (GHG) emissions and carbon sequestration from agricultural and forest lands. This information will be used to assess the benefits of expenditures on conservation and energy programs related to reductions in GHG and to track progress in meeting domestic goals for GHG mitigation. In addition, the request includes $175,000 for a Food Loss and Waste Coordinator. The Food Loss and Waste Coordinator will enable USDA to carry out its leadership role and increase the impact of the Department’s efforts to reduce food loss and waste in the United States. Food loss and waste, which is estimated by USDA to be roughly 30 percent of the food supply at the retail and consumer levels, imposes a strain on the nation’s food security, resource use, and climate-change mitigation efforts. This position would work to mobilize public and private resources to reduce the problem.
The National Appeals Division (NAD) conducts evidentiary administrative appeal hearings and reviews arising from program operations of the Rural Development mission area, the Farm Service Agency, the Risk Management Agency, and the Natural Resources Conservation Service. The 2017 Budget requests $13 million for NAD to continue conducting hearings related to adverse program decisions when requested by customers of these Service Center Agencies.

DEPARTMENTAL ACTIVITIES 103
The Office of Budget and Program Analysis (OBPA) provides analyses and information to the Secretary and other senior policy officials to support informed decision-making regarding the Department’s programs and policies, and budget, legislative, and regulatory actions. The 2017 Budget requests $10 million for OBPA for the continued delivery of analyses and support to USDA policy officials.
The Office of the Chief Information Officer (OCIO) provides policy guidance, leadership and coordination for the Department's information management, technology investment and cyber security activities in support of USDA program delivery. The 2017 Budget requests $66 million for OCIO to fund ongoing activities and to increase efforts for strategic sourcing for IT investments. Included in the request is an increase of $10 million to enhance the Department’s cyber security profile through the acquisition of relevant tools and services. This increase will allow USDA to implement Department-wide security enhancements to protect the network and applications used to for the delivery of programs and services. In addition, the Budget includes $1 million for 508 compliance and accessibility tools and an increase of $7.6 million and 44 staff years to develop a Digital Services team focused on improving the management and oversight of major IT investments across the Department. As part of a Government-wide initiative, USDA’s Digital Services team would better equip the Chief Information Officer to allocate resources necessary for the improvement of planning and implementation activities for IT systems that support the delivery of the Department’s programs and activities.
The Office of the Chief Financial Officer (OCFO) provides overall direction and leadership in the development of financial management policies and systems and produces the Department’s consolidated financial statements. OCFO also oversees the provision of administrative accounting, payroll, and related systems for USDA and other agencies through operation of the National Finance Center. The 2017 Budget requests $9 million for OCFO to continue its leadership and oversight of the Department’s financial management processes. Included in the request is an increase of $3 million for system improvements and other costs associated with the implementation of the Digital Accountability and Transparency Act (DATA Act). This funding will allow USDA to improve processes and systems used to track, report, and analyze spending data, allowing the public, Congress, and Departmental leaders to be better informed as to the impact of the Department’s programs. Additionally, implementation of the DATA Act will simplify and streamline reporting, thus reducing compliance costs while improving transparency of Departmental expenditures.
The request for Agriculture Buildings and Facilities (Ag B&F) for 2017 is $84 million. This account is responsible for all maintenance, utilities and administration of the more than 2.5 million square feet in the two USDA headquarters buildings, as well as the USDA-owned George Washington Carver Center. Included in this request is an increase of $20 million to support modernization efforts in the headquarters complex. Funding will be used to begin Phase 1 of the project, which consists of reconfiguring the George Washington Carver Center to increase its capacity to help reduce the amount of leased space in the National Capital Region (NCR) and to accommodate a higher occupancy and thereby allowing the Department to vacate leased space. Coupled with the use of telework, USDA’s modernization plan would virtually eliminate the need for leased space for the NCR. USDA currently spends over $45 million annually on rent and security costs for leased facilities in NCR. Moreover, modernization of the South Building would allow the Department to begin to comprehensively address significant life/safety issues and meet Federal mandates related to energy conservation, sustainability, and Leadership in Energy and Environmental Design (LEED) certification goals.

104 DEPARTMENTAL ACTIVITIES
The Hazardous Materials Management (HMM) Program provides for the efficient management and cleanup of hazardous materials on facilities and lands under the jurisdiction, custody, and control of the Department; and the prevention of releases of hazardous substances from USDA facilities. The 2017 Budget requests $4 million for the HMM program.
The Office of the General Counsel (OGC) provides legal oversight, counsel, and support to the Department’s agencies and offices. OGC’s staffing has declined significantly since 2010; however, this decrease has not been accompanied by a commensurate decline in the amount or scope of OGC’s work, as the Office is the primary source of legal support for all USDA programs and activities. The 2017 Budget requests a total of $55 million, including an increase of $5 million for OGC to increase legal resources to remain effective in delivering legal services to the Department and augment computerized legal research and training efforts. The request also includes $5 million for the Office of Ethics, an office under OGC, to administer ethics regulations and statutes governing employee conduct; carry out public confidential financial disclosure reporting programs; develop and implement supplemental ethics policies, provide advice and assistance to USDA employees; and train employees on all ethics statutes, regulations, and policies.

OFFICE OF CIVIL RIGHTS 105
OFFICE OF CIVIL RIGHTS
2015 2016 2017Enacted Estimate Budget
Office of Civil Rights………………………………………………… $24 $24 $25
Budget Authority(Dollars in Millions)
Program
The Office of Civil Rights (OCR) provides policy guidance, leadership, coordination and training, and complaint adjudication and processing for the Department and its agencies. OCR’s mission is to facilitate the fair and equitable treatment of USDA customers and employees and ensure the delivery and enforcement of civil rights programs and activities. Through its efforts, OCR strives to: (1) foster a positive civil rights climate at USDA; (2) process Equal Employment Opportunity (EEO) and program complaints in a timely, efficient and cost effective manner; (3) reduce and prevent EEO and program complaints through training and guidance; and (4) offer alternative dispute resolution services.
In the last seven years, USDA has worked to address long-standing claims of past discrimination. The 2017 Budget requests resources for OCR to continue its efforts to support the Department’s strides to move into a new era for civil rights following the successful settlement of large-scale class-action lawsuits with Native American and African American farmers and ranchers and the establishment of a voluntary claims process for women and Hispanic farmers and ranchers. The Budget includes an increase of $75,000 for enhanced training to educate USDA’s workforce through increased webinars on Limited English Proficiency and Lesbian, Gay, Bisexual, and Transgender issues. In addition, the Budget includes an increase of $175,000 to improve the security of personally identifiable information housed in the Civil Rights Enterprise System.

106 OFFICE OF INSPECTOR GENERAL
OFFICE OF INSPECTOR GENERAL
2015 2016 2017Enacted Estimate Budget
Office of Inspector General………………………………………… $95 $96 $101
Budget Authority(Dollars in Millions)
Program
The Office of Inspector General (OIG) conducts and supervises audits and investigations to prevent and detect fraud, waste, and abuse and to improve the effectiveness of USDA programs and operations. As the law enforcement arm of USDA, OIG also investigates criminal activity involving the Department’s programs and personnel. The 2017 Budget requests $101 million for OIG for audit and investigation review of the Department’s programs. This funding includes an increase of $1.6 million for an Audit Center of Excellence to help reduce the incidence of improper payments at the Department and $1.1 million and 8 staff years to help address the Department’s material weakness in IT security to improve oversight of IT investments. The requested funding would enable OIG to conduct simultaneous reviews on the most critical and vulnerable controls for Federal IT systems, such as access control, business continuity, and disaster recovery.

APPENDIX 107
Agency2015
Enacted2016
Estimate2017
BudgetFARM AND FOREIGN AGRICULTURAL SERVICES
Farm Service Agency......................................................................... 3,930 4,142 4,172Risk Management Agency.................................................................. 438 462 462Foreign Agricultural Service................................................................ 905 1,080 1,083
RURAL DEVELOPMENTRural Development............................................................................ 4,759 5,026 5,168
FOOD, NUTRITION, AND CONSUMER SERVICESFood and Nutrition Service................................................................. 1,457 1,704 1,708
FOOD SAFETYFood Safety and Inspection Service..................................................... 9,036 9,036 9,049
NATURAL RESOURCES AND ENVIRONMENTNatural Resources Conservation Service.............................................. 10,190 11,657 11,644Forest Service................................................................................... 32,194 32,194 32,194
MARKETING AND REGULATORY PROGRAMSAnimal and Plant Health Inspection Service......................................... 7,233 8,033 7,839Agricultural Marketing Service............................................................ 2,557 2,855 2,855Grain Inspection, Packers and Stockyards Administration...................... 656 663 668
RESEARCH, EDUCATION, AND ECONOMICSAgricultural Research Service.............................................................. 6,636 6,652 6,661National Institute of Food and Agriculture............................................ 371 390 459Economic Research Service................................................................ 342 365 365National Agricultural Statistics Service................................................. 982 982 982
DEPARTMENTAL ACTIVITIESOffice of the Secretary....................................................................... 99 105 106Office of Homeland Security and Emergency Coordination................... 59 62 62Office of Advocacy and Outreach....................................................... 39 45 45Departmental Administration............................................................... 420 496 513Office of Communications.................................................................. 73 81 87Office of the Chief Economist............................................................. 48 54 55National Appeals Division................................................................... 78 87 87Office of Budget and Program Analysis............................................... 41 52 52Office of Chief Information Officer..................................................... 996 1,156 1,251Office of Chief Financial Officer......................................................... 1,429 1,701 1,745Office of the General Counsel............................................................. 266 303 331Office of Civil Rights......................................................................... 129 134 134Office of Inspector General................................................................ 503 531 539Hazardous Materials Management....................................................... 5 7 7
Total, USDA Federal Staffing........................................................... 85,871 90,055 90,323FSA, Non-Federal Staffing.............................................................. 8,394 8,331 7,481
TOTAL, U.S. DEPARTMENT OF AGRICULTURE STAFFING........ 94,265 98,386 97,804
Staff Years

108 APPENDIX
2015 2016 2017Enacted Estimate Budget
FARM AND FOREIGN AGRICULTURAL SERVICESFarm Service Agency:
Discretionary Programs............................................................... $1,608 $1,599 $1,616Discretionary Emergency Programs........................................... 12 114 0Mandatory Programs................................................................... 44 47 47Commodity Credit Corporation Programs (mandatory).......... 2,175 20,545 12,812
Total, Farm Service Agency..................................................... 3,839 22,305 14,474Risk Management Agency:
Discretionary Programs............................................................... 81 83 96Mandatory Programs................................................................... 7,767 7,858 7,575
Total, Risk Management Agency........................................... 7,848 7,941 7,671Foreign Agricultural Service:
Discretionary Programs (excluding P.L. 480)............................ 377 397 394P.L. 480 (discretionary)................................................................ 1,466 1,716 1,350Mandatory Market Development Programs............................. (266) (286) (305)Other Mandatory Programs........................................................ 139 137 176
Total, Foreign Agricultural Service......................................... 1,982 2,250 1,920Total, Farm and Foreign Agricultural Services.................. 13,669 32,496 24,065
RURAL DEVELOPMENTRural Utilities Service:
Discretionary Programs............................................................... 537 602 586Rural Housing Service:
Discretionary Programs............................................................... 1,714 2,035 2,044Rural Business - Cooperative Service:
Discretionary Programs............................................................... 107 95 155Mandatory Programs................................................................... 93 91 68
Total, Rural Business - Cooperative Service......................... 200 186 223Rural Development Salaries and Expenses:
Discretionary Programs............................................................... 224 226 231 Total, Rural Development........................................................ 2,675 3,049 3,084
FOOD, NUTRITION, AND CONSUMER SERVICESFood and Nutrition Service:
Discretionary Programs a/.......................................................... 7,055 6,800 6,842Mandatory Programs................................................................... 103,325 103,204 105,296
Total, Food, Nutrition, and Consumer Services.................... 110,380 110,004 112,138
FOOD SAFETY Food Safety and Inspection Service:
Discretionary Programs............................................................... 1,016 1,015 1,030Mandatory Programs................................................................... 14 11 11
Total, Food Safety..................................................................... 1,030 1,026 1,041
NATURAL RESOURCES AND ENVIRONMENTNatural Resources Conservation Service:
Discretionary Programs............................................................... 862 867 860Discretionary Emergency Programs........................................... 79 137 0Mandatory CCC Programs.......................................................... 3,184 3,123 3,885
Total, Natural Resources Conservation Service................... 4,125 4,126 4,745
Agency / Program
Budget Authority(Dollars in Millions)

APPENDIX 109
2015 2016 2017Enacted Estimate Budget
Forest Service:Discretionary Programs.............................................................................. 5,073 6,381 4,894Mandatory Programs................................................................................... 625 644 636Total, Forest Service................................................................................... 5,698 7,025 5,530
Total, Natural Resources and Environment............................................ 9,823 11,152 10,275
MARKETING AND REGULATORY PROGRAMSAnimal and Plant Health Inspection Service:
Discretionary Programs.............................................................................. 874 903 904Discretionary Emergency Programs.......................................................... 1,007 0 0Mandatory Programs................................................................................... 234 275 292
Total, Animal and Plant Health Inspection Service................................ 2,115 1,178 1,196Agricultural Marketing Service:
Discretionary Programs.............................................................................. 82 82 83Mandatory Programs................................................................................... 1,091 1,120 1,126
Total, Agricultural Marketing Service.................................................... 1,173 1,202 1,209Grain Inspection, Packers and Stockyards Administration:
Discretionary Programs.............................................................................. 43 43 43Total, Marketing and Regulatory Programs............................................ 3,331 2,423 2,449
RESEARCH, EDUCATION, AND ECONOMICSAgricultural Research Service:
Discretionary Programs.............................................................................. 1,178 1,356 1,256Mandatory Programs................................................................................... 30 30 30
Total, Agricultural Research Service...................................................... 1,208 1,386 1,286National Institute of Food and Agriculture:
Discretionary Programs.............................................................................. 1,295 1,331 1,379Mandatory Programs................................................................................... 142 171 505
Total, National Institute of Food and Agriculture.................................. 1,436 1,502 1,884Economic Research Service:
Discretionary Programs.............................................................................. 85 85 91National Agricultural Statistics Service:
Discretionary Programs.............................................................................. 172 168 177 Total, Research, Education, and Economics......................................... 2,901 3,141 3,438
DEPARTMENTAL ACTIVITIESDepartmental Activities:
Discretionary Programs.............................................................................. 275 284 355Mandatory Programs................................................................................... 13 14 15
Subtotal, Departmental Activities........................................................... 288 298 370Office of Inspector General:
Discretionary Programs........................................................................... 95 96 101Total, Departmental Activities.............................................................. 383 394 471
USDA SUBTOTAL............................................................................................ $144,192 $163,684 $156,960Offsetting Receipts, Rescissions & Other Adjustments............................. -1,721 351 -1,610
TOTAL, U.S. DEPARTMENT OF AGRICULTURE................................. $142,471 $164,035 $155,350
a/ Excludes $220 million provided in FY2016 General Provision 751(b) for management information systems, including WIC EBT.
Agency / Program
Budget Authority(Dollars in Millions)

110 APPENDIX
2015 2016 2017Enacted Estimate Budget
FARM AND FOREIGN AGRICULTURAL SERVICESFarm Service Agency:
Farm Loan and Grant Programs..................................................... $6,402 $6,402 $6,657Conservation Programs.................................................................. 1,741 1,841 1,923Commodity Programs.................................................................... 8,789 26,800 19,718Commodity Credit Corporation Export Programs...................... 6,282 6,437 6,439Salaries and Expenses..................................................................... 1,510 1,510 1,519Other Programs............................................................................... 48 50 50
Total, Farm Service Agency........................................................ 24,772 43,040 36,306Risk Management Agency:
Salaries and Expenses..................................................................... 81 83 96Crop Insurance Fund....................................................................... 11,254 11,302 12,690
Total, Risk Management Agency................................................ 11,335 11,385 12,786Foreign Agricultural Service:
Export Credit Guarantees............................................................... 5,500 5,500 5,500Market Development Programs..................................................... 266 286 305Foreign Food Assistance................................................................ 2,056 2,064 2,097Salaries and Expenses..................................................................... 188 198 203
Total, Foreign Agricultural Service............................................ 8,010 8,048 8,105Total, Farm and Foreign Agricultural Services....................... 44,117 62,473 57,197
RURAL DEVELOPMENTRural Utilities Service:
Loans and Grants............................................................................. 7,996 8,829 8,531Rural Housing Service:
Loans and Grants............................................................................. 29,054 29,465 29,409Rural Business - Cooperative Service:
Loans and Grants............................................................................. 1,216 1,370 1,614Salaries and Expenses…………………………………………… 224 226 231
Total, Rural Development........................................................... 38,490 39,890 39,785FOOD, NUTRITION, AND CONSUMER SERVICES
Food and Nutrition Service:Supplemental Nutrition Assistance Program............................... 81,830 80,839 81,709Child Nutrition Programs............................................................... 21,475 22,344 23,565Women, Infants and Children (WIC)............................................. 6,624 6,351 6,351All Other.......................................................................................... 451 470 513
Total, Food, Nutrition, and Consumer Services........................ 110,380 110,004 112,138
FOOD SAFETYFood Safety and Inspection Service…………………………… 1,231 1,206 1,221
NATURAL RESOURCES AND ENVIRONMENT .Natural Resources Conservation Service:
Private Lands Conservation Operations (Discretionary)............ 846 851 860Farm Security and Rural Investment Programs............................ 3,184 3,123 3,885All Other.......................................................................................... 95 153 0
Total, Natural Resources Conservation Service........................ 4,125 4,126 4,745
Program Level(Dollars in Millions)
Agency / Program

APPENDIX 111
2015 2016 2017Enacted Estimate Budget
Forest Service:National Forest System.................................................................. 1,494 1,509 1,501Forest and Rangeland Research..................................................... 296 291 292State and Private Forestry.............................................................. 233 237 234Wildland Fire Activities................................................................. 2,333 2,387 2,452Capital Improvement and Maintenance......................................... 360 364 343Land Acquisition............................................................................. 49 65 67All Other.......................................................................................... 308 1,528 5
Total, Discretionary Accounts.................................................... 5,073 6,381 4,894Mandatory........................................................................................ 625 644 636
Total, Forest Service.................................................................... 5,698 7,025 5,530Total, Natural Resources and Environment............................ 9,823 11,152 10,275
MARKETING AND REGULATORY PROGRAMSAnimal and Plant Health Inspection Service:
Salaries and Expenses..................................................................... 871 900 901Emergency Funding........................................................................ 1,007 0 0Mandatory........................................................................................ 234 275 292Buildings and Facilities.................................................................. 3 3 3
Total, Animal and Plant Health Inspection Service................... 2,115 1,178 1,196Agricultural Marketing Service.................................................. 355 357 367
Section 32 Funds............................................................................. 818 845 842Total, Agricultural Marketing Service........................................ 1,173 1,202 1,209
Grain Inspection, Packers and Stockyards Administration................................................................................ 90 95 101
Total, Marketing and Regulatory Programs.................................. 3,378 2,475 2,507RESEARCH, EDUCATION, AND ECONOMICS
Agricultural Research Service.......................................................... 1,208 1,386 1,286National Institute of Food and Agriculture...................................... 1,436 1,502 1,884Economic Research Service............................................................. 85 85 91National Agricultural Statistics Service........................................... 172 168 177
Total, Research, Education, and Economics................................. 2,901 3,141 3,438DEPARTMENTAL ACTIVITIES
Office of the Secretary...................................................................... 53 53 71Office of Civil Rights........................................................................ 24 24 25Office of Inspector General.............................................................. 95 96 101All Other Staff Offices...................................................................... 211 221 274
Total, Other Activities.................................................................... 383 394 471USDA SUBTOTAL............................................................................... $210,703 $230,735 $227,031
Receipts and Loan Repayments and Other Adjustments................ -1,721 351 -1,610TOTAL, U.S. DEPARTMENT OF AGRICULTURE.................... $208,982 $231,085 $225,421
Agency / Program
(Dollars in Millions)Program Level

112 APPENDIX
Agency2015
Actual2016
Estimate2017
BudgetFARM AND FOREIGN AGRICULTURAL SERVICES
Farm Service Agency.................................................................... $1,950 $2,152 $1,659Commodity Credit Corporation Programs....................................... 6,699 10,317 13,470Risk Management Agency............................................................. 7,350 9,362 7,637Foreign Agricultural Service........................................................... 252 756 449P.L. 480...................................................................................... 1,121 1,026 995
RURAL DEVELOPMENTSalaries and Expenses.................................................................... 227 291 235Rural Utilities Service.................................................................... 1,602 1,207 320Rural Housing Service................................................................... 2,489 4,728 1,678Rural Business Cooperative Service................................................ 35 225 225
FOOD, NUTRITION, AND CONSUMER SERVICESFood and Nutrition Service............................................................ 103,958 106,896 106,944
NATURAL RESOURCES AND ENVIRONMENTNatural Resources Conservation Service......................................... 3,498 4,301 4,928Forest Service............................................................................... 5,924 7,077 6,539
FOOD SAFETYFood Safety and Inspection Service................................................ 991 1,025 1,041
MARKETING AND REGULATORY PROGRAMSAnimal and Plant Health Inspection Service..................................... 1,712 1,545 1,414Agricultural Marketing Service....................................................... 323 394 366Grain Inspection, Packers and Stockyards Administration................. 31 43 43Section 32 Funds.......................................................................... 740 863 1,155
RESEARCH, EDUCATION, AND ECONOMICSAgricultural Research Service......................................................... 1,115 1,186 1,345Economic Research Service........................................................... 75 107 95National Agricultural Statistics Service............................................ 173 192 177National Institute of Food and Agriculture....................................... 1,323 1,959 1,864
DEPARTMENTAL ACTIVITIESOffice of the Secretary.................................................................. 42 79 85Office of the Chief Economist........................................................ 16 31 20National Appeals Division.............................................................. 13 13 13Office of Budget and Program Analysis.......................................... 7 9 10Office of Chief Information Officer................................................ 52 65 65Office of Chief Financial Officer.................................................... 6 6 9Agriculture Buildings and Facilities.................................................. 83 76 89Hazardous Materials Management.................................................. 6 9 6Office of the General Counsel........................................................ 46 52 54Office of Inspector General............................................................ 89 111 101Office of Civil Rights..................................................................... 23 30 27Working Capital Fund................................................................... -22 199 -2 USDA, SUBTOTAL................................................................... $141,949 $156,332 $153,056
Offsetting Receipts, Rescission, Net Interest, & Other Adjustments..... -2,834 -2,559 -1,572TOTAL, U.S. DEPARTMENT OF AGRICULTURE........................ $139,115 $153,773 $151,484
Outlays(Dollars in Millions)

APPENDIX 113
Agency2015
Actual2016
Estimate2017
BudgetFARM AND FOREIGN AGRICULTURAL SERVICES
Farm Service Agency.................................................................. $1,607 $1,821 $1,687Commodity Credit Corporation Programs..................................... 7 8 9Risk Management Agency........................................................... 77 75 69Foreign Agricultural Service......................................................... 252 755 448P.L. 480.................................................................................... 1,403 1,274 1,232
RURAL DEVELOPMENTSalaries and Expenses................................................................. 227 291 235Rural Utilities Service.................................................................. 1,052 594 561Rural Housing Service................................................................. 1,777 1,939 2,106Rural Business Cooperative Service.............................................. 125 128 131
FOOD, NUTRITION, AND CONSUMER SERVICESFood and Nutrition Service.......................................................... 6,920 6,901 6,900
NATURAL RESOURCES AND ENVIRONMENTNatural Resources Conservation Service....................................... 811 1,137 1,094Forest Service............................................................................ 5,141 6,337 5,868
FOOD SAFETYFood Safety and Inspection Service.............................................. 981 1,014 1,030
MARKETING AND REGULATORY PROGRAMSAnimal and Plant Health Inspection Service.................................. 1,450 1,249 1,127Agricultural Marketing Service..................................................... 77 113 85Grain Inspection, Packers and Stockyards Administration............... 42 43 43
RESEARCH, EDUCATION, AND ECONOMICSAgricultural Research Service....................................................... 1085 1156 1315Economic Research Service......................................................... 75 107 95National Agricultural Statistics Service.......................................... 173 192 177National Institute of Food and Agriculture..................................... 1,230 1,819 1,649
DEPARTMENTAL ACTIVITIESOffice of the Secretary 34 67 70
Office of the Chief Economist...................................................... 16 30 19National Appeals Division............................................................ 13 13 13Office of Budget and Program Analysis........................................ 7 9 10Office of Chief Information Officer.............................................. 52 65 65Office of Chief Financial Officer.................................................. 6 6 9Agriculture Buildings and Facilities............................................... 83 76 89Hazardous Materials Management................................................ 6 9 6Office of the General Counsel...................................................... 46 52 54Office of Inspector General......................................................... 89 111 101Office of Civil Rights.................................................................. 23 30 27Working Capital Fund................................................................. -22 199 -2
USDA, SUBTOTAL................................................................ $24,865 $27,620 $26,322Offsetting Receipts, Rescission & Other Adjustments....................... -357 -405 -810
TOTAL, U.S. DEPARTMENT OF AGRICULTURE...................... $24,508 $27,215 $25,512
Discretionary Outlays(Dollars in Millions)

114 APPENDIX
User Fee Proposals (Dollars in Millions)
2017 Agency and Program Budget Authority Rural Development Rural Housing Service: User Fee Proposal ....................................................................................... 0
• The Budget includes a proposal to authorize a lender user fee of up to $50 per loan to be paid by lenders for access to the agency’s Guaranteed Loan Underwriting System. Annual collections are estimated to be about $4 million and will begin in 2019.
Food Safety Food Safety and Inspection Service:
User Fee Proposal ....................................................................................... 0 • A performance based fee would recover the costs incurred for
additional inspections and related activities made necessary due to the performance of the covered establishment and plant. Examples of the increased costs for which a performance based fee could be charged include food safety assessments, follow-up sampling, and additional investigations due to the outbreak of disease. Total collections are estimated to be about $4 million, which will reduce appropriation needs in future years.
Marketing and Regulatory Programs Animal and Plant Health Inspection Service:
User Fee Proposal ....................................................................................... 0 • The Budget proposal authorizes the Secretary of Agriculture to
prescribe, adjust and collect fees to cover the costs incurred for activities in relation to the review, maintenance and inspections connected to licensing activities associated with the Animal Welfare Act, Virus- Serum-Toxin Act, and the Plant Protection Act. The estimated fees would result in receipts of $20 million, which include $9 million for animal care, $7 million for veterinary biologics, and $4 million for Biotechnology Regulatory Services (BRS). The BRS user fee would enable APHIS to maintain improved biotechnology reviews in the face of an expected increase in workload. Collections under the Animal Welfare Act will reduce appropriation needs in future years; the BRS and Virus-Serum-Toxin Act fees would supplement appropriations.

APPENDIX 115 Grain Inspection, Packers and Stockyards Administration:
User Fee Proposal ....................................................................................... 0 • The Budget proposes to establish a fee for grain standardization and
a Packers and Stockyards license fee. The proposal would result in approximately $30 million in receipts ($6 million and $24 million, respectively), which will reduce appropriation needs in future years.
Natural Resources and Environment Forest Service:
User Fee Proposal ....................................................................................... 15 • The Budget proposes an administrative fee of $2.50 per head of
cattle per month, credited to the National Forest System appropriation, to offset the cost of processing grazing permits and leases. Annual collections are estimated to be about $15 million.
Natural Resource Conservation Service:
User Fee Proposal ....................................................................................... 0 • The Budget proposes to allow the agency to retain and spend funds
from user fees collected for conservation planning technical assistance to partially offset the agency’s cost of developing conservation plans. Annual collections are estimated to be about $4 million.
Departmental Management Departmental Administration:
User Fee Proposal ....................................................................................... 1 • The Budget includes a proposal to assess penalties for misuse of the
BioPreferred label and to authorize the collection of user fees for applicants of the labeling program. Annual collections are estimated to be about $1 million.

116 APPENDIX
Proposed Budget-Related Legislation (Dollars in Millions) 2017 Agency and Program Budget Authority
Farm and Foreign Agricultural Service Risk Management Agency:
Reduce premium subsidy by 10 percentage points for revenue coverage that provides protection for upward price movements at harvest time ..... -1,175 • This type of coverage is the most expensive and integrates increased
harvest price coverage into revenue insurance. It approximates revenue protection available through private markets (for example, call options). Under this proposal, producers would pay an out-of-pocket premium that more closely matches the market price of the purchased coverage. This would shift more of the cost from the taxpayer to the producer. This proposal is expected to save about $16.9 billion over 10 years.
Reform prevented planting coverage ........................................................ -84 • This proposal would reform prevented planting coverage by first
eliminating prevented planting option to purchase 5 or 10 percent higher coverage than that provided by the base prevented planting coverage, and second requiring that a 60 percent transitional yield be applied to the producer’s actual production history for years in which a producer receives a prevented planting payment. This proposal is expected to save about $1.1 billion over 10 years.
Rural Development Rural Housing Service:
Direct Endorsement: Authorize direct endorsement for single family housing guaranteed loans .......................................................................... 0 • The budget requests authorization to implement a preferred lender
program where lenders in good standing can authorize loan guarantees on USDA’s behalf. This is consistent with authorities already established for guaranteed housing loan programs at HUD and VA.
Multi-Family Housing Revitalization Demo: Pursue permanent authorities to revitalize rural multi-family housing .................................. 0 • The Budget proposes to make the demonstration program
permanent. The program has been administered as a demonstration program for more than ten years.
New Hires Database: Gain authorities to access the HHS National Database of New Hires as well as IRS data .............................................. 0

APPENDIX 117
• The Budget proposes to provide the same authorization to access the databases that HUD currently has to help reduce improper payments in means-tested housing programs.
Food, Nutrition, and Consumer Services Food and Nutrition Service: Nationwide Expansion of Summer Electronic Benefit Transfer for Children (SEBTC) ......................................................................................... 146
• The Budget proposes to make SEBTC a permanent program and begin a phased-in nationwide expansion. The proposal includes annual administrative funds for States and localities equal to 10 percent of benefit levels and $20 million in 2017 for start-up costs. The total program cost to implement nationwide expansion of SEBTC is $1.7 billion over 5 years and $12.2 billion over 10 years.
Increase Food Funding for The Emergency Food Assistance Program (TEFAP) to Curtail the Continuing Reduction in Food Resources ................ 30
• Inflationary costs and waning allocations of food funding provided by the 2014 Farm Bill result in a considerable and persistent decline in food resources for TEFAP. These declines will contribute to increasing difficulty in effectively meeting the food needs of program participants.
Create State Option to Improve Access to SNAP for Low Income Elderly ... 10
• This proposal provides about $10 million in 2017 to facilitate States’ ability to improve access to SNAP for low-income elderly individuals. Through a new State option, the States would be able to streamline and simplify application and recertification process for elderly individuals.
Modify Simplified Reporting Requirements to Include Out of State Moves . 0
• This proposal would allow State agencies to require households to report when they move outside of the State in which they are certified. This change will improve customer service for SNAP recipients while increasing the likelihood that fraudulent dual participants are caught.

118 APPENDIX
Natural Resources and Environment Forest Service:
Secure Rural Schools ................................................................................ 225 • The Budget proposes a mandatory reauthorization and five-year
phase-out, through 2021, of the Secure Rural Schools Act which provides consistent and reliable funding for over 775 rural counties and 4,400 schools located near national forests across the United States.
Land and Water Conservation Fund ......................................................... 100 • The Budget proposes mandatory funding from the Land and Water
Conservation Fund. The Forest Service would receive transfers of $38 million to Forest Legacy and $62 million to the Land Acquisition program, for purchase of strategic interagency landscape-scale conservation projects. This will allow the Forest Service to respond to locally supported planning efforts to protect intact critical ecosystems before fragmentation occurs.
Federal Lands Recreation Enhancement Act (FLREA) ............................ 68 • The Budget proposes to permanently reauthorize FLREA which
would provide recreation fee authority for the Forest Service for the operations and maintenance of recreation facilities or for payment for the National Recreation Reservation. This joint proposal with the Department of the Interior is intended to ensure quality recreation opportunities on public lands for the American people.
National Fish and Wildlife Foundation (NFWF) ...................................... 0 • The Budget proposes to update the authorization for NFWF
appropriations to allow for ongoing appropriations by the Interior Environment and Related Agencies appropriations. The proposal continues the NFWF offset against the total funding for the Forest Service, $3 million annually.
Research, Education and Economics National Institute of Food and Agriculture: Investment in Agricultural Research and Development ................................ 325
• The Budget includes a legislative proposal to make available $325 million in mandatory funding in 2017 for the Agriculture and Food Research Initiative (AFRI). Together with a discretionary appropriation of $375 million, this would fully fund AFRI at its authorized level.

United States Department of Agriculture