usd 484 - fredonia finance/budget/budget_at_a_glance/13-14_summary...the mission of fredonia usd...
TRANSCRIPT

i
USD 484 - Fredonia

ii
• Budget General Information (characteristics of district)
• Supplemental Information for Tables in Summary of Expenditures
• KSDE Website Information Available
• Summary of Expenditures (Sumexpen.xlsx)

1
2013-2014 Budget General Information for USD # 484
Introduction
The Board of Education, personnel and community of USD 484 of Fredonia, Kansas are dedicated to providing quality educational experiences for all the students of our school district, which will provide for them the skills and abilities necessary to meet their academic, cultural, social and emotional needs as we enter the 21st century. The district has high expectations for its students and personnel and pledges to provide quality experiences that will help each student realize his or her potential. The Mission of USD 484 is as follows:
The mission of Fredonia USD #484, a dynamic community driven by high expectations for all students, is to educate and inspire each student to develop the necessary skills to be a productive, contributing member of our culturally diverse, ever-changing world, through effectively utilizing
all available resources.
Board Members Carl Shay, President 521 N. 15th Street Fredonia, KS 66736 Linda John-Collins, Vice President 10783 Marion Rd. Fredonia, KS 66736 Feyn Baker 3698 1100 Rd. Fredonia, KS 66736 Bill Freeman 1018 Jackson Street Fredonia, KS 66736 John Humphrey 1127 Robinson Street Fredonia, KS 66736 Pat Shay 1307 Madison Street Fredonia, KS 66736 Deb Wells 12313 Kansas 47 Hwy Fredonia, KS 66736
Key Staff Superintendent of School: Jim Porter Business Manager and Governing Board Clerk: Diana Bredehoft High School Principal: Jim Lambert Middle School Principal: Laura Fitzmorris Elementary School Principal Aaron Chard Assistant Principal/Activities Director Marshall Nienstedt Food Service Supervisor: Joyce Whitson Transportation Supervisor: Logan Apollo Maintenance Supervisor: Justin Wall Technology Coordinator: Shelby Huddleston NCA Chair Brian Houghton Curriculum Director Chary Weilert
2
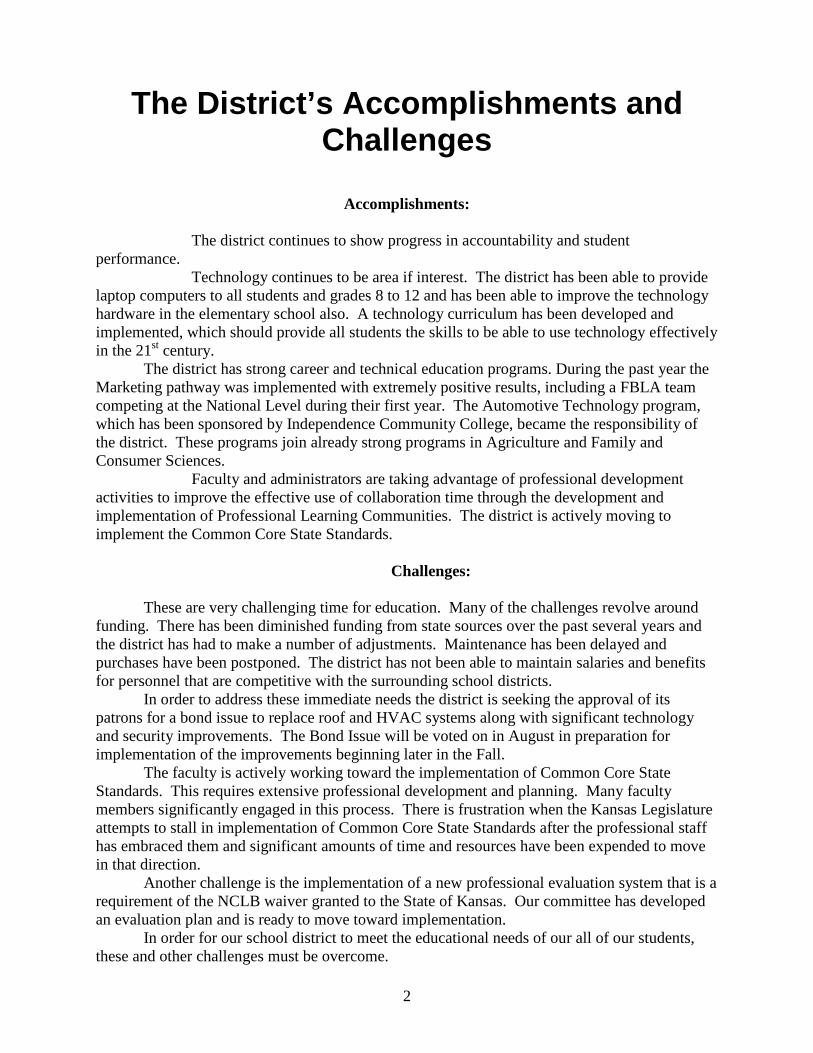
The District’s Accomplishments and
Challenges
Accomplishments:
The district continues to show progress in accountability and student
performance. Technology continues to be area if interest. The district has been able to provide
laptop computers to all students and grades 8 to 12 and has been able to improve the technology hardware in the elementary school also. A technology curriculum has been developed and implemented, which should provide all students the skills to be able to use technology effectively in the 21st century.
The district has strong career and technical education programs. During the past year the Marketing pathway was implemented with extremely positive results, including a FBLA team competing at the National Level during their first year. The Automotive Technology program, which has been sponsored by Independence Community College, became the responsibility of the district. These programs join already strong programs in Agriculture and Family and Consumer Sciences.
Faculty and administrators are taking advantage of professional development activities to improve the effective use of collaboration time through the development and implementation of Professional Learning Communities. The district is actively moving to implement the Common Core State Standards.
Challenges:
These are very challenging time for education. Many of the challenges revolve around funding. There has been diminished funding from state sources over the past several years and the district has had to make a number of adjustments. Maintenance has been delayed and purchases have been postponed. The district has not been able to maintain salaries and benefits for personnel that are competitive with the surrounding school districts. In order to address these immediate needs the district is seeking the approval of its patrons for a bond issue to replace roof and HVAC systems along with significant technology and security improvements. The Bond Issue will be voted on in August in preparation for implementation of the improvements beginning later in the Fall. The faculty is actively working toward the implementation of Common Core State Standards. This requires extensive professional development and planning. Many faculty members significantly engaged in this process. There is frustration when the Kansas Legislature attempts to stall in implementation of Common Core State Standards after the professional staff has embraced them and significant amounts of time and resources have been expended to move in that direction. Another challenge is the implementation of a new professional evaluation system that is a requirement of the NCLB waiver granted to the State of Kansas. Our committee has developed an evaluation plan and is ready to move toward implementation. In order for our school district to meet the educational needs of our all of our students, these and other challenges must be overcome.

3
Supplemental Information for the Following Tables 1. Summary of Total Expenditures by Function (All Funds) 2. Summary of General Fund Expenditures by Function 3. Summary of Supplemental General Fund Expenditures by Function 4. Summary of General and Supplemental General Fund Expenditures by Function 5. Summary of Special Education Fund by Function 6. Instruction Expenditures (1000) 7. Student and Instructional Support Expenditures (2100 & 2200) 8. General Administration Expenditures (2300) 9. School Administration Expenditures (2400) 10. Operations and Maintenance Expenditures (2600) 11. Other Costs (2500 & 2900: Other Supplemental Services) (3000: Non-Instruction
Services) 12. Capital Improvements (4000) 13. Debt Services (5000)
14. Miscellaneous Information - Transfers 15. Miscellaneous Information Unencumbered Cash Balance by Fund 16. Reserve Funds Unencumbered Cash Balance 17. Other Information - FTE 18. Miscellaneous Information Mill Rates by Fund 19. Other Information – Assessed Valuation and Bonded Indebtedness Note: The FTE (full time equivalency) used in this report to calculate the “Amount Per Pupil” is defined as following: Enrollment (FTE) includes the enrollment of the district used for state aid and budget authority, and all other preschool enrollment and kindergarten students attending full time.
4
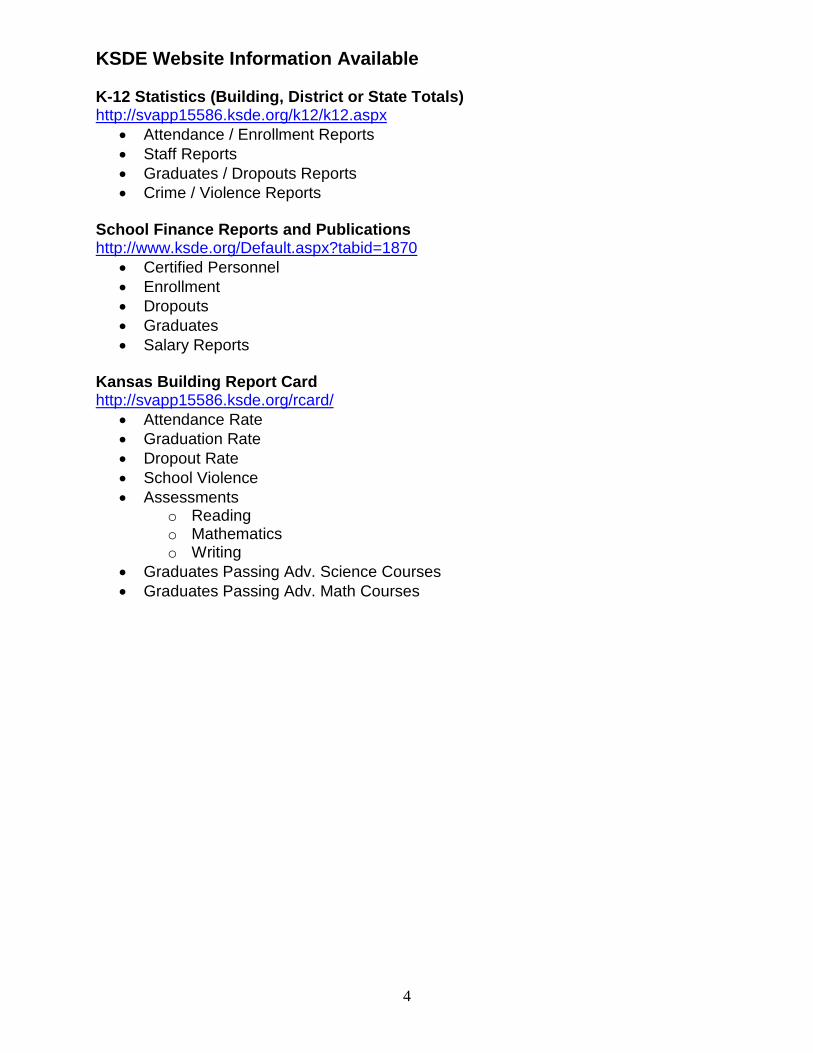
KSDE Website Information Available K-12 Statistics (Building, District or State Totals) http://svapp15586.ksde.org/k12/k12.aspx
• Attendance / Enrollment Reports • Staff Reports • Graduates / Dropouts Reports • Crime / Violence Reports
School Finance Reports and Publications http://www.ksde.org/Default.aspx?tabid=1870
• Certified Personnel • Enrollment • Dropouts • Graduates • Salary Reports
Kansas Building Report Card http://svapp15586.ksde.org/rcard/
• Attendance Rate • Graduation Rate • Dropout Rate • School Violence • Assessments
o Reading o Mathematics o Writing
• Graduates Passing Adv. Science Courses • Graduates Passing Adv. Math Courses

USD# 484
Summary of Total Expenditures By Function (All Funds)
% % % % %
2011-2012 of 2012-2013 of inc/ 2013-2014 of inc/
Actual Tot Actual Tot dec Budget Tot dec
Instruction 4,884,125 59% 4,682,042 58% -4% 5,176,390 54% 11%
Student Support Services 206,558 3% 214,121 3% 4% 219,251 2% 2%
Instructional Support Services 345,359 4% 315,945 4% -9% 301,758 3% -4%
General Administration 266,493 3% 282,961 4% 6% 368,147 4% 30%
School Administration (Building) 607,183 7% 623,514 8% 3% 676,613 7% 9%
Operations & Maintenance 761,750 9% 827,606 10% 9% 920,350 10% 11%
Transportation 325,305 4% 397,832 5% 22% 502,523 5% 26%
Food Services 506,019 6% 559,679 7% 11% 701,512 7% 25%
Capital Improvements 258,681 3% 77,291 1% -70% 450,000 5% 482%
Debt Services 0 0% 0 0% 0% 0 0% 0%
Other Costs 66,312 1% 74,510 1% 12% 188,471 2% 153%
Total Expenditures* 8,227,785 100% 8,055,501 100% -2% 9,505,015 100% 18%
Amount per Pupil $12,198 $12,315 1% $14,623 19%
Current Expenditures** 7,735,925 100% 7,827,408 100% 1% 8,570,015 100% 9%
Amount per Pupil $11,469 $11,967 4% $13,185 10%
Instruction*** (Total Expenditures) 4,681,504 57% 4,647,636 58% 1% 4,876,390 51% -7%
Instruction*** (Current Expenditures) 4,681,504 61% 4,647,636 59% -2% 4,876,390 57% -2%
Note: Percentages on charts are within +-1% due to rounding used. Pie graph percentages may differ from charts for this reason also.
Further definition of what goes into each category:
Instruction - 1000 Transportation - 2700
Student Support Services - 2100 Food Service - 3100
Instructional Support Services - 2200 Other Costs - 2500/2900 and 3300
General Administration - 2300 Capital Improvements - 4000
School Administration (Building) - 2400 Debt Services - 5100
Operations & Maintenance - 2600 Transfers - 5200
Percent of Expenditures
* The funds that are included in the categories above are: General, Supplemental General, Bilingual Education, At Risk(4yr Old), At Risk(K-12), Virtual Education, Capital
Outlay, Driver Education, Extraordinary School Program, Summer School, Special Education, Vocational Education, Professional Development, Bond & Interest #1, Bond &
Interest #2, No-Fund Warrant, Special Assessment, Parent Education, School Retirement, Student Materials Revolving & Textbook Rental, Tuition Reimbursement,
Gifts/Grants, KPERS Special Retirement Contribution, Contingency, Special Liability Expense, Federal Funds, Adult Education, Adult Supplemental Education, Activity Fund
and Special Education Coop Fund.
*** Instruction excludes Capital Outlay and Bond Debt expenditures (Code 16, Code 62, Code 63)
** Current Spending excludes Capital Outlay and Bond Debt expenditures (Code 16, Code 62, Code 63)
0
1,000,000
2,000,000
3,000,000
4,000,000
5,000,000
6,000,0005,176,390
219,251 301,758 368,147 676,613
920,350 502,523 701,512
450,000 0 188,471
Summary of Total Expenditures by Function (All Funds)
2011-2012
2012-2013
2013-2014
Instruction 55%
Student Support Services 2%
Instructional Support 3%
General Administration 4%
School Administration (Building)
7%
Operations & Maintenance 10%
Transportation 5%
Food Services 7%
Capital Improvements 5%
Other Costs 2%
2013-14 Summary of Total Expenditures by Function
Instruction
Student Support Services
Instructional Support
General Administration
School Administration (Building)
Operations & Maintenance
Transportation
Food Services
Capital Improvements
Debt Services
Other Costs
9/17/2013 2:56 PM Sumexpen.xlsx Page 1 of 24

USD# 484
Summary of General Fund Expenditures
by Function
% % % % %
2011-2012 of 2012-2013 of inc/ 2013-2014 of inc/
Actual Tot Actual Tot dec Budget Tot dec
Instruction 1,696,486 47% 1,789,864 48% 6% 1,853,287 43% 4%
Student Support 187,931 5% 193,272 5% 3% 195,468 5% 1%
Instructional Support 231,129 6% 209,814 6% -9% 232,813 5% 11%
General Administration 245,074 7% 242,101 7% -1% 297,988 7% 23%
School Administration (Building) 366,732 10% 366,374 10% 0% 388,353 9% 6%
Operations & Maintenance 496,266 14% 549,419 15% 11% 751,045 18% 37%
Transportation 303,984 8% 297,717 8% -2% 389,157 9% 31%
Capital Improvements 0 0% 0 0% 0% 0 0% 0%
Other Costs 55,729 2% 66,251 2% 19% 172,335 4% 160%
Total Expenditures 3,583,331 100% 3,714,812 100% 4% 4,280,446 100% 15%
Amount per Pupil $5,313 $5,679 7% $6,585 16%
The Summary of General Fund Expenditures chart information comes from pages 6-13 and only uses the 'General Fund' line items.
0
200,000
400,000
600,000
800,000
1,000,000
1,200,000
1,400,000
1,600,000
1,800,000
2,000,000 1,853,287
195,468 232,813 297,988
388,353
751,045
389,157
0
172,335
Summary of General Fund Expenditures
2011-2012
2012-2013
2013-2014
Instruction 43%
Student Support 5%
Instructional Support
5% General Administration
7%
School Administration (Building)
9%
Operations & Maintenance 18%
Transportation 9%
Other Costs 4%
2013-14 Summary of General Fund Expenditures by Function
Instruction
Student Support
Instructional Support
General Administration
School Administration (Building)
Operations & Maintenance
Transportation
Capital Improvements
Other Costs
9/17/2013 2:56 PM Sumexpen.xlsx Page 2 of 24

USD# 484
Summary of Supplemental General Fund Expenditures
by Function
% % % % %
2011-2012 of 2012-2013 of inc/ 2013-2014 of inc/
Actual Tot Actual Tot dec Budget Tot dec
Instruction 424,000 46% 434,984 45% 3% 533,136 60% 23%
Student Support 0 0% 0 0% 0% 0 0% 0%
Instructional Support 80,971 9% 83,654 9% 3% 11,500 1% -86%
General Administration 0 0% 0 0% 0% 0 0% 0%
School Administration (Building) 181,696 20% 205,104 21% 13% 202,215 23% -1%
Operations & Maintenance 235,468 25% 243,502 25% 3% 131,000 15% -46%
Transportation 0 0% 0 0% 0% 0 0% 0%
Capital Improvements 0 0% 0 0% 0% 0 0% 0%
Other Costs 8,373 1% 4,156 0% -50% 11,500 1% 177%
Total Expenditures 930,508 100% 971,400 100% 4% 889,351 100% -8%
Amount per Pupil $1,380 $1,485 8% $1,368 -8%
The Summary of Supplemental General Fund Expenditures chart information comes from pages 6-13 and only uses the 'Supplemental
General Fund' line items.
0
100,000
200,000
300,000
400,000
500,000
600,000533,136
0 11,500 0
202,215
131,000
0 0 11,500
Summary of Supplemental General Expenditures by Function
2011-2012
2012-2013
2013-2014
Instruction 60%
Instructional Support 1%
School Administration (Building) 23%
Operations & Maintenance 15%
Other Costs 1%
2013-14 Summary of Supplemental General Fund Expenditures by Function
Instruction
Student Support
Instructional Support
General Administration
School Administration (Building)
Operations & Maintenance
Transportation
Capital Improvements
Other Costs
9/17/2013 2:56 PM Sumexpen.xlsx Page 3 of 24

USD# 484
Summary of General and Supplemental General Fund
Expenditures by Function
% % % % %
2011-2012 of 2012-2013 of inc/ 2013-2014 of inc/
Actual Tot Actual Tot dec Budget Tot dec
Instruction 2,120,486 47% 2,224,848 47% 5% 2,386,423 46% 7%
Student Support 187,931 4% 193,272 4% 3% 195,468 4% 1%
Instructional Support 312,100 7% 293,468 6% -6% 244,313 5% -17%
General Administration 245,074 5% 242,101 5% -1% 297,988 6% 23%
School Administration (Building) 548,428 12% 571,478 12% 4% 590,568 11% 3%
Operations & Maintenance 731,734 16% 792,921 17% 8% 882,045 17% 11%
Transportation 303,984 7% 297,717 6% -2% 389,157 8% 31%
Capital Improvements 0 0% 0 0% 0% 0 0% 0%
Other Costs 64,102 1% 70,407 2% 10% 183,835 4% 161%
Total Expenditures 4,513,839 100% 4,686,212 100% 4% 5,169,797 100% 10%
Amount per Pupil $6,692 $7,164 7% $7,954 11%
The Summary of General and Supplemental General Fund Expenditures chart information comes from pages 6-13 and adds together
the 'General Fund' and 'Supplemental General Fund' line items.
0
500,000
1,000,000
1,500,000
2,000,000
2,500,0002,386,423
195,468 244,313 297,988
590,568
882,045
389,157
0 183,835
Summary of General and Supplemental General Fund Expenditures by Function
2011-2012
2012-2013
2013-2014
Instruction 46%
Student Support 4%
Instructional Support 5%
General Administration 6%
School Administration (Building)
11%
Operations & Maintenance 17%
Transportation 7%
Other Costs 4%
2013-14 Summary of General and Supplemental General Fund Expenditures by Function
Instruction
Student Support
Instructional Support
General Administration
School Administration (Building)
Operations & Maintenance
Transportation
Capital Improvements
Other Costs
9/17/2013 2:56 PM Sumexpen.xlsx Page 4 of 24

USD# 484
Summary of Special Education Fund
by Function
% % % % %
2011-2012 of 2012-2013 of inc/ 2013-2014 of inc/
Actual Tot Actual Tot dec Budget Tot dec
Instruction 866,628 99% 851,689 99% -2% 933,000 99% 10%
Student Support 0 0% 0 0% 0% 0 0% 0%
Instructional Support 0 0% 0 0% 0% 0 0% 0%
General Administration 0 0% 0 0% 0% 0 0% 0%
School Administration (Building) 0 0% 0 0% 0% 0 0% 0%
Operations & Maintenance 0 0% 0 0% 0% 0 0% 0%
Transportation 7,946 1% 9,706 1% 22% 14,000 1% 44%
Capital Improvements 0 0% 0 0% 0% 0 0% 0%
Other Costs 0 0% 0 0% 0% 0 0% 0%
Total Expenditures 874,574 100% 861,395 100% -2% 947,000 100% 10%
Amount per Pupil $1,297 $1,317 2% $1,457 11%
The Summary of Special Education Fund Expenditures chart information comes from pages 6-13 and only uses the 'Special Education Fund'
line items. (Total expenditures excludes Special Ed Coop Fund because it would include expenditures for all schools participating in the Coop.)
0
100,000
200,000
300,000
400,000
500,000
600,000
700,000
800,000
900,000
1,000,000
86
6,6
28
0
0
0
0
0 7,9
46
0
0
85
1,6
89
0
0
0
0
0 9,7
06
0
0
93
3,0
00
0
0
0
0
0 14
,00
0
0
0
Summary of Special Education Fund Expenditures by Function
2011-2012
2012-2013
2013-2014
Instruction 99%
Transportation 1%
2013-14 Summary of Special Education Fund by Function
Instruction
Student Support
Instructional Support
General Administration
School Administration (Building)
Operations & Maintenance
Transportation
Capital Improvements
Other Costs
9/17/2013 2:56 PM Sumexpen.xlsx Page 5 of 24

USD# 484
Instruction Expenditures (1000)
% %
2011-2012 2012-2013 inc/ 2013-2014 inc/
Actual Actual dec Budget dec
General 1,696,486 1,789,864 6% 1,853,287 4%
Federal Funds 275,547 267,318 -3% 240,819 -10%
Supplemental General 424,000 434,984 3% 533,136 23%
At Risk (4yr Old) 50,788 51,920 2% 60,000 16%
At Risk (K-12) 777,006 794,022 2% 823,778 4%
Bilingual Education 0 0 0% 0 0%
Virtual Education 0 9,348 0% 5,000 -47%
Capital Outlay 202,621 34,406 -83% 300,000 772%
Driver Education 8,618 9,545 11% 9,545 0%
Declining Enrollment 0 0 0% 0 0%
Extraordinary School Program 0 0 0% 0 0%
Food Service 0 0 0% 0 0%
Professional Development 0 0 0% 0 0%
Parent Education Program 0 0 0% 0 0%
Summer School 0 0 0% 0 0%
Special Education 866,628 851,689 -2% 933,000 10%
Cost of Living 0 0 0% 0 0%
Vocational Education 90,268 130,102 44% 168,379 29%
Gifts/Grants 0 0 0% 0 0%
Special Liability 0 0 0% 0 0%
School Retirement 0 0 0% 0 0%
Extraordinary Growth Facilities 0 0 0% 0 0%
Special Reserve 0 0 0%
KPERS Spec. Ret. Contribution 282,258 220,749 -22% 249,446 13%
Contingency Reserve 146,259 63 -100%
Text Book & Student Material 4,127 15,122 266%
Activity Fund 59,519 72,910 22% 0 -100%
Bond and Interest #1 0 0 0% 0 0%
Bond and Interest #2 0 0 0% 0 0%
No-Fund Warrant 0 0 0% 0 0%
Special Assessment 0 0 0% 0 0%
Temporary Note 0 0 0% 0 0%
SUBTOTAL 4,884,125 4,682,042 -4% 5,176,390 11%
Enrollment (FTE)* 674.5 654.1 -3% 650.0 -1%
Amount per Pupil 7,241 7,158 -1% 7,964 11%
Adult Education 0 0 0% 0 0%
Adult Supplemental Education 0 0 0% 0 0%
Tuition Reimbursement 0 0 0% 0 0%
Special Education Coop 0 0 0% 0 0%
TOTAL 4,884,125 4,682,042 -4% 5,176,390 11%
NOTE: Gifts/Grants includes private grants and grants from nonfederal sources.
Amount per pupil excludes the following funds: Adult Education, Adult Supplemental Education, Special Education Coop
and Tuition Reimbursement.
*Enrollment (FTE) includes the enrollment of the district used for state aid and budget authority, and all other preschool enrollment
and kindergarten students attending full time.
0
500,000
1,000,000
1,500,000
2,000,000
2011-2012 2012-2013 2013-2014
1,696,486 1,789,864 1,853,287
424,000 434,984 533,136
866,628 851,689 933,000
Instruction Expenditures
GeneralSupplemental GeneralSpecial Education
4,400,000
4,500,000
4,600,000
4,700,000
4,800,000
4,900,000
5,000,000
5,100,000
5,200,000
2011-2012 2012-2013 2013-2014
4,884,125
4,682,042
5,176,390
Instruction Expenditures
9/17/2013 2:56 PM Sumexpen.xlsx Page 6 of 24

USD# 484
Student Support Expenditures (2100)
% %
2011-2012 2012-2013 inc/ 2013-2014 inc/
Actual Actual dec Budget dec
General 187,931 193,272 3% 195,468 1%
Federal Funds 0 0 0% 0 0%
Supplemental General 0 0 0% 0 0%
At Risk (4yr Old) 0 0 0% 0 0%
At Risk (K-12) 3,146 739 -77% 0 -100%
Bilingual Education 0 0 0% 0 0%
Virtual Education 0 0 0% 0 0%
Capital Outlay 0 0 0% 0 0%
Driver Training 0 0 0% 0 0%
Declining Enrollment 0 0 0% 0 0%
Extraordinary School Program 0 0 0% 0 0%
Food Service 0 0 0% 0 0%
Professional Development 0 0 0% 0 0%
Parent Education Program 5,700 5,700 0% 7,500 32%
Summer School 0 0 0% 0 0%
Special Education 0 0 0% 0 0%
Cost of Living 0 0 0% 0 0%
Vocational Education 0 0 0% 0 0%
Gifts/Grants 0 0 0% 0 0%
Special Liability 0 0 0% 0 0%
School Retirement 0 0 0% 0 0%
Extraordinary Growth Facilities 0 0 0% 0 0%
Special Reserve 0 0 0%
KPERS Spec. Ret. Contribution 9,781 14,410 47% 16,283 13%
Contingency Reserve 0 0 0%
Text Book & Student Material 0 0 0%
Activity Fund 0 0 0% 0 0%
Bond and Interest #1 0 0 0% 0 0%
Bond and Interest #2 0 0 0% 0 0%
No-Fund Warrant 0 0 0% 0 0%
Special Assessment 0 0 0% 0 0%
Temporary Note 0 0 0% 0 0%
SUBTOTAL 206,558 214,121 4% 219,251 2%
Enrollment (FTE)* 674.5 654.1 -3% 650.0 -1%
Amount per Pupil 306 327 7% 337 3%
Adult Education 0 0 0% 0 0%
Adult Supplemental Education 0 0 0% 0 0%
Tuition Reimbursement 0 0 0% 0 0%
Special Education Coop 0 0 0% 0 0%
TOTAL 206,558 214,121 4% 219,251 2%
Amount per Pupil $318 $317 -1% $337 7%
NOTE: Gifts/Grants includes private grants and grants from nonfederal sources.
Amount per pupil excludes the following funds: Adult Education, Adult Supplemental Education, Special Education Coop
and Tuition Reimbursement.
*Enrollment (FTE) includes the enrollment of the district used for state aid and budget authority, and all other preschool enrollment
and kindergarten students attending full time.
200,000
202,000
204,000
206,000
208,000
210,000
212,000
214,000
216,000
218,000
220,000
2011-2012 2012-2013 2013-2014
206,558
214,121
219,251
Student Support Expenditures
9/17/2013 2:56 PM Sumexpen.xlsx Page 7 of 24

USD# 484
Instructional Support Expenditures (2200)
% %
2011-2012 2012-2013 inc/ 2013-2014 inc/
Actual Actual dec Budget dec
General 231,129 209,814 -9% 232,813 11%
Federal Funds 0 0 0% 0 0%
Supplemental General 80,971 83,654 3% 11,500 -86%
At Risk (4yr Old) 0 0 0% 0 0%
At Risk (K-12) 0 0 0% 0 0%
Bilingual Education 0 0 0% 0 0%
Virtual Education 0 0 0% 0 0%
Capital Outlay 0 0 0% 0 0%
Driver Training 0 0 0% 0 0%
Declining Enrollment 0 0 0% 0 0%
Extraordinary School Program 0 0 0% 0 0%
Food Service 0 0 0% 0 0%
Professional Development 15,669 402 -97% 32,500 7985%
Parent Education Program 0 0 0% 0 0%
Summer School 0 0 0% 0 0%
Special Education 0 0 0% 0 0%
Cost of Living 0 0 0% 0 0%
Vocational Education 0 0 0% 0 0%
Gifts/Grants 0 0 0% 0 0%
Special Liability 0 0 0% 0 0%
School Retirement 0 0 0% 0 0%
Extraordinary Growth Facilities 0 0 0% 0 0%
Special Reserve 0 0 0%
KPERS Spec. Ret. Contribution 17,590 22,075 25% 24,945 13%
Contingency Reserve 0 0 0%
Text Book & Student Material 0 0 0%
Activity Fund 0 0 0% 0 0%
Bond and Interest #1 0 0 0% 0 0%
Bond and Interest #2 0 0 0% 0 0%
No-Fund Warrant 0 0 0% 0 0%
Special Assessment 0 0 0% 0 0%
Temporary Note 0 0 0% 0 0%
SUBTOTAL 345,359 315,945 -9% 301,758 -4%
Enrollment (FTE)* 674.5 654.1 -3% 650.0 -1%
Amount per Pupil 512 483 -6% 464 -4%
Adult Education 0 0 0% 0 0%
Adult Supplemental Education 0 0 0% 0 0%
Tuition Reimbursement 0 0 0% 0 0%
Special Education Coop 0 0 0% 0 0%
TOTAL 345,359 315,945 -9% 301,758 -4%
Amount per Pupil $512 $483 -6% $464 -4%
NOTE: Gifts/Grants includes private grants and grants from nonfederal sources.
Amount per pupil excludes the following funds: Adult Education, Adult Supplemental Education, Special Education Coop
and Tuition Reimbursement.
*Enrollment (FTE) includes the enrollment of the district used for state aid and budget authority, and all other preschool enrollment
and kindergarten students attending full time.
270,000
280,000
290,000
300,000
310,000
320,000
330,000
340,000
350,000
2011-2012 2012-2013 2013-2014
345,359
315,945
301,758
Instructional Support Expenditures
9/17/2013 2:56 PM Sumexpen.xlsx Page 8 of 24

USD# 484
General Administration Expenditures (2300)
% %
2011-2012 2012-2013 inc/ 2013-2014 inc/
Actual Actual dec Budget dec
General 245,074 242,101 -1% 297,988 23%
Federal Funds 0 0 0% 0 0%
Supplemental General 0 0 0% 0 0%
At Risk (4yr Old) 0 0 0% 0 0%
At Risk (K-12) 0 0 0% 0 0%
Bilingual Education 0 0 0% 0 0%
Virtual Education 0 0 0% 0 0%
Capital Outlay 7,358 23,020 213% 50,000 117%
Driver Training 0 0 0% 0 0%
Declining Enrollment 0 0 0% 0 0%
Extraordinary School Program 0 0 0% 0 0%
Food Service 0 0 0% 0 0%
Professional Development 0 0 0% 0 0%
Parent Education Program 0 0 0% 0 0%
Summer School 0 0 0% 0 0%
Special Education 0 0 0% 0 0%
Cost of Living 0 0 0% 0 0%
Vocational Education 0 0 0% 0 0%
Gifts/Grants 0 0 0% 0 0%
Special Liability Expense 0 0 0% 0 0%
School Retirement 0 0 0% 0 0%
Extraordinary Growth Facilities 0 0 0% 0 0%
Special Reserve 0 0 0%
KPERS Spec. Ret. Contribution 14,061 17,840 27% 20,159 13%
Contingency Reserve 0 0 0%
Text Book & Student Material 0 0 0%
Activity Fund 0 0 0% 0 0%
Bond and Interest #1 0 0 0% 0 0%
Bond and Interest #2 0 0 0% 0 0%
No-Fund Warrant 0 0 0% 0 0%
Special Assessment 0 0 0% 0 0%
Temporary Note 0 0 0% 0 0%
SUBTOTAL 266,493 282,961 6% 368,147 30%
Enrollment (FTE)* 674.5 654.1 -3% 650.0 -1%
Amount per Pupil 395 433 9% 566 31%
Adult Education 0 0 0% 0 0%
Adult Supplemental Education 0 0 0% 0 0%
Tuition Reimbursement 0 0 0% 0 0%
Special Education Coop 0 0 0% 0 0%
TOTAL 266,493 282,961 6% 368,147 30%
NOTE: Gifts/Grants includes private grants and grants from nonfederal sources.
Amount per pupil excludes the following funds: Adult Education, Adult Supplemental Education, Special Education Coop
and Tuition Reimbursement.
*Enrollment (FTE) includes the enrollment of the district used for state aid and budget authority, and all other preschool enrollment
and kindergarten students attending full time.
0
50,000
100,000
150,000
200,000
250,000
300,000
350,000
400,000
2011-2012 2012-2013 2013-2014
266,493 282,961
368,147
General Administration Expenditures
9/17/2013 2:56 PM Sumexpen.xlsx Page 9 of 24

USD# 484
School Administration Expenditures (2400)
% %
2011-2012 2012-2013 inc/ 2013-2014 inc/
Actual Actual dec Budget dec
General 366,732 366,374 0% 388,353 6%
Federal Funds 0 0 0% 0 0%
Supplemental General 181,696 205,104 13% 202,215 -1%
At Risk (4yr Old) 0 0 0% 0 0%
At Risk (K-12) 4,154 4,458 7% 0 -100%
Bilingual Education 0 0 0% 0 0%
Virtual Education 0 0 0% 0 0%
Capital Outlay 22,200 15,680 -29% 50,000 219%
Driver Training 0 0 0% 0 0%
Declining Enrollment 0 0 0% 0 0%
Extraordinary School Program 0 0 0% 0 0%
Food Service 0 0 0% 0 0%
Professional Development 0 0 0% 0 0%
Parent Education Program 0 0 0% 0 0%
Summer School 0 0 0% 0 0%
Special Education 0 0 0% 0 0%
Cost of Living 0 0 0% 0 0%
Vocational Education 0 0 0% 0 0%
Gifts/Grants 0 0 0% 0 0%
Special Liability Expense 0 0 0% 0 0%
School Retirement 0 0 0% 0 0%
Extraordinary Growth Facilities 0 0 0% 0 0%
Special Reserve 0 0 0%
KPERS Spec. Ret. Contribution 32,401 31,898 -2% 36,045 13%
Contingency Reserve 0 0 0%
Text Book & Student Material 0 0 0%
Activity Fund 0 0 0% 0 0%
Bond and Interest #1 0 0 0% 0 0%
Bond and Interest #2 0 0 0% 0 0%
No-Fund Warrant 0 0 0% 0 0%
Special Assessment 0 0 0% 0 0%
Temporary Note 0 0 0% 0 0%
SUBTOTAL 607,183 623,514 3% 676,613 9%
Enrollment (FTE)* 674.5 654.1 -3% 650.0 -1%
Amount per Pupil 900 953 6% 1,041 9%
Adult Education 0 0 0% 0 0%
Adult Supplemental Education 0 0 0% 0 0%
Tuition Reimbursement 0 0 0% 0 0%
Special Education Coop 0 0 0% 0 0%
TOTAL 607,183 623,514 3% 676,613 9%
NOTE: Gifts/Grants includes private grants and grants from nonfederal sources.
Amount per pupil excludes the following funds: Adult Education, Adult Supplemental Education, Special Education Coop
and Tuition Reimbursement.
*Enrollment (FTE) includes the enrollment of the district used for state aid and budget authority, and all other preschool enrollment
and kindergarten students attending full time.
560,000
580,000
600,000
620,000
640,000
660,000
680,000
2011-2012 2012-2013 2013-2014
607,183
623,514
676,613
School Administration Expenditures
9/17/2013 2:56 PM Sumexpen.xlsx Page 10 of 24

USD# 484
Operations and Maintenance Expenditures (2600)
% %
2011-2012 2012-2013 inc/ 2013-2014 inc/
Actual Actual dec Budget dec
General 496,266 549,419 11% 751,045 37%
Federal Funds 0 0 0% 0 0%
Supplemental General 235,468 243,502 3% 131,000 -46%
At Risk (4yr Old) 0 0 0% 0 0%
At Risk (K-12) 0 0 0% 0 0%
Bilingual Education 0 0 0% 0 0%
Virtual Education 0 0 0% 0 0%
Capital Outlay 0 0 0% 0 0%
Driver Training 0 0 0% 0 0%
Declining Enrollment 0 0 0% 0 0%
Extraordinary School Program 0 0 0% 0 0%
Food Service 6,840 6,840 0% 6,840 0%
Professional Development 0 0 0% 0 0%
Parent Education Program 0 0 0% 0 0%
Summer School 0 0 0% 0 0%
Special Education 0 0 0% 0 0%
Cost of Living 0 0 0% 0 0%
Vocational Education 0 0 0% 0 0%
Gifts/Grants 0 0 0% 0 0%
Special Liability 0 0 0% 0 0%
School Retirement 0 0 0% 0 0%
Extraordinary Growth Facilities 0 0 0% 0 0%
Special Reserve 0 0 0%
KPERS Spec. Ret. Contribution 23,176 27,845 20% 31,465 13%
Contingency Reserve 0 0 0%
Text Book & Student Material 0 0 0%
Activity Fund 0 0 0% 0 0%
Bond and Interest #1 0 0 0% 0 0%
Bond and Interest #2 0 0 0% 0 0%
No-Fund Warrant 0 0 0% 0 0%
Special Assessment 0 0 0% 0 0%
Temporary Note 0 0 0% 0 0%
SUBTOTAL 761,750 827,606 9% 920,350 11%
Enrollment (FTE)* 674.5 654.1 -3% 650.0 -1%
Amount per Pupil 1,129 1,265 12% 1,416 12%
Adult Education 0 0 0% 0 0%
Adult Supplemental Education 0 0 0% 0 0%
Tuition Reimbursement 0 0 0% 0 0%
Special Education Coop 0 0 0% 0 0%
TOTAL 761,750 827,606 9% 920,350 11%
NOTE: Gifts/Grants includes private grants and grants from nonfederal sources.
Amount per pupil excludes the following funds: Adult Education, Adult Supplemental Education, Special Education Coop
and Tuition Reimbursement.
*Enrollment (FTE) includes the enrollment of the district used for state aid and budget authority, and all other preschool enrollment
and kindergarten students attending full time.
0
100,000
200,000
300,000
400,000
500,000
600,000
700,000
800,000
900,000
1,000,000
2011-2012 2012-2013 2013-2014
761,750
827,606
920,350
Operations and Maintenance Expenditures
9/17/2013 2:56 PM Sumexpen.xlsx Page 11 of 24

USD# 484
Transportation Expenditures (2700)
% %
2011-2012 2012-2013 inc/ 2013-2014 inc/
Actual Actual dec Budget dec
General 303,984 297,717 -2% 389,157 31%
Federal Funds 0 0 0% 0 0%
Supplemental General 0 0 0% 0 0%
At Risk (4yr Old) 0 0 0% 0 0%
At Risk (K-12) 0 0 0% 0 0%
Bilingual Education 0 0 0% 0 0%
Virtual Education 0 0 0% 0 0%
Capital Outlay 1,000 77,696 7670% 85,000 9%
Driver Training 0 0 0% 0 0%
Declining Enrollment 0 0 0% 0 0%
Extraordinary School Program 0 0 0% 0 0%
Food Service 0 0 0% 0 0%
Professional Development 0 0 0% 0 0%
Parent Education Program 0 0 0% 0 0%
Summer School 0 0 0% 0 0%
Special Education 7,946 9,706 22% 14,000 44%
Cost of Living 0 0 0% 0 0%
Vocational Education 0 0 0% 0 0%
Gifts/Grants 0 0 0% 0 0%
Special Liability 0 0 0% 0 0%
School Retirement 0 0 0% 0 0%
Extraordinary Growth Facilities 0 0 0% 0 0%
Special Reserve 0 0 0%
KPERS Spec. Ret. Contribution 12,375 12,713 3% 14,366 13%
Contingency Reserve 0 0 0%
Text Book & Student Material 0 0 0%
Activity Fund 0 0 0%
Bond and Interest #1 0 0 0% 0 0%
Bond and Interest #2 0 0 0% 0 0%
No-Fund Warrant 0 0 0% 0 0%
Special Assessment 0 0 0% 0 0%
Temporary Note 0 0 0% 0 0%
SUBTOTAL 325,305 397,832 22% 502,523 26%
Enrollment (FTE)* 674.5 654.1 -3% 650.0 -1%
Amount per Pupil 482 608 26% 773 27%
Adult Education 0 0 0% 0 0%
Adult Supplemental Education 0 0 0% 0 0%
Tuition Reimbursement 0 0 0% 0 0%
Special Education Coop 0 0 0% 0 0%
TOTAL 325,305 397,832 22% 502,523 26%
NOTE: Gifts/Grants includes private grants and grants from nonfederal sources.
Amount per pupil excludes the following funds: Adult Education, Adult Supplemental Education, Special Education Coop
and Tuition Reimbursement.
*Enrollment (FTE) includes the enrollment of the district used for state aid and budget authority, and all other preschool enrollment
and kindergarten students attending full time.
0
100,000
200,000
300,000
400,000
500,000
600,000
2011-2012 2012-2013 2013-2014
325,305
397,832
502,523
Transportation Expenditures
9/17/2013 2:56 PM Sumexpen.xlsx Page 12 of 24

USD# 484
Food Services Expenditures (3100)
% %
2011-2012 2012-2013 inc/ 2013-2014 inc/
Actual Actual dec Budget dec
General 0 0 0% 0 0%
Federal Funds 0 0 0% 0 0%
Supplemental General 0 0 0% 0 0%
At Risk (4yr Old) 0 0 0% 0 0%
At Risk (K-12) 0 0 0% 0 0%
Bilingual Education 0 0 0% 0 0%
Virtual Education 0 0 0% 0 0%
Capital Outlay 0 0 0% 0 0%
Driver Training 0 0 0% 0 0%
Declining Enrollment 0 0 0% 0 0%
Extraordinary School Program 0 0 0% 0 0%
Food Service 491,709 542,851 10% 682,496 26%
Professional Development 0 0 0% 0 0%
Parent Education Program 0 0 0% 0 0%
Summer School 0 0 0% 0 0%
Special Education 0 0 0% 0 0%
Cost of Living 0 0 0% 0 0%
Vocational Education 0 0 0% 0 0%
Gifts/Grants 0 0 0% 0 0%
Special Liability 0 0 0% 0 0%
School Retirement 0 0 0% 0 0%
Extraordinary Growth Facilities 0 0 0% 0 0%
Special Reserve 0 0 0%
KPERS Spec. Ret. Contribution 14,310 16,828 18% 19,016 13%
Contingency Reserve 0 0 0%
Text Book & Student Material 0 0 0%
Activity Fund 0 0 0%
Bond and Interest #1 0 0 0% 0 0%
Bond and Interest #2 0 0 0% 0 0%
No-Fund Warrant 0 0 0% 0 0%
Special Assessment 0 0 0% 0 0%
Temporary Note 0 0 0% 0 0%
SUBTOTAL 506,019 559,679 11% 701,512 25%
Enrollment (FTE)* 674.5 654.1 -3% 650.0 -1%
Amount per Pupil 750 856 14% 1,079 26%
Adult Education 0 0 0% 0 0%
Adult Supplemental Education 0 0 0% 0 0%
Tuition Reimbursement 0 0 0% 0 0%
Special Education Coop 0 0 0% 0 0%
TOTAL 506,019 559,679 11% 701,512 25%
NOTE: Gifts/Grants includes private grants and grants from nonfederal sources.
Amount per pupil excludes the following funds: Adult Education, Adult Supplemental Education, Special Education Coop
and Tuition Reimbursement.
*Enrollment (FTE) includes the enrollment of the district used for state aid and budget authority, and all other preschool enrollment
and kindergarten students attending full time.
0
100,000
200,000
300,000
400,000
500,000
600,000
700,000
800,000
2011-2012 2012-2013 2013-2014
506,019 559,679
701,512
Food Service Expenditures
9/17/2013 2:56 PM Sumexpen.xlsx Page 13 of 24
USD# 484
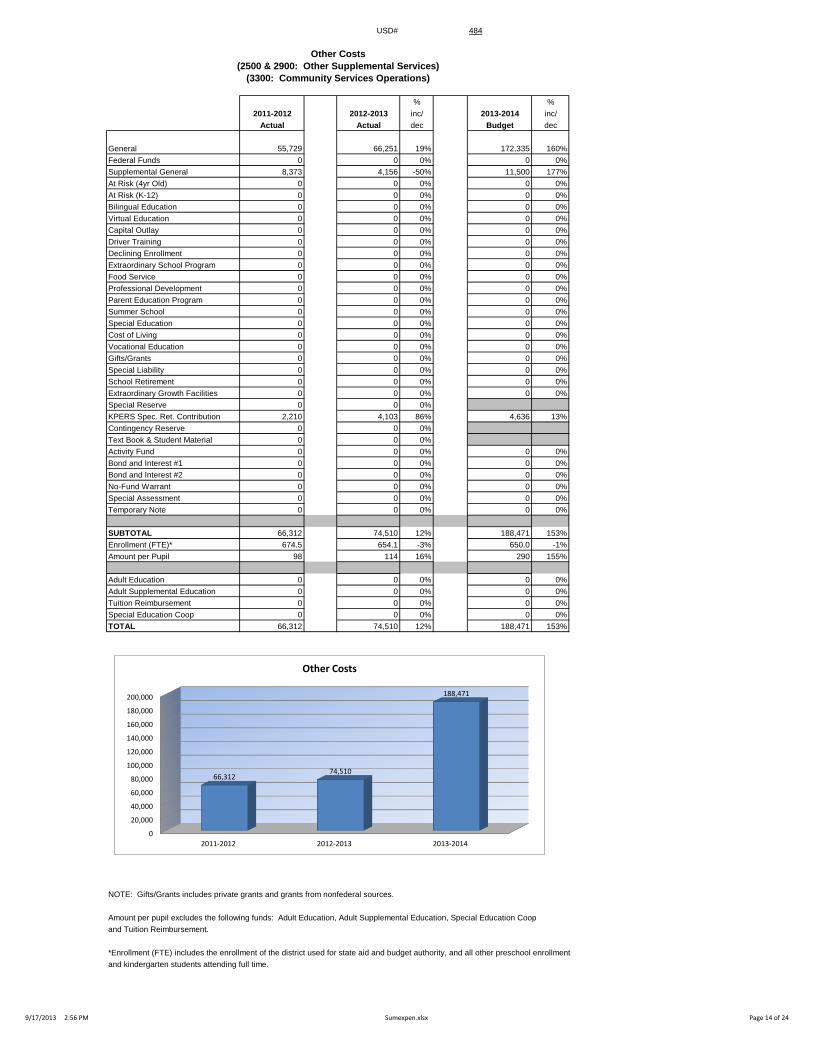
Other Costs
(2500 & 2900: Other Supplemental Services)
(3300: Community Services Operations)
% %
2011-2012 2012-2013 inc/ 2013-2014 inc/
Actual Actual dec Budget dec
General 55,729 66,251 19% 172,335 160%
Federal Funds 0 0 0% 0 0%
Supplemental General 8,373 4,156 -50% 11,500 177%
At Risk (4yr Old) 0 0 0% 0 0%
At Risk (K-12) 0 0 0% 0 0%
Bilingual Education 0 0 0% 0 0%
Virtual Education 0 0 0% 0 0%
Capital Outlay 0 0 0% 0 0%
Driver Training 0 0 0% 0 0%
Declining Enrollment 0 0 0% 0 0%
Extraordinary School Program 0 0 0% 0 0%
Food Service 0 0 0% 0 0%
Professional Development 0 0 0% 0 0%
Parent Education Program 0 0 0% 0 0%
Summer School 0 0 0% 0 0%
Special Education 0 0 0% 0 0%
Cost of Living 0 0 0% 0 0%
Vocational Education 0 0 0% 0 0%
Gifts/Grants 0 0 0% 0 0%
Special Liability 0 0 0% 0 0%
School Retirement 0 0 0% 0 0%
Extraordinary Growth Facilities 0 0 0% 0 0%
Special Reserve 0 0 0%
KPERS Spec. Ret. Contribution 2,210 4,103 86% 4,636 13%
Contingency Reserve 0 0 0%
Text Book & Student Material 0 0 0%
Activity Fund 0 0 0% 0 0%
Bond and Interest #1 0 0 0% 0 0%
Bond and Interest #2 0 0 0% 0 0%
No-Fund Warrant 0 0 0% 0 0%
Special Assessment 0 0 0% 0 0%
Temporary Note 0 0 0% 0 0%
SUBTOTAL 66,312 74,510 12% 188,471 153%
Enrollment (FTE)* 674.5 654.1 -3% 650.0 -1%
Amount per Pupil 98 114 16% 290 155%
Adult Education 0 0 0% 0 0%
Adult Supplemental Education 0 0 0% 0 0%
Tuition Reimbursement 0 0 0% 0 0%
Special Education Coop 0 0 0% 0 0%
TOTAL 66,312 74,510 12% 188,471 153%
NOTE: Gifts/Grants includes private grants and grants from nonfederal sources.
Amount per pupil excludes the following funds: Adult Education, Adult Supplemental Education, Special Education Coop
and Tuition Reimbursement.
*Enrollment (FTE) includes the enrollment of the district used for state aid and budget authority, and all other preschool enrollment
and kindergarten students attending full time.
0
20,000
40,000
60,000
80,000
100,000
120,000
140,000
160,000
180,000
200,000
2011-2012 2012-2013 2013-2014
66,312 74,510
188,471
Other Costs
9/17/2013 2:56 PM Sumexpen.xlsx Page 14 of 24

USD# 484
Capital Improvements Expenditures (4000)
% %
2011-2012 2012-2013 inc/ 2013-2014 inc/
Actual Actual dec Budget dec
General 0 0 0% 0 0%
Federal Funds 0 0 0% 0 0%
Supplemental General 0 0 0% 0 0%
At Risk (4yr Old) 0 0 0% 0 0%
At Risk (K-12) 0 0 0% 0 0%
Bilingual Education 0 0 0% 0 0%
Virtual Education 0 0 0% 0 0%
Capital Outlay 258,681 77,291 -70% 450,000 482%
Driver Training 0 0 0% 0 0%
Declining Enrollment 0 0 0% 0 0%
Extraordinary School Program 0 0 0% 0 0%
Food Service 0 0 0% 0 0%
Professional Development 0 0 0% 0 0%
Parent Education Program 0 0 0% 0 0%
Summer School 0 0 0% 0 0%
Special Education 0 0 0% 0 0%
Cost of Living 0 0 0% 0 0%
Vocational Education 0 0 0% 0 0%
Gifts/Grants 0 0 0% 0 0%
Special Liability 0 0 0% 0 0%
School Retirement 0 0 0% 0 0%
Extraordinary Growth Facilities 0 0 0% 0 0%
Special Reserve 0 0 0%
KPERS Spec. Ret. Contribution 0 0 0% 0 0%
Contingency Reserve 0 0 0%
Text Book & Student Material 0 0 0%
Activity Fund 0 0 0% 0 0%
Bond and Interest #1 0 0 0% 0 0%
Bond and Interest #2 0 0 0% 0 0%
No-Fund Warrant 0 0 0% 0 0%
Special Assessment 0 0 0% 0 0%
Temporary Note 0 0 0% 0 0%
SUBTOTAL 258,681 77,291 -70% 450,000 482%
Enrollment (FTE)* 674.5 654.1 -3% 650.0 -1%
Amount per Pupil 384 118 -69% 692 486%
Adult Education 0 0 0% 0 0%
Adult Supplemental Education 0 0 0% 0 0%
Tuition Reimbursement 0 0 0% 0 0%
Special Education Coop 0 0 0% 0 0%
TOTAL 258,681 77,291 -70% 450,000 482%
NOTE: Gifts/Grants includes private grants and grants from nonfederal sources.
Amount per pupil excludes the following funds: Adult Education, Adult Supplemental Education, Special Education Coop
and Tuition Reimbursement.
*Enrollment (FTE) includes the enrollment of the district used for state aid and budget authority, and all other preschool enrollment
and kindergarten students attending full time.
0
50,000
100,000
150,000
200,000
250,000
300,000
350,000
400,000
450,000
2011-2012 2012-2013 2013-2014
258,681
77,291
450,000
Capital Improvements (4000)
9/17/2013 2:56 PM Sumexpen.xlsx Page 15 of 24
USD# 484
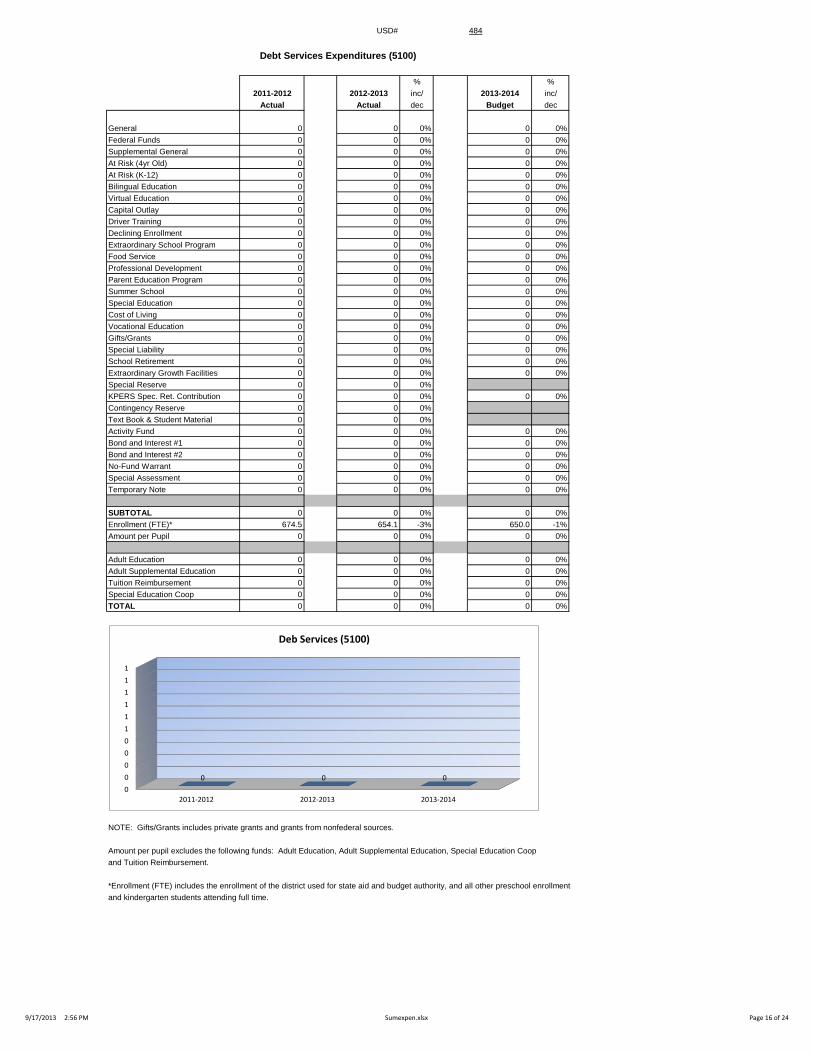
Debt Services Expenditures (5100)
% %
2011-2012 2012-2013 inc/ 2013-2014 inc/
Actual Actual dec Budget dec
General 0 0 0% 0 0%
Federal Funds 0 0 0% 0 0%
Supplemental General 0 0 0% 0 0%
At Risk (4yr Old) 0 0 0% 0 0%
At Risk (K-12) 0 0 0% 0 0%
Bilingual Education 0 0 0% 0 0%
Virtual Education 0 0 0% 0 0%
Capital Outlay 0 0 0% 0 0%
Driver Training 0 0 0% 0 0%
Declining Enrollment 0 0 0% 0 0%
Extraordinary School Program 0 0 0% 0 0%
Food Service 0 0 0% 0 0%
Professional Development 0 0 0% 0 0%
Parent Education Program 0 0 0% 0 0%
Summer School 0 0 0% 0 0%
Special Education 0 0 0% 0 0%
Cost of Living 0 0 0% 0 0%
Vocational Education 0 0 0% 0 0%
Gifts/Grants 0 0 0% 0 0%
Special Liability 0 0 0% 0 0%
School Retirement 0 0 0% 0 0%
Extraordinary Growth Facilities 0 0 0% 0 0%
Special Reserve 0 0 0%
KPERS Spec. Ret. Contribution 0 0 0% 0 0%
Contingency Reserve 0 0 0%
Text Book & Student Material 0 0 0%
Activity Fund 0 0 0% 0 0%
Bond and Interest #1 0 0 0% 0 0%
Bond and Interest #2 0 0 0% 0 0%
No-Fund Warrant 0 0 0% 0 0%
Special Assessment 0 0 0% 0 0%
Temporary Note 0 0 0% 0 0%
SUBTOTAL 0 0 0% 0 0%
Enrollment (FTE)* 674.5 654.1 -3% 650.0 -1%
Amount per Pupil 0 0 0% 0 0%
Adult Education 0 0 0% 0 0%
Adult Supplemental Education 0 0 0% 0 0%
Tuition Reimbursement 0 0 0% 0 0%
Special Education Coop 0 0 0% 0 0%
TOTAL 0 0 0% 0 0%
NOTE: Gifts/Grants includes private grants and grants from nonfederal sources.
Amount per pupil excludes the following funds: Adult Education, Adult Supplemental Education, Special Education Coop
and Tuition Reimbursement.
*Enrollment (FTE) includes the enrollment of the district used for state aid and budget authority, and all other preschool enrollment
and kindergarten students attending full time.
0
0
0
0
0
1
1
1
1
1
1
2011-2012 2012-2013 2013-2014
0 0 0
Deb Services (5100)
9/17/2013 2:56 PM Sumexpen.xlsx Page 16 of 24

USD# 484
Transfers (5200)
% %
2011-2012 2012-2013 inc/ 2013-2014 inc/
Actual Actual dec Budget dec
General 1,445,090 1,338,299 -7% 769,594 -42%
Federal Funds 0 0 0% 0 0%
Supplemental General 657,192 752,011 14% 823,149 9%
At Risk (4yr Old) 0 0 0% 0 0%
At Risk (K-12) 0 0 0% 0 0%
Bilingual Education 0 0 0% 0 0%
Virtual Education 0 0 0% 0 0%
Capital Outlay
Driver Training 0 0 0% 0 0%
Declining Enrollment 0 0 0% 0 0%
Extraordinary School Program 0 0 0% 0 0%
Food Service 0 0 0% 0 0%
Professional Development 0 0 0% 0 0%
Parent Education Program 0 0 0% 0 0%
Summer School 0 0 0% 0 0%
Special Education 0 0 0% 0 0%
Cost of Living 0 0 0% 0 0%
Vocational Education 0 0 0% 0 0%
Gifts/Grants 0 0 0% 0 0%
Special Liability 0 0 0% 0 0%
School Retirement 0 0 0% 0 0%
Extraordinary Growth Facilities 0 0 0% 0 0%
Special Reserve 0 0 0%
KPERS Spec. Ret. Contribution 0 0 0% 0 0%
Contingency Reserve 0 0 0% 0 0%
Text Book & Student Material 0 0 0% 0 0%
Activity Fund 0 0 0% 0 0%
Bond and Interest #1 0 0 0% 0 0%
Bond and Interest #2 0 0 0% 0 0%
No-Fund Warrant 0 0 0% 0 0%
Special Assessment 0 0 0% 0 0%
Temporary Note 0 0 0% 0 0%
SUBTOTAL 2,102,282 2,090,310 -1% 1,592,743 -24%
Enrollment (FTE)* 674.5 654.1 -3% 650.0 -1%
Amount per Pupil 3,117 3,196 3% 2,450 -23%
Adult Education 0 0 0% 0 0%
Adult Supplemental Education 0 0 0% 0 0%
Tuition Reimbursement 0 0 0% 0 0%
Special Education Coop 0 0 0% 0 0%
TOTAL 2,102,282 2,090,310 -1% 1,592,743 -24%
NOTE: Gifts/Grants includes private grants and grants from nonfederal sources.
Amount per pupil excludes the following funds: Adult Education, Adult Supplemental Education, Special Education Coop
and Tuition Reimbursement.
*Enrollment (FTE) includes the enrollment of the district used for state aid and budget authority, and all other preschool enrollment
and kindergarten students attending full time.
0
500,000
1,000,000
1,500,000
2,000,000
2,500,000
2011-2012 2012-2013 2013-2014
2,102,282 2,090,310
1,592,743
Transfers (5200)
9/17/2013 2:56 PM Sumexpen.xlsx Page 17 of 24
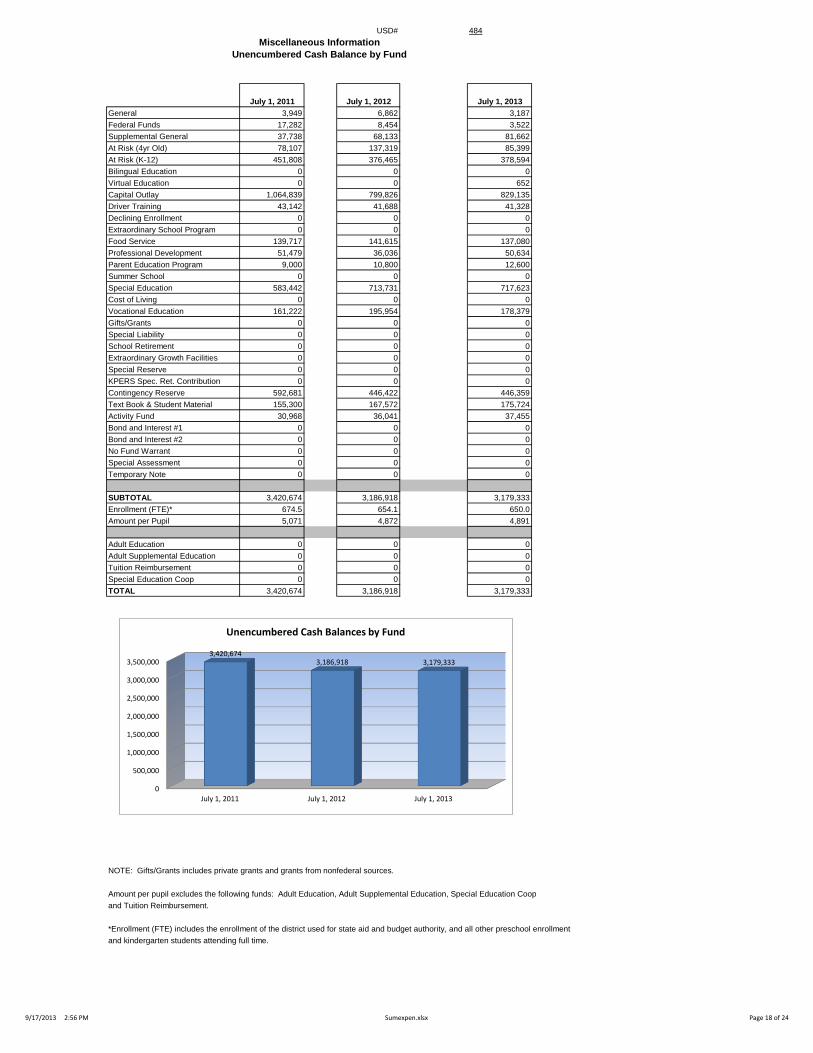
USD# 484
Miscellaneous Information
Unencumbered Cash Balance by Fund
July 1, 2011 July 1, 2012 July 1, 2013
General 3,949 6,862 3,187
Federal Funds 17,282 8,454 3,522
Supplemental General 37,738 68,133 81,662
At Risk (4yr Old) 78,107 137,319 85,399
At Risk (K-12) 451,808 376,465 378,594
Bilingual Education 0 0 0
Virtual Education 0 0 652
Capital Outlay 1,064,839 799,826 829,135
Driver Training 43,142 41,688 41,328
Declining Enrollment 0 0 0
Extraordinary School Program 0 0 0
Food Service 139,717 141,615 137,080
Professional Development 51,479 36,036 50,634
Parent Education Program 9,000 10,800 12,600
Summer School 0 0 0
Special Education 583,442 713,731 717,623
Cost of Living 0 0 0
Vocational Education 161,222 195,954 178,379
Gifts/Grants 0 0 0
Special Liability 0 0 0
School Retirement 0 0 0
Extraordinary Growth Facilities 0 0 0
Special Reserve 0 0 0
KPERS Spec. Ret. Contribution 0 0 0
Contingency Reserve 592,681 446,422 446,359
Text Book & Student Material 155,300 167,572 175,724
Activity Fund 30,968 36,041 37,455
Bond and Interest #1 0 0 0
Bond and Interest #2 0 0 0
No Fund Warrant 0 0 0
Special Assessment 0 0 0
Temporary Note 0 0 0
SUBTOTAL 3,420,674 3,186,918 3,179,333
Enrollment (FTE)* 674.5 654.1 650.0
Amount per Pupil 5,071 4,872 4,891
Adult Education 0 0 0
Adult Supplemental Education 0 0 0
Tuition Reimbursement 0 0 0
Special Education Coop 0 0 0
TOTAL 3,420,674 3,186,918 3,179,333
NOTE: Gifts/Grants includes private grants and grants from nonfederal sources.
Amount per pupil excludes the following funds: Adult Education, Adult Supplemental Education, Special Education Coop
and Tuition Reimbursement.
*Enrollment (FTE) includes the enrollment of the district used for state aid and budget authority, and all other preschool enrollment
and kindergarten students attending full time.
0
500,000
1,000,000
1,500,000
2,000,000
2,500,000
3,000,000
3,500,000
July 1, 2011 July 1, 2012 July 1, 2013
3,420,674 3,186,918 3,179,333
Unencumbered Cash Balances by Fund
9/17/2013 2:56 PM Sumexpen.xlsx Page 18 of 24

USD# 484
Reserve Funds
Unencumbered Cash Balance
July 1, 2011 July 1, 2012 July 1, 2013
Special Reserve 0 0 0
TOTAL OTHER 0 0 0
Amount per Pupil $0 $0 $0
*School districts are authorized by law to self insure rather than purchase insurance for the following categories: Worker's Comp,
Health Insurance, Life Insurance, Property and Casualty (Risk Management) and Disability Income Insurance. Monies are placed
in the Self Insured Fund to pay for claims which may arise from the categories listed above.
0
0
0
0
0
1
1
1
1
1
1
July 1, 2011 July 1, 2012 July 1, 2013
0 0 0
Unencumbered Cash Balances by Fund (Reserve Funds Only)
9/17/2013 2:56 PM Sumexpen.xlsx Page 19 of 24

USD# 484
2009-2010 2010-2011 % 2011-2012 % 2012-2013 % 2013-2014 %
Actual Actual inc/ Actual inc/ Actual inc/ Budget inc/
dec dec dec dec
Enrollment (FTE)* 723.5 704.3 -3% 649.1 -8% 676.4 4% 650.0 -4%
Enrollment (FTE)** 730.0 704.3 -4% 674.5 -4% 654.1 -3% 650.0 -1%
Number of Students -
Free Meals 297 304 2% 248 -18% 305 23% 285 -7%
Number of Students -
Reduced Meals 111 135 22% 133 -1% 115 -14% 105 -9%
*FTE for state aid and budget authority purposes for general fund (excludes 4 yr old at-risk).
** FTE includes 9/20 enrollment used for state aid purposes and adding the additional FTE for preschool programs, headstart, and all-day
kindergarten. For example, preschool students attending half days on September 20th would be counted as .5 FTE. Kindergarten
students attending full time every day would be counted as 1.0 FTE.
Enrollment Information
600.0
620.0
640.0
660.0
680.0
700.0
720.0
740.0
2009-2010 2010-2011 2011-2012 2012-2013 2013-2014
730.0
704.3
674.5
654.1 650.0
Enrollment (FTE)** Used for Calculating "Amount per Pupil"
0
50
100
150
200
250
300
350
2009-2010 2010-2011 2011-2012 2012-2013 2013-2014
297 304
248
305 285
111 135 133
115 105
Low Income Students
Free Meals
Reduced Meals
600.0
620.0
640.0
660.0
680.0
700.0
720.0
740.0
2009-2010 2010-2011 2011-2012 2012-2013 2013-2014
723.5
704.3
649.1
676.4
650.0
FTE Enrollment for Budget Authority
9/17/2013 2:56 PM Sumexpen.xlsx Page 20 of 24

USD# 484
Miscellaneous Information
Mill Rates by Fund
2011-2012 2012-2013 2013-2014
Actual Actual Budget
General 20.000 20.000 20.000
Supplemental General 21.355 25.783 26.879
Adult Education 0.000 0.000 0.000
Capital Outlay 3.985 0.000 0.000
Declining Enrollment 0.000 0.000 0.000
Cost of Living 0.000 0.000 0.000
Special Liability 0.000 0.000 0.000
School Retirement 0.000 0.000 0.000
Extraordinary Growth Facilities 0.000 0.000 0.000
Bond and Interest #1 0.000 0.000 0.000
Bond and Interest #2 0.000 0.000 0.000
No Fund Warrant 0.000 0.000 0.000
Special Assessment 0.000 0.000 0.000
Temporary Note 0.000 0.000 0.000
TOTAL USD 45.340 45.783 46.879
Historical Museum 0.000 0.000 0.000
Public Library Board 0.000 0.000 0.000
Public Library Brd & Emp Benf 0.000 0.000 0.000
Recreation Commission 1.495 1.488 1.500
Rec Comm Employee Bnfts 0.000 0.000 0.000
TOTAL OTHER 1.495 1.488 1.500
0.000
10.000
20.000
30.000
40.000
50.000
60.000
70.000
80.000
2011-2012 2012-2013 2013-2014
45.340 45.783 46.879
Total USD Mill Rates
General 43%
Supplemental General 57%
2013-14 Miscellaneous Information Mill Rates by Fund (Total USD)
General
Supplemental General
Adult Education
Capital Outlay
Special Liability
School Retirement
Declining Enrollment
Cost of Living
Bond and Interest #1
Bond and Interest #2
Extraordinary Growth Facilities
No Fund Warrant
Special Assessment
Temporary Note
9/17/2013 2:56 PM Sumexpen.xlsx Page 21 of 24

USD# 484
Other Information
2011-2012 2012-2013 2013-2014
Actual Actual Budget
Assessed Valuation $41,241,596 $40,946,365 $36,945,755
Bonded Indebtedness $276,722 $301,301 $231,911
$34,000,000
$35,000,000
$36,000,000
$37,000,000
$38,000,000
$39,000,000
$40,000,000
$41,000,000
$42,000,000
2011-2012 2012-2013 2013-2014
$41,241,596 $40,946,365
$36,945,755
Assessed Valuation
$0
$50,000
$100,000
$150,000
$200,000
$250,000
$300,000
$350,000
2011-2012 2012-2013 2013-2014
$276,722 $301,301
$231,911
Bonded Indebtedness
9/17/2013 2:56 PM Sumexpen.xlsx Page 22 of 24

USD 484
2013-14 Estimated Sources of Revenue--2013-14 Estimated
Amount July 1, 2013 State Federal Local July 1, 2014
Fund Budgeted Cash Balance Interest Transfers Other Cash Balance
General 5,050,040 3,187 4,444,423 0 0 602,430 XXXXXXXX
Supplemental General 1,712,500 81,662 608,434 1,022,404 XXXXXXXX
Adult Education 0 0 0 0 0 0 0 0
At Risk (4yr Old) 60,000 85,399 0 0 0 0 25,399
Adult Supplemental Education 0 0 0 0 0 0
At Risk (K-12) 823,778 378,594 0 0 604,244 0 159,060
Bilingual Education 0 0 0 0 0 0 0
Virtual Education 5,000 652 0 5,000 0 652
Capital Outlay 935,000 829,135 0 3,000 145,000 33,859 75,994
Driver Training 9,545 41,328 5,750 0 0 0 0 37,533
Declining Enrollment 0 0 0 0 XXXXXXXX
Extraordinary School Program 0 0 0 0 0 0 0
Food Service 689,336 137,080 3,611 234,689 0 170,000 143,956 0
Professional Development 32,500 50,634 0 0 0 0 18,134
Parent Education Program 7,500 12,600 0 0 0 7,500 0 12,600
Summer School 0 0 0 0 0 0 0
Special Education 947,000 717,623 0 0 0 610,999 0 381,622
Vocational Education 168,379 178,379 0 0 0 50,000 0 60,000
Special Liability Expense Fund 0 0 0 0 0
Special Reserve Fund 0 XXXXXXXX
Gifts and Grants 0 0 0 0
Textbook & Student Materials Revolving 175,724 XXXXXXXX
School Retirement 0 0 0 0 0
Extraordinary Growth Facilities 0 0 0 0 XXXXXXXXX
KPERS Special Retirement Contribution 416,361 0 416,361 XXXXXXXXX
Contingency Reserve 446,359 XXXXXXXXX
Activity Funds 37,455 XXXXXXXXX
Tuition Reimbursement 0 0 0 0 0
Bond and Interest #1 0 0 0 0 0 0 0
Bond and Interest #2 0 0 0 0 0 0 0
No Fund Warrant 0 0 0 0
Special Assessment 0 0 0 0
Temporary Note 0 0 0 0 0
Coop Special Education 0 0 0 0 0 0 0
Federal Funds 240,819 3,522 xxxxxxxxxxx 237,297 xxxxxxxxxxxx xxxxxxxxxxxx xxxxxxxxxxx 0
Cost of Living 0 0 xxxxxxxxxxx xxxxxxxxxxx xxxxxxxxxxxx 0 0 XXXXXXXXX
SUBTOTAL 11,097,758 3,179,333 5,478,579 471,986 3,000 1,592,743 1,802,649 770,994
Less Transfers 1,592,743
TOTAL Budget Expenditures $9,505,015
2011-2012 2012-2013 2013-2014
State Revenues 5,330,904 5,301,628 5,478,579
Federal Revenues 490,955 530,948 471,986
Local Revenues 4,274,452 4,305,650 3,398,392
Total Revenues 10,096,311 10,138,226 9,348,957
Revenues Per Pupil 14,969 15,500 14,383
Sources of Revenue and Proposed Budget for 2013-14
Sources of Revenue - - State, Federal, Local

Intentionally left blank