usd 309 nickerson-south hutchinson finance/budget/budget... · email: [email protected] key...
TRANSCRIPT
USD 309 Nickerson-South Hutchinson

i
Budget General Information (characteristics of district)
Supplemental Information for Tables in Summary of Expenditures
KSDE Website Information Available
Summary of Expenditures (Sumexpen.xls)

1
2010-2011 Budget General Information
USD #: 309 Nickerson S. Hutchinson
Introduction Unified School District 309 Nickerson-South Hutchinson maintains a philosophy that all
students can learn and that schools have a responsibility to provide educational equality for all
students.
The Board of Education, administration, and staff are dedicated to the creation of a
dynamic environment for the purpose of educating a diverse community of life-long learners.
Quality education is designed to nurture self-esteem, creativity, personal growth and health, and
provide knowledge and the acquisition of essential skills, which will prepare students to be flexible
and adaptable in an ever-changing environment as we move toward a global society.
U.S.D. 309 believes that the total community must be regarded as a learning resource
where students develop the basic values, social skills, morals, and attitudes required to be
responsible and productive citizens in a democratic society.
The district maintains that excellence in education occurs best when competent people with
empathy, vision, and courage work together toward common goals in an atmosphere that is
supportive and trusting.
The budget is designed to support the philosophy of the district and the students. U.S.D.
309 enrolls approximately 1150 students from the communities of Hutchinson, South Hutchinson
and Nickerson. The organization includes two elementary schools, one middle school and one high
school. Special education services are provided through a Reno County Education Cooperative
Agreement with Buhler, Haven, Fairfield, and Pretty Prairie school districts.
Although the district only covers 187.5 square miles, the district maintains a transportation
department that operates approximately thirty bus routes. Nearly eighty percent of the student
population is transported to and from school each and every day with district owned buses. The
district also maintains a staff that operates the district’s food service program and building
maintenance and custodial services.
VISION
Unified School District 309 Nickerson-South Hutchinson will be a leader in providing
educational programs and experiences, training and knowledge with 21st Century tools and skills for
students to excel in the global environment. Staff will be dedicated to providing opportunities for
academic excellence in all subjects, building a firm foundation for life-long learning.
Through collaboration with the community and students, USD 309 will provide a safe,
supportive environment with educational opportunities empowering every student to become a self-
assured, responsible, and economically productive citizen. The district exists to serve the unique
academic, physical, social and emotional needs of the students.
Students and staff will create a community of empowered learners in an atmosphere of
mutual respect and trust. Students will be inspired and challenged to learn, grow, and accomplish
academic, social, and vocational goals.
All USD 309 staff shall be committed to the students, each other, and the education
profession as one team to achieve excellence in learning and teaching. Students, parents, the school
board, and the community shall be members of the team to create an outstanding student centered
learning environment, which supports experiences in curricular and extra-curricular activities for all
children.
2
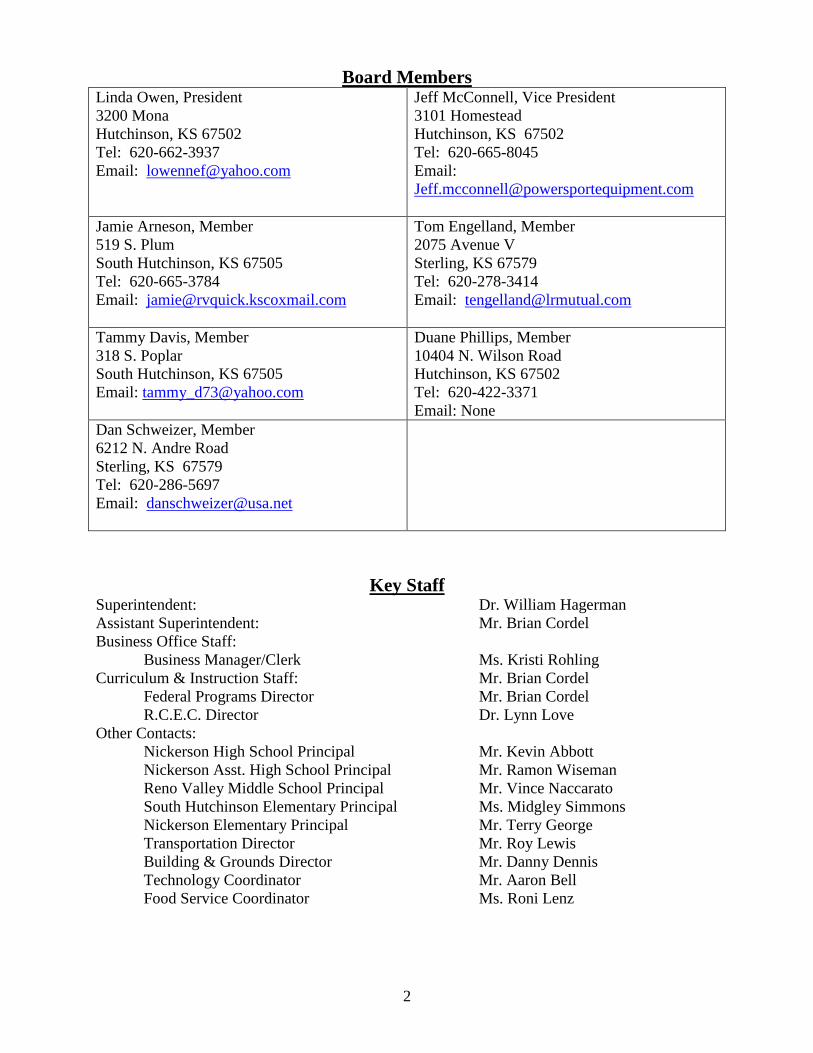
Board Members Linda Owen, President
3200 Mona
Hutchinson, KS 67502
Tel: 620-662-3937
Email: [email protected]
Jeff McConnell, Vice President
3101 Homestead
Hutchinson, KS 67502
Tel: 620-665-8045
Email:
Jamie Arneson, Member
519 S. Plum
South Hutchinson, KS 67505
Tel: 620-665-3784
Email: [email protected]
Tom Engelland, Member
2075 Avenue V
Sterling, KS 67579
Tel: 620-278-3414
Email: [email protected]
Tammy Davis, Member
318 S. Poplar
South Hutchinson, KS 67505
Email: [email protected]
Duane Phillips, Member
10404 N. Wilson Road
Hutchinson, KS 67502
Tel: 620-422-3371
Email: None
Dan Schweizer, Member
6212 N. Andre Road
Sterling, KS 67579
Tel: 620-286-5697
Email: [email protected]
Key Staff Superintendent: Dr. William Hagerman
Assistant Superintendent: Mr. Brian Cordel
Business Office Staff:
Business Manager/Clerk Ms. Kristi Rohling
Curriculum & Instruction Staff: Mr. Brian Cordel
Federal Programs Director Mr. Brian Cordel
R.C.E.C. Director Dr. Lynn Love
Other Contacts:
Nickerson High School Principal Mr. Kevin Abbott
Nickerson Asst. High School Principal Mr. Ramon Wiseman
Reno Valley Middle School Principal Mr. Vince Naccarato
South Hutchinson Elementary Principal Ms. Midgley Simmons
Nickerson Elementary Principal Mr. Terry George
Transportation Director Mr. Roy Lewis
Building & Grounds Director Mr. Danny Dennis
Technology Coordinator Mr. Aaron Bell
Food Service Coordinator Ms. Roni Lenz

3
The District’s Accomplishments and Challenges
Accomplishments:
2010 Kansas Assessment Scores
USD 309 as a district did met Adequate Yearly Progress (AYP) standards in
Reading, Mathematics, Attendance, but not for Graduation rate, therefore the district did
not make AYP.
Kansas Reading Assessments: No subgroup was cited for performing below the AYP
targets and it is expected that the Standard of Excellence will be met in many schools and
in several content areas.
Nickerson Elementary results are as follows: Grade 3 – 90.2%, Grade 4 – 90.0%,
Grade 5 – 94.6%, and Grade 6 – 93.3% scored at meets standard or higher.
South Hutchinson Elementary results are as follows: Grade 3 – 100%, Grade 4 –
95.7%, Grade 5 – 100%, and Grade 6 – 100.0% scored meets standard or higher.
Reno Valley Middle School's reading results showed 92.6% of the 7th grade
students and 92.0% of the 8th grade students at meets standard levels when the state's
reading target was 83.7%.
Nickerson High School’s reading score for 11th graders was 94.8%, which is well
above the 81.3% required to meet the AYP goal in 2010.
Kansas Mathematics Assessments: At grades 3, 4, 5, and 6 both schools’ students
scored well above the 82.3% needed to make AYP.
Nickerson Elementary results are as follows: Grade 3 – 100.0%, Grade 4 – 100.0%,
Grade 5 – 97.3%, and Grade 6 – 100% scored at meets standard or higher.
South Hutchinson Elementary results are as follows: Grade 3 – 94.4%, Grade 4 –
97.9%, Grade 5 – 954.5%, and Grade 6 – 97.6% scored at meets standard or higher.
Reno Valley Middle School's math results showed 82.5% of the 7th grade students
and 83.8% of the 8th grade students at meets standard levels when the state's reading
target was 82.3%.
With 100% of Nickerson High School eligible students taking the 11th grade math
assessment, 88.1% were proficient categories when the state's 2010 math target was
76.4%. Nickerson High uses the Interactive Math Program and continues to demonstrate
success using this program.
The Kansas Writing Assessment was administered to Grades 5, 8, and 11 during the
2009 testing cycle. There was no Writing Assessment Given in 2010.
The Kansas Science Assessment was also administered in 2010 to grades 4, 7, and
11. Nickerson Elementary Grade 4 had 100% of students meet standard of above, South
Hutchinson followed with 100%, Reno Valley Middle School Grade 7 with 92.5%, and
Nickerson High School 11th Grade with 90.5% meeting standard of above.
Overall, students in Nickerson-South Hutchinson continue to do well on the Kansas
State Assessments.

4
Graduation and Attendance Rates
Nickerson High School's graduation rate was 76.5%, which is below the state's 80%
annual yearly progress goal for graduation. This will result in NHS not making Adequate
Yearly Progress for this measure.
The district's attendance rate was 94.5%, which is above the state's 90% district
annual yearly progress goal. This indicator has been stable for the past couple of years.
Community Services
After-school Programs
In 2005, Reno Valley Middle School—the only school in Kansas--was recognized at
the 21st Century Community Learning Centers Summer Institute in Chicago as one of ten
After-School Programs in the nation for its accomplishments in successfully enhancing and
enriching science in the After-School Program. On-site visits by McREL and SEDL
confirmed the school’s quality science activities and instruction. The following year,
technology was included as an area in which the school was recognized for
accomplishments.
In 2006-2007, Reno Valley Middle and South Hutchinson Elementary had after-
school tutoring programs that were provided through KSDE Enhancement grants and
additional funds rose by the schools.
These programs will continue in the 2010-2011 School Year at South Hutchinson
Elementary, Reno Valley Middle School and Nickerson High School thanks in part to three
new grants. Community Learning Centers were implemented and established during the
2008-09 School Year. The 21st Century Community Learning Centers Program is a five
grant commitment by the State and the District.
The district will be addressing the needs and well being of our students and
families through the implementation of the ―Leadership, Enrichment and Academic
Academy.‖ Goals will be obtained by providing students and families the opportunity to
participate in a safe and caring environment that promotes academic achievement through
homework assistance and tutorials. Enrichment activities in science, technology, physical
activities, nutrition, recreational activities and fine arts will be provided that includes
state and national academic standards.
Preschool Programs
The Parents as Teachers program provides parenting education for adults with
children from prenatal through age three. Parenting classes, home visits with a parent
educator, and group and family play sessions are held regularly.
Head Start classes are available at two locations for three and four year-old
children. The classes meet four days each week at Nickerson Elementary and South
Hutchinson Elementary. USD 309 collaborates with USD 308 and other Reno County
school districts to provide this program.
Our At-Risk Four Year-Old Preschool provides educational opportunities for half-
day preschool experiences for fourteen children. This program is located at Nickerson
Elementary.
5
USD 309 will provide preschool experiences for children at South Hutchinson
Elementary through a special grant called the Universal Preschool Program. The program
will also be expanded to the Nickerson community through a partnership with the Kids
Krossing Preschool located at the Nickerson United Methodist Church.
Full Day Kindergarten
The district turned its attention to providing all day everyday kindergarten for all
kindergarten students in the district during the 2005-2006 School Year. We are in our
fifth year of offering all day everyday kindergarten. Early Childhood programs return
huge benefits for all children that participate and parents love the program.
Technology
USD 309 has taken a great step into the future with the implementation of its one
to one laptop learning environment. Beginning with the 2004-2005 School Year, every
student at Nickerson High School was equipped with an ibook laptop computer that is also
connected to the network, district resources and Internet via a wireless connection.
Learning anytime, anyplace, anywhere became reality at NHS during this year. The
program expanded to include Reno Valley Middle School for the 2006-2007 School Year.
The one-to-one program is slightly different at the middle school where students are not
allowed to take the laptops home each day. Students have to check their laptop out for
special projects. The units will assist students at school with valuable research tools and
interactive learning.
PowerSchool student information system allows teachers, students and parents’
instant access to student information, grades, and other tools anytime, anyplace, and
anywhere the individual has access to the Internet. This web-based program allows
greater flexibility for all users. This student information system was initiated
Kindergarten through Grade Twelve during the fall of 2004.
All teachers have their own laptops. Wireless carts have been added for students
at both elementary schools. Nickerson Elementary School completed a Tech Rich
Classroom Grant with Stafford Elementary during the 2006-07 School Year. Nickerson
Elementary has added a great deal of technology with the addition of Smartboards and
Projectors to stimulate the learning senses of the students in every classroom. South
Hutchinson Elementary has participated in a Tech Rich Classroom Grant at the fifth and
sixth grade levels with Riley Elementary at Great Bend during the past two years. For the
2010-11 school year, Reno Valley Middle School partnering with Larned Middle School,
received a Tech Rich Classroom Grant at the7-8th level.
Students at Nickerson High School, Reno Valley Middle School and Nickerson
Elementary School will continue to use the Computer Performance System (CPS) in their
classrooms to beam their answers to teacher-selected questions. Teachers use the
systems to monitor students' progress in grasping concepts and information to ensure
mastery of district curriculum objectives.

6
All schools have technology labs, laptop carts, Internet access in all classrooms, and
opportunities for students to use and improve their technology skills. During the upcoming
year the district will complete its new technology plan that will encompass LoTi (Levels of
Technology Implementation, expanding 21st Century Skills with 21st Century Tools, and the
addition of more PBL (Project Based Learning).
Challenges:
Although there are many challenges that face all educational institutions, the most
difficult issue that each of us will face over the next several years is that the pool of
qualified teachers will continue to shrink considerably. The problem will continue to grow
as our current staff begins to retire and leave the profession.
Health insurance will also continue to be an issue for USD 309 as well. The district
has increased the district's contribution to health care for staff to encourage employees
to enroll in the program and provide a quality benefit for all members. A good health
insurance program is necessary to assist the district in recruiting and retaining quality
educators and other employees.
A major concern that will be addressed is the decline of the Graduation Rate at
Nickerson High School. Students that drop out before finishing high school, sacrifice
considerable financial opportunity, and will face a very difficult future when it comes to
employment and financial rewards. USD 309 has built an outstanding After School Program. At this point grant funds
continue to support our state and nationally recognized Out of School Time Programs.

7
Supplemental Information for the Following Tables
1. Summary of Total Expenditures by Function (All Funds)
The total expenditure table and graph allows us to examine how our district funds were
actually spent over the past two years and plan and estimate cost for the future.
2. Summary of General Fund Expenditures by Function
The general fund expenditures remain primarily consistent from year to year. Transportation
expenditures continue to be paid directly from the general fund. Expenditures that will be
moved to the LOB are additional general administration expenditures, (insurance, technology
and nurses salaries, supplies, etc), all utility cost (electric, gas and water), and several other
student support expenditures. With this move the general fund can now account for the
added transportation expenditures and lack of BSAAP increase. This is reflected in the other
cost line item summary.
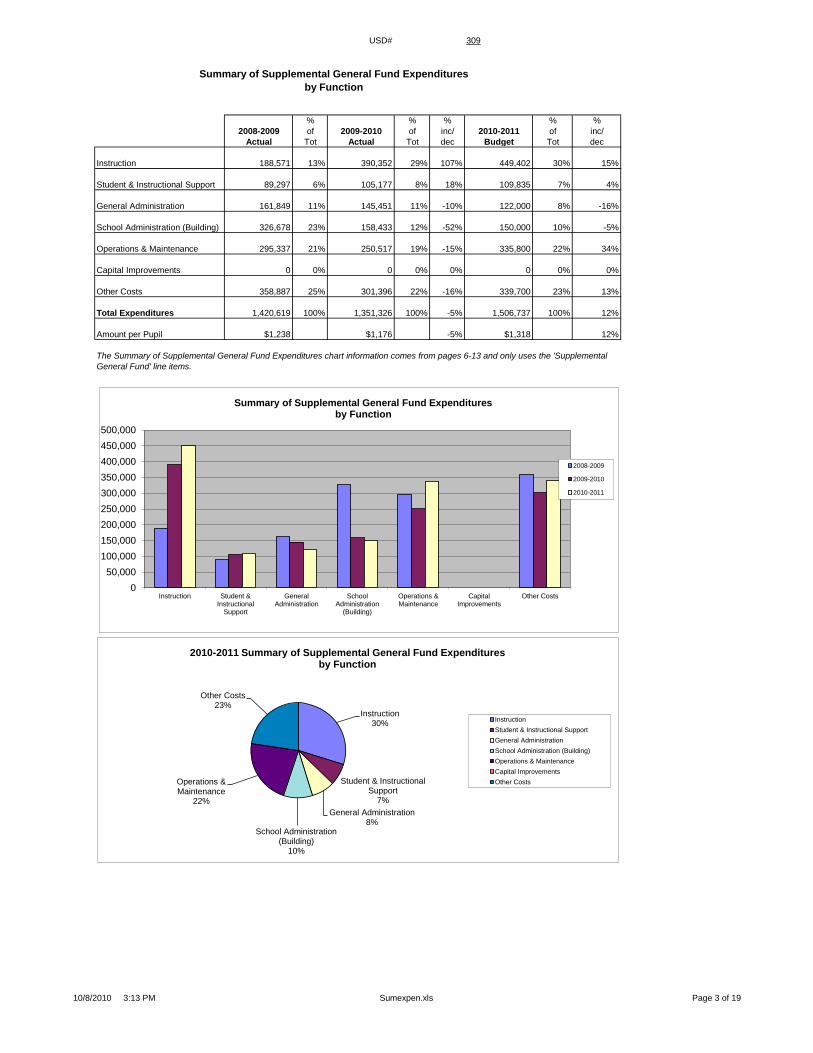
3. Summary of Supplemental General Fund Expenditures by Function
For the past several years the Supplemental General Fund or the LOB, was used primarily for
other items that were generally considered above and beyond or in addition to the general
fund. Today the LOB accounts for general operating expenditures such as utility cost,
insurance cost, transfers to At-Risk Funds, and other general and instructional expenditures.
The supplemental general fund has become a major part of the budget planning. With the
court decision and legislation this fund has doubled with state aide resources, which make
this fund more viable for day-to-day operating cost. The fund has been maxed out at our
legal percentage for the past three years
4. Summary of General and Supplemental General Fund Expenditures by Function
Since the General Fund and the LOB are governed by the same rules, regulations and laws, it
is only appropriate to examine how the expenditures in each sub category compare from year
to year.
5. Summary of Special Education Fund by Function
There have been very few changes in the special education fund over the past several years.
The only major change that took place during the FY2004 was the fact that the state began to
funnel the Categorical Aide payment or CAT Aide through the general fund in each school
district rather than a direct payment to the Special Education Cooperatives. This major
increase in the Instruction sub category took place between FY2002 and FY2003. The
expenditures from this fund are mainly due to the district’s responsibility to Reno County
Education Cooperative (RCEC) in the form of CAT Aide payment and the district’s share of
the assessment. Other costs are our special education transportation cost, which our own
transportation department provides.
6. Instruction Expenditures (1000)
This analysis of the budget allows us to examine what fund and how much money is being
expended on instructional cost. Instruction cost is the main expenditure of the district
encompassing more than fifty percent of total expenditures. This is where the majority of the
teacher’s salaries are paid.

8
7. Student and Instructional Support Expenditures (2100 & 2200)
The student and instructional support expenditures are the function codes for school
counselors, librarians, and support personnel. These expenditures are considered support to
instruction rather than instruction. This is where the Parents-As-Teachers program is paid
from as well as staff development activities for our teachers
8. General Administration Expenditures (2300)
General Administration codes the expenditures that are considered to be district wide
expenditures. These include central office salaries, insurance expenditures, and board related
expenses. School Administration Expenditures (2400)
9. Operations and Maintenance Expenditures (2600)
The Operations and Maintenance expenditures include custodial salaries, utilities cost,
building and grounds equipment and supplies to maintain the upkeep of the building and
grounds.
10. Other Costs (2500, & 2900: Other Supplemental Services) (3000: Non-Instruction
Services)
Other Costs are used to track so called non-instructional expenditures. This is where all of
the district’s At-Risk Program expenditures are coming from as well as the new change for
our transportation expenditures. Other Costs category also included the majority of the food
service salaries, food, and supplies. Other costs might also include data processing
equipment or supplies.
11. Capital Improvements (4000)
Capital Improvements are the cost associated with the improvement, replacement, or repair
of the district’s property. Such items as roof repair or replacement, some types of equipment,
and/or construction cost are all items that would be acceptable expenditures from the code
4000.
12. Debt Services (5000) and Transfers (5200)
The Debt Service is the accounting of our yearly payments on the bonds. Expenditures are
paid twice a fiscal year on September 1st and March 1st to retire our outstanding bonds. The
September payment is an interest plus principal payment. The March payment is an interest
only payment.
13. The Transfers code (5200) tracks all of the transfers from one fund to another. Such transfers
include transfers from general fund or supplemental general fund (LOB) to the special
education fund, staff development fund, drivers’ education fund, or vocational education
fund.
14. Miscellaneous Information Unencumbered Cash Balance by Fund
The unencumbered cash balance is an analysis of the cash on hand in each of the funds on
July 1 of each year. Each fund is governed by law to the extent of what the carryover or cash
balance may be. As you can tell the total cash balance has been going down for the past
several years. This is a trend that sets off alarms for the future. Also, a caution needs to be
observed here. Certain funds such as the LOB are not necessarily expendable cash. These
types of funds are regulated by the legal published budget and these dollars are taxes in
process. Therefore, these dollars are carried to the next tax year and figures in to reduce the
amount of taxes needed to fund the next year’s budget.

9
15. Reserve Funds Unencumbered Cash Balance
This fund does not pertain to USD 309.
16. Other Information - FTE
Other Information is a five year and three year analysis of our student head count or FTE and
is used to calculate the district’s budget authority for the General Fund. The budget authority
from the General Fund is used to calculate the Supplemental General Fund (LOB) on a
percentage basis. The FTE numbers are used for several calculations that make up the
budget process. Free meals are used to calculate our budget authority for the At-Risk
Program.
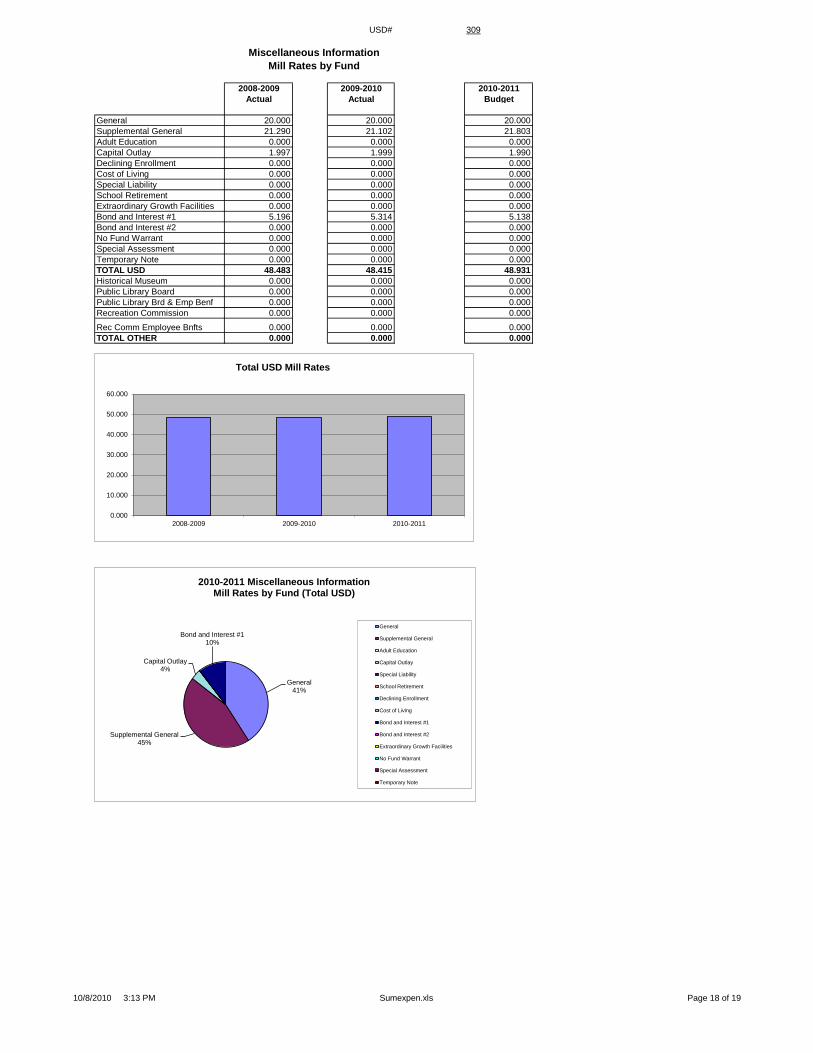
17. Miscellaneous Information Mill Rates by Fund
These charts and graphs analyze the mill rate for you the, taxpayer. For USD 309 there are
only four categories used to collect local tax dollars to support your local educational
program. The General Fund will collect 20 mills. This is set by the State. Supplemental
General Fund (LOB) is a little more complex. The LOB will fluctuate from year to year.
There are many factors that cause this fluctuation, but the main reason is the amount of
resources needed to fund the percentage of the General Fund authority each year. Capital
Outlay can only be changed by resolution and is currently established at 4.00 mills. Finally
the Bond and Interest will change with the valuation that is used in the calculations each year
and can only be used to pay for outstanding bonds.
18. Other Information – Assessed Valuation and Bonded Indebtedness
The last graph analyzes the district’s valuation. Valuation is the fair market value of the
tangible property within the boundaries of the school district.
Note: The FTE (full time equivalency) used in this report to calculate the “Amount Per
Pupil” is defined as following: Enrollment (FTE) includes the enrollment of the district
used for state aid and budget authority, and all other preschool enrollment and kindergarten
students attending full time.

10
KSDE Website Information Available
K-12 Statistics (Building, District or State Totals)
http://svapp15586.ksde.org/k12/k12.aspx
Attendance / Enrollment Reports
Staff Reports
Graduates / Dropouts Reports
Crime / Violence Reports
School Finance Reports and Publications
http://www.ksde.org/Default.aspx?tabid=1870
Certified Personnel
Enrollment
Dropouts
Graduates
Salary Reports
Kansas Building Report Card
http://svapp15586.ksde.org/rcard/
Attendance Rate
Graduation Rate
Dropout Rate
School Violence
Assessments
o Reading
o Mathematics
o Writing
Graduates Passing Adv. Science Courses
Graduates Passing Adv. Math Courses

USD# 309
Summary of Total Expenditures By Function
(All Funds)
% % % % %
2008-2009 of 2009-2010 of inc/ 2010-2011 of inc/
Actual Tot Actual Tot dec Budget Tot dec
Instruction 7,356,416 56% 7,021,844 54% -5% 7,453,627 53% 6%
Student & Instructional Support 634,863 5% 642,233 5% 1% 642,673 5% 0%
General Administration 563,640 4% 567,984 4% 1% 544,287 4% -4%
School Administration (Building) 974,793 7% 945,999 7% -3% 933,463 7% -1%
Operations & Maintenance 1,265,813 10% 1,163,462 9% -8% 1,415,002 10% 22%
Capital Improvements 70,034 1% 497,226 4% 610% 362,000 3% -27%
Debt Services 497,380 4% 505,440 4% 2% 508,803 4% 1%
Other Costs 1,754,564 13% 1,727,465 13% -2% 2,244,879 16% 30%
Total Expenditures 13,117,503 100% 13,071,653 100% 0% 14,104,734 100% 8%
Amount per Pupil $11,431 $11,377 0% $12,340 8%
Note: Percentages on charts are within +-1% due to rounding used. Pie graph percentages may differ from charts for this reason also.
Further definition of what goes into each category:
Instruction - 1000 Operations & Maintenance - 2600
Student & Instructional Support - 2100 & 2200 Other Costs - 2500, 2900 and 3000 and all others not included elsewhere
General Administration - 2300 Capital Improvements - 4000
School Administration (Building) - 2400 Debt Services - 5100 Transfers - 5200
The funds that are included in the categories above are: General, Supplemental General, Bilingual Education, At Risk(4yr Old), At
Risk(K-12), Virtual Education, Capital Outlay, Driver Education, Extraordinary School Program, Summer School, Special Education,
Vocational Education, Professional Development, Bond & Interest #1, Bond & Interest #2, No-Fund Warrant, Special Assessment,
Parent Education, School Retirement, Student Materials Revolving & Textbook Rental, Tuition Reimbursement, Gifts/Grants, KPERS
Special Retirement Contribution, Contingency, Special Liability Expense, Federal Funds, Adult Education, and Adult Supplemental
Education.
0
1,000,000
2,000,000
3,000,000
4,000,000
5,000,000
6,000,000
7,000,000
8,000,000
Instruction Student &Instructional Support
GeneralAdministration
SchoolAdministration
(Building)
Operations &Maintenance
CapitalImprovements
Debt Services Other Costs
Summary of Total Expenditures By Function (All Funds)
2008-2009
2009-2010
2010-2011
Instruction 53%
Student & Instructional Support 4%
General Administration 4%
School Administration (Building)
7%
Operations & Maintenance 10%
Capital Improvements 2%
Debt Services 4%
Other Costs 16%
2010-2011 Summary of Total Expenditures By Function (All Funds)
Instruction
Student & Instructional Support
General Administration
School Administration (Building)
Operations & Maintenance
Capital Improvements
Debt Services
Other Costs
10/8/2010 3:13 PM Sumexpen.xls Page 1 of 19

USD# 309
Summary of General Expenditures
by Function
% % % % %
2008-2009 of 2009-2010 of inc/ 2010-2011 of inc/
Actual Tot Actual Tot dec Budget Tot dec
Instruction 3,392,214 54% 2,910,386 50% -14% 3,060,821 50% 5%
Student & Instructional Support 482,003 8% 477,750 8% -1% 456,778 8% -4%
General Administration 377,694 6% 384,384 7% 2% 379,257 6% -1%
School Administration (Building) 607,705 10% 737,385 13% 21% 588,615 10% -20%
Operations & Maintenance 910,542 14% 822,858 14% -10% 966,394 16% 17%
Capital Improvements 0 0% 0 0% 0% 0 0% 0%
Other Costs 557,619 9% 509,776 9% -9% 612,900 10% 20%
Total Expenditures 6,327,777 100% 5,842,539 100% -8% 6,064,765 100% 4%
Amount per Pupil $5,514 $5,085 -8% $5,306 4%
The Summary of General Fund Expenditures chart information comes from pages 6-13 and only uses the 'General Fund' line items.
0
500,000
1,000,000
1,500,000
2,000,000
2,500,000
3,000,000
3,500,000
4,000,000
Instruction Student &Instructional
Support
GeneralAdministration
SchoolAdministration
(Building)
Operations &Maintenance
CapitalImprovements
Other Costs
Summary of General Fund Expenditures by Function
2008-2009
2009-2010
2010-2011
Instruction 50%
Student & Instructional Support
8%
General Administration 6%
School Administration (Building)
10%
Operations & Maintenance 16%
Other Costs 10%
2010-2011 Summary of General Fund Expenditures by Function
Instruction
Student & Instructional Support
General Administration
School Administration (Building)
Operations & Maintenance
Capital Improvements
Other Costs
10/8/2010 3:13 PM Sumexpen.xls Page 2 of 19
USD# 309
Summary of Supplemental General Fund Expenditures
by Function
% % % % %
2008-2009 of 2009-2010 of inc/ 2010-2011 of inc/
Actual Tot Actual Tot dec Budget Tot dec
Instruction 188,571 13% 390,352 29% 107% 449,402 30% 15%
Student & Instructional Support 89,297 6% 105,177 8% 18% 109,835 7% 4%
General Administration 161,849 11% 145,451 11% -10% 122,000 8% -16%
School Administration (Building) 326,678 23% 158,433 12% -52% 150,000 10% -5%
Operations & Maintenance 295,337 21% 250,517 19% -15% 335,800 22% 34%
Capital Improvements 0 0% 0 0% 0% 0 0% 0%
Other Costs 358,887 25% 301,396 22% -16% 339,700 23% 13%
Total Expenditures 1,420,619 100% 1,351,326 100% -5% 1,506,737 100% 12%
Amount per Pupil $1,238 $1,176 -5% $1,318 12%
The Summary of Supplemental General Fund Expenditures chart information comes from pages 6-13 and only uses the 'Supplemental
General Fund' line items.
Instruction 30%
Student & Instructional Support
7%
General Administration 8%
School Administration (Building)
10%
Operations & Maintenance
22%
Other Costs 23%
2010-2011 Summary of Supplemental General Fund Expenditures by Function
Instruction
Student & Instructional Support
General Administration
School Administration (Building)
Operations & Maintenance
Capital Improvements
Other Costs
0
50,000
100,000
150,000
200,000
250,000
300,000
350,000
400,000
450,000
500,000
Instruction Student &Instructional
Support
GeneralAdministration
SchoolAdministration
(Building)
Operations &Maintenance
CapitalImprovements
Other Costs
Summary of Supplemental General Fund Expenditures by Function
2008-2009
2009-2010
2010-2011
10/8/2010 3:13 PM Sumexpen.xls Page 3 of 19

USD# 309
Summary of General and Supplemental General Fund
Expenditures by Function
% % % % %
2008-2009 of 2009-2010 of inc/ 2010-2011 of inc/
Actual Tot Actual Tot dec Budget Tot dec
Instruction 3,580,785 46% 3,300,738 46% -8% 3,510,223 46% 6%
Student & Instructional Support 571,300 7% 582,927 8% 2% 566,613 7% -3%
General Administration 539,543 7% 529,835 7% -2% 501,257 7% -5%
School Administration (Building) 934,383 12% 895,818 12% -4% 738,615 10% -18%
Operations & Maintenance 1,205,879 16% 1,073,375 15% -11% 1,302,194 17% 21%
Capital Improvements 0 0% 0 0% 0% 0 0% 0%
Other Costs 916,506 12% 811,172 11% -11% 952,600 13% 17%
Total Expenditures 7,748,396 100% 7,193,865 100% -7% 7,571,502 100% 5%
Amount per Pupil $6,752 $6,261 -7% $6,624 6%
The Summary of General and Supplemental General Fund Expenditures chart information comes from pages 6-13 and adds together
the 'General Fund' and 'Supplemental General Fund' line items.
0
500,000
1,000,000
1,500,000
2,000,000
2,500,000
3,000,000
3,500,000
4,000,000
Instruction Student &Instructional
Support
GeneralAdministration
SchoolAdministration
(Building)
Operations &Maintenance
CapitalImprovements
Other Costs
Summary of General and Supplemental General Fund Expenditures by Function
2008-2009
2009-2010
2010-2011
Instruction 46%
Student & Instructional Support
7%
General Administration 7%
School Administration (Building)
10%
Operations & Maintenance 17%
Other Costs 13%
2010-2011 Summary of General and Supplemental General Fund Expenditures by Function
Instruction
Student & Instructional Support
General Administration
School Administration (Building)
Operations & Maintenance
Capital Improvements
Other Costs
10/8/2010 3:13 PM Sumexpen.xls Page 4 of 19

USD# 309
Summary of Special Education Fund
by Function
% % % % %
2008-2009 of 2009-2010 of inc/ 2010-2011 of inc/
Actual Tot Actual Tot dec Budget Tot dec
Instruction 1,446,622 91% 1,290,947 85% -11% 1,253,608 83% -3%
Student & Instructional Support 0 0% 0 0% 0% 0 0% 0%
General Administration 0 0% 0 0% 0% 0 0% 0%
School Administration (Building) 0 0% 0 0% 0% 0 0% 0%
Operations & Maintenance 1,196 0% 0 0% -100% 0 0% 0%
Capital Improvements 0 0% 0 0% 0% 0 0% 0%
Other Costs 133,823 8% 229,815 15% 72% 255,575 17% 11%
Total Expenditures 1,581,641 100% 1,520,762 100% -4% 1,509,183 100% -1%
Amount per Pupil $1,378 $1,324 -4% $1,320 0%
The Summary of Special Education Fund Expenditures chart information comes from pages 6-13 and only uses the 'Special Education Fund'
line items. (Total expenditures excludes Special Ed Coop Fund because it would include expenditures for all schools participating in the Coop.)
0
200,000
400,000
600,000
800,000
1,000,000
1,200,000
1,400,000
1,600,000
Instruction Student &Instructional
Support
GeneralAdministration
SchoolAdministration
(Building)
Operations &Maintenance
CapitalImprovements
Other Costs
Summary of Special Education Fund Expenditures by Function
2008-2009
2009-2010
2010-2011
Instruction 83%
Other Costs 17%
2010-2011 Summary of Special Education Fund by Function
Instruction
Student & Instructional Support
General Administration
School Administration (Building)
Operations & Maintenance
Capital Improvements
Other Costs
10/8/2010 3:13 PM Sumexpen.xls Page 5 of 19

USD# 309
Instruction Expenditures (1000)
% %
2008-2009 2009-2010 inc/ 2010-2011 inc/
Actual Actual dec Budget dec
General 3,392,214 2,910,386 -14% 3,060,821 5%
Federal Funds 302,722 435,058 44% 393,400 -10%
Supplemental General 188,571 390,352 107% 449,402 15%
At Risk (4yr Old) 55,513 55,509 0% 61,504 11%
At Risk (K-12) 1,158,960 1,118,605 -3% 1,191,900 7%
Bilingual Education 43,873 51,322 17% 55,980 9%
Virtual Education 0 0 0% 0 0%
Capital Outlay 72,994 82,610 13% 200,000 142%
Driver Education 14,213 13,034 -8% 22,150 70%
Declining Enrollment 0 0 0% 0 0%
Extraordinary School Program 0 0 0% 0 0%
Food Service 0 0 0% 0 0%
Professional Development 0 0 0% 0 0%
Parent Education Program 0 0 0% 0 0%
Summer School 0 0 0% 0 0%
Special Education 1,446,622 1,290,947 -11% 1,253,608 -3%
Cost of Living 0 0 0% 0 0%
Vocational Education 325,605 346,188 6% 428,500 24%
Gifts/Grants 0 0 0% 0 0%
Special Liability 0 0 0% 0 0%
School Retirement 0 0 0% 0 0%
Extraordinary Growth Facilities 0 0 0% 0 0%
Special Reserve 0 0 0%
KPERS Spec. Ret. Contribution 289,171 295,054 2% 336,362 14%
Contingency Reserve 0 0 0%
Text Book & Student Material 65,958 32,779 -50%
Bond and Interest #1 0 0 0% 0 0%
Bond and Interest #2 0 0 0% 0 0%
No-Fund Warrant 0 0 0% 0 0%
Special Assessment 0 0 0% 0 0%
Temporary Note 0 0 0% 0 0%
SUBTOTAL 7,356,416 7,021,844 -5% 7,453,627 6%
Enrollment (FTE)* 1,147.5 1,149.0 0% 1,143.0 -1%
Amount per Pupil 6,411 6,111 -5% 6,521 7%
Adult Education 0 0 0% 0 0%
Adult Supplemental Education 0 0 0% 0 0%
Tuition Reimbursement 0 0 0% 0 0%
Special Education Coop 0 0 0% 0 0%
TOTAL 7,356,416 7,021,844 -5% 7,453,627 6%
NOTE: Gifts/Grants includes private grants and grants from nonfederal sources.
Amount per pupil excludes the following funds: Adult Education, Adult Supplemental Education, Special Education Coop
and Tuition Reimbursement.
*Enrollment (FTE) includes the enrollment of the district used for state aid and budget authority, and all other preschool enrollment
and kindergarten students attending full time.
0
1,000,000
2,000,000
3,000,000
4,000,000
5,000,000
6,000,000
7,000,000
8,000,000
2008-2009 2009-2010 2010-2011
Instruction Expenditures
0
500,000
1,000,000
1,500,000
2,000,000
2,500,000
3,000,000
3,500,000
4,000,000
2008-2009 2009-2010 2010-2011
Instruction Expenditures
General
Supplemental General
Special Education
10/8/2010 3:13 PM Sumexpen.xls Page 6 of 19

USD# 309
Student and Instructional Support Expenditures (2100 & 2200)
% %
2008-2009 2009-2010 inc/ 2010-2011 inc/
Actual Actual dec Budget dec
General 482,003 477,750 -1% 456,778 -4%
Federal Funds 0 0 0% 0 0%
Supplemental General 89,297 105,177 18% 109,835 4%
At Risk (4yr Old) 0 0 0% 0 0%
At Risk (K-12) 0 0 0% 0 0%
Bilingual Education 0 0 0% 0 0%
Virtual Education 0 0 0% 0 0%
Capital Outlay 0 0 0% 0 0%
Driver Training 0 0 0% 0 0%
Declining Enrollment 0 0 0% 0 0%
Extraordinary School Program 0 0 0% 0 0%
Food Service 0 0 0% 0 0%
Professional Development 7,214 2,128 -71% 10,000 370%
Parent Education Program 8,155 8,002 -2% 10,000 25%
Summer School 0 0 0% 0 0%
Special Education 0 0 0% 0 0%
Cost of Living 0 0 0% 0 0%
Vocational Education 0 0 0% 0 0%
Gifts/Grants 0 0 0% 0 0%
Special Liability 0 0 0% 0 0%
School Retirement 0 0 0% 0 0%
Extraordinary Growth Facilities 0 0 0% 0 0%
Special Reserve 0 0 0%
KPERS Spec. Ret. Contribution 48,194 49,176 2% 56,060 14%
Contingency Reserve 0 0 0%
Text Book & Student Material 0 0 0%
Bond and Interest #1 0 0 0% 0 0%
Bond and Interest #2 0 0 0% 0 0%
No-Fund Warrant 0 0 0% 0 0%
Special Assessment 0 0 0% 0 0%
Temporary Note 0 0 0% 0 0%
SUBTOTAL 634,863 642,233 1% 642,673 0%
Enrollment (FTE)* 1,147.5 1,149.0 0% 1,143.0 -1%
Amount per Pupil 553 559 1% 562 1%
Adult Education 0 0 0% 0 0%
Adult Supplemental Education 0 0 0% 0 0%
Tuition Reimbursement 0 0 0% 0 0%
Special Education Coop 0 0 0% 0 0%
TOTAL 634,863 642,233 1% 642,673 0%
Amount per Pupil $561 $567 1% $566 0%
NOTE: Gifts/Grants includes private grants and grants from nonfederal sources.
Amount per pupil excludes the following funds: Adult Education, Adult Supplemental Education, Special Education Coop
and Tuition Reimbursement.
*Enrollment (FTE) includes the enrollment of the district used for state aid and budget authority, and all other preschool enrollment
and kindergarten students attending full time.
0
100,000
200,000
300,000
400,000
500,000
600,000
700,000
2008-2009 2009-2010 2010-2011
Student and Instructional Support Expenditures
10/8/2010 3:13 PM Sumexpen.xls Page 7 of 19

USD# 309
General Administration Expenditures (2300)
% %
2008-2009 2009-2010 inc/ 2010-2011 inc/
Actual Actual dec Budget dec
General 377,694 384,384 2% 379,257 -1%
Federal Funds 0 0 0% 0 0%
Supplemental General 161,849 145,451 -10% 122,000 -16%
At Risk (4yr Old) 0 0 0% 0 0%
At Risk (K-12) 0 0 0% 0 0%
Bilingual Education 0 0 0% 0 0%
Virtual Education 0 0 0% 0 0%
Capital Outlay 0 13,561 0% 15,000 11%
Driver Training 0 0 0% 0 0%
Declining Enrollment 0 0 0% 0 0%
Extraordinary School Program 0 0 0% 0 0%
Food Service 0 0 0% 0 0%
Professional Development 0 0 0% 0 0%
Parent Education Program 0 0 0% 0 0%
Summer School 0 0 0% 0 0%
Special Education 0 0 0% 0 0%
Cost of Living 0 0 0% 0 0%
Vocational Education 0 0 0% 0 0%
Gifts/Grants 0 0 0% 0 0%
Special Liability Expense 0 0 0% 0 0%
School Retirement 0 0 0% 0 0%
Extraordinary Growth Facilities 0 0 0% 0 0%
Special Reserve 0 0 0%
KPERS Spec. Ret. Contribution 24,097 24,588 2% 28,030 14%
Contingency Reserve 0 0 0%
Text Book & Student Material 0 0 0%
Bond and Interest #1 0 0 0% 0 0%
Bond and Interest #2 0 0 0% 0 0%
No-Fund Warrant 0 0 0% 0 0%
Special Assessment 0 0 0% 0 0%
Temporary Note 0 0 0% 0 0%
SUBTOTAL 563,640 567,984 1% 544,287 -4%
Enrollment (FTE)* 1,147.5 1,149.0 0% 1,143.0 -1%
Amount per Pupil 491 494 1% 476 -4%
Adult Education 0 0 0% 0 0%
Adult Supplemental Education 0 0 0% 0 0%
Tuition Reimbursement 0 0 0% 0 0%
Special Education Coop 0 0 0% 0 0%
TOTAL 563,640 567,984 1% 544,287 -4%
NOTE: Gifts/Grants includes private grants and grants from nonfederal sources.
Amount per pupil excludes the following funds: Adult Education, Adult Supplemental Education, Special Education Coop
and Tuition Reimbursement.
*Enrollment (FTE) includes the enrollment of the district used for state aid and budget authority, and all other preschool enrollment
and kindergarten students attending full time.
0
100,000
200,000
300,000
400,000
500,000
600,000
2008-2009 2009-2010 2010-2011
General Administration Expenditures
10/8/2010 3:13 PM Sumexpen.xls Page 8 of 19

USD# 309
School Administration Expenditures (2400)
% %
2008-2009 2009-2010 inc/ 2010-2011 inc/
Actual Actual dec Budget dec
General 607,705 737,385 21% 588,615 -20%
Federal Funds 0 0 0% 0 0%
Supplemental General 326,678 158,433 -52% 150,000 -5%
At Risk (4yr Old) 0 0 0% 0 0%
At Risk (K-12) 0 0 0% 0 0%
Bilingual Education 0 0 0% 0 0%
Virtual Education 0 0 0% 0 0%
Capital Outlay 1,854 10,841 485% 150,000 1284%
Driver Training 0 0 0% 0 0%
Declining Enrollment 0 0 0% 0 0%
Extraordinary School Program 0 0 0% 0 0%
Food Service 0 0 0% 0 0%
Professional Development 0 0 0% 0 0%
Parent Education Program 0 0 0% 0 0%
Summer School 0 0 0% 0 0%
Special Education 0 0 0% 0 0%
Cost of Living 0 0 0% 0 0%
Vocational Education 0 0 0% 0 0%
Gifts/Grants 0 0 0% 0 0%
Special Liability Expense 0 0 0% 0 0%
School Retirement 0 0 0% 0 0%
Extraordinary Growth Facilities 0 0 0% 0 0%
Special Reserve 0 0 0%
KPERS Spec. Ret. Contribution 38,556 39,340 2% 44,848 14%
Contingency Reserve 0 0 0%
Text Book & Student Material 0 0 0%
Bond and Interest #1 0 0 0% 0 0%
Bond and Interest #2 0 0 0% 0 0%
No-Fund Warrant 0 0 0% 0 0%
Special Assessment 0 0 0% 0 0%
Temporary Note 0 0 0% 0 0%
SUBTOTAL 974,793 945,999 -3% 933,463 -1%
Enrollment (FTE)* 1,147.5 1,149.0 0% 1,143.0 -1%
Amount per Pupil 849 823 -3% 817 -1%
Adult Education 0 0 0% 0 0%
Adult Supplemental Education 0 0 0% 0 0%
Tuition Reimbursement 0 0 0% 0 0%
Special Education Coop 0 0 0% 0 0%
TOTAL 974,793 945,999 -3% 933,463 -1%
NOTE: Gifts/Grants includes private grants and grants from nonfederal sources.
Amount per pupil excludes the following funds: Adult Education, Adult Supplemental Education, Special Education Coop
and Tuition Reimbursement.
*Enrollment (FTE) includes the enrollment of the district used for state aid and budget authority, and all other preschool enrollment
and kindergarten students attending full time.
0
200,000
400,000
600,000
800,000
1,000,000
1,200,000
2008-2009 2009-2010 2010-2011
School Administration Expenditures
10/8/2010 3:13 PM Sumexpen.xls Page 9 of 19

USD# 309
Operations and Maintenance Expenditures (2600)
% %
2008-2009 2009-2010 inc/ 2010-2011 inc/
Actual Actual dec Budget dec
General 910,542 822,858 -10% 966,394 17%
Federal Funds 0 0 0% 0 0%
Supplemental General 295,337 250,517 -15% 335,800 34%
At Risk (4yr Old) 0 0 0% 0 0%
At Risk (K-12) 0 0 0% 0 0%
Bilingual Education 0 0 0% 0 0%
Virtual Education 0 0 0% 0 0%
Capital Outlay 6,285 37,320 494% 50,000 34%
Driver Training 0 0 0% 0 0%
Declining Enrollment 0 0 0% 0 0%
Extraordinary School Program 0 0 0% 0 0%
Food Service 13,897 13,427 -3% 17,960 34%
Professional Development 0 0 0% 0 0%
Parent Education Program 0 0 0% 0 0%
Summer School 0 0 0% 0 0%
Special Education 1,196 0 -100% 0 0%
Cost of Living 0 0 0% 0 0%
Vocational Education 0 0 0% 0 0%
Gifts/Grants 0 0 0% 0 0%
Special Liability 0 0 0% 0 0%
School Retirement 0 0 0% 0 0%
Extraordinary Growth Facilities 0 0 0% 0 0%
Special Reserve 0 0 0%
KPERS Spec. Ret. Contribution 38,556 39,340 2% 44,848 14%
Contingency Reserve 0 0 0%
Text Book & Student Material 0 0 0%
Bond and Interest #1 0 0 0% 0 0%
Bond and Interest #2 0 0 0% 0 0%
No-Fund Warrant 0 0 0% 0 0%
Special Assessment 0 0 0% 0 0%
Temporary Note 0 0 0% 0 0%
SUBTOTAL 1,265,813 1,163,462 -8% 1,415,002 22%
Enrollment (FTE)* 1,147.5 1,149.0 0% 1,143.0 -1%
Amount per Pupil 1,103 1,013 -8% 1,238 22%
Adult Education 0 0 0% 0 0%
Adult Supplemental Education 0 0 0% 0 0%
Tuition Reimbursement 0 0 0% 0 0%
Special Education Coop 0 0 0% 0 0%
TOTAL 1,265,813 1,163,462 -8% 1,415,002 22%
NOTE: Gifts/Grants includes private grants and grants from nonfederal sources.
Amount per pupil excludes the following funds: Adult Education, Adult Supplemental Education, Special Education Coop
and Tuition Reimbursement.
*Enrollment (FTE) includes the enrollment of the district used for state aid and budget authority, and all other preschool enrollment
and kindergarten students attending full time.
0
200,000
400,000
600,000
800,000
1,000,000
1,200,000
1,400,000
1,600,000
2008-2009 2009-2010 2010-2011
Operations and Maintenance Expenditures
10/8/2010 3:13 PM Sumexpen.xls Page 10 of 19

USD# 309
Other Costs
(2500 & 2900: Other Supplemental Services)
(2700: Transportation)
(3000: Non-Instruction Services)
% %
2008-2009 2009-2010 inc/ 2010-2011 inc/
Actual Actual dec Budget dec
General 557,619 509,776 -9% 612,900 20%
Federal Funds 0 0 0% 0 0%
Supplemental General 358,887 301,396 -16% 339,700 13%
At Risk (4yr Old) 0 0 0% 0 0%
At Risk (K-12) 0 0 0% 0 0%
Bilingual Education 0 0 0% 0 0%
Virtual Education 0 0 0% 0 0%
Capital Outlay 0 0 0% 250,000 0%
Driver Training 0 0 0% 0 0%
Declining Enrollment 0 0 0% 0 0%
Extraordinary School Program 0 0 0% 0 0%
Food Service 631,301 624,432 -1% 706,250 13%
Professional Development 29,559 17,788 -40% 30,000 69%
Parent Education Program 0 0 0% 0 0%
Summer School 0 0 0% 0 0%
Special Education 133,823 229,815 72% 255,575 11%
Cost of Living 0 0 0% 0 0%
Vocational Education 0 0 0% 0 0%
Gifts/Grants 0 0 0% 0 0%
Special Liability 0 0 0% 0 0%
School Retirement 0 0 0% 0 0%
Extraordinary Growth Facilities 0 0 0% 0 0%
Special Reserve 0 0 0%
KPERS Spec. Ret. Contribution 43,375 44,258 2% 50,454 14%
Contingency Reserve 0 0 0%
Text Book & Student Material 0 0 0%
Bond and Interest #1 0 0 0% 0 0%
Bond and Interest #2 0 0 0% 0 0%
No-Fund Warrant 0 0 0% 0 0%
Special Assessment 0 0 0% 0 0%
Temporary Note 0 0 0% 0 0%
SUBTOTAL 1,754,564 1,727,465 -2% 2,244,879 30%
Enrollment (FTE)* 1,147.5 1,149.0 0% 1,143.0 -1%
Amount per Pupil 1,529 1,503 -2% 1,964 31%
Adult Education 0 0 0% 0 0%
Adult Supplemental Education 0 0 0% 0 0%
Tuition Reimbursement 0 0 0% 0 0%
Special Education Coop 0 0 0% 0 0%
TOTAL 1,754,564 1,727,465 -2% 2,244,879 30%
NOTE: Gifts/Grants includes private grants and grants from nonfederal sources.
Amount per pupil excludes the following funds: Adult Education, Adult Supplemental Education, Special Education Coop
and Tuition Reimbursement.
*Enrollment (FTE) includes the enrollment of the district used for state aid and budget authority, and all other preschool enrollment
and kindergarten students attending full time.
0
500,000
1,000,000
1,500,000
2,000,000
2,500,000
2008-2009 2009-2010 2010-2011
Other Costs
10/8/2010 3:13 PM Sumexpen.xls Page 11 of 19

USD# 309
Capital Improvements Expenditures (4000)
% %
2008-2009 2009-2010 inc/ 2010-2011 inc/
Actual Actual dec Budget dec
General 0 0 0% 0 0%
Federal Funds 0 0 0% 0 0%
Supplemental General 0 0 0% 0 0%
At Risk (4yr Old) 0 0 0% 0 0%
At Risk (K-12) 0 0 0% 0 0%
Bilingual Education 0 0 0% 0 0%
Virtual Education 0 0 0% 0 0%
Capital Outlay 70,034 497,226 610% 362,000 -27%
Driver Training 0 0 0% 0 0%
Declining Enrollment 0 0 0% 0 0%
Extraordinary School Program 0 0 0% 0 0%
Food Service 0 0 0% 0 0%
Professional Development 0 0 0% 0 0%
Parent Education Program 0 0 0% 0 0%
Summer School 0 0 0% 0 0%
Special Education 0 0 0% 0 0%
Cost of Living 0 0 0% 0 0%
Vocational Education 0 0 0% 0 0%
Gifts/Grants 0 0 0% 0 0%
Special Liability 0 0 0% 0 0%
School Retirement 0 0 0% 0 0%
Extraordinary Growth Facilities 0 0 0% 0 0%
Special Reserve 0 0 0%
KPERS Spec. Ret. Contribution 0 0 0% 0 0%
Contingency Reserve 0 0 0%
Text Book & Student Material 0 0 0%
Bond and Interest #1 0 0 0% 0 0%
Bond and Interest #2 0 0 0% 0 0%
No-Fund Warrant 0 0 0% 0 0%
Special Assessment 0 0 0% 0 0%
Temporary Note 0 0 0% 0 0%
SUBTOTAL 70,034 497,226 610% 362,000 -27%
Enrollment (FTE)* 1,147.5 1,149.0 0% 1,143.0 -1%
Amount per Pupil 61 433 609% 317 -27%
Adult Education 0 0 0% 0 0%
Adult Supplemental Education 0 0 0% 0 0%
Tuition Reimbursement 0 0 0% 0 0%
Special Education Coop 0 0 0% 0 0%
TOTAL 70,034 497,226 610% 362,000 -27%
NOTE: Gifts/Grants includes private grants and grants from nonfederal sources.
Amount per pupil excludes the following funds: Adult Education, Adult Supplemental Education, Special Education Coop
and Tuition Reimbursement.
*Enrollment (FTE) includes the enrollment of the district used for state aid and budget authority, and all other preschool enrollment
and kindergarten students attending full time.
0
100,000
200,000
300,000
400,000
500,000
600,000
2008-2009 2009-2010 2010-2011
Capital Improvements (4000)
10/8/2010 3:13 PM Sumexpen.xls Page 12 of 19

USD# 309
Debt Services Expenditures (5100)
% %
2008-2009 2009-2010 inc/ 2010-2011 inc/
Actual Actual dec Budget dec
General 0 0 0% 0 0%
Federal Funds 0 0 0% 0 0%
Supplemental General 0 0 0% 0 0%
At Risk (4yr Old) 0 0 0% 0 0%
At Risk (K-12) 0 0 0% 0 0%
Bilingual Education 0 0 0% 0 0%
Virtual Education 0 0 0% 0 0%
Capital Outlay 0 0 0% 0 0%
Driver Training 0 0 0% 0 0%
Declining Enrollment 0 0 0% 0 0%
Extraordinary School Program 0 0 0% 0 0%
Food Service 0 0 0% 0 0%
Professional Development 0 0 0% 0 0%
Parent Education Program 0 0 0% 0 0%
Summer School 0 0 0% 0 0%
Special Education 0 0 0% 0 0%
Cost of Living 0 0 0% 0 0%
Vocational Education 0 0 0% 0 0%
Gifts/Grants 0 0 0% 0 0%
Special Liability 0 0 0% 0 0%
School Retirement 0 0 0% 0 0%
Extraordinary Growth Facilities 0 0 0% 0 0%
Special Reserve 0 0 0%
KPERS Spec. Ret. Contribution 0 0 0% 0 0%
Contingency Reserve 0 0 0%
Text Book & Student Material 0 0 0%
Bond and Interest #1 497,380 505,440 2% 508,803 1%
Bond and Interest #2 0 0 0% 0 0%
No-Fund Warrant 0 0 0% 0 0%
Special Assessment 0 0 0% 0 0%
Temporary Note 0 0 0% 0 0%
SUBTOTAL 497,380 505,440 2% 508,803 1%
Enrollment (FTE)* 1,147.5 1,149.0 0% 1,143.0 -1%
Amount per Pupil 433 440 1% 445 1%
Adult Education 0 0 0% 0 0%
Adult Supplemental Education 0 0 0% 0 0%
Tuition Reimbursement 0 0 0% 0 0%
Special Education Coop 0 0 0% 0 0%
TOTAL 497,380 505,440 2% 508,803 1%
NOTE: Gifts/Grants includes private grants and grants from nonfederal sources.
Amount per pupil excludes the following funds: Adult Education, Adult Supplemental Education, Special Education Coop
and Tuition Reimbursement.
*Enrollment (FTE) includes the enrollment of the district used for state aid and budget authority, and all other preschool enrollment
and kindergarten students attending full time.
0
100,000
200,000
300,000
400,000
500,000
600,000
2008-2009 2009-2010 2010-2011
Debt Services (5100)
10/8/2010 3:13 PM Sumexpen.xls Page 13 of 19

USD# 309
Transfers (5200)
% %
2008-2009 2009-2010 inc/ 2010-2011 inc/
Actual Actual dec Budget dec
General 2,705,486 2,356,234 -13% 2,188,320 -7%
Federal Funds 0 0 0% 0 0%
Supplemental General 1,063,443 1,238,659 16% 1,170,000 -6%
At Risk (4yr Old) 0 0 0% 0 0%
At Risk (K-12) 0 0 0% 0 0%
Bilingual Education 0 0 0% 0 0%
Virtual Education 0 0 0% 0 0%
Capital Outlay
Driver Training 0 0 0% 0 0%
Declining Enrollment 0 0 0% 0 0%
Extraordinary School Program 0 0 0% 0 0%
Food Service 0 0 0% 0 0%
Professional Development 0 0 0% 0 0%
Parent Education Program 0 0 0% 0 0%
Summer School 0 0 0% 0 0%
Special Education 0 0 0% 0 0%
Cost of Living 0 0 0% 0 0%
Vocational Education 0 0 0% 0 0%
Gifts/Grants 0 0 0% 0 0%
Special Liability 0 0 0% 0 0%
School Retirement 0 0 0% 0 0%
Extraordinary Growth Facilities 0 0 0% 0 0%
Special Reserve 0 0 0%
KPERS Spec. Ret. Contribution 0 0 0% 0 0%
Contingency Reserve 0 0 0%
Text Book & Student Material 0 0 0%
Bond and Interest #1 0 0 0% 0 0%
Bond and Interest #2 0 0 0% 0 0%
No-Fund Warrant 0 0 0% 0 0%
Special Assessment 0 0 0% 0 0%
Temporary Note 0 0 0% 0 0%
SUBTOTAL 3,768,929 3,594,893 -5% 3,358,320 -7%
Enrollment (FTE)* 1,147.5 1,149.0 0% 1,143.0 -1%
Amount per Pupil 3,284 3,129 -5% 2,938 -6%
Adult Education 0 0 0% 0 0%
Adult Supplemental Education 0 0 0% 0 0%
Tuition Reimbursement 0 0 0% 0 0%
Special Education Coop 0 0 0% 0 0%
TOTAL 3,768,929 3,594,893 -5% 3,358,320 -7%
NOTE: Gifts/Grants includes private grants and grants from nonfederal sources.
Amount per pupil excludes the following funds: Adult Education, Adult Supplemental Education, Special Education Coop
and Tuition Reimbursement.
*Enrollment (FTE) includes the enrollment of the district used for state aid and budget authority, and all other preschool enrollment
and kindergarten students attending full time.
0
500,000
1,000,000
1,500,000
2,000,000
2,500,000
3,000,000
3,500,000
4,000,000
2008-2009 2009-2010 2010-2011
Transfers (5200)
10/8/2010 3:13 PM Sumexpen.xls Page 14 of 19

USD# 309
Miscellaneous Information
Unencumbered Cash Balance by Fund
July 1, 2008 July 1, 2009 July 1, 2010
General 0 0 0
Federal Funds 29,136 45,032 95,802
Supplemental General 40,131 100,395 93,330
At Risk (4yr Old) 10,555 20,042 29,533
At Risk (K-12) 71,179 75,741 157,719
Bilingual Education 30,970 37,302 45,951
Virtual Education 0 0 0
Capital Outlay 1,292,148 1,718,957 1,522,963
Driver Training 35,756 32,919 37,322
Declining Enrollment 0 0 0
Extraordinary School Program 0 0 0
Food Service 201,305 213,383 215,649
Professional Development 136,311 105,504 85,588
Parent Education Program 30,876 29,888 31,886
Summer School 0 0 0
Special Education 469,142 569,740 631,935
Cost of Living 0 0 0
Vocational Education 32,181 55,076 114,030
Gifts/Grants 0 0 0
Special Liability 0 0 0
School Retirement 0 0 0
Extraordinary Growth Facilities 0 0 0
Special Reserve 0 0 0
KPERS Spec. Ret. Contribution 0 0 0
Contingency Reserve 425,000 500,000 500,000
Text Book & Student Material 22,287 22,380 40,579
Bond and Interest #1 400,566 414,127 418,855
Bond and Interest #2 0 0 0
No Fund Warrant 0 0 0
Special Assessment 0 0 0
Temporary Note 0 0 0
SUBTOTAL 3,227,543 3,940,486 4,021,142
Enrollment (FTE)* 1,147.5 1,149.0 1,143.0
Amount per Pupil 2,813 3,429 3,518
Adult Education 0 0 0
Adult Supplemental Education 0 0 0
Tuition Reimbursement 0 0 0
Special Education Coop 0 0 0
TOTAL 3,227,543 3,940,486 4,021,142
NOTE: Gifts/Grants includes private grants and grants from nonfederal sources.
Amount per pupil excludes the following funds: Adult Education, Adult Supplemental Education, Special Education Coop
and Tuition Reimbursement.
*Enrollment (FTE) includes the enrollment of the district used for state aid and budget authority, and all other preschool enrollment
and kindergarten students attending full time.
0
500,000
1,000,000
1,500,000
2,000,000
2,500,000
3,000,000
3,500,000
4,000,000
4,500,000
July 1, 2008 July 1, 2009 July 1, 2010
Unencumbered Cash Balances by Fund
10/8/2010 3:13 PM Sumexpen.xls Page 15 of 19
USD# 309
Reserve Funds
Unencumbered Cash Balance
July 1, 2008 July 1, 2009
Special Reserve 0 0
TOTAL OTHER 0 0
Amount per Pupil $0 $0
*School districts are authorized by law to self insure rather than purchase insurance for the following categories: Worker's Comp,
Health Insurance, Life Insurance, Property and Casualty (Risk Management) and Disability Income Insurance. Monies are placed
in the Self Insured Fund to pay for claims which may arise from the categories listed above.
0
0
0
0
0
1
1
1
1
1
1
July 1, 2008 July 1, 2009
Unencumbered Cash Balances by Fund (Reserve Funds Only)
10/8/2010 3:13 PM Sumexpen.xls Page 16 of 19

USD# 309
Other Information
2006-2007 2007-2008 % 2008-2009 % 2009-2010 % 2010-2011 %
Actual Actual inc/ Actual inc/ Actual inc/ Budget inc/
dec dec dec dec
Enrollment (FTE)* 1,119.2 1,158.7 4% 1,132.4 -2% 1,132.7 0% 1,135.0 0%
Enrollment (FTE)** 1,125.7 1,164.2 3% 1,147.5 -1% 1,149.0 0% 1,143.0 -1%
Number of Students -
Free Meals 432 493 14% 507 3% 533 5% 540 1%
Number of Students -
Reduced Meals 211 198 -6% 175 -12% 181 3% 170 -6%
*FTE for state aid and budget authority purposes for general fund (excludes 4 yr old at-risk).
** FTE includes 9/20 enrollment used for state aid purposes and adding the additional FTE for preschool programs, headstart, and all-day
kindergarten. For example, preschool students attending half days on September 20th would be counted as .5 FTE. Kindergarten
students attending full time every day would be counted as 1.0 FTE.
0.0
200.0
400.0
600.0
800.0
1000.0
1200.0
1400.0
2006-2007 2007-2008 2008-2009 2009-2010 2010-2011
Enrollment (FTE)* for Budget Authority
0
100
200
300
400
500
600
2006-2007 2007-2008 2008-2009 2009-2010 2010-2011
Low Income Students
Free Meals
Reduced Meals
1100.0
1110.0
1120.0
1130.0
1140.0
1150.0
1160.0
1170.0
2006-2007 2007-2008 2008-2009 2009-2010 2010-2011
Enrollment (FTE)** Used for Calculating "Amount Per Pupil"
10/8/2010 3:13 PM Sumexpen.xls Page 17 of 19
USD# 309
Miscellaneous Information
Mill Rates by Fund
2008-2009 2009-2010 2010-2011
Actual Actual Budget
General 20.000 20.000 20.000
Supplemental General 21.290 21.102 21.803
Adult Education 0.000 0.000 0.000
Capital Outlay 1.997 1.999 1.990
Declining Enrollment 0.000 0.000 0.000
Cost of Living 0.000 0.000 0.000
Special Liability 0.000 0.000 0.000
School Retirement 0.000 0.000 0.000
Extraordinary Growth Facilities 0.000 0.000 0.000
Bond and Interest #1 5.196 5.314 5.138
Bond and Interest #2 0.000 0.000 0.000
No Fund Warrant 0.000 0.000 0.000
Special Assessment 0.000 0.000 0.000
Temporary Note 0.000 0.000 0.000
TOTAL USD 48.483 48.415 48.931
Historical Museum 0.000 0.000 0.000
Public Library Board 0.000 0.000 0.000
Public Library Brd & Emp Benf 0.000 0.000 0.000
Recreation Commission 0.000 0.000 0.000
Rec Comm Employee Bnfts 0.000 0.000 0.000
TOTAL OTHER 0.000 0.000 0.000
General 41%
Supplemental General 45%
Capital Outlay 4%
Bond and Interest #1 10%
2010-2011 Miscellaneous Information Mill Rates by Fund (Total USD)
General
Supplemental General
Adult Education
Capital Outlay
Special Liability
School Retirement
Declining Enrollment
Cost of Living
Bond and Interest #1
Bond and Interest #2
Extraordinary Growth Facilities
No Fund Warrant
Special Assessment
Temporary Note
0.000
10.000
20.000
30.000
40.000
50.000
60.000
2008-2009 2009-2010 2010-2011
Total USD Mill Rates
10/8/2010 3:13 PM Sumexpen.xls Page 18 of 19

USD# 309
Other Information
2008-2009 2009-2010 2010-2011
Actual Actual Budget
Assessed Valuation $62,946,375 $60,369,282 $62,623,938
Bonded Indebtedness $4,840,000 $4,510,000 $4,160,000
$0
$10,000,000
$20,000,000
$30,000,000
$40,000,000
$50,000,000
$60,000,000
$70,000,000
2008-2009 2009-2010 2010-2011
Assessed Valuation
$0
$1,000,000
$2,000,000
$3,000,000
$4,000,000
$5,000,000
$6,000,000
2008-2009 2009-2010 2010-2011
Bonded Indebtedness
10/8/2010 3:13 PM Sumexpen.xls Page 19 of 19