usability study of dominion voting systems imagecasttm
TRANSCRIPT
TO LEARN MORE ABOUT OUR TECHNOLOGY, PEOPLE AND SERVICES
VISIT DOMINIONVOTING.COM TODAY
Usability Study of Dominion Voting Systems ImageCastTM
Evolution version 4.1.1.1. and 4.6.1.1
Version: 1.0.0::36
April 16, 2012
Notice of Confidentiality andNondisclosure
This document contains information that is protected as an unpublished work by Dominion Voting Sys-tems (Dominion) under applicable copyright laws. The Recipient is to retain this document in confidenceand is not permitted to copy, reproduce, or to incorporate the contents hereof into any other media otherthan as permitted in a written agreement with Dominion. The below statutory copyright notice shallnot imply or be deemed publication of this product.
Proprietary Notice
The statements in this work, including, without limitation, directions, commentary, notes, and other ele-ments contained herein, and their selection, expression, format, ordering and other attributes, constituteproprietary and confidential technical information and are protected under Canadian, United States andInternational copyright and other intellectual property laws. Title and all rights thereto, including, butnot limited to all copyrights, trademarks and any trade secrets belong solely to Dominion. No distribu-tion of any contained statements by a licensee or use by a distributee, whether as a product or a service,including without limitation, the right to copy, duplicate, reproduce, adapt, publish, quote, translate orincorporate into other formats, media, or derivative works of any kind, is permitted.
This proposal is submitted in confidence and contains some or all of the following types of information:trade secrets, scientific information, financial information, technical information, commercial information,and labor relations information. Disclosure of any of the information contained in any of the documentsherein would result in undue loss to Dominion Voting Systems.
Please direct inquiries to:
Manager, AdministrationDominion Voting Systems1201 18th St., Suite 210Denver, Colorado, 80202
Telephone: 1-866-654-8683Facsimile: 1-416-762-8663
i
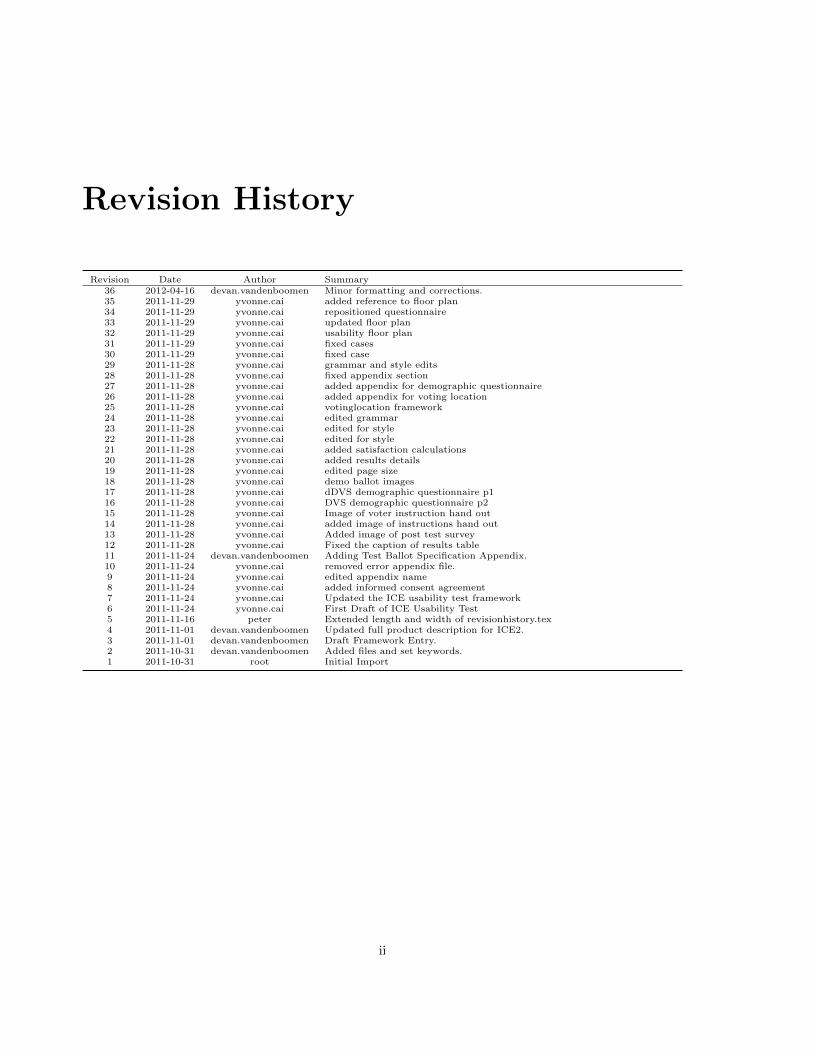
Revision History
Revision Date Author Summary36 2012-04-16 devan.vandenboomen Minor formatting and corrections.35 2011-11-29 yvonne.cai added reference to floor plan34 2011-11-29 yvonne.cai repositioned questionnaire33 2011-11-29 yvonne.cai updated floor plan32 2011-11-29 yvonne.cai usability floor plan31 2011-11-29 yvonne.cai fixed cases30 2011-11-29 yvonne.cai fixed case29 2011-11-28 yvonne.cai grammar and style edits28 2011-11-28 yvonne.cai fixed appendix section27 2011-11-28 yvonne.cai added appendix for demographic questionnaire26 2011-11-28 yvonne.cai added appendix for voting location25 2011-11-28 yvonne.cai votinglocation framework24 2011-11-28 yvonne.cai edited grammar23 2011-11-28 yvonne.cai edited for style22 2011-11-28 yvonne.cai edited for style21 2011-11-28 yvonne.cai added satisfaction calculations20 2011-11-28 yvonne.cai added results details19 2011-11-28 yvonne.cai edited page size18 2011-11-28 yvonne.cai demo ballot images17 2011-11-28 yvonne.cai dDVS demographic questionnaire p116 2011-11-28 yvonne.cai DVS demographic questionnaire p215 2011-11-28 yvonne.cai Image of voter instruction hand out14 2011-11-28 yvonne.cai added image of instructions hand out13 2011-11-28 yvonne.cai Added image of post test survey12 2011-11-28 yvonne.cai Fixed the caption of results table11 2011-11-24 devan.vandenboomen Adding Test Ballot Specification Appendix.10 2011-11-24 yvonne.cai removed error appendix file.9 2011-11-24 yvonne.cai edited appendix name8 2011-11-24 yvonne.cai added informed consent agreement7 2011-11-24 yvonne.cai Updated the ICE usability test framework6 2011-11-24 yvonne.cai First Draft of ICE Usability Test5 2011-11-16 peter Extended length and width of revisionhistory.tex4 2011-11-01 devan.vandenboomen Updated full product description for ICE2.3 2011-11-01 devan.vandenboomen Draft Framework Entry.2 2011-10-31 devan.vandenboomen Added files and set keywords.1 2011-10-31 root Initial Import
ii
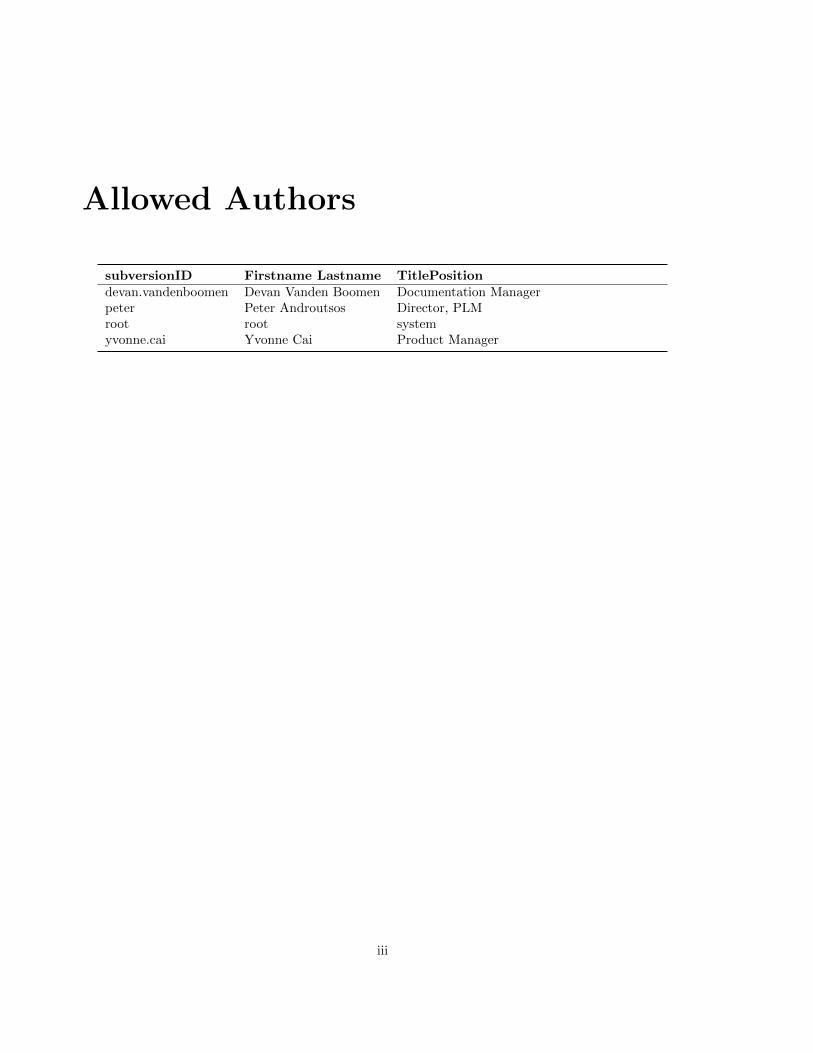
Allowed Authors
subversionID Firstname Lastname TitlePositiondevan.vandenboomen Devan Vanden Boomen Documentation Managerpeter Peter Androutsos Director, PLMroot root systemyvonne.cai Yvonne Cai Product Manager
iii
Contents
Notice of Confidentiality and Nondisclosure i
Revision History ii
Allowed Authors iii
List of Figures vi
List of Tables vii
1 Executive Summary 1
2 Introduction 32.1 Full Product Description . . . . . . . . . . . . . . . . . . . . . . . . . . . . . . . . . . . . . 32.2 Test Objectives . . . . . . . . . . . . . . . . . . . . . . . . . . . . . . . . . . . . . . . . . . 4
3 Method 53.1 Participants . . . . . . . . . . . . . . . . . . . . . . . . . . . . . . . . . . . . . . . . . . . . 53.2 Context of Use in the Test . . . . . . . . . . . . . . . . . . . . . . . . . . . . . . . . . . . . 6
3.2.1 Tasks . . . . . . . . . . . . . . . . . . . . . . . . . . . . . . . . . . . . . . . . . . . 63.2.2 Test Location . . . . . . . . . . . . . . . . . . . . . . . . . . . . . . . . . . . . . . . 73.2.3 Voting Environment . . . . . . . . . . . . . . . . . . . . . . . . . . . . . . . . . . . 8
3.2.3.1 Display Devices . . . . . . . . . . . . . . . . . . . . . . . . . . . . . . . . 83.2.3.2 Audio Devices . . . . . . . . . . . . . . . . . . . . . . . . . . . . . . . . . 83.2.3.3 Input Devices . . . . . . . . . . . . . . . . . . . . . . . . . . . . . . . . . 8
3.2.4 Test Administrator Tools . . . . . . . . . . . . . . . . . . . . . . . . . . . . . . . . 93.3 Experimental Design . . . . . . . . . . . . . . . . . . . . . . . . . . . . . . . . . . . . . . . 9
3.3.1 Procedure . . . . . . . . . . . . . . . . . . . . . . . . . . . . . . . . . . . . . . . . . 103.3.2 Participant General Instructions . . . . . . . . . . . . . . . . . . . . . . . . . . . . 103.3.3 Participant Task Instructions . . . . . . . . . . . . . . . . . . . . . . . . . . . . . . 10
3.4 Usability Metrics . . . . . . . . . . . . . . . . . . . . . . . . . . . . . . . . . . . . . . . . . 103.4.1 Effectiveness . . . . . . . . . . . . . . . . . . . . . . . . . . . . . . . . . . . . . . . 11
3.4.1.1 Completion Rate . . . . . . . . . . . . . . . . . . . . . . . . . . . . . . . . 113.4.1.2 Errors . . . . . . . . . . . . . . . . . . . . . . . . . . . . . . . . . . . . . . 113.4.1.3 Assists . . . . . . . . . . . . . . . . . . . . . . . . . . . . . . . . . . . . . 11
3.4.2 Efficiency . . . . . . . . . . . . . . . . . . . . . . . . . . . . . . . . . . . . . . . . . 113.4.2.1 Time on Task . . . . . . . . . . . . . . . . . . . . . . . . . . . . . . . . . 11
3.4.3 Satisfaction . . . . . . . . . . . . . . . . . . . . . . . . . . . . . . . . . . . . . . . . 123.4.3.1 Confidence Rating . . . . . . . . . . . . . . . . . . . . . . . . . . . . . . . 123.4.3.2 Satisfaction Rating . . . . . . . . . . . . . . . . . . . . . . . . . . . . . . 12
iv
CONTENTS CONTENTS
4 Results 134.1 Data Analysis . . . . . . . . . . . . . . . . . . . . . . . . . . . . . . . . . . . . . . . . . . . 134.2 Presentation of Results . . . . . . . . . . . . . . . . . . . . . . . . . . . . . . . . . . . . . . 13
4.2.1 Performance Results . . . . . . . . . . . . . . . . . . . . . . . . . . . . . . . . . . . 144.2.2 Satisfaction Results . . . . . . . . . . . . . . . . . . . . . . . . . . . . . . . . . . . 14
5 Conclusion 155.1 Ongoing Usability Testing . . . . . . . . . . . . . . . . . . . . . . . . . . . . . . . . . . . . 15
Appendices 16
A Participant Demographics 17
B Informed Consent Agreement 18
C Instructions for Participants 19
D Demonstration Ballot for Voters 21
E Results 24
F Demographic Questionnaire 27
G Post-Test Satisfaction Questionnaire 30
H Voting Location 32
v
List of Figures
E.1 Results from scenario 1 (Using the ICE to review and cast a manually marked ballot) . . 25E.2 Results from scenario 2 (Accessible ballot marking with the ICE accessible voter interfaces) 26
G.1 Post Test Satisfaction Questionnaire . . . . . . . . . . . . . . . . . . . . . . . . . . . . . . 31
H.1 ICE Usability Testing Location Layout . . . . . . . . . . . . . . . . . . . . . . . . . . . . . 32
vi
List of Tables
1.1 Usability testing dates, locations, and ICE firmware version tested. . . . . . . . . . . . . 1
3.1 Participants For Each Targeted User Group. Note that user group characteristics intersect. 53.2 Participant Gender . . . . . . . . . . . . . . . . . . . . . . . . . . . . . . . . . . . . . . . . 53.3 Participant Age Group . . . . . . . . . . . . . . . . . . . . . . . . . . . . . . . . . . . . . . 63.4 Participant Voting Experience . . . . . . . . . . . . . . . . . . . . . . . . . . . . . . . . . . 6
A.1 Summary of All Participant Demographics . . . . . . . . . . . . . . . . . . . . . . . . . . . 17
vii
Chapter 1
Executive Summary
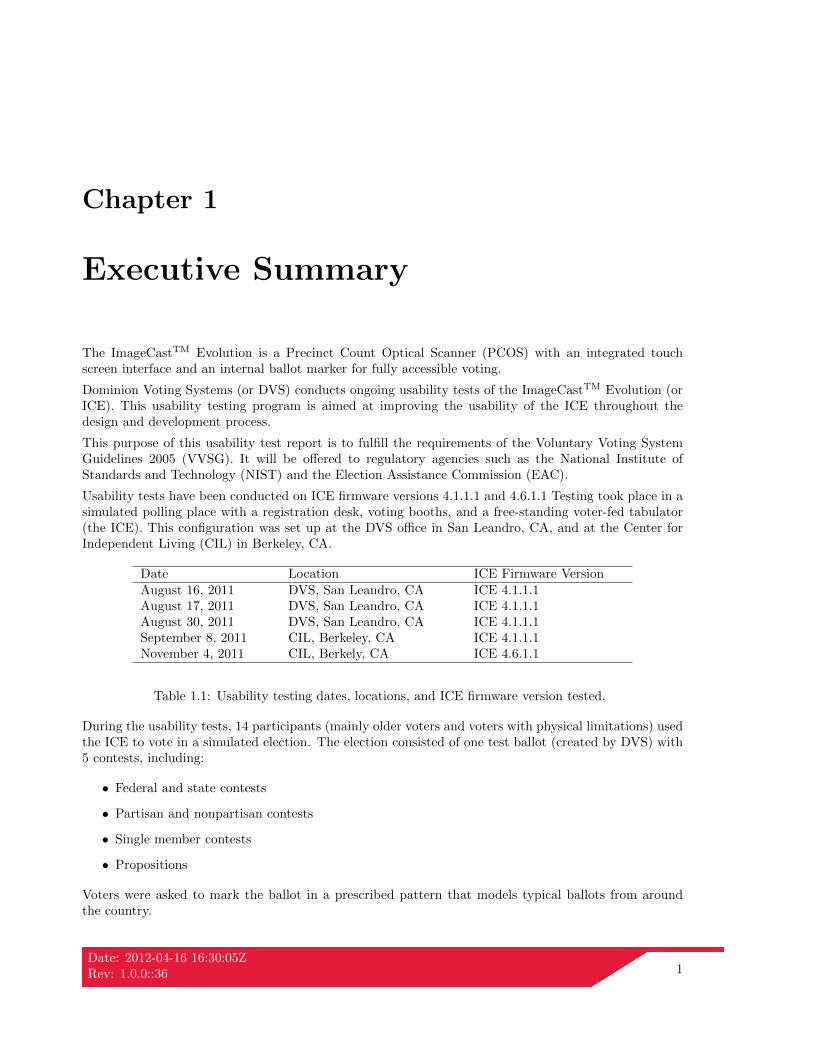
The ImageCastTM Evolution is a Precinct Count Optical Scanner (PCOS) with an integrated touchscreen interface and an internal ballot marker for fully accessible voting.
Dominion Voting Systems (or DVS) conducts ongoing usability tests of the ImageCastTM Evolution (orICE). This usability testing program is aimed at improving the usability of the ICE throughout thedesign and development process.
This purpose of this usability test report is to fulfill the requirements of the Voluntary Voting SystemGuidelines 2005 (VVSG). It will be offered to regulatory agencies such as the National Institute ofStandards and Technology (NIST) and the Election Assistance Commission (EAC).
Usability tests have been conducted on ICE firmware versions 4.1.1.1 and 4.6.1.1 Testing took place in asimulated polling place with a registration desk, voting booths, and a free-standing voter-fed tabulator(the ICE). This configuration was set up at the DVS office in San Leandro, CA, and at the Center forIndependent Living (CIL) in Berkeley, CA.
Date Location ICE Firmware VersionAugust 16, 2011 DVS, San Leandro, CA ICE 4.1.1.1August 17, 2011 DVS, San Leandro, CA ICE 4.1.1.1August 30, 2011 DVS, San Leandro, CA ICE 4.1.1.1September 8, 2011 CIL, Berkeley, CA ICE 4.1.1.1November 4, 2011 CIL, Berkely, CA ICE 4.6.1.1
Table 1.1: Usability testing dates, locations, and ICE firmware version tested.
During the usability tests, 14 participants (mainly older voters and voters with physical limitations) usedthe ICE to vote in a simulated election. The election consisted of one test ballot (created by DVS) with5 contests, including:
• Federal and state contests
• Partisan and nonpartisan contests
• Single member contests
• Propositions
Voters were asked to mark the ballot in a prescribed pattern that models typical ballots from aroundthe country.
Date: 2012-04-16 16:30:05ZRev: 1.0.0::36 1
Participants were given 2 voting scenarios that were designed to test the various features and userinterfaces of the ICE. Participants were to vote in at least 1 of the given scenarios.
The first scenario will be referred to as manual voting (or MV) and requires that the participant be ableto make their selections on a paper ballot using a marking pen. The marked ballot is inserted into theICE for participants to review their ballot selections and cast their ballot using the ICE touch screeninterface. This scenario is designed to evaluate the usability of the ICE touch screen interface and ballotreview features. This scenario includes 13 tasks that simulate typical voting procedures using the ICE.
The second scenario will be referred to as accessible voting (or AV) and is designed to evaluate theusability of the ICE accessible voting interfaces, specifically the ballot marking feature. Voters use anelectronic input device to navigate, mark, and cast their ballot. Though 3 different accessible inputinterfaces are offered, all participants chose to use the Audio Tactile Interface (or ATI).
This scenario includes 8 to 10 tasks depending on their preferred interface (audio only, visual only, oraudio and visual).
During the usability testing, participants worked alone and were not provided assistance or help by thetest administrators, unless requested. While participants voted, test administrators noted accessibleinterface(s) used, assists requested, verbal comments, and anything that may affect the data beingcollected.
The usability test administrators collected and analyzed the following types of data to determine partic-ipant effectiveness, efficiency, and satisfaction using the ICE:
• Number of ballots successfully cast.
• Number of contests voted as per instructions.
• Count of assists provided.
• Time to complete the voting session.
• Voters’ confidence that they had used the system correctly.
• Voter satisfaction with the system.
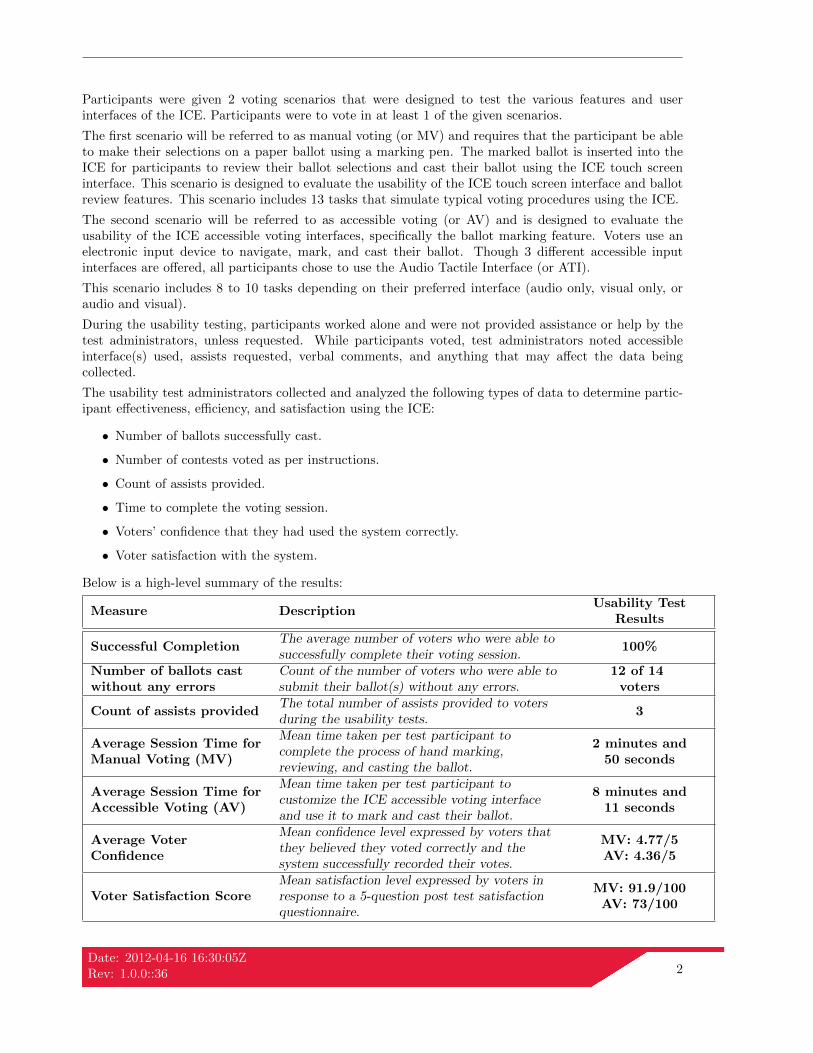
Below is a high-level summary of the results:
Measure DescriptionUsability Test
Results
Successful CompletionThe average number of voters who were able tosuccessfully complete their voting session.
100%
Number of ballots castwithout any errors
Count of the number of voters who were able tosubmit their ballot(s) without any errors.
12 of 14voters
Count of assists providedThe total number of assists provided to votersduring the usability tests.
3
Average Session Time forManual Voting (MV)
Mean time taken per test participant tocomplete the process of hand marking,reviewing, and casting the ballot.
2 minutes and50 seconds
Average Session Time forAccessible Voting (AV)
Mean time taken per test participant tocustomize the ICE accessible voting interfaceand use it to mark and cast their ballot.
8 minutes and11 seconds
Average VoterConfidence
Mean confidence level expressed by voters thatthey believed they voted correctly and thesystem successfully recorded their votes.
MV: 4.77/5AV: 4.36/5
Voter Satisfaction ScoreMean satisfaction level expressed by voters inresponse to a 5-question post test satisfactionquestionnaire.
MV: 91.9/100AV: 73/100
Date: 2012-04-16 16:30:05ZRev: 1.0.0::36 2
Chapter 2
Introduction
2.1 Full Product Description
The ImageCastTM Evolution (or ICE) is a precinct-level voting system that uses scan technology tovalidate and tabulate marked paper ballots. The ICE unit features an 18.5” touch screen display thatallows voters to review and cast their marked paper ballot through a customizable visual interface. Inaddition, the ICE features several accessible voting interfaces that allow voters with various disabilitiesto effectively mark, review and cast a paper ballot in a private and independent manner. When a votercasts their ballot, the ICE stores a complete image of the ballot and selections, and the paper ballot issecurely deposited into a sealed ballot box located under the unit. When polls close, the ICE producesa results report with cumulative totals of all votes cast. The ICE is evaluated as part of Dominion’songoing usability testing program. So far, ICE firmware versions 4.1.1.1 and 4.6.1.1 have been evaluated.ICE hardware remains unchanged.
ICE firmware 4.1.1.1 was the first version evaluated during usability testing. Based on voter feedback,the following modifications were made to the ICE accessible voting interfaces for firmware version 4.6.1.1.
• Static screens displayed during the accessible voting instructions were modified to create a moreuniform and consistent appearance.
• Static audio instructions were added to notify accessible voters that their ballot was being printed.
ICE firmware version 4.6.2 is being provided to the Voting System Test Laboratory (VSTL). This is anupgrade from version 4.6.1.1. Features added include:
• An audio interface for accessible ballot review. Previously, voters only had the option to reviewtheir ballot through the ICE visual interface.
• A detailed and informative message displayed when the ICE detects an issue with a scanned ballot.Previous versions gave a standard “Ballot Rejected” message without describing the issue.
The ICE is is typically used in federal, state and local elections and is set up in designated voting locations.The usability testing attempts to simulate these environmental conditions and users’ real-world contextof use.
Dominion’s ongoing usability testing program evaluates the ICE user interfaces. This includes:
• The ICE touch screen interface for visual ballot review and ballot casting.
Date: 2012-04-16 16:30:05ZRev: 1.0.0::36 3
• ICE-accessible ballot marking interfaces (both audio and visual).
• Assistive input devices for accessible ballot navigation and voting.
Accessible voting interfaces are the primary focus of ICE usability testing. This is an area that issusceptible to usability issues. Dominion Voting strives to enhance the accessibility and usability of itsICE system for voters who face barriers to equal participation.
Standard scanning and ballot review features were included in the evaluation because they are mostfrequently used.
2.2 Test Objectives
The usability test objectives are:
• To assess the effectiveness of the ICE by measuring the abilities of various user groups to successfullycomplete and cast a ballot.
• To assess the efficiency of the ICE by measuring the average time to complete a voting session.
• To assess the user satisfaction of the ICE system by measuring average voter confidence and easeof use.
• To assess the usability of the ICE accessible voting interfaces for different disability groups.
• To elicit user feedback on how the accessible voting interfaces can be further developed and/orimproved.
Date: 2012-04-16 16:30:05ZRev: 1.0.0::36 4
Chapter 3
Method
3.1 Participants
A total of 14 voters have participated in the ICE usability testing program so far. Each round of usabilitytesting targets a specific type of user group.
The first round of usability testing focused on users who were over 60 years old and had at least 10 yearsof voting experience. These users were recruited through asking friends and family if they knew someoneover 60 years old in the San Leandro area who would be available to participate.
The second round of usability testing focused on people with physical limitations. Dominion Votingteamed up with the Center for Independent Living (CIL) in Berkeley, California to recruit participantswith mobility impairments, visual impairments, and hearing impairments.
All participants received a $10 gift card (for StarbucksTM or Peet’sTM) as compensation for their time.
Participants were not Dominion Voting employees or family members of employees. All participants wereover the age of 18, eligible to vote in the U.S., and fluent in English.
Note: In the State of California, there are restrictions to the collection of data related to race or ethnicityand disability. There appeared to be a range of ethnically diverse people in the participant sample,representative of the larger population. Many participants volunteered information about limitationsthey have that may restrict their access to voting privately and independently.
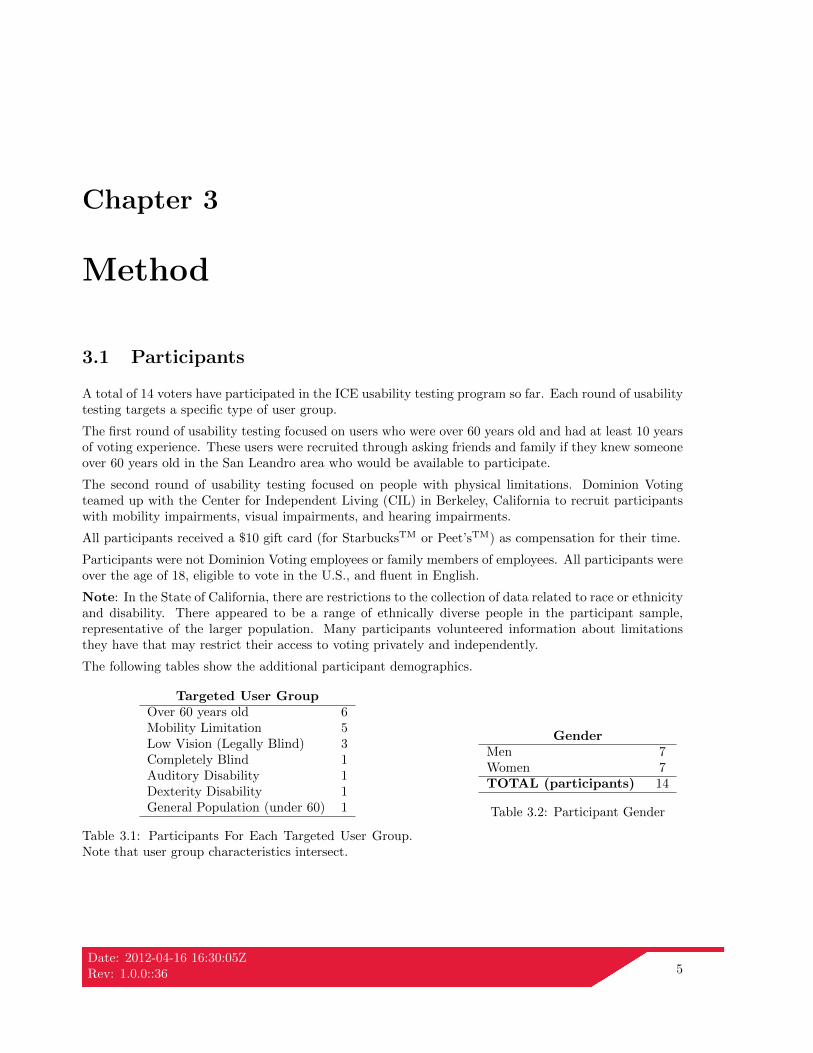
The following tables show the additional participant demographics.
Targeted User GroupOver 60 years old 6Mobility Limitation 5Low Vision (Legally Blind) 3Completely Blind 1Auditory Disability 1Dexterity Disability 1General Population (under 60) 1
Table 3.1: Participants For Each Targeted User Group.Note that user group characteristics intersect.
GenderMen 7Women 7TOTAL (participants) 14
Table 3.2: Participant Gender
Date: 2012-04-16 16:30:05ZRev: 1.0.0::36 5
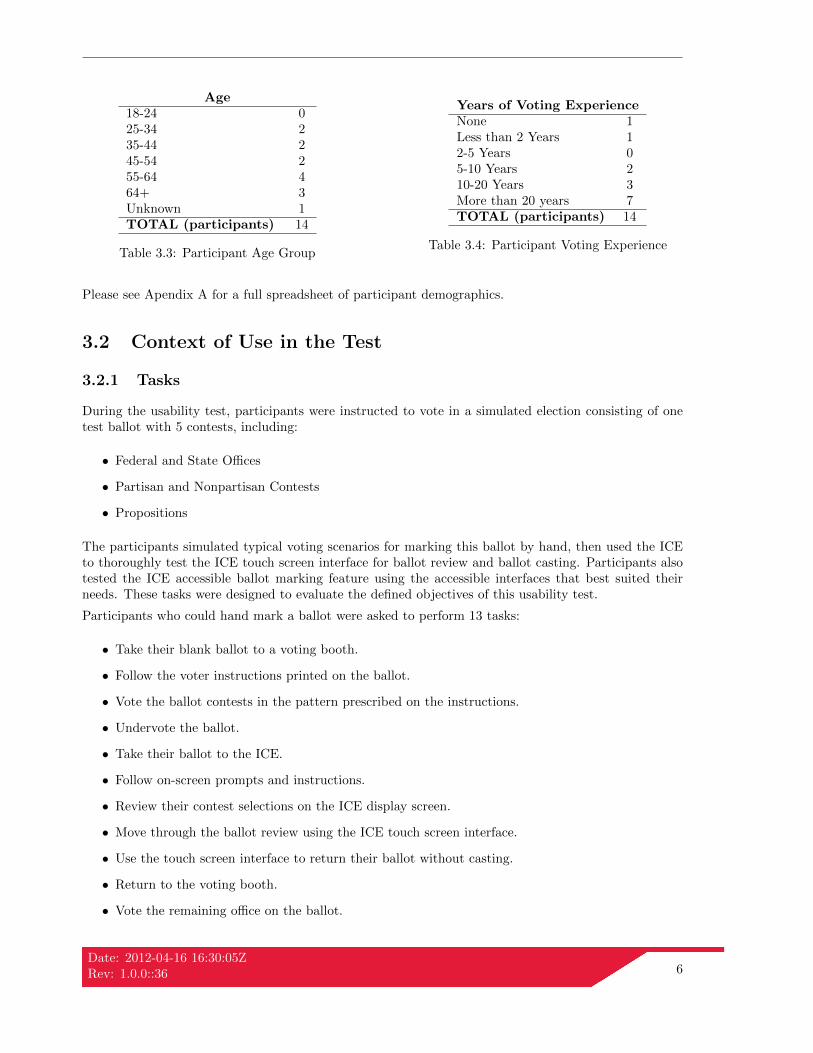
Age18-24 025-34 235-44 245-54 255-64 464+ 3Unknown 1TOTAL (participants) 14
Table 3.3: Participant Age Group
Years of Voting ExperienceNone 1Less than 2 Years 12-5 Years 05-10 Years 210-20 Years 3More than 20 years 7TOTAL (participants) 14
Table 3.4: Participant Voting Experience
Please see Apendix A for a full spreadsheet of participant demographics.
3.2 Context of Use in the Test
3.2.1 Tasks
During the usability test, participants were instructed to vote in a simulated election consisting of onetest ballot with 5 contests, including:
• Federal and State Offices
• Partisan and Nonpartisan Contests
• Propositions
The participants simulated typical voting scenarios for marking this ballot by hand, then used the ICEto thoroughly test the ICE touch screen interface for ballot review and ballot casting. Participants alsotested the ICE accessible ballot marking feature using the accessible interfaces that best suited theirneeds. These tasks were designed to evaluate the defined objectives of this usability test.
Participants who could hand mark a ballot were asked to perform 13 tasks:
• Take their blank ballot to a voting booth.
• Follow the voter instructions printed on the ballot.
• Vote the ballot contests in the pattern prescribed on the instructions.
• Undervote the ballot.
• Take their ballot to the ICE.
• Follow on-screen prompts and instructions.
• Review their contest selections on the ICE display screen.
• Move through the ballot review using the ICE touch screen interface.
• Use the touch screen interface to return their ballot without casting.
• Return to the voting booth.
• Vote the remaining office on the ballot.
Date: 2012-04-16 16:30:05ZRev: 1.0.0::36 6
• Bring their ballot to the ICE again to review their modified ballot on the ICE display screen.
• Cast their ballot using the ICE touch screen interface.
Participants who tested the ICE accessible ballot marking feature were first given audio instructions thatdescribed how to use the equipment.
For the purpose of this usability testing session, the test administrator acted as a poll worker and handedan ATI, with connected headphones, to the voter. Once the voter was comfortably seated in front of theICE and had the headphones on, the test administrator activated an accessible voting session using theICE touch screen interface, as a poll worker would normally do.
Voters are instructed to increase the volume immediately by using the volume control button on theATI. Note: this is necessary because the ICE is set to the VVSG initial volume requirement of 40 - 50dB SPL. This volume tends to be too low for many people.
Accessible voters were asked to perform the following tasks during their accessible voting session:
• Select the input interface they are using for navigation, as instructed on the ICE display screen.Note: All voters chose to use the ATI for their voting session. The ICE audio and visual interfacesprovide prompts to voters informing them of which buttons to press throughout the instructionsand ballot marking session.
• Customize the AV session by turning the display screen off or leaving it on according to their needs.
• If voters leave the display screen on, they are given the option to turn the audio track off or leaveit on.
• Press the down arrow on the ATI to continue through the instructions.
• Voters who left the display screen on were also given the option to customize their visual interfaceby setting the zoom and/or contrast.
• Press the down arrow on the ATI to begin the voting session.
• Continue using the ATI to navigate through contests and names within a contest.
• Use the ATI to mark their selections in the pattern prescribed on the instructions.
• Press the X shaped select button on the ATI to cast the ballot.
In both scenarios, participants were instructed to perform these tasks without assistance. The votingsession was considered successful if the participant was able to independently cast their ballot using thean ICE interface.
Data was collected for these tasks, including successful completions, time to complete voting, number oferrors, and number and type of assists provided.
3.2.2 Test Location
The ICE is intended to be used at precinct level polling locations across the U.S., including schools,libraries, churches and other public facilities large enough to house multiple voting stations. ICE usabilitytesting has taken place at the DVS office in San Leandro, California and also in an office at the Centerfor Independent Living in Berkeley, California. Usability tests are always held in wheelchair accessiblelocations.
Date: 2012-04-16 16:30:05ZRev: 1.0.0::36 7
In order to simulate the polling place environment, testing locations are set up with a registration desk,two voting booths, and one ICE unit that sits above a free standing ballot box. The simulated pollingplace is arranged in a way that maximizes privacy and accessibility.
Please see Appendix H for a diagram of the room layout.
Standard usability testing procedures for obtaining consent forms and informing participants that theiractions will be recorded is an imperative part of the test plan. These activities took place at theregistration desk. Voters who could not complete surveys on their own received help from their personalassistants or from the testing administrators.
3.2.3 Voting Environment
During an actual election, voters are expected to use the voting system provided at the polling location.Voters may have experience with a wide-range of systems or may only have experience with one type ofsystem. During the usability test, all participants were instructed to use the ICE just as if this systemwas implemented at their local polling location.
3.2.3.1 Display Devices
The ICE has an integrated 18.5 inch full color touch screen display. The touch screen interface is usedfor poll worker menu navigation and voter ballot review. During an accessible voting session, the displayscreen acts as a visual interface that displays instructions and a digital image of the ballot. Voters cancustomize the zoom and contrast of their ballot display, or simply turn it off using an accessible inputdevice (such as the ATI).
All text is displayed in sans serif font at a default size of 3.00mm or higher.
8.5” x 14” paper ballots were provided for hand marking. DVS provided optional Fresnel sheet magnifiersto assist those with perceptual disabilities. A copy of this ballot is included in Appendix D.
3.2.3.2 Audio Devices
The ATI provides its audio signal through an industry standard connector for private listening using a3.5mm stereo headphone jack to allow voters to use their own audio assistive devices. Voters are givenheadphones with new sanitary coverings that are disposed of after each use.
The initial (default) volume for each voter is set between 40 - 50 dB SPL for each device as per VVSGrequirements. This volume level was typically inaudible for most voters and needed to be increased.
Voters can hear all the voting instructions, navigational prompts, and all ballot content through audioheadphones.
Voters use an input device, such as the ATI, to control the audio. Voters can adjust the volume andspeed of the synthesized audio track. Voters can also pause or replay instructions.
3.2.3.3 Input Devices
During an accessible voting session, voters do not use the ICE touch screen interface. Though theballot and accessible voting instructions can be shown on the ICE display screen, voters use one of threeaccessible input devices to navigate their ballot and make their selections:
• The Audio Tactile Interface (ATI)
• Paddle button Interface
Date: 2012-04-16 16:30:05ZRev: 1.0.0::36 8
• Gooseneck Sip and Puff device
The audio and visual instructions reflect the device selected.
All the participants who tested the ballot marking interface chose to use the ATI.
3.2.4 Test Administrator Tools
During the usability test, various tools were used to facilitate the test sessions, including:
• Pen and paper
• Stopwatch
• Demographic Questionnaire (See Appendix F)
• Informed Consent Form (See Appendix B)
• Instructions for Participants (See Appendix C)
• Post-test Questionnaire (See Appendix G)
Participants’ votes were recorded by the ICE system, as it would be in a real election. Test facilitatorsused a stopwatch to time voter sessions. Pen and paper was also used to record assists and verbalcomments, as well as other relevant data during the voting sessions.
3.3 Experimental Design
During the usability test, participants interacted with only one voting system, the ICE. Each participantvoted the same demonstration ballot in at least one testing scenario.
The ICE was evaluated for effectiveness, efficiency and satisfaction. To evaluate these factors, theusability team collected data on:
• Number of ballots successfully cast/completed
• Percent of tasks completed without any errors
• Count of assists provided
• Time to complete the voting session
• Voters’ confidence that they had used the system correctly
• Voters’ satisfaction with the system
Additional information about the various measures and associated metrics can be found in Section 3.4Usability Metrics.
Date: 2012-04-16 16:30:05ZRev: 1.0.0::36 9
3.3.1 Procedure
The usability test administrators introduced themselves to participants upon arrival. Participants wereinformed that the usability of the ICE voting system was being tested. The goal was to make privateand independent voting accessible to everyone, including voters such as themselves, and that usabilityfeedback was much appreciated. Participants were reminded that this was a test of their abilities andthat their identities would remain confidential.
Participants were then asked to complete a demographic questionnaire (Appendix F). The ICE usabilitytesting program targets specific voter groups for each testing session. However, no eligible participant isturned away.
Following the questionnaire, participants were asked to review and sign the Informed Consent Agreement(Appendix B), which described their rights during the study. Participants were then given the followinginstructions:
We can only work with one person at a time. Today’s demo is in English only. Please followall ballot instructions and attempt to vote unassisted. It is important to completely fill inthe oval when marking your paper ballot. This is a test of the tabulator and not of you oryour ability to follow instructions. You will be observed and timed. If necessary, you mayrequest help at any time by raising your hand or by asking for assistance.
During the usability test, test administrators observed users’ interactions with the ICE interfaces andtimed each test session with a stop watch. Once the user finished the test, he/she was asked to completea Post-Test Satisfaction Questionnaire (Appendix G). At the conclusion of the test, participants werethanked for their time and given a $10 gift card for StarbucksTM or PeetsTM. Participants were welcometo stay and try out other features of the ICE when all the testing was complete.
Three DVS staff members shared the responsibilities for administering the usability test, collectingthe demographic survey, and logging the data. One administrator was responsible for interviewing eachparticipant after they completed their voting session. Every individual was thanked for their participationand feedback.
3.3.2 Participant General Instructions
During the usability sessions, the participants were instructed that they should try to complete the taskswithout assistance. However, they could still ask for assistance if they felt it was necessary.
3.3.3 Participant Task Instructions
Participants were also provided with verbal and written instructions on how to vote in the mock election.These voter instructions were provided to users on a piece of paper (Appendix C). Participants testingout the accessible voting interface were also given a quick audio guide for how the ICE ballot markingfeature works.
3.4 Usability Metrics
The usability test collected various metrics for effectiveness, efficiency and satisfaction.
Date: 2012-04-16 16:30:05ZRev: 1.0.0::36 10
3.4.1 Effectiveness
To measure the effectiveness of the ICE, the testing team measured voters’ completion rate, errorsencountered and assists provided.
3.4.1.1 Completion Rate
Measure: Ballots successfully completed and cast.
Description: Percentage of test participants who were able to complete the process of voting and casttheir ballots so that their ballot choices were recorded by the system. Failure to cast a ballot might involveproblems such as a voter simply “giving up” during the voting session because of an inability to operatethe system, or a mistaken belief that the casting has been successful.
3.4.1.2 Errors
To measure voters’ error rate, the testing team calculated the percentage of voters who were able toaccurately mark and cast their ballot as per instructions.
Measure: Ballots completed and cast without any errors.
Description: Percentage of ballots that were completed without any errors. An error might involve avoter selecting a different candidate than instructed.
3.4.1.3 Assists
To measure voters’ abilities to successfully use the ICE without assistance, the testing team recorded thecount and type of assistance provided.
Measure: Count of assists provided.
Description: Count of the number of times assistance was given to participants. Each assist was alsocategorized into one of three categories:
• Technical assistance to help voters recover from a system error or bug.
• Instructional assistance to provide clarification on the test or task instructions.
• Task assistance to help voters a complete a task. Tasks that were completed with the assistance ofthe test facilitator were recorded as a failure.
3.4.2 Efficiency
To measure the efficiency of the ICE, the testing team measured voters’ average time to complete thevoting session in each testing scenario.
3.4.2.1 Time on Task
To measure voters’ efficiency with the ICE, the testing team analyzed the time it took participants tocomplete their testing session.
Measure: Average voting session time.
Description: Mean time taken per test participant to complete the process of activating, filing outand casting the ballot, or for ICE accessible ballot marking, the mean time taken per test participant togo through the accessible voting instructions, start their voting session, mark their ballot, and cast theirballot.
Date: 2012-04-16 16:30:05ZRev: 1.0.0::36 11
3.4.3 Satisfaction
To measure voters’ satisfaction with the ICETM, the testing team measured voters’ confidence levels andusability perceptions through a post test satisfaction questionnaire.
3.4.3.1 Confidence Rating
Measure: Average voter confidence level.
Description: mean confidence level expressed by voters when asked if they felt confident using the votingmachine. Rating is calculated using numbers assigned on the Likert Scale.
3.4.3.2 Satisfaction Rating
Measure: Average voter satisfaction.
Description: Mean satisfaction level expressed by voters in response to a 5 voter satisfaction ratingsin the post-test satisfaction questionnaire.
The satisfaction score was calculated based on the System Usability Scale (SUS). Voters expressed theirreactions to questions about their ICE voting experience on a Likert Scale.
The scale positions are as follows:
1 = Strongly Disagree
2 = Disagree
3 = Neutral
4 = Agree
5 = Strongly Agree
Responses to the following statements were included in the satisfaction rating.
3B (Negative): I think that I would need support to be able to use this voting machine.
3C (Positive): I think that most people would be able to use this voting machine without problems.
3D (Negative): I found that voting on this machine was unnecessarily difficult.
3E (Positive): I thought this voting machine was easy to use.
3F (Negative): I felt voting on this machine was very awkward.
Each item was given a score contribution that ranged from 0-4. For ‘positive’ questions, the scorecontribution is the scale position minus 1. For ‘negative’ questions, the score contribution is 5 minus thescale position.
Satisfaction ratings were calculated for each scenario.
The mean score contribution for each item was calculated and the sum of the score contributions wasmultiplied by 5 to obtain the overall satisfaction score (a range from 0 to 100).
Date: 2012-04-16 16:30:05ZRev: 1.0.0::36 12
Chapter 4
Results
4.1 Data Analysis
Demographic and satisfaction data was captured by paper and pencil. Voters who could not inde-pendently complete the paper questionnaires received help from their personal assistant or from a testadministrator. Votes were automatically recorded by the voting system and the paper ballot was kept asa reference for data loggers. Time data was captured with a stopwatch and then entered into a spread-sheet. Open-ended comments were noted by hand by the test facilitators during and after the votingsession. If assists were provided to voters by test administrators, the type of assist and details wererecoded by the test administrator. To analyze the data, each voting session was scored for completion,ballot marking accuracy, number and type of assists required during the voting session, and time tocomplete all the tasks. Each contest that was not voted as instructed was counted as an error (this caninclude voting for a different candidate, skipping the contest, or over voting the contest).
In addition, the test administrators analyzed voter’s satisfaction and confidence using the post-testsatisfaction questionnaire.
All data was scored manually by all the test administrators.
4.2 Presentation of Results
This section details the performance results for effectiveness (completion rate, errors, assists), efficiency(time to vote) and satisfaction (satisfaction and confidence rating). Specifically, this section includes:
• Number of ballots successfully submitted/completed
• Number of ballots completed without any errors
• Count of assists provided
• Time to complete the voting session for each scenario
• Voters’ confidence that they had used the system correctly
• Voters’ satisfaction with the system
Date: 2012-04-16 16:30:05ZRev: 1.0.0::36 13
4.2.1 Performance Results
100% of the ballots were cast successfully. Of the 14 participants, 12 were able to accurately select all thecandidates as instructed. No participant made more than 2 (out of a possible 5) ballot marking errorson a given ballot. A total of 3 assists were provided during the usability testing. All of the assists wereinstructional.
The average manual voting session time was 170 seconds (or 2 minutes and 50 seconds) The averageaccessible voting session time was 491 seconds (or 8 minutes and 11 seconds)
More detailed results can be found in Appendix E.
4.2.2 Satisfaction Results
Following the completion of the usability tasks, participants completed a Post Test Satisfaction question-naire. 5 questions in this questionnaire were related to ease of use of the ICE. Based on voters’ responsesto these questions, a satisfaction rating, ranging from 0-100, was calculated. The average satisfactionrating for manual voting was 92 and the average satisfaction rating for the accessible voting interfacewas 73.
In addition, voters gave the system an overall confidence rating of 4.56 out of 5.
More detailed results can be found in Appendix E.
Date: 2012-04-16 16:30:05ZRev: 1.0.0::36 14
Chapter 5
Conclusion
Dominion strives to continuously enhance the usability and accessibility of the ImageCastTM Evolution. All the usability testing conducted so far has been fundamental in making modifications that haveimproved the user interfaces. The changes between versions, as outlined in the introduction of thisusability report are examples of improvements that have been incorporated in the ICE firmware versionbeing submitted to the VSTL.
5.1 Ongoing Usability Testing
As part of the ongoing ICE usability testing program, Dominion Voting Systems plans to conduct moreusability studies on its continuously improving ICE firmware. Future usability tests will continue toevaluate the usability of the ICE accessible voting interfaces for:
• Voters with mobility limitations
• Voters with partial vision
• Voters who are completely blind
• Voters with cognitive impairments
• Voters with dexterity disabilities
• Voters who need alternative languages
In addition, usability tests will continue to evaluate the efficiency of standard ballot review and ballotcasting using the ICE touch screen interface. User groups from various age groups and from the generalpopulation will be recruited.
Lastly, Dominion Voting Systems will be working with poll workers to evaluate the usability of the ICEadministrator interfaces.
Date: 2012-04-16 16:30:05ZRev: 1.0.0::36 15

Appendices
Date: 2012-04-16 16:30:05ZRev: 1.0.0::36 16

Appendix A
Participant Demographics
Voter Sex AgeYears ofVoting
Experience
Types of Voting MachinesUsed Before
PhysicalLimitations
(if any)
1 F 77 Over 20Punch Card, Touch Screen DRE,Optical Scan
Mobility
2 M 78 Over 20Punch Card, Touch Screen DRE,Optical Scan
Low Vision
3 M 67 Over 20Mechanical lever, Punch Card,Touch Screen DRE, Optical Scan
4 F 43 10 - 20 Touch Screen DRE, Optical Scan Mobility
5 M 60 Over 20 Punch Card, Optical Scan
6 F 61 Over 20 Punch Card
7 M 48 10 - 20 Touch Screen DRE, Optical Scan
8 F 32 5 - 10 Optical Scan Auditory, Mobility
9 M N/A Over 20Punch Card, Touch Screen DRE,Optical Scan
Mobility
10 M 48 10 - 20 Punch Card, Optical Scan Low Vision
11 M 60 Over 20Mechanical lever, Punch Card,Optical Scan
Low Vision
12 F 34 None None Completely Blind
13 F 56 Under 2 None Mobility
14 F 41 5 - 10 Optical Scan Auditory
Table A.1: Summary of All Participant Demographics
Date: 2012-04-16 16:30:05ZRev: 1.0.0::36 17
Appendix B
Informed Consent Agreement
Dominion Voting Systems regularly conducts community outreach demonstrations to determine how easyit is for voters to use its voting systems. By testing with a broad spectrum of voters, overall systemusability can be measured and voter satisfaction gauged. Your participation in this testing is appreciated!
You will receive written instructions on how you, as a voter will ”want to vote”. In addition to col-lecting your votes, there may be a camera focused on the system and your hands, but your face will notbe photographed. After you cast your ballot, you will be asked for your opinion about the voting systemand your voting experience. You will also be asked for demographic data to include age, gender, educa-tion level, and other experiences related to voting. This process should take you no more than 30 minutes.
CONFIDENTIALITY: All the data collected will be anonymous. The data will be used by Do-minion Voting Systems to evaluate the usability of the ImageCast tabulators. The data will not beassociated with any particular individual. All of the time and error data, demographic data, and voterexperience and satisfaction data will be anonymous. All of the data will only be identified and linkedtogether by a number, and will not be linked back to an individual in any way.
You are free to withdraw from the study at any time during the experiment. In total, we expect tohave approximately 20 subjects complete this demonstration.
There are no risks involved in participating in this study, nor are there any immediate benefits. The longterm benefits of this study should be improved voting systems.
CONTACT INFORMATION: For questions regarding this study, please contact:
Larry Korb (510) 373-0818 x9405 mailto:[email protected]
”I have read the above description of this demonstration. I have also spoken to the test facilitator whoanswered any questions I had about this project. I acknowledge that I have received a personal copy ofthis form. I agree to participate in this demonstration and I understand that I may withdraw at any time.”
Signature: . Date: .
Date: 2012-04-16 16:30:05ZRev: 1.0.0::36 18
Appendix C
Instructions for Participants
Date: 2012-04-16 16:30:05ZRev: 1.0.0::36 19
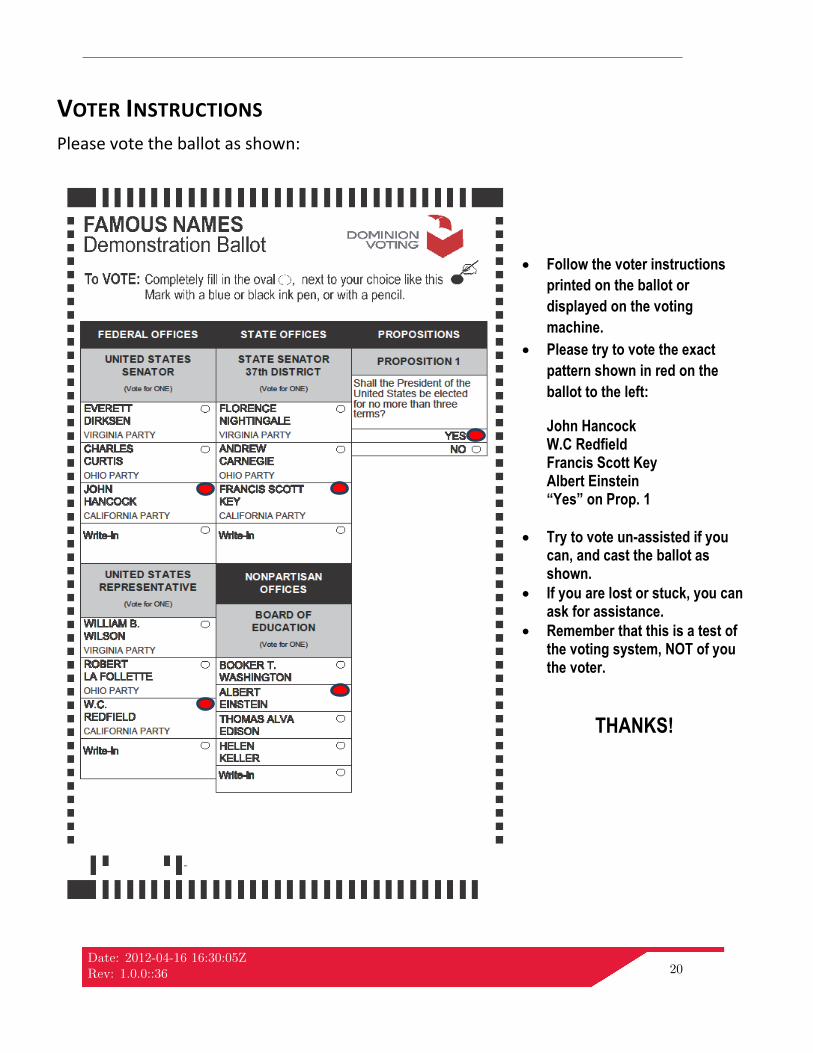
VOTER INSTRUCTIONS Please vote the ballot as shown:
Thank You!
Follow the voter instructions
printed on the ballot or
displayed on the voting
machine.
Please try to vote the exact
pattern shown in red on the
ballot to the left:
John Hancock W.C Redfield Francis Scott Key Albert Einstein “Yes” on Prop. 1
Try to vote un-assisted if you can, and cast the ballot as shown.
If you are lost or stuck, you can ask for assistance.
Remember that this is a test of the voting system, NOT of you the voter.
THANKS!
Date: 2012-04-16 16:30:05ZRev: 1.0.0::36 20

Appendix D
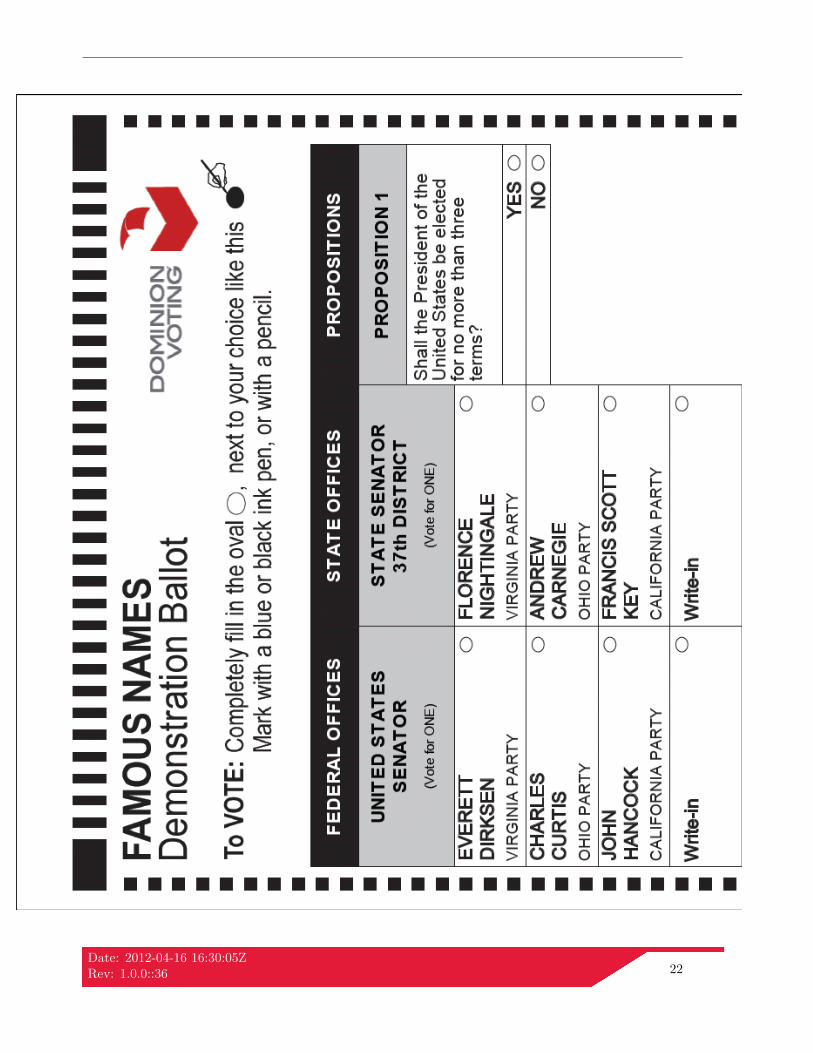
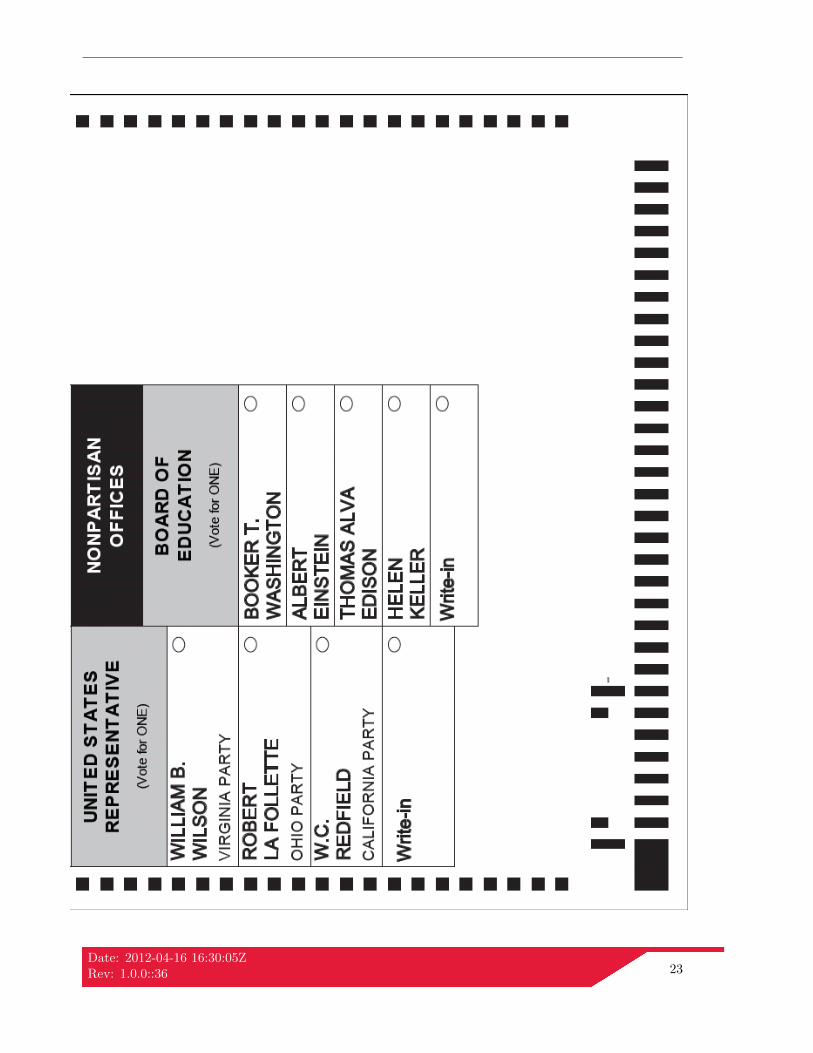
Demonstration Ballot for Voters
The following ballot was created by Dominion Voting Systems, using Democracy Suite. To include areplica of the ballot, factoring in the size (8.5” x 14”), an image of the ballot has been split into two onthe following two pages.
Date: 2012-04-16 16:30:05ZRev: 1.0.0::36 21
Date: 2012-04-16 16:30:05ZRev: 1.0.0::36 22
Date: 2012-04-16 16:30:05ZRev: 1.0.0::36 23
Appendix E
Results
The following two pages shows the results from testing in tabular format. Some results headings have beenshortened. The responses 3A, 3B, 3C, 3D, 3E, and 3F refer to question 3 on the Post Test Questionnaire.
The actual questions are as follows: 3A: I felt confident using this voting machine.
3B: I think that I would need support to be able to use this voting machine.
3C: I think that most people would be able to use this voting machine without problems.
3D: I found that voting on this machine was unnecessarily difficult.
3E: I thought this voting machine was easy to use.
3F: I felt voting on this machine was very awkward.
A rating of 1 to 5 was given as it corresponds to the Likert Scale.
1 = Strongly Disagree
2 = Disagree
3 = Neutral
4 = Agree
5 = Strongly Agree
Date: 2012-04-16 16:30:05ZRev: 1.0.0::36 24
Partici
pant N
umber
Succes
sful C
ompletion
Completion Tim
e (Sec
onds)
Contests
cast
per instr
uctions
Assist
s Req
uested
3A - V
oter C
onfiden
ce
3B - W
ould Nee
d Support
3C - M
ost peo
ple ca
n learn
to use
it
3D - U
nneces
sarily
Diffi
cult
3E - E
asy t
o use
3F - A
wkward
to use
N
otes
Rec
orde
d D
urin
g th
e Pa
rtic
ipan
t's V
otin
g Se
ssio
n 1
Yes
133
5/5
05
45
15
1C
omm
ent:
"Thi
s is
eas
y"
2Ye
s35
45/
50
51
32
51
Vot
er re
turn
ed h
is b
allo
t afte
r ini
tial r
evie
w a
nd p
roce
eded
to
re-in
sert
it in
eac
h of
the
4 ba
llot o
rient
atio
ns.
3Ye
s72
5/5
05
14
15
1C
omm
ent:
"I lik
e th
e to
uch
scre
en"
4Ye
s19
84/
51
52
41
41
Inst
ruct
iona
l Ass
ist:
The
vote
r sto
pped
afte
r the
bal
lot r
evie
w a
nd
aske
d if
she
shou
ld re
turn
her
bal
lot t
o co
mpl
ete
votin
g th
e fin
al
offic
e. S
he w
as in
stru
cted
to fo
llow
her
inst
ruct
ions
if p
ossi
ble.
S
he c
ompl
eted
her
bal
lot w
ithou
t fur
ther
ass
ista
nce.
5Ye
s79
5/5
05
25
15
16
Yes
865/
50
51
41
51
7Ye
s65
5/5
05
24
25
2
8Ye
s37
25/
50
41
41
4.5
2V
oter
had
diff
icul
tly h
oldi
ng a
nd m
arki
ng th
e ba
llot,
but w
as a
ble
to
succ
essf
ully
feed
it in
to th
e ta
bula
tor.
She
was
ver
y pr
oud
that
she
was
abl
e to
vot
e un
-ass
iste
d.
9Ye
s30
25/
50
51
41
4.5
1C
omm
ent:
"I'm
gla
d m
y m
arks
did
not
hav
e to
be
perfe
ct."
Vot
er fo
und
it ea
sier
to v
ote
ballo
t on
lap
than
to u
se a
vot
ing
boot
h.10
Yes
214
5/5
05
15
15
1V
oter
nee
ded
to h
old
ballo
t to
face
(<5
cm) t
o se
e.11
Yes
152
5/5
04
15
15
113
Yes
100
5/5
04
15
15
1
14Ye
s81
5/5
05
15
15
2C
omm
ent:
"Was
ther
e an
aud
io c
onfir
mat
ion
of b
allo
t acc
epta
nce?
" In
form
ed v
oter
that
ther
e w
as a
aud
io to
ne a
t bal
lot a
ccep
tanc
e.
Vot
er a
sked
that
we
incl
ude
a vi
sual
con
firm
atio
n m
essa
ge.
Aver
age
100%
170
4.9/
50
4.77
1.46
4.38
1.15
4.85
1.23
3.54
3.38
3.85
3.85
3.77
Tota
l: 18
.38
- M
ultip
ly b
y 5
for U
sabi
lity
Scor
e =
91.9
/100
U
sabi
lity
Scor
e C
ontr
ibut
ion:
Not
e: P
artic
ipan
t num
ber 1
2 ha
d no
sig
ht a
nd d
id n
ot a
ttem
pt to
vot
e.
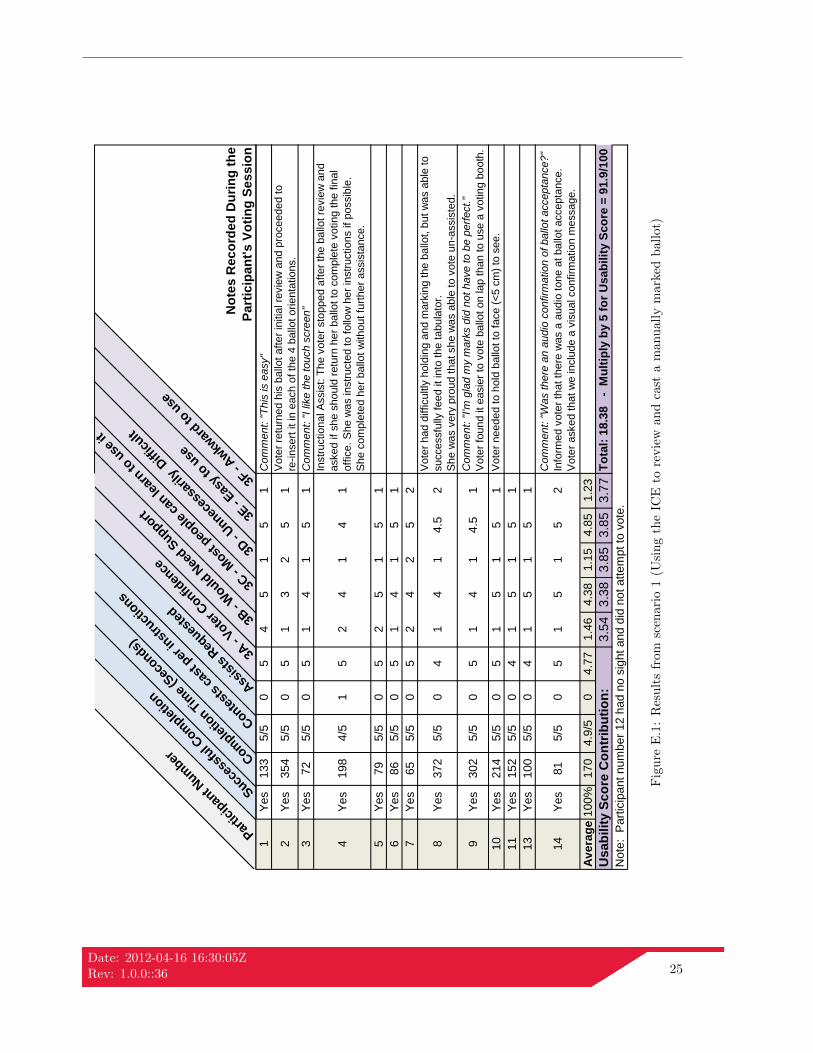
Fig
ure
E.1
:R
esu
lts
from
scen
ari
o1
(Usi
ng
the
ICE
tore
vie
wan
dca
sta
manu
all
ym
ark
edb
all
ot)
Date: 2012-04-16 16:30:05ZRev: 1.0.0::36 25
Partici
pant N
umber
Succes
sful C
ompletion
Completion Tim
e (Sec
onds)
Contests
cast
per instr
uctions
Assist
s Req
uested
3A - V
oter C
onfiden
ce
3B - W
ould Nee
d Support
3C - M
ost peo
ple ca
n learn
to use
it
3D - U
nneces
sarily
Diffi
cult
3E - E
asy t
o use
3F - A
wkward
to use
N
otes
Rec
orde
d D
urin
g th
e Pa
rtic
ipan
t's V
otin
g Se
ssio
n 1
Yes
380
5/5
05
25
15
1C
omm
ent:
"No
notic
e th
at s
yste
m is
prin
ting.
"2
Yes
440
5/5
04
12
42
4Vo
ter d
id n
ot li
ke th
e fit
of t
he h
eadp
hone
s3
Yes
311
5/5
05
24
34
2C
omm
ent:
"The
two
diffe
rent
voi
ces
are
conf
usin
g."
4Ye
s67
03/
51
43
33
33
Inst
ruct
iona
l Ass
ist:
Vote
r got
lost
mov
ing
from
con
test
to c
onte
st.
Vote
r was
inst
ruct
ed to
pre
ss th
e le
ft ar
row
but
ton
to m
ove
to th
e ne
xt c
onte
st.
5Ye
s42
85/
50
51
41
41
Com
men
t: "T
he in
stru
ctio
ns a
fter s
elec
ting
a ca
ndid
ate,
to m
ove
to
the
next
offi
ce a
re n
ot c
lear
."
6Ye
s42
44/
51
42
42
42
Req
uest
for a
ssis
tanc
e: "H
elp
I'm S
tuck
"In
stru
ctio
nal A
ssis
t: Vo
ter w
as in
stru
cted
to p
ress
the
left
arro
w
butto
n to
mov
e to
the
next
con
test
.7
Yes
577
5/5
04
24
34
2C
omm
ent:
"It's
kin
d of
slo
w a
nd th
e in
stru
ctio
ns c
ould
be
bette
r."9
Yes
434
5/5
05
14
25
210
Yes
644
5/5
04
25
23.
52
Com
men
t: "T
he m
ultip
le v
oice
s w
ere
hard
to u
nder
stan
d."
11Ye
s41
65/
50
51
31
52
12Ye
s67
65/
50
33
43
42
Vote
r did
not
like
the
butto
ns a
nd b
raille
labe
ls o
n th
e AT
I.A
vera
ge10
0%49
14.
9/5
0.16
4.36
1.82
3.82
2.27
3.95
2.09
3.18
2.82
2.73
2.95
2.91
Tota
l: 14
.59
- M
ultip
ly b
y 5
for U
sabi
lity
Scor
e =
73/1
00
Usa
bilit
y Sc
ore
Con
trib
utio
n:N
ote:
Som
e pa
rtici
pant
s w
ere
not a
vaila
ble
for t
he a
cces
sibl
e vo
ting
test
usa
bilit
y te
st d
ate.
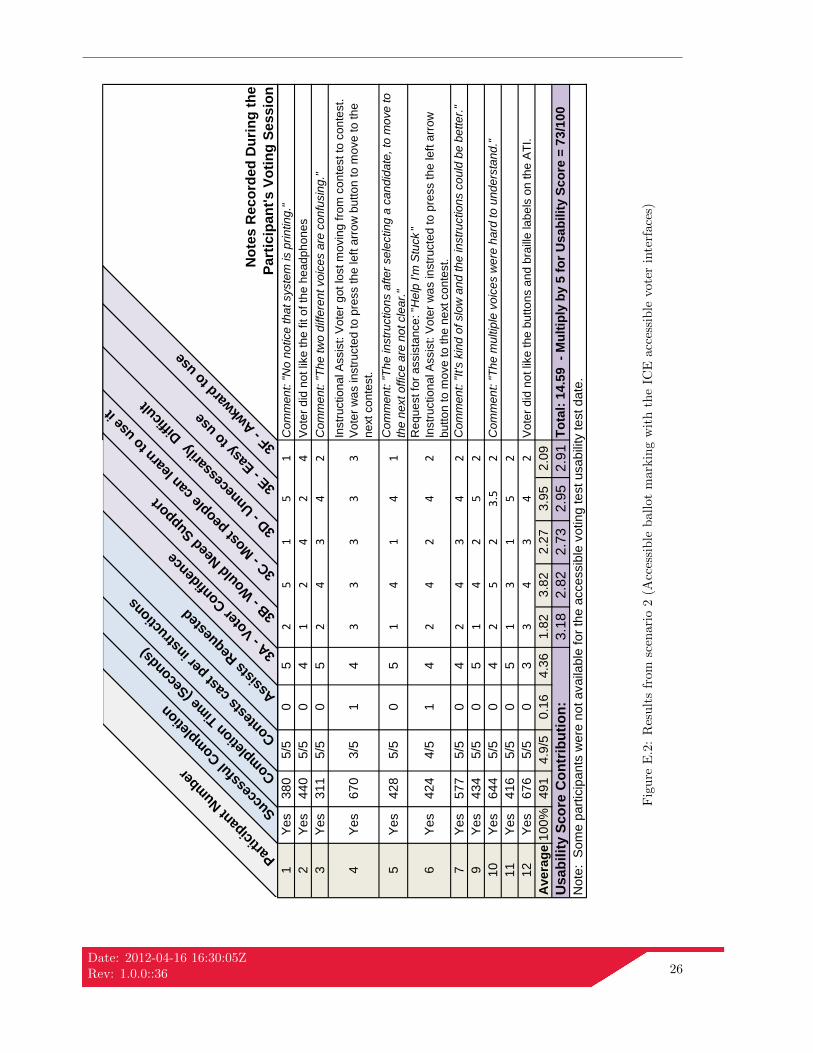
Fig
ure
E.2
:R
esu
lts
from
scen
ari
o2
(Acc
essi
ble
ball
ot
mark
ing
wit
hth
eIC
Eacc
essi
ble
vote
rin
terf
ace
s)
Date: 2012-04-16 16:30:05ZRev: 1.0.0::36 26
Appendix F
Demographic Questionnaire
Date: 2012-04-16 16:30:05ZRev: 1.0.0::36 27
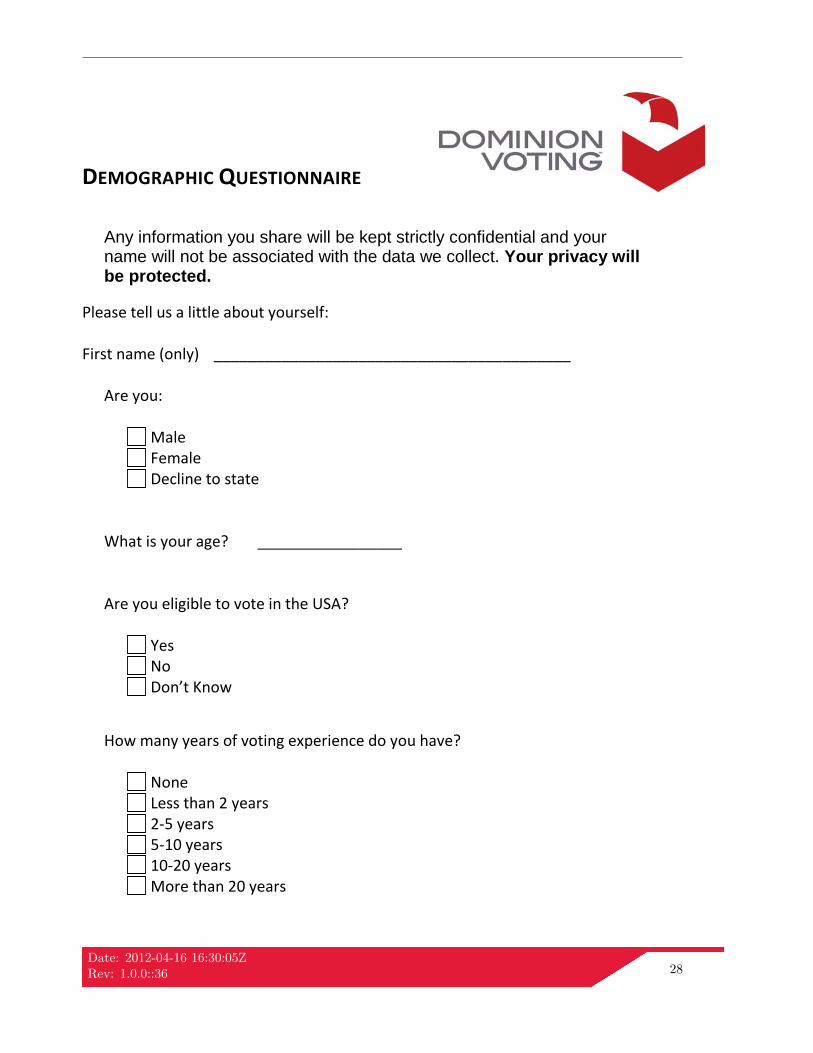
DEMOGRAPHIC QUESTIONNAIRE
Any information you share will be kept strictly confidential and your name will not be associated with the data we collect. Your privacy will be protected.
Please tell us a little about yourself: First name (only) __________________________________________
Are you:
Male Female Decline to state
What is your age? _________________ Are you eligible to vote in the USA?
Yes No Don’t Know
How many years of voting experience do you have?
None Less than 2 years 2-5 years 5-10 years 10-20 years More than 20 years
Date: 2012-04-16 16:30:05ZRev: 1.0.0::36 28
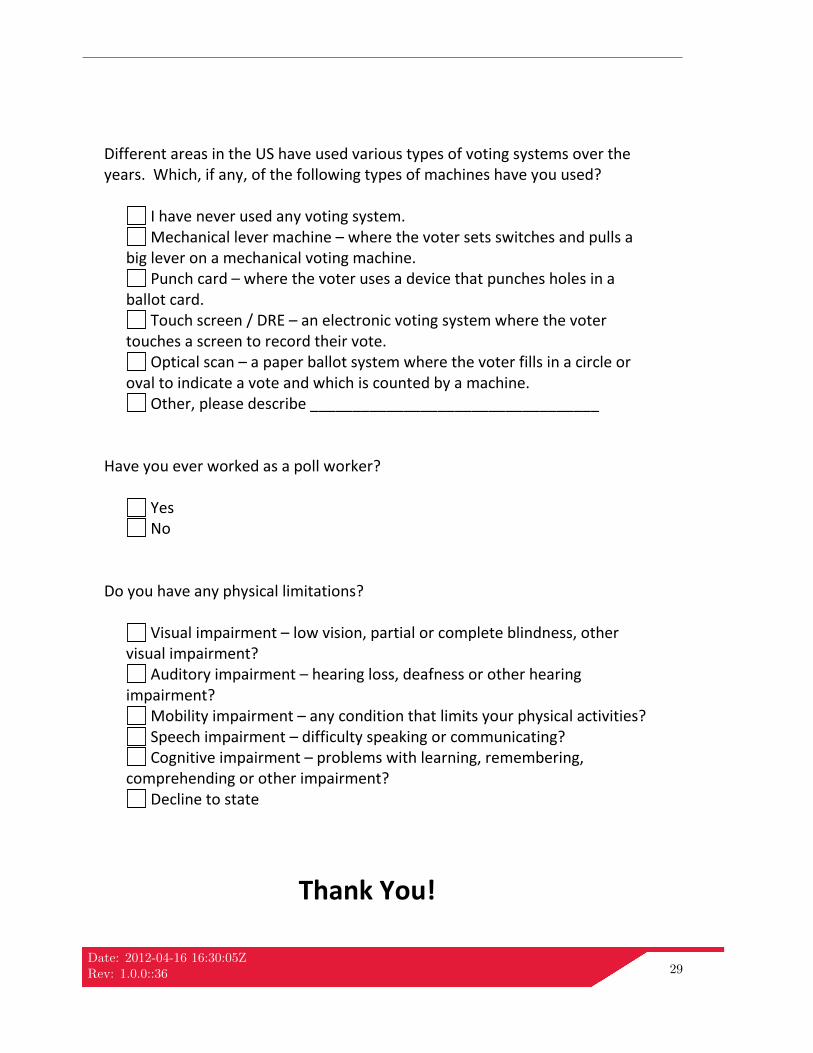
Different areas in the US have used various types of voting systems over the years. Which, if any, of the following types of machines have you used?
I have never used any voting system. Mechanical lever machine – where the voter sets switches and pulls a
big lever on a mechanical voting machine. Punch card – where the voter uses a device that punches holes in a
ballot card. Touch screen / DRE – an electronic voting system where the voter
touches a screen to record their vote. Optical scan – a paper ballot system where the voter fills in a circle or
oval to indicate a vote and which is counted by a machine. Other, please describe __________________________________
Have you ever worked as a poll worker?
Yes No
Do you have any physical limitations?
Visual impairment – low vision, partial or complete blindness, other visual impairment?
Auditory impairment – hearing loss, deafness or other hearing impairment?
Mobility impairment – any condition that limits your physical activities? Speech impairment – difficulty speaking or communicating? Cognitive impairment – problems with learning, remembering,
comprehending or other impairment? Decline to state
Thank You!
Date: 2012-04-16 16:30:05ZRev: 1.0.0::36 29
Appendix G
Post-Test Satisfaction Questionnaire
Upon completing their voting session, each participant was asked to fill out a Post-Test SatisfactionQuestionnaire. Participants who could not complete the questionnaire independently received assistancefilling it out from their personal assistant or from the usability administrator.
Date: 2012-04-16 16:30:05ZRev: 1.0.0::36 30
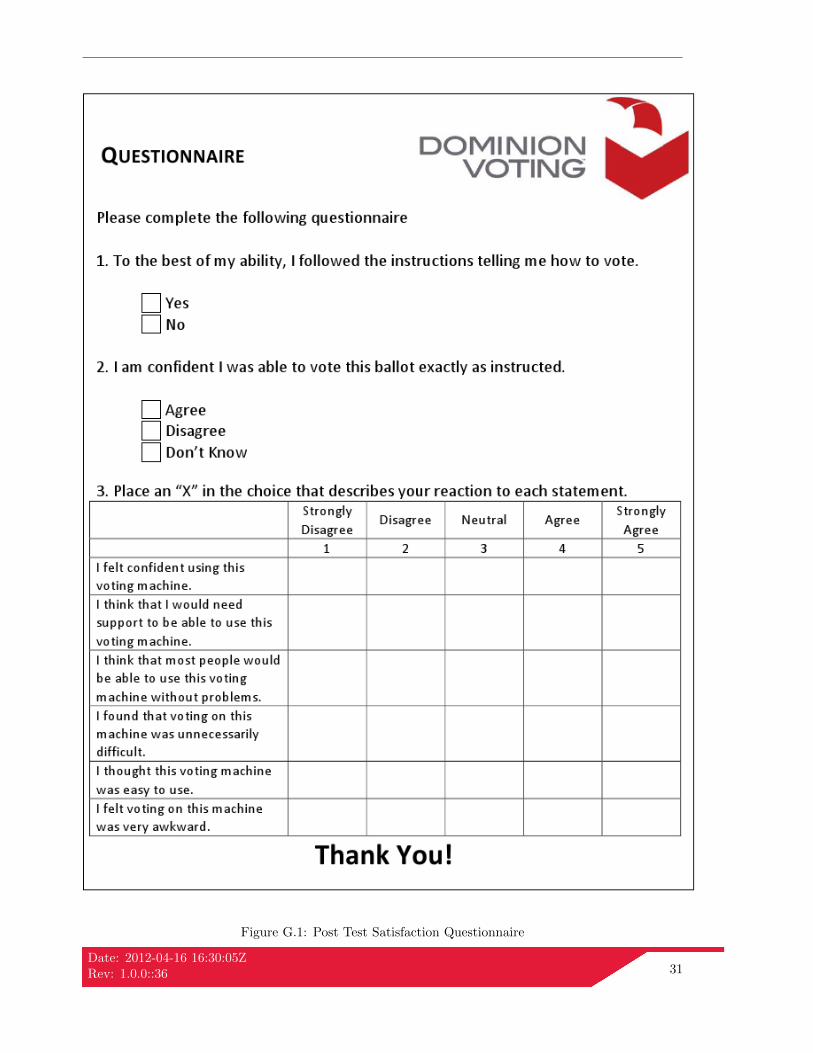
Figure G.1: Post Test Satisfaction Questionnaire
Date: 2012-04-16 16:30:05ZRev: 1.0.0::36 31
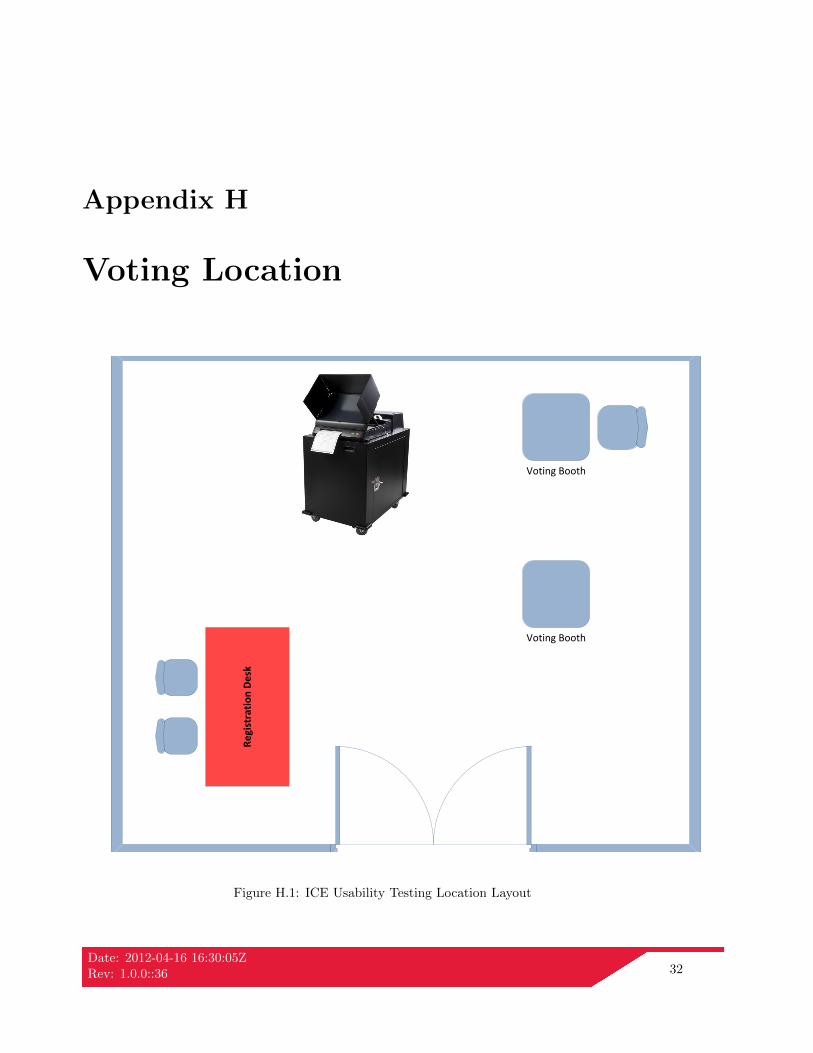
Appendix H
Voting LocationR
egi
stra
tio
n D
esk
Voting Booth
Voting Booth
Figure H.1: ICE Usability Testing Location Layout
Date: 2012-04-16 16:30:05ZRev: 1.0.0::36 32