us weekly kickstart - betandbetter · us weekly kickstart ... source: i/b/e/s, firstcall, ......
TRANSCRIPT

Goldman Sachs Global Investment Research 1
December 5, 2014
United States
US Weekly Kickstart Portfolio Strategy Research
A lower interest rate scenario vs. our forecast would support a higher 2015 S&P 500 target
The drop in 10-year Treasury yields from 3% to 2.3% has been one of the biggest market surprises of 2014. We expect rates to rise
next year in conjunction with an initial Fed hike and accelerating GDP growth. The persistence of low rates has led many investors to
question our economists’ year-end 2015 forecast of fed funds at 0.6% and 10-year Treasuries at 3%. As the yield curve normalizes, if
interest rates remain lower than we anticipate, equity returns could be greater than we forecast. Within the confines of a Fed model,
an end-2015 S&P 500 level of 2300 would be consistent with 2.5% 10-year Treasuries while our forecast of 2100 assumes a 3% yield.
Performance
The S&P 500 was flat this week. Utilities was the
best-performing sector (+1.6%) while Energy was
the worst-performing sector (-3.9%). We expect
the S&P 500 will likely trade at 2100 in 12 months
(+1.4%). See pages 5-15 for performance charts by
sector, style, size, themes.
S&P 500 earnings and valuation
Source: I/B/E/S, FirstCall, and Goldman Sachs Investment Research.
Sector views and performance
Domestic Cyclicals up 14.5% vs. Global Cyclicals
up 9.8% YTD. O/W Information Technology,
Energy, and Telecom Services. U/W Consumer
Discretionary, Industrials, and Materials.
Key pages for portfolio managers
Markets and Money flow (page 5)
Absolute and risk-adjusted returns for markets,
sectors, styles, and strategies (page 6)
Fund flows, correlation, and dispersion (page 18)
Chart of the Week: Sentiment Indicator
Sentiment continues to rise (page 5)
US Portfolio Strategy recommendations
Buy S&P 500 / Sell 10-year Treasury: +4.6% YTD
Buy US vs. Western Europe Revenues: +5.7%
Buy Total Cash Return to shareholders vs.
S&P 500: -0.3%
Buy Low Turnover vs. High Turnover: +2.4%
Goldman Sachs does and seeks to do business with companies covered in its research reports. As a result, investors should be aware that the firm may have a conflict of interest that could affect the objectivity of this report. Investors should consider this report as only a single factor in making their investment decision. For Reg AC certification and other important disclosures, see the Disclosure Appendix, or go to www.gs.com/research/hedge.html. Analysts employed by non-US affiliates are not registered/qualified as research analysts with FINRA in the U.S.
The Goldman Sachs Group, Inc. Global Investment Research
Goldman Sachs ConsensusPortfolio Strategy Bottom-Up
2014E 2015E 2014E 2015E$116 $122 $116 $127
9 % 5 % 9 % 9 %
NTM 2015E NTM 2015E17.1x 17.0x 16.5x 16.3x

December 5, 2014 United States
Goldman Sachs Global Investment Research 2
Conversations we are having with clients: Yield curve scenarios and the path of stocks
Interest rates dominated our discussions with fund managers this week.
The various interest rate scenarios articulated by clients translate into a 10
percentage point difference in the prospective 12-month price return of the
S&P 500. Our interest rate projections support a 1% rise to 2100 while a lower
interest rate scenario vs. our expectation would suggest an 11% gain to 2300.
Goldman Sachs Economics forecasts the Fed will start to tighten in 3Q
and the funds rate will eventually climb to a neutral level of 3.9% by the
end of 2018 (see Exhibit 1). At the same time, 10-year Treasury yields will
rise to 3.0% by year-end 2015 and reach 4.3% in four years (see Exhibit 2).
Our economists forecast several years of above-trend US economic
expansion will be accompanied by rising interest rates. Domestic GDP
growth should accelerate to 3.1% in 2015 and remain above 3% for several
years. Today’s non-farm payrolls surpassed even the most optimistic
estimates with 321K jobs created in November. Monthly wage inflation
accelerated to 0.4%. The unemployment rate was steady at 5.8%. This week
ISM manufacturing printed 58.7 and ISM non-manufacturing rose to 59.3, both
near their post Global Financial Crisis highs. Goldman Sachs Current Activity
Indicator (CAI), a real-time proxy for GDP growth, currently stands at 4.4%.
In contrast, many clients believe the Fed will hike policy rates next year
but that structural changes in the US economy will keep potential GDP
growth low and the funds rate will rise to just 2% during next few years.
Adherents of the “secular stagnation” thesis believe the financial crisis left
the US economy irreversibly weaker, and the economy will not be capable
of tolerating higher rates. Clients validate these views by pointing to forward
market prices, which imply fed funds at 0.5% and 10-year rates at 2.5% by
year-2015, compared with our forecasts of 0.6% and 3.0%, respectively. A
sizeable number of clients have the view that no rate hike will occur in 2015.
Interest rates continue to hover near recent lows despite very strong
US economic data. We believe current low US Treasury yields reflect
unconventional monetary policy and transitory declines in inflation. Nominal
Treasury yields can be disaggregated to two factors: expected real rates and
inflation. Inflation-protected TIPS show that 50 bp of the 70 bp decline in 10-
year Treasuries during 2014 was driven by falling inflation. Most of these
declines coincided with the 40% drop in crude oil prices since June. Our
economists expect inflation will gradually trend higher as the labor market
improves. The remaining 20 bp were due to lower real rates, which we
attribute to continued accommodative actions by both the ECB and the BOJ.
In September, the Fed released its Summary of Economic Projections (SEP)
and the median forecast indicates a 3.75% fed funds rate by 2018,
consistent with the view of Goldman Sachs Economics. Comments from
Fed officials this week suggested that rate hikes are likely during 2015. On
Monday, New York Fed President Dudley stated that rate hikes in “mid-2015
seem reasonable to me.” The Fed will release its next SEP on December 17th.
S&P 500 has returned 14% YTD. We forecast the index will continue its
upward trajectory during the first half of 2015, reflecting the ongoing
economic expansion and rising profit growth. We expect EPS will rise by 5%
to $122 in 2015 and by 8% to $131 in 2016. However, the forward P/E multiple
will likely compress from the current 17.0x to 16.0x by the end of 2015, sparked
by the first Fed rate hike since 2006.
If interest rates in 2015 remain below our forecast, then equity returns may
exceed our expectations. A Fed model with 10-year Treasury rates at 2.5% and
no changes to both EPS and the equity risk premium would imply a level of
2300 for the S&P 500 at year-end 2015 representing an 11% gain. The P/E
multiple would expand to 17.4x, higher than our baseline forecast of 16.0x. A
“reach for yield” argument would support rising P/E multiples in a low interest
rate environment. In that scenario, investors would be incentivized to purchase
higher yielding equity assets. The 6.1% earnings yield on the S&P 500 is
currently 380 bp higher than the 10-year Treasury yield of 2.3%. The yield gap
has averaged 410 bp during the past 10 years and 235 bp since 1976.
Low interest rates and falling oil prices also suggest further upside to S&P
500 EPS. We forecast Brent crude will average $85 a barrel during 2015, 20%
below the YTD average of $103, but 23% above the current $69 price. Our
models indicate that every $10 reduction from our $85 crude oil forecast
represents roughly $2 in incremental EPS in 2015 and $4 in 2016, all else equal.
Low interest rates allow corporations to trim borrowing costs, boosting future
earnings. However, we believe the impact of low rates on interest expense
would be muted given most firms have already refinanced their borrowings.
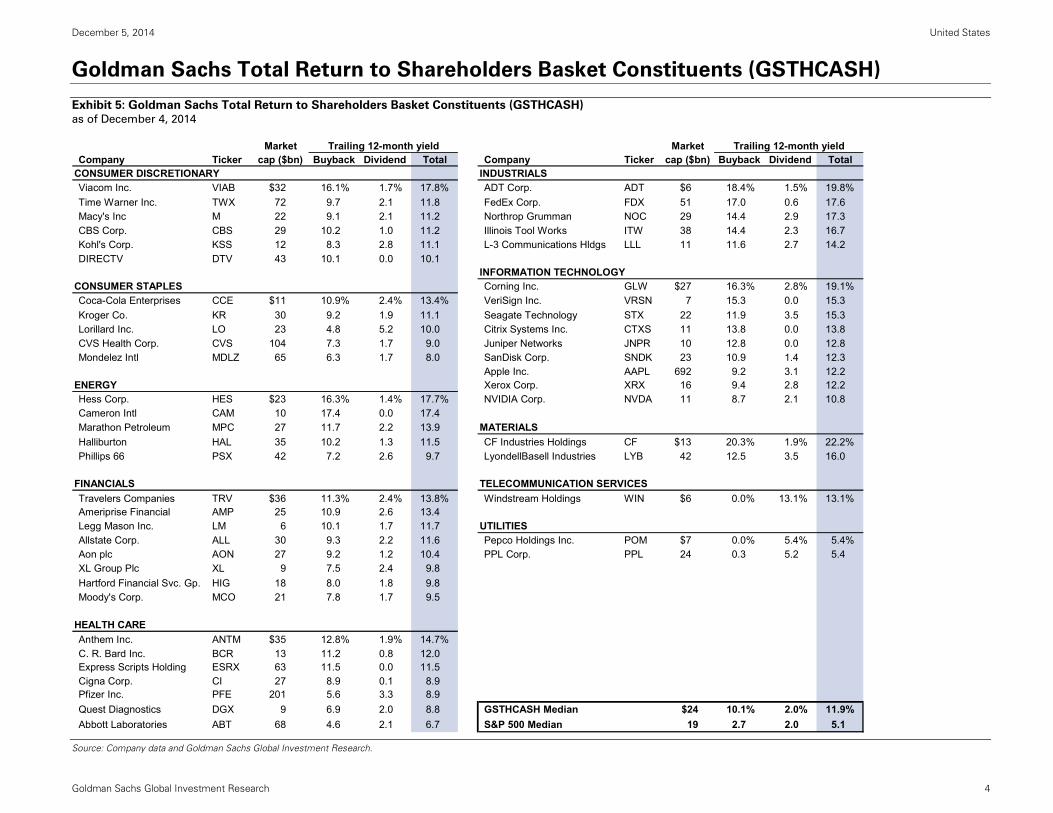
Investors who believe interest rates will remain below the Goldman Sachs
Economics forecast in 2015 should focus on stocks returning cash to
shareholders via buybacks and dividends (Bloomberg ticker:
<GSTHCASH>). The median cash return to shareholders for the 50 stocks in
this portfolio was more than twice the median for the S&P 500 index (12% vs.
5%). The basket has outperformed S&P 500 by 230 bp YTD (16.7% vs. 14.4%).
Selected Buy-rated constituents with 10%+ upside potential: ABT, LLL, NOC,
and PFE.

Goldman Sachs Global Investment Research 3
Charts we are watching: Lower interest rates, higher equity valuations
Exhibit 1: Our fed funds forecasts are in-line with Fed but above the market as of December 4, 2014
Exhibit 2: Goldman Sachs Economics expects rates to rise across the curve as of December 4, 2014
Source: Federal Reserve, Bloomberg, and Goldman Sachs Global Investment Research. Source: Federal Reserve and Goldman Sachs Global Investment Research.
Exhibit 3: The spread between Treasuries and Bunds is close to a record highas of December 4, 2014
Exhibit 4: Lower 10-year yields would support a higher equity valuation as of December 4, 2014
Source: Haver and Goldman Sachs Global Investment Research. Source: Compustat, I/B/E/S, FRB, and Goldman Sachs Global Investment Research.
0.0
0.5
1.0
1.5
2.0
2.5
3.0
3.5
4.0
4.5
2014 2015 2016 2017 2018
Fed funds rate path:GS vs. Fed vs. Market GS Forecast
Market-Implied
2018E:3.9%
2018E:2.5%
Federal Reserve
2018E:3.8%
0
1
2
3
4
5
FedFunds
1 2 3 4 5 6 7 8 9 10
Yiel
d (%
)
Years to Maturity
Current
Goldman Sachs Yield Curve Forecasts
2014E
4.3%3.8%3.5%
3.0%
2.5%
0.1%
3.9%
2.9%
1.6%
0.6%
2.3%
2015E
2016E
2017E
2018E
(100)
(50)
0
50
100
150
200
250
1994
1995
1996
1997
1998
1999
2000
2001
2002
2003
2004
2005
2006
2007
2008
2009
2010
2011
2012
2013
2014
2015
2016
2017
2018
2019
2020
Bas
is p
oint
s
10-year yield spreadUS Treasury less German Bund
+1 stdev: 92 bp
-1 stdev: -12 bp
Avg: 40 bp
156 bp
125 bp
GS Forecast2015 Scenarios
US 10-Yr Yield Earnings NTM S&P 500Scenario T-Yield Gap Yield P/E Level
GS 3.0 % 325 bp 6.3 % 16.0x 2100
Alternative 2.5 325 5.8 17.4 2300
Current 376 bp
5-Year 516
10-Year 408
1976 - Present 235
December 5, 2014 United States
Goldman Sachs Global Investment Research 4
Goldman Sachs Total Return to Shareholders Basket Constituents (GSTHCASH)
Exhibit 5: Goldman Sachs Total Return to Shareholders Basket Constituents (GSTHCASH)
as of December 4, 2014
Source: Company data and Goldman Sachs Global Investment Research.
Market Trailing 12-month yield Market Trailing 12-month yieldCompany Ticker cap ($bn) Buyback Dividend Total Company Ticker cap ($bn) Buyback Dividend Total
CONSUMER DISCRETIONARY INDUSTRIALSViacom Inc. VIAB $32 16.1% 1.7% 17.8% ADT Corp. ADT $6 18.4% 1.5% 19.8%Time Warner Inc. TWX 72 9.7 2.1 11.8 FedEx Corp. FDX 51 17.0 0.6 17.6Macy's Inc M 22 9.1 2.1 11.2 Northrop Grumman NOC 29 14.4 2.9 17.3CBS Corp. CBS 29 10.2 1.0 11.2 Illinois Tool Works ITW 38 14.4 2.3 16.7Kohl's Corp. KSS 12 8.3 2.8 11.1 L-3 Communications Hldgs LLL 11 11.6 2.7 14.2DIRECTV DTV 43 10.1 0.0 10.1
INFORMATION TECHNOLOGYCONSUMER STAPLES Corning Inc. GLW $27 16.3% 2.8% 19.1%Coca-Cola Enterprises CCE $11 10.9% 2.4% 13.4% VeriSign Inc. VRSN 7 15.3 0.0 15.3Kroger Co. KR 30 9.2 1.9 11.1 Seagate Technology STX 22 11.9 3.5 15.3Lorillard Inc. LO 23 4.8 5.2 10.0 Citrix Systems Inc. CTXS 11 13.8 0.0 13.8CVS Health Corp. CVS 104 7.3 1.7 9.0 Juniper Networks JNPR 10 12.8 0.0 12.8Mondelez Intl MDLZ 65 6.3 1.7 8.0 SanDisk Corp. SNDK 23 10.9 1.4 12.3
Apple Inc. AAPL 692 9.2 3.1 12.2ENERGY Xerox Corp. XRX 16 9.4 2.8 12.2Hess Corp. HES $23 16.3% 1.4% 17.7% NVIDIA Corp. NVDA 11 8.7 2.1 10.8Cameron Intl CAM 10 17.4 0.0 17.4Marathon Petroleum MPC 27 11.7 2.2 13.9 MATERIALSHalliburton HAL 35 10.2 1.3 11.5 CF Industries Holdings CF $13 20.3% 1.9% 22.2%Phillips 66 PSX 42 7.2 2.6 9.7 LyondellBasell Industries LYB 42 12.5 3.5 16.0
FINANCIALS TELECOMMUNICATION SERVICESTravelers Companies TRV $36 11.3% 2.4% 13.8% Windstream Holdings WIN $6 0.0% 13.1% 13.1%Ameriprise Financial AMP 25 10.9 2.6 13.4Legg Mason Inc. LM 6 10.1 1.7 11.7 UTILITIESAllstate Corp. ALL 30 9.3 2.2 11.6 Pepco Holdings Inc. POM $7 0.0% 5.4% 5.4%Aon plc AON 27 9.2 1.2 10.4 PPL Corp. PPL 24 0.3 5.2 5.4XL Group Plc XL 9 7.5 2.4 9.8Hartford Financial Svc. Gp. HIG 18 8.0 1.8 9.8Moody's Corp. MCO 21 7.8 1.7 9.5
HEALTH CAREAnthem Inc. ANTM $35 12.8% 1.9% 14.7%C. R. Bard Inc. BCR 13 11.2 0.8 12.0Express Scripts Holding ESRX 63 11.5 0.0 11.5Cigna Corp. CI 27 8.9 0.1 8.9Pfizer Inc. PFE 201 5.6 3.3 8.9Quest Diagnostics DGX 9 6.9 2.0 8.8 GSTHCASH Median $24 10.1% 2.0% 11.9%Abbott Laboratories ABT 68 4.6 2.1 6.7 S&P 500 Median 19 2.7 2.0 5.1

December 5, 2014 United States
Goldman Sachs Global Investment Research 5
Markets and Money Flow
Source: Haver, Lipper, FactSet, CFTC, and Goldman Sachs Global Investment Research.
S&P 500 level and EPS 10-yr. Treasury Yields Stocks vs. Bonds
Sentiment Indicator Rotation Index Volatility
80
100
120
140
160
180
200
Dec
-12
Dec
-13
Dec
-14
Dec
-15
Dec
-16
Dec
-17
SPX/UST
Goldman Sachs
Forecast
S&P 500 Total Return vs. 10-Year UST
(Constant Maturity, Rolled Monthly)
10
15
20
25
30
Dec
-12
Mar
-13
Jun-
13
Sep
-13
Dec
-13
Mar
-14
Jun-
14
Sep
-14
Dec
-14
Mar
-15
VIX(2.0)
(1.5)
(1.0)
(0.5)
0.0
0.5
1.0
1.5
2.0
Dec
-12
Mar
-13
Jun-
13
Sep
-13
Dec
-13
Mar
-14
Jun-
14
Sep
-14
Dec
-14
Mar
-15
Stan
dard
dev
iatio
ns
Risk off; favors BOND flows
Risk on; favors EQUITY flows
Rotation Index (4-wk moving avg)
6-month trend
0
20
40
60
80
100
Dec
-12
Mar
-13
Jun-
13
Sep
-13
Dec
-13
Mar
-14
Jun-
14
Sep
-14
Dec
-14
Mar
-15
S&P
500
Futu
res
Sent
imen
t
Sentiment Indicator (SI)
>90 = HIGH net positions
<10 = LOW net positions
86
1.0 %
1.5 %
2.0 %
2.5 %
3.0 %
3.5 %
4.0 %
4.5 %
5.0 %
Dec
-12
Dec
-13
Dec
-14
Dec
-15
Dec
-16
Dec
-17
US 10-Year Treasury Yield
2016E3.50%
Current2.3%
2014E2.50%
2015E3.00%
90
100
110
120
130
140
150
1250
1500
1750
2000
2250
2500D
ec-1
2
Dec
-13
Dec
-14
Dec
-15
Dec
-16
Dec
-17
Dec
-18
S&P 500 EPSS&
P 50
0 Pr
ice
Goldman SachsEPS Forecast
S&P 500Price
Current2072
2014E2050
2016E2200
2013A$107
2014E$116
2015E$122
2016E$131
2017E$141
2015E2100
Note: Sentiment Indicator ranks net futures positioning versus the past 12 months. Readings
below 10 or above 90 indicate extreme positions that are significant in predicting future returns.
Note: Rotation Index plots the first principal component of weekly reallocation activity
across equity and debt mutual fund categories as a measure of retail risk appetite.

December 5, 2014 United States
Goldman Sachs Global Investment Research 6
Market Performance: 2014 YTD absolute and risk-adjusted returns
Source: Haver, Lipper, FactSet, and Goldman Sachs Global Investment Research.
Total Return Risk Adjusted Return (Sharpe Ratio)
14
(6)
6
8
9
10
14
16
22
25
28
(37)
(10)
(4)
(0)
0
1
2
2
5
7
9
13
14
14
15
(60) (50) (40) (30) (20) (10) 0 10 20 30 40 50
Brent Crude Oil
$/Euro
ENERGY
Event-Driven HF Index
Composite Hedge Fund Index
Gold
MSCI Emerging Markets
Equity L/S HF Index
Russell 2000
Global Macro HF Index
TELECOM SERVICES
MSCI Developed Markets
CONSUMER DISCRETIONARY
Barclays 7-10yr Treasury ETF
MATERIALS
INDUSTRIALS
Russell 1000 Value
Russell 1000
Russell 1000 Growth
FINANCIALS
S&P 500
Nasdaq
CONSUMER STAPLES
INFORMATION TECHNOLOGY
UTILITIES
HEALTH CARE
(1.9)
(1.8)
(0.8)
(0.1)
0.0
0.1
0.1
0.3
0.8
1.2
1.2
1.2
1.3
1.3
1.9
(0.4)
0.5
0.6
0.7
0.8
1.2
1.7
1.8
2.0
2.1
1.4
(3.0) (2.5) (2.0) (1.5) (1.0) (0.5) 0.0 0.5 1.0 1.5 2.0 2.5 3.0
Brent Crude Oil
$/Euro
Event-Driven HF Index
ENERGY
Composite Hedge Fund Index
Gold
MSCI Emerging Markets
Russell 2000
Equity L/S HF Index
TELECOM SERVICES
CONSUMER DISCRETIONARY
MATERIALS
INDUSTRIALS
MSCI Developed Markets
Nasdaq
Global Macro HF Index
FINANCIALS
Russell 1000 Growth
Russell 1000
Russell 1000 Value
S&P 500
INFORMATION TECHNOLOGY
CONSUMER STAPLES
Barclays 7-10yr Treasury ETF
UTILITIES
HEALTH CARE

December 5, 2014 United States
Goldman Sachs Global Investment Research 7
Sector Baskets – Performance Relative to S&P 500
Source: FactSet and Goldman Sachs Global Investment Research.
Cyclicals Defensives Domestic Global
Domestic Cyclicals Global Cyclicals Domestic Defensives Global Defensives
94
95
96
97
98
99
100
101
102
Dec
-12
Mar
-13
Jun-
13
Sep-
13
Dec
-13
Mar
-14
Jun-
14
Sep-
14
Dec
-14
Mar
-15
GSSBCYCLBloomberg <ticker>
94
96
98
100
102
104
106
108
110
112
Dec
-12
Mar
-13
Jun-
13
Sep-
13
Dec
-13
Mar
-14
Jun-
14
Sep-
14
Dec
-14
Mar
-15
GSSBDCYC
94
96
98
100
102
104
106
108
Dec
-12
Mar
-13
Jun-
13
Sep-
13
Dec
-13
Mar
-14
Jun-
14
Sep-
14
Dec
-14
Mar
-15
GSSBDEFS
84
86
88
90
92
94
96
98
100
102
Dec
-12
Mar
-13
Jun-
13
Sep-
13
Dec
-13
Mar
-14
Jun-
14
Sep-
14
Dec
-14
Mar
-15
GSSBGCYC
97
98
99
100
101
102
103
104
105
106
Dec
-12
Mar
-13
Jun-
13
Sep-
13
Dec
-13
Mar
-14
Jun-
14
Sep-
14
Dec
-14
Mar
-15
GSSBDOMS
92
94
96
98
100
102
104
106
108
Dec
-12
Mar
-13
Jun-
13
Sep-
13
Dec
-13
Mar
-14
Jun-
14
Sep-
14
Dec
-14
Mar
-15
GSSBDDEF
95
96
97
98
99
100
101
Dec
-12
Mar
-13
Jun-
13
Sep-
13
Dec
-13
Mar
-14
Jun-
14
Sep-
14
Dec
-14
Mar
-15
GSSBGLBL
96
98
100
102
104
106
108
110
112
Dec
-12
Mar
-13
Jun-
13
Sep-
13
Dec
-13
Mar
-14
Jun-
14
Sep-
14
Dec
-14
Mar
-15
GSSBGDEF

December 5, 2014 United States
Goldman Sachs Global Investment Research 8
Sector Basket Performance
Source: FactSet and Goldman Sachs Global Investment Research.
Cyclicals vs. Defensives Domestic vs. Global
85
90
95
100
105
110
Dec
-12
Mar
-13
Jun-
13
Sep-
13
Dec
-13
Mar
-14
Jun-
14
Sep-
14
Dec
-14
Mar
-15
CYCLICALSoutperforming
DEFENSIVESoutperforming
90
92
94
96
98
100
102
Dec
-12
Mar
-13
Jun-
13
Sep-
13
Dec
-13
Mar
-14
Jun-
14
Sep-
14
Dec
-14
Mar
-15
GLOBALoutperforming
DOMESTICoutperforming
Performance and fundamentals of our sector baskets Bloomberg % of
Ticker # of S&P 500 Non-US Earnings Growth Sales Growth NTM LTM Div Total ReturnBasket <GSSBXXXX> Stocks Cap Beta Sales 2014 2015 2014 2015 P/E P/B Yield 1 Wk 1 Mo 3 Mo LTM YTD
Defensives DEFS 210 41 % 0.9 21% 12 % 9 % 6 % 5 % 18.6x 4.0x 2.1 % 1 % 4 % 7 % 21 % 19 %Cyclicals CYCL 290 59 1.1 42 4 9 2 1 15.3 2.4 1.8 (1) 3 2 16 11
Domestic DOMS 228 39 % 0.9 16% 7 % 12 % 6 % 5 % 16.1x 2.2x 1.9 % 1 % 4 % 6 % 19 % 16 %Global GLBL 272 61 1.0 49 7 7 2 1 16.8 3.6 2.0 (0) 3 3 17 13
Global Defensives GDEF 67 19 % 1.0 49% 12 % 10 % 3 % 3 % 19.0x 5.3x 2.2 % 1 % 3 % 9 % 23 % 21 %Domestic Cyclicals DCYC 85 17 1.1 23 3 16 2 4 14.0 1.5 1.6 1 3 6 19 14Domestic Defensives DDEF 143 23 0.9 13 11 9 7 6 18.2 3.3 2.1 0 4 6 19 17Global Cyclicals GCYC 205 42 1.1 49 5 6 1 1 15.9 3.1 2.0 (1) 3 1 15 10
S&P 500 500 100 % 1.0 33% 9 % 9 % 4 % 3 % 16.5x 2.9x 2.0 % (0)% 3 % 4 % 18 % 14 %
December 5, 2014 United States
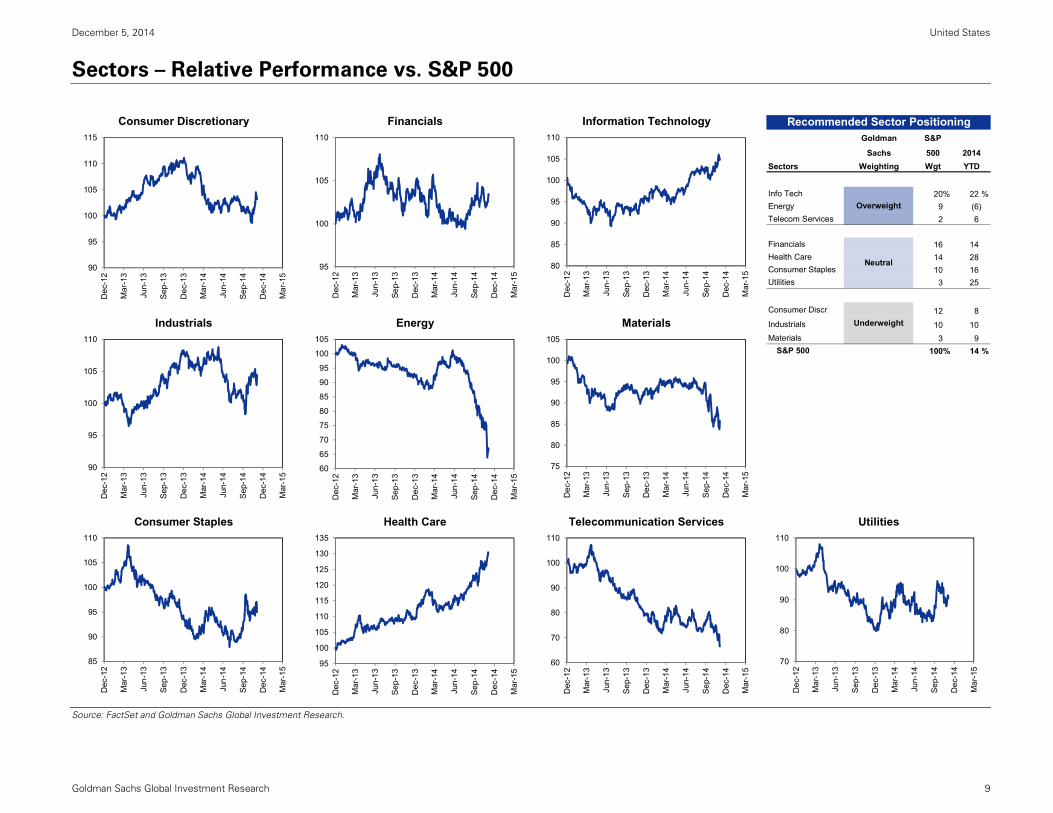
Goldman Sachs Global Investment Research 9
Sectors – Relative Performance vs. S&P 500
Source: FactSet and Goldman Sachs Global Investment Research.
Consumer Discretionary Financials Information Technology Recommended Sector PositioningGoldman S&P
Sachs 500 2014Sectors Weighting Wgt YTD
Info Tech 20% 22 %Energy 9 (6)Telecom Services 2 6
Financials 16 14Health Care 14 28Consumer Staples 10 16Utilities 3 25
Consumer Discr 12 8Industrials Energy Materials Industrials 10 10
Materials 3 9S&P 500 100% 14 %
Consumer Staples Health Care Telecommunication Services Utilities
Underweight
Overweight
Neutral90
95
100
105
110
115
Dec
-12
Mar
-13
Jun-
13
Sep-
13
Dec
-13
Mar
-14
Jun-
14
Sep-
14
Dec
-14
Mar
-15
90
95
100
105
110
Dec
-12
Mar
-13
Jun-
13
Sep-
13
Dec
-13
Mar
-14
Jun-
14
Sep-
14
Dec
-14
Mar
-15
95
100
105
110
Dec
-12
Mar
-13
Jun-
13
Sep-
13
Dec
-13
Mar
-14
Jun-
14
Sep-
14
Dec
-14
Mar
-15
60
65
70
75
80
85
90
95
100
105D
ec-1
2
Mar
-13
Jun-
13
Sep-
13
Dec
-13
Mar
-14
Jun-
14
Sep-
14
Dec
-14
Mar
-15
80
85
90
95
100
105
110
Dec
-12
Mar
-13
Jun-
13
Sep-
13
Dec
-13
Mar
-14
Jun-
14
Sep-
14
Dec
-14
Mar
-15
75
80
85
90
95
100
105
Dec
-12
Mar
-13
Jun-
13
Sep-
13
Dec
-13
Mar
-14
Jun-
14
Sep-
14
Dec
-14
Mar
-15
85
90
95
100
105
110
Dec
-12
Mar
-13
Jun-
13
Sep-
13
Dec
-13
Mar
-14
Jun-
14
Sep-
14
Dec
-14
Mar
-15 95
100
105
110
115
120
125
130
135
Dec
-12
Mar
-13
Jun-
13
Sep-
13
Dec
-13
Mar
-14
Jun-
14
Sep-
14
Dec
-14
Mar
-15
60
70
80
90
100
110
Dec
-12
Mar
-13
Jun-
13
Sep-
13
Dec
-13
Mar
-14
Jun-
14
Sep-
14
Dec
-14
Mar
-15
70
80
90
100
110
Dec
-12
Mar
-13
Jun-
13
Sep-
13
Dec
-13
Mar
-14
Jun-
14
Sep-
14
Dec
-14
Mar
-15
December 5, 2014 United States
Goldman Sachs Global Investment Research 10
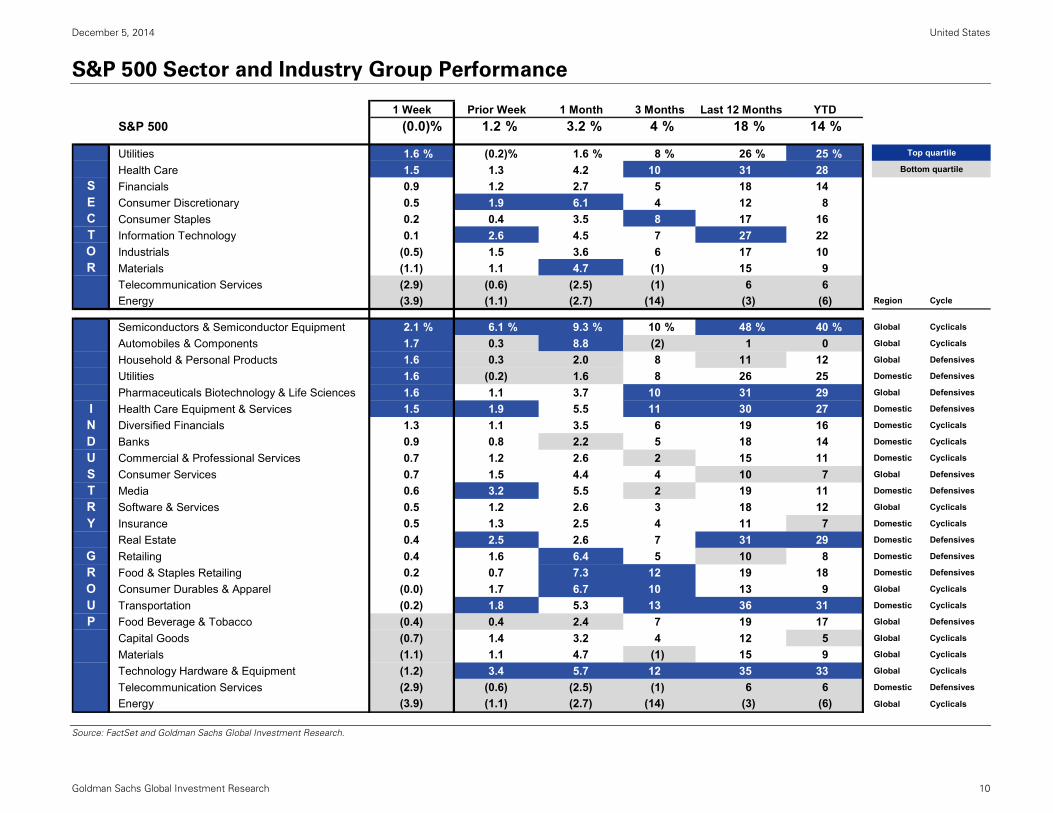
S&P 500 Sector and Industry Group Performance
Source: FactSet and Goldman Sachs Global Investment Research.
1 Week Prior Week 1 Month 3 Months Last 12 Months YTDS&P 500 (0.0)% 1.2 % 3.2 % 4 % 18 % 14 %
Utilities 1.6 % (0.2)% 1.6 % 8 % 26 % 25 % Top quartile
Health Care 1.5 1.3 4.2 10 31 28 Bottom quartile
S Financials 0.9 1.2 2.7 5 18 14E Consumer Discretionary 0.5 1.9 6.1 4 12 8C Consumer Staples 0.2 0.4 3.5 8 17 16T Information Technology 0.1 2.6 4.5 7 27 22O Industrials (0.5) 1.5 3.6 6 17 10R Materials (1.1) 1.1 4.7 (1) 15 9
Telecommunication Services (2.9) (0.6) (2.5) (1) 6 6Energy (3.9) (1.1) (2.7) (14) (3) (6) Region Cycle
Semiconductors & Semiconductor Equipment 2.1 % 6.1 % 9.3 % 10 % 48 % 40 % Global Cyclicals
Automobiles & Components 1.7 0.3 8.8 (2) 1 0 Global Cyclicals
Household & Personal Products 1.6 0.3 2.0 8 11 12 Global Defensives
Utilities 1.6 (0.2) 1.6 8 26 25 Domestic Defensives
Pharmaceuticals Biotechnology & Life Sciences 1.6 1.1 3.7 10 31 29 Global Defensives
I Health Care Equipment & Services 1.5 1.9 5.5 11 30 27 Domestic Defensives
N Diversified Financials 1.3 1.1 3.5 6 19 16 Domestic Cyclicals
D Banks 0.9 0.8 2.2 5 18 14 Domestic Cyclicals
U Commercial & Professional Services 0.7 1.2 2.6 2 15 11 Domestic Cyclicals
S Consumer Services 0.7 1.5 4.4 4 10 7 Global Defensives
T Media 0.6 3.2 5.5 2 19 11 Domestic Defensives
R Software & Services 0.5 1.2 2.6 3 18 12 Global Cyclicals
Y Insurance 0.5 1.3 2.5 4 11 7 Domestic Cyclicals
Real Estate 0.4 2.5 2.6 7 31 29 Domestic Defensives
G Retailing 0.4 1.6 6.4 5 10 8 Domestic Defensives
R Food & Staples Retailing 0.2 0.7 7.3 12 19 18 Domestic Defensives
O Consumer Durables & Apparel (0.0) 1.7 6.7 10 13 9 Global Cyclicals
U Transportation (0.2) 1.8 5.3 13 36 31 Domestic Cyclicals
P Food Beverage & Tobacco (0.4) 0.4 2.4 7 19 17 Global Defensives
Capital Goods (0.7) 1.4 3.2 4 12 5 Global Cyclicals
Materials (1.1) 1.1 4.7 (1) 15 9 Global Cyclicals
Technology Hardware & Equipment (1.2) 3.4 5.7 12 35 33 Global Cyclicals
Telecommunication Services (2.9) (0.6) (2.5) (1) 6 6 Domestic Defensives
Energy (3.9) (1.1) (2.7) (14) (3) (6) Global Cyclicals

December 5, 2014 United States
Goldman Sachs Global Investment Research 11
Style and Size
Source: FactSet and Goldman Sachs Global Investment Research,
Growth vs. Value
96
97
98
99
100
101
102
103
104
105
106
Dec
-12
Mar
-13
Jun-
13
Sep-
13
Dec
-13
Mar
-14
Jun-
14
Sep-
14
Dec
-14
Mar
-15
Value outperforming
Growth outperforming
Large-cap vs. Small-cap
92
94
96
98
100
102
104
106
108
110
112
Dec
-12
Mar
-13
Jun-
13
Sep-
13
Dec
-13
Mar
-14
Jun-
14
Sep-
14
Dec
-14
Mar
-15
S&P 500 outperforming
Russell 2000 outperforming
Sectors: Russell 1000 Growth vs. Value
Weight (%) 1-Week (% Return) YTD (% Return)Sector Value Growth Value Growth ∆ (bps) Value Growth ∆ (bps)Energy 11 5 (4) (7) 346 (6) (5) (114)
Information Tech 10 28 1 (0) 113 30 17 1,302
Cons Discretionary 6 18 1 0 89 12 7 499
Utilities 6 0 1 1 74 24 21 245
Financials 30 5 1 0 64 14 12 212
Consumer Staples 7 11 0 0 34 16 15 141
Health Care 14 14 2 1 18 24 32 (752)
Telecom Services 2 2 (3) (3) (55) 3 8 (467)
Materials 3 4 (2) (0) (101) 8 10 (186)
Industrials 10 12 (1) 0 (166) 6 12 (516)
Index 100 100 0 (0) 29 13 14 (47)
Sectors: S&P 500 vs. Russell 2000
Weight (%) 1-Week (% Return) YTD (% Return)Sector SP500 R2000 SP500 R2000 ∆ (bps) SP500 R2000 ∆ (bps)Energy 9 4 (4) (17) 1,270 (6) (36) 2,986
Health Care 14 14 2 (1) 260 28 13 1,477
Financials 16 24 1 (1) 166 14 6 775
Cons Discretionary 12 14 1 (1) 131 8 (1) 891
Utilities 3 3 2 0 130 25 16 879
Telecom Services 2 1 (3) (4) 112 6 (6) 1,134
Industrials 10 14 (1) (1) 94 10 (3) 1,297
Materials 3 5 (1) (2) 87 9 (5) 1,424
Consumer Staples 10 3 0 0 16 16 8 801
Information Tech 20 18 0 0 2 22 5 1,662
Index 100 100 (0) (1) 146 14 2 1,227

December 5, 2014 United States
Goldman Sachs Global Investment Research 12
US Portfolio Strategy Baskets
For details and constituents of our baskets see Strategy Baskets: Anatomy of our US Portfolio Strategy Thematic and Sector Baskets, July 23, 2014.
Source: FactSet and Goldman Sachs Global Investment Research.
Bloomberg Total Return P/E P/B DivTicker 1 wk 1 mo YTD NTM LTM Yield
Macroeconomic
Dual Beta GSTHBETA (1)% 1 % 6 % 20x 4.3x 1.0 %Interest Rate Sensitive GSTHUSTY (1) 1 10 17 3.2 1.5High Operating Leverage GSTHOPHI (1) 3 13 21 3.8 1.4Low Operating Leverage GSTHOPLO (1) 2 16 19 6.7 2.3High Tax GSTHHTAX 0 4 19 21 6.6 1.7Low Tax GSTHLTAX (1) 3 10 16 3.4 2.7
Geographic Sales
Domestic Sales GSTHAINT (0)% 3 % 18 % 19x 4.6x 1.6 %International Sales GSTHINTL (0) 3 9 16 4.5 2.0BRICs Sales GSTHBRIC (0) 4 9 17 5.4 1.8Western Europe Sales GSTHWEUR 0 4 8 18 3.9 1.7
Fundamental
High Revenue Growth GSTHREVG (1)% 2 % 10 % 25x 6.7x 0.9 %ROE Growth GSTHGROE 0 3 14 19 4.7 2.0High Quality Stock GSTHQUAL 0 2 13 19 5.7 1.5Strong Balance Sheet GSTHSBAL 0 4 17 25 7.6 1.0Weak Balance Sheet GSTHWBAL (1) 3 19 17 3.5 1.9
Shareholder Return
Dividend Growth GSTHDIVG 0 % 3 % 12 % 16x 4.5x 2.8 %Buyback GSTHREPO (1) 3 14 17 4.3 1.4Total Cash Return to Shareholder GSTHCASH (1) 3 16 16 4.2 1.9Earnings Held Overseas GSTHSEAS 0 4 14 17 3.6 2.0
Hedge Fund
Hedge Fund "VIP" List GSTHHVIP (0)% 5 % 16 % 21x 6.2x 1.1 %Hedge Fund Very Important Shorts GSTHVISP 0 4 16 18 5.3 2.3High Hedge Fund Concentration GSTHHFHI (0) 5 20 20 4.9 0.6Low Hedge Fund Concentration GSTHHFSL 0 4 15 17 4.1 2.7
Mutual Fund
High Sharpe Ratio GSTHSHRP (1)% 2 % 14 % 17x 4.6x 1.6 %Mutual Fund Overweight Positions GSTHMFOW (0) 3 10 18 5.0 1.3Mutual Fund Underweight Positions GSTHMFUW 0 3 17 19 5.2 2.9
S&P 500 (0)% 3 % 14 % 17x 2.9x 2.0 %S&P 500 Average 19 4.6 1.9S&P 500 Median 17 3.2 1.7
YTD Performance
20
19
19
18
17
17
16
16
16
16
15
14
14
14
14
13
13
12
10
10
10
10
9
9
8
6
14
(5) 0 5 10 15 20 25 30
High Hedge Fund Concentration
Weak Balance Sheet
High Tax
Domestic Sales
Strong Balance Sheet
Mutual Fund Underweight Positions
Total Cash Return to Shareholder
Hedge Fund Very Important Shorts
Hedge Fund "VIP" List
Low Operating Leverage
Low Hedge Fund Concentration
High Sharpe Ratio
ROE Growth
S&P 500
Earnings Held Overseas
Buyback
High Quality Stock
High Operating Leverage
Dividend Growth
Mutual Fund Overweight Positions
High Revenue Growth
Low Tax
Interest Rate Sensitive
BRICs Sales
International Sales
Western Europe Sales
Dual Beta

December 5, 2014 United States
Goldman Sachs Global Investment Research 13
US Portfolio Strategy Baskets – Relative performance vs. S&P 500
Source: FactSet and Goldman Sachs Global Investment Research.
Macroeconomic Geographic SalesDual Beta Interest Rate Sensitive US Sales International Sales
High vs. LowOperating Leverage
High vs. LowTax Rate BRICs Sales Western Europe Sales
90
95
100
105
110
115
120
Dec
-12
Mar
-13
Jun-
13
Sep-
13
Dec
-13
Mar
-14
Jun-
14
Sep-
14
Dec
-14
Mar
-15
GSTHBETABloomberg <ticker>
96
98
100
102
104
106
108
110
112
Dec
-12
Mar
-13
Jun-
13
Sep-
13
Dec
-13
Mar
-14
Jun-
14
Sep-
14
Dec
-14
Mar
-15
GSTHOPHI/GSTHOPLO
95
100
105
110
115
120
Dec
-12
Mar
-13
Jun-
13
Sep-
13
Dec
-13
Mar
-14
Jun-
14
Sep-
14
Dec
-14
Mar
-15
GSTHUSTY
96
98
100
102
104
106
108
110
Dec
-12
Mar
-13
Jun-
13
Sep-
13
Dec
-13
Mar
-14
Jun-
14
Sep-
14
Dec
-14
Mar
-15
GSTHAINT
82
86
90
94
98
102
106
Dec
-12
Mar
-13
Jun-
13
Sep-
13
Dec
-13
Mar
-14
Jun-
14
Sep-
14
Dec
-14
Mar
-15
GSTHBRIC
94
96
98
100
102
104
106
108
110
Dec
-12
Mar
-13
Jun-
13
Sep-
13
Dec
-13
Mar
-14
Jun-
14
Sep-
14
Dec
-14
Mar
-15
GSTHINTL
95
100
105
110
115
120
Dec
-12
Mar
-13
Jun-
13
Sep-
13
Dec
-13
Mar
-14
Jun-
14
Sep-
14
Dec
-14
Mar
-15
GSTHWEUR
96
101
106
111
116
121
126
Feb-
13
May
-13
Aug-
13
Nov
-13
Feb-
14
May
-14
Aug-
14
Nov
-14
Feb-
15
GSTHHTAX/GSTHLTAX

December 5, 2014 United States
Goldman Sachs Global Investment Research 14
US Portfolio Strategy Baskets – Relative performance vs. S&P 500 (continued)
Source: FactSet and Goldman Sachs Global Investment Research.
Fundamentals Shareholder ReturnRevenue Growth ROE Growth Dividend Yield & Growth Buybacks
High QualityStrong vs. WeakBalance Sheet Total Cash Return Earnings Held Overseas
94
96
98
100
102
104
106
Dec
-12
Mar
-13
Jun-
13
Sep-
13
Dec
-13
Mar
-14
Jun-
14
Sep-
14
Dec
-14
Mar
-15
GSTHREVGBloomberg <ticker>
92
93
94
95
96
97
98
99
100
101
102
Dec
-12
Mar
-13
Jun-
13
Sep-
13
Dec
-13
Mar
-14
Jun-
14
Sep-
14
Dec
-14
Mar
-15
GSTHQUAL
98
99
100
101
102
103
104
105
106
107
Dec
-12
Mar
-13
Jun-
13
Sep-
13
Dec
-13
Mar
-14
Jun-
14
Sep-
14
Dec
-14
Mar
-15
GSTHGROE
98
99
100
101
102
103
104
105
106
107
108
Dec
-12
Mar
-13
Jun-
13
Sep-
13
Dec
-13
Mar
-14
Jun-
14
Sep-
14
Dec
-14
Mar
-15
GSTHDIVG
95
100
105
110
115
120
125
Dec
-12
Mar
-13
Jun-
13
Sep-
13
Dec
-13
Mar
-14
Jun-
14
Sep-
14
Dec
-14
Mar
-15
GSTHCASH
95
100
105
110
115
120
Dec
-12
Mar
-13
Jun-
13
Sep-
13
Dec
-13
Mar
-14
Jun-
14
Sep-
14
Dec
-14
Mar
-15
GSTHREPO
97
98
99
100
101
102
Jul-1
3
Oct
-13
Jan-
14
Apr-1
4
Jul-1
4
Oct
-14
Jan-
15
GSTHSEAS
60
65
70
75
80
85
90
95
100
105
Dec
-12
Mar
-13
Jun-
13
Sep-
13
Dec
-13
Mar
-14
Jun-
14
Sep-
14
Dec
-14
Mar
-15
GSTHSBAL/GSTHWBAL

December 5, 2014 United States
Goldman Sachs Global Investment Research 15
US Portfolio Strategy Baskets – Relative performance vs. S&P 500 (continued)
Source: FactSet and Goldman Sachs Global Investment Research.
Hedge Fund Ownership Mutual FundsHedge Fund VIP Short Positions Overweight Positions Underweight Positions
High Concentration Low Concentration High Sharpe Ratio
95
100
105
110
115
Dec
-12
Mar
-13
Jun-
13
Sep-
13
Dec
-13
Mar
-14
Jun-
14
Sep-
14
Dec
-14
Mar
-15
GSTHHVIPBloomberg <ticker>
95
100
105
110
115
120
125
130
135
Dec
-12
Mar
-13
Jun-
13
Sep-
13
Dec
-13
Mar
-14
Jun-
14
Sep-
14
Dec
-14
Mar
-15
GSTHHFHI
95
96
97
98
99
100
101
102
103
104
105
Dec
-12
Mar
-13
Jun-
13
Sep-
13
Dec
-13
Mar
-14
Jun-
14
Sep-
14
Dec
-14
Mar
-15
GSTHVISP
80
85
90
95
100
105
Dec
-12
Mar
-13
Jun-
13
Sep-
13
Dec
-13
Mar
-14
Jun-
14
Sep-
14
Dec
-14
Mar
-15
GSTHHFSL
95
100
105
110
115
Dec
-12
Mar
-13
Jun-
13
Sep-
13
Dec
-13
Mar
-14
Jun-
14
Sep-
14
Dec
-14
Mar
-15
GSTHMFOW
96
98
100
102
104
106
108
Dec
-12
Mar
-13
Jun-
13
Sep-
13
Dec
-13
Mar
-14
Jun-
14
Sep-
14
Dec
-14
Mar
-15
GSTHSHRP
75
80
85
90
95
100
105
Dec
-12
Mar
-13
Jun-
13
Sep-
13
Dec
-13
Mar
-14
Jun-
14
Sep-
14
Dec
-14
Mar
-15
GSTHMFUW

December 5, 2014 United States
Goldman Sachs Global Investment Research 16
S&P 500 Earnings, Sales and Revisions
Source: FirstCall, I/B/E/S, FactSet, and Goldman Sachs Global Investment Research.
GS Top-Down EPS vs. Consensus Bottom-UpAnnual earnings
Contribution to EPS growth ratesGS Top-Down Bottom-up GS Top-Down Bottom-Up2015E 2016E 2015E 2016E 2015E 2016E 2015E 2016E
Information Technology $24 $25 $25 $28 9 % 6 % 16 % 12 %Health Care 15 17 17 19 8 11 20 13Utilities 4 4 4 4 7 5 5 4Consumer Discretionary 13 13 13 16 6 6 14 15Consumer Staples 10 11 11 12 6 3 6 9Industrials 13 13 13 15 5 7 10 10Telecom Services 3 4 4 4 4 4 7 5Materials 3 4 4 5 (9) 7 15 20Energy 12 13 12 14 (12) 8 (11) 15
S&P 500 ex-Financials 96 103 102 114 4 7 10 12Financials 26 28 25 28 9 11 7 10
S&P 500 Operating EPS $122 $131 $127 $142 5 % 8 % 9 % 12 %
Earnings & Sales Revisions (Consensus)EPS REVISIONS SALES REVISIONS
1 month 3 month 1 month 3 month14E 15E 14E 15E 14E 15E 14E 15E
Information Technology 0.2 % (0.3)% 0.1 % (0.6)% (0.1)% (0.1)% (0.1)% 0.1 %
Health Care 0.2 0.0 0.7 0.1 0.0 0.1 0.3 0.7
Utilities 0.1 (0.0) 0.6 0.2 NM NM NM NM
Consumer Discretionary 0.0 (0.3) (1.8) (2.9) 0.0 (0.1) (0.5) (0.8)
Industrials 0.0 (0.2) 0.6 (1.1) (0.1) (0.2) (0.3) (1.1)
Financials 0.0 0.1 (0.7) (0.4) NM NM NM NM
S&P 500 (0.0) (1.2) (0.8) (3.4) (0.2) (1.0) (0.6) (2.0)
Consumer Staples (0.1) (0.5) (0.8) (2.8) (0.2) (0.2) 0.0 (0.0)
Materials (0.4) (1.2) (0.3) (3.9) (0.1) (0.2) (0.6) (1.7)
Telecom Services (0.5) (0.7) (2.0) (3.1) 0.1 0.3 (0.2) 0.5
Energy (0.6) (9.7) (4.8) (20.9) (0.8) (5.9) (2.7) (10.3)
Earnings Growth (consensus bottom-up)
2014E Earnings Per Share Growth Annual1QA 2QA 3QE 4QE 2014E 2015E
Materials 0 % 44 % 13 % 18 % 17 % 15 %Health Care 6 17 8 29 15 20Information Technology 0 16 9 12 9 16Industrials 8 14 7 8 9 10Financials 6 8 12 9 9 7S&P 500 6 12 10 7 9 9Energy 4 4 22 4 8 (11)Consumer Discretionary 12 10 5 6 8 14Utilities 29 (9) 8 3 7 5Consumer Staples (0) 8 3 (6) 1 6Telecom Services 35 39 21 (49) (4) 7
S&P 500 (ex-Financials) 6 13 9 6 8 10
Sales Growth (consensus bottom-up)
2014E Sales Per Share Growth Annual1QA 2QA 3QE 4QE 2014E 2015E
Health Care 7 % 13 % 12 % 9 % 10 % 6 %Consumer Discretionary 14 8 6 5 8 5Industrials 5 6 4 4 5 3S&P 500 4 6 4 3 4 3Information Technology (2) 6 8 5 4 4Consumer Staples 1 4 3 3 3 5Materials 4 5 (3) (6) (0) 1Energy 2 4 (2) (6) (1) (2)Telecom Services (11) (9) 2 5 (4) 4

December 5, 2014 United States
Goldman Sachs Global Investment Research 17
Valuation: Absolute and Relative
Source: FactSet, I/B/E/S, FirstCall, and Goldman Sachs Global Investment Research.
S&P 500 NTM P/E S&P 500 Cost of Equity = ERP + 10-yr UST
S&P 500 LTM P/B
We estimate the equity risk premium (ERP) using our DDM framework to model expected future cash flows.
We solve for the cost of equity that implies the market is at ‘fair value’ and then deduct the 10-year US treasury.
Current Aggregate Valuation Metrics - Absolute Current vs. 10-year average (Z-score)EV/
SalesEV/
EBITDAPrice/ Book
FCF Yield
PEG Ratio
NTM P/E
EV/ Sales
EV/ EBITDA
Price/ Book
FCF Yield P/E
PEG Ratio
Median Z-Score
S&P 500 1.9x 9.8x 2.9x 4.4 % 1.5x 16.5x S&P 500 2.2 0.7 0.9 1.1 1.9 1.9 1.5Consumer Staples 1.5 12.1 4.9 4.6 2.3 19.3 Telecommunication Services (0.9) (1.3) 2.5 0.6 (1.2) (1.1) (1.0)Consumer Discretionary 1.7 9.8 4.5 3.9 1.2 18.6 Energy (1.7) (1.3) (2.4) 0.4 0.2 (0.4) (0.8)Health Care 2.1 12.9 4.3 4.8 1.5 18.2 Utilities NM (0.4) (1.1) (0.3) (0.4) (0.4) (0.4)Materials 1.9 9.7 3.2 3.1 1.5 17.1 Financials NM NM (0.6) NM (0.3) 0.1 (0.3)Utilities NM 9.1 1.8 0.0 3.1 17.1 Consumer Discretionary 0.4 (0.2) 1.4 (0.1) (0.4) (0.9) (0.1)Industrials 2.1 11.2 3.4 4.9 1.5 16.7 Materials 0.0 (0.1) (0.2) 0.9 (0.2) (0.1) (0.1)Information Technology 3.3 11.1 4.4 6.0 1.4 16.5 Industrials (1.4) (0.3) 0.2 0.5 (0.6) 0.2 (0.1)Energy 1.3 5.9 1.8 1.1 1.2 14.4 Information Technology 1.6 (0.1) (0.0) (0.7) (0.5) 0.3 (0.1)Financials NM NM 1.4 NM 1.5 14.1 Health Care 0.7 2.3 1.9 1.1 0.6 (0.6) 0.9Telecommunication Services 2.2 5.5 3.2 7.3 2.1 13.9 Consumer Staples (0.2) 1.1 1.1 (1.2) 0.9 1.6 1.0
16.5
0
5
10
15
20
25
30
1/76 1/81 1/86 1/91 1/96 1/01 1/06 1/11 1/16
NTM
P/E
(x)
10-yr rolling avg
P/E
2.9
0
12
3
45
6
1/76 1/81 1/86 1/91 1/96 1/01 1/06 1/11 1/16
LTM
P/B
(x)
10-yr rolling avg
P/B 0.0
2.0
4.0
6.0
8.0
10.0
Dec
-12
Mar
-13
Jun-
13
Sep
-13
Dec
-13
Mar
-14
Jun-
14
Sep
-14
Dec
-14
Mar
-15
Cost ofEquity
10 YearUST
ERP5.2%
2.3%
7.5%

December 5, 2014 United States
Goldman Sachs Global Investment Research 18
Fund Flows, Correlation and Dispersion
Source: FactSet, Lipper, and Goldman Sachs Global Investment Research.
Domestic equity fund flows
(8)
(6)
(4)
(2)
0
2
4
6
8
10
12
Dec
-12
Mar
-13
Jun-
13
Sep
-13
Dec
-13
Mar
-14
Jun-
14
Sep
-14
Dec
-14
Mar
-15
$ B
illio
ns
Domestic equity fund flows (4wk avg)
Mutual funds
ETFs
Net flows
Sector and Stock Correlation
0.34
0.65
0.1
0.2
0.3
0.4
0.5
0.6
0.7
0.8
0.9
Dec
-12
Mar
-13
Jun-
13
Sep
-13
Dec
-13
Mar
-14
Jun-
14
Sep
-14
Dec
-14
Mar
-15
Ave
rage
Cor
rela
tion
Average stock correlation
Average sector correlation
Weekly mutual fund flowsLipper Weekly Mutual Fund Flows, ex-ETFs ($ billions)
Total Lipper Weekly Flows Total Flows Inflow/(Outflow)Assets 4-Week Avg 2014 YTD (Cons. Weeks)
All Equity 3,840 (1.9) 49.1 (2)
U.S. Equity 2,698 (1.4) 1.6 (2)
Int'l Equity 860 (0.2) 39.5 (2)
Global 282 (0.3) 8.0 (4)
Equity Income 191 (0.1) (2.2) (3)
Gold & Nat Res 43 0.0 10.4 (1)
Money Market 2,382 12.0 (23.4) 7
All Taxable Bond 2,022 2.5 111.8 17
Gov't Treasury 27 0.0 (0.2) (1)
Return Dispersion+/- 1 Standard Deviation
1-Month Returns 3-Month Returns
Current 30-Year Historical Current 30-Year HistoricalDec 4 Average %ile Dec 4 Average %ile
S&P 500 13 pp 17 pp 18 % 26 pp 29 pp 42 %
Energy 20 pp 14 pp 88 % 30 pp 24 pp 82 %
Materials 8 15 2 27 26 64
Consumer Staples 10 13 31 18 21 31
Telecom Services 12 13 57 14 23 29
Health Care 9 15 8 19 25 24
Industrials 8 14 5 19 24 24
Utilities 5 10 2 11 18 19
Consumer Discretionary 11 17 4 23 29 19
Financials 10 14 33 15 23 12
Information Technology 12 20 5 19 36 2

December 5, 2014 United States
Goldman Sachs Global Investment Research 19
US Economics
Our Current Activity Indicator (CAI) measures the growth signal in major high-frequency activity indicators for the US economy, expressed in GDP-equivalent units.
Our Global Leading Indicator (GLI) aggregates 10 global macro time series to provide an early signal of the global industrial cycle. Our “swirlogram” uses GLI growth and acceleration to define four cycle phases.
Source: FactSet and Goldman Sachs Global Investment Research.
GDP Current Activity (CAI) Global Leading Indicator (GLI)
Core PCE and CPI Economic Surprise (MAP) Financial Conditions (FCI)
1.0
1.2
1.4
1.6
1.8
2.0
2.2
Dec
-12
Mar
-13
Jun-
13
Sep-
13
Dec
-13
Mar
-14
Jun-
14
Sep-
14
Dec
-14
Mar
-15
Year
ove
r Yea
r cha
nge
(%)
Core CPI
Core PCE
99.4
99.5
99.6
99.7
99.8
99.9
100.0
100.1
100.2
100.3
100.4
100.5
Dec
-12
Mar
-13
Jun-
13
Sep-
13
Dec
-13
Mar
-14
Jun-
14
Sep-
14
Dec
-14
Mar
-15
Financial Conditions Index
Tighter
Looser
0.0
0.5
1.0
1.5
2.0
2.5
3.0
3.5
4.0
4.5
5.0
Dec
-12
Mar
-13
Jun-
13
Sep-
13
Dec
-13
Mar
-14
Jun-
14
Sep-
14
Dec
-14
Mar
-15
Current Activity Indicator
2.7
1.8
4.5
3.5
(2.1)
4.6
3.9
2.4 3.0 3.0 3.0 3.0
(3.0)%
(2.0)%
(1.0)%
0.0 %
1.0 %
2.0 %
3.0 %
4.0 %
5.0 %
6.0 %
Q1 Q2 Q3 Q4 Q1 Q2 Q3 Q4 Q1 Q2 Q3 Q4
GD
P G
row
th (q
oq a
nnua
lized
%)
2013 2014 2015
Goldman SachsEconomics
Consensus
(100)
(75)
(50)
(25)
0
25
50
75
100D
ec-1
2
Mar
-13
Jun-
13
Sep-
13
Dec
-13
Mar
-14
Jun-
14
Sep-
14
Dec
-14
Mar
-15
Rol
ling
1-M
onth
US-
MAP
Sco
re
Rolling 1-MonthUS MAP Score
PositiveData Surprises
NegativeData Surprises
Nov-14
Dec-12
(0.08)%
(0.06)%
(0.04)%
(0.02)%
0.00 %
0.02 %
0.04 %
0.06 %
(0.2)% (0.1)% 0.0 % 0.1 % 0.2 % 0.3 % 0.4 % 0.5 %
GLI
Acc
eler
atio
n
GLI Growth
Expansion
Slowdown
Recovery
Contraction

December 5, 2014 United States
Goldman Sachs Global Investment Research 20
Goldman Sachs Global Macro Forecasts
Source: FactSet and Goldman Sachs Global Investment Research.
Goldman Sachs Global Macro Forecasts
units Current 3m 6m 12m TargetEquities
TOPIX level 1441 1450 1550 1650 15 %STOXX Europe 600 level 345 360 375 390 13Asia Pac Ex-Japan level 475 490 505 520 10S&P 500 level 2072 2100 2150 2100 1
Ten Year RatesUS % 2.3 2.6 2.8 3.0 74 bpEuro Area (Germany) % 0.7 1.1 1.2 1.3 52Japan % 0.4 0.7 0.7 0.8 37
CurrenciesUS Dollar / Yen $/¥ 120 120 125 130 9 %Sterling / US Dollar £/$ 1.57 1.60 1.58 1.53 (3)Euro / US Dollar EUR/$ 1.24 1.23 1.20 1.15 (8)
EnergyBrent Crude Oil $/bbl 70 85 80 85 22 %WTI Crude Oil $/bbl 67 75 70 75 12NYMEX Nat. Gas $/mmBtu 3.65 4.00 4.10 4.00 10
MetalsLME Copper $/mt 6491 6600 6200 6000 (8)%COMEX Gold $/troy oz 1208 1195 1135 1050 (13)
EPS Forecast EPS Growth NTM P/E Div
2013 2014 2015 2014 2015 Current YE 2014 Yield
TOPIX ¥ 81 ¥ 91 ¥ 111 12 % 22 % 15.9 x 12.9 x 1.9 %
STOXX Europe 600 € 21 € 22 € 23 6 6 15.7 14.6 3.6
Asia Pac(Ex-Japan) $ 35 $ 37 $ 40 6 7 12.7 12.3 3.3
S&P 500 $ 107 $ 116 $ 122 9 5 17.8 16.8 2.1
Goldman Sachs US Economics Forecasts% Annual Change
2013 2014E 2015EReal GDP 2.2% 2.3% 3.1%
Consumer Spending 2.4 2.3 3.0Total Fixed Investment 4.7 5.1 6.5
Business Fixed Investment 3.0 5.9 5.6Residential Investment 11.9 2.0 9.7
Federal Government Spending (5.7) (1.9) (1.4)State and Local Government 0.5 0.9 1.8Net Exports (Bil.) (420) (442) (471)
InflationHeadline CPI 1.5 1.7 1.3Core CPI 1.8 1.8 1.9Core PCE 1.3 1.4 1.5
Unemployment Rate 7.4 6.2 5.6Fed Funds Rate 0.1 0.1 0.610-year Treasury Rate 3.0 2.5 3.0
Global Equity Market performancePrice Return (%) US Dollar Local
Market 1-Week 1-Month 3-Month 2014 YTD Currency
U.S. (S&P 500) (0)% 3 % 4 % 12 % 12 %China (MSCI China) 0 2 (4) 4 4Japan (TOPIX) 1 (0) (2) (3) 11Spain (IBEX 35) (1) 3 (8) (3) 7Europe (DJ Stoxx 600) (1) 3 (5) (5) 5Australia (ASX 200) (2) (6) (15) (6) 0UK (FTSE 100) (1) 2 (7) (6) (1)Korea (KOSPI) (0) (1) (12) (7) (1)Germany (Dax) (1) 6 (3) (7) 3Mexico (Bolsa) (7) (8) (14) (7) 0Brazil (Bovespa) (10) (8) (27) (9) (0)France (CAC 40) (2) 4 (8) (9) 1
Average (2)% (0)% (8)% (4)% 3 %

Goldman Sachs Global Investment Research 21


