us subprime crisis
Post on 19-Oct-2014
2.938 views
DESCRIPTION
The project gives a detailed understanding of the US Sub prime Crisis and how things unfolded. Though the scope of the project is limited to a specific time frame, the project report entails all the nitty gritties of the occurrence of eventsTRANSCRIPT
0
The U.S. Sub-prime Crisis – A Study of the recent economic development in the U.S. and their likely impact on the Indian Economy
A report submitted in partial fulfillment of the requirements of MBA program at ICFAI Business School, Ahmedabad.
Submitted to: Submitted to: Prof. Vivek Ranga Mr. Sunil Chandra Faculty Guide (Country Head-DPM) IBS, Ahmedabad. Almondz Global Securities Ltd.
1
A REPORT ON
The U.S. Sub-prime Crisis – A Study of the recent economic development in the U.S. and their likely impact on the Indian Economy
BY
PARAMJEET KAUR
AT ALMONDZ GLOBAL SECURITIES LIMITED
NEW DELHI
A report submitted in partial fulfillment of the requirements of MBA program at ICFAI Business School, Ahmedabad.
Submitted to: Submitted to: Prof. Vivek Ranga Mr. Sunil Chandra Faculty Guide (Country Head-DPM) IBS, Ahmedabad. Almondz Global Securities Ltd.
2
SUMMER INTERNSHIP PROGRAMME
The U.S. Sub-prime Crisis – A Study of the recent economic development in the U.S. and their likely impact on the Indian Economy
Submitted By: Name: Paramjeet Kaur Enrollment No.:07 BS 2784
Mobile No.:09974339611 Email ID:[email protected]

3

4
ACKNOWLEDGEMENT
Across the road to the Corporate World, Unknown pursuits came my way. A ‘Thanks’ would be too small a token, for all that with what I stand today!
The fourteen weeks Summer Internship Programme needs a laudable appreciation for the novel experience of practical knowledge and the true insights of the clichéd Corporate Culture. Thanking all the affiliates’, veterans in knowledge and virtuoso in experience would be a mere token of gratitude, which may not be sufficient for all the knowledge imparted, and all the blessings bestowed upon me.
I would like to express my immense gratitude to Mr. Sunil Chandra (Country Head, Debt Portfolio Management) for guiding me throughout the whole project with his impeccable knowledge. I owe my gratitude to Ms. Rajni Dasgupta (Vice President) who taught me the first lesson of corporate culture. Mr. Abhilash Kumar (Manager) owes a special mention for the invaluable insights that he provided me, which would be carried forward as a legacy of knowledge and learning all through my life.
I am also thankful to all the staff members’ of Almondz Global Securities Limited, who have always guided me whenever I needed help and acquainted me with the minutest details of etiquettes and behavioral aspects.
I sincerely thank Mr. Vivek Ranga, who has always been a continuous source of encouragement all through the project. I am also thankful to my faculty members and Prof. P. Bala Bhaskaran for guiding me all the way. All the more, ICFAI University needs to be praised which has provided the students with such a bright opportunity to have an exposure of the real corporate environment for the valuable period of three and a half months to get the corporate ambience imprinted on our minds to carry forward the learning’s of this first tryst with corporates in the future struggle in the path of professional success.
Last but not the least, a special mention must be made to all those who have knowingly and unknowingly helped me in the completion of this project. I owe my gratitude to my parents who have always encouraged me in the pursuit of excellence.
Paramjeet Kaur 07 BS 2784
5
TTAABBLLEE OOFF CCOONNTTEENNTTSS
ABSTRACT 10
INTRODUCTION 11
Purpose of the Study 11
Scope of the Study 12
Limitations of the Study 12
Methodology of the Study 13
INTRODUCTION 14
HOUSING MARKETS IN U.S.A.: Major Contributor to Growth 16
Homeownership‐ The American Dream 16
Economic Impacts of the Housing Sector 18
Housing Sector having Macro‐economic Implications 20
Impact on Communities 20
Impact on Individuals 21
Housing Contribution to Society 22
LEVERAGED SECURITY MARKETS: The Double Edged Sword 23
Leveraging 23
Housing Sector: The Initial Fuel 23
Securitization: Prime Mover of the Crisis 24
Sub‐prime Crisis: A result of Leveraging 26
SUB‐PRIME LENDING: The Flaws 29
THE CRISIS AND CHRONONOLOGY OF EVENTS: Timeline of Implosion 32
Chronology of Events 36
6
THE PARTIES IN THE CRISIS AND THEIR ROLE: Walking the Line 53
Role of Borrowers 53
Role of Financial Institutions 55
Role of Securitization 56
Role of Mortgage Brokers and Mortgage Underwriters 57
Role of Government and Regulators 58
Role of Credit Rating Agencies 58
Role of Central Banks 59
IMPACT OF THE CRISIS ON THE U.S.A.: Entering A Possible Recession 61
Collapsing US Housing markets 63
Unemployment 68
Fed rate cut 69
Inflation 70
Falling dollar 71
Widening fiscal deficit 75
US GDP growth 77
IMPACT OF THE CRISIS ON THE WORLD FINANCIAL MARKETS 78
Impact on the Commodities Markets: Markets pivot on its head 82
Gold Markets 83
Crude Oil 85
Metals 86
On Stock Markets: Gravity proves itself 87
On Some of the Larger Economies: Euro and Japanese 91
7
IMPACT ON INDIA 96
The First Signs: First Blood 98
On Financial Markets: Stock Markets lose their Sheen 100
On Commodities markets with special emphasis on Crude oil: A fuel to inflation 102
On Money Markets and Interest Rates: The Hinges of Growth 104
On INR: Challenging the might of the Dollar 107
Indian Housing Markets: Following the Footsteps 109
On Indian Economy: Structural Changes: The proverbial struggle of Good vs. Bad 112
THE NEW WORLD ORDER: Rise Of the Behemoth 114
APPENDIX
Appendix 1: Borrowers Protection Act 2007 118
Appendix 2: Beige Book 125
Appendix 3: Fico Scores 127
Appendix 4: Role of Freddie Mac and Fannie Mae 129
Appendix 5: Housing Market Correction & Bursting of Housing Bubble 131
Appendix 6: Asian Currency Crisis 131
Appendix 7: Russian debt Crisis 132
Appendix 8: Long‐Term Capital Management 133
Appendix 9: Relation between Crude Oil & Dollar Value 134
Appendix 10: Relation between Gold Prices & Dollar Value 136
Appendix 11: Relation between Crude Oil & Gold Prices 138
Appendix 12: Theory of Decoupling 140
GLOSSARY 141
BIBLIOGRAPHY 143
8
TTAABBLLEE OOFF FFIIGGUURREESS AANNDD IILLLLUUSSTTRRAATTIIOONNSS
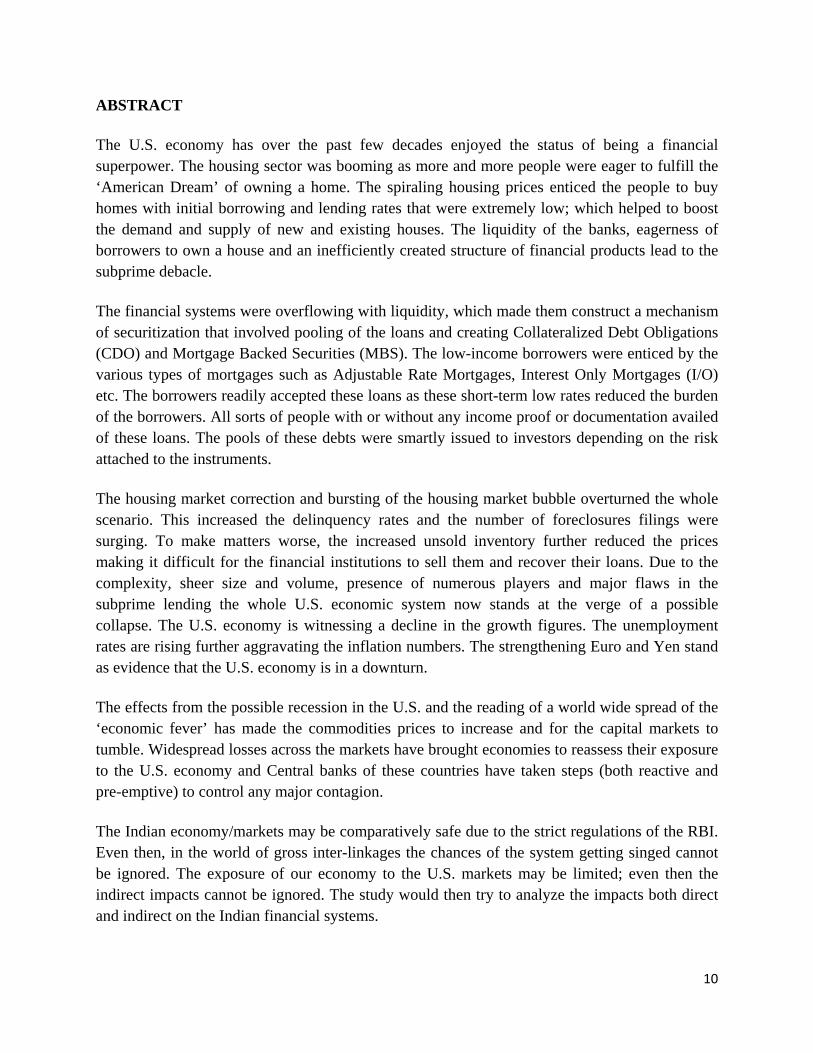
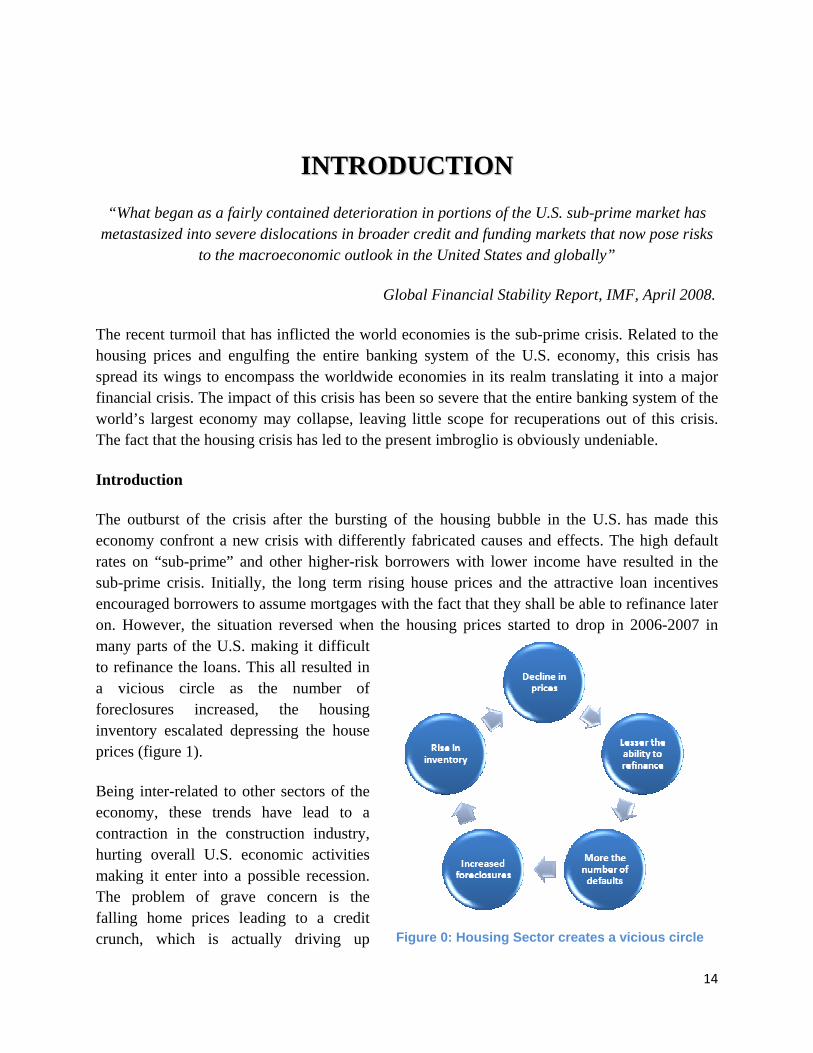
Figure 1: Housing Sector creates a vicious circle 14
Figure 2: Real Median Household Income 17
Figure 3: Homeownership trends in USA (in '000) 18
Figure 4: Mechanism of Securitization 25
Figure 5: Timeline of Implosion 34
Figure 6: US Foreclosure Filings 55
Figure 7: Home Ownerships in US 57
Figure 8: Relative Size of Variable Interest Rate Mortgages 65
Figure 9: Home Price Indices 65
Figure 10: Foreclosure starts rate 66
Figure 11: Unemployment in USA 68
Figure 12: Fed Rate cuts in US 69
Figure 13: Inflation Rate in USA 70
Figure 14: USD vs. Euro (Interbank Rate) 72
Figure 15: USD vs. JPY (Interbank Rate) 73
Figure 16: U.S. Treasury Yield Curve Rate 73
Figure 17: Federal Fiscal Position 75
Figure 18: US Economic Growth 77
Figure 19: World Economic Growth 79
Figure 20: Growth figures forecasted by IMF 80
Figure 21: Commodity Prices across the world 82
Figure 22: Gold Prices in USD/Ounces 83
Figure 23: Oil Prices in USD/Barrel 85
Figure 24: Base Metal Indices 86
9
Figure 25: Major stock market indices 87
Figure 26: Dow Jones Index 88
Figure 27: NASDAQ Index 89
Figure 28: Nikkei 225 Index 89
Figure 29: DAX Index 90
Figure 30: Main developments in major industrialized economies 91
Figure 31: BSE Sensex 100
Figure 32: Nifty Index 100
Figure 33: Bank Nifty 101
Figure 34: CRR (Cash Reserve Ratio) 104
Figure 35: Call Money Borrowing 105
Figure 36: INR vs. USD 107
Figure 37: Percentage Distribution of GDP as per sectors 112
TTAABBLLEE OOFF BBOOXXEESS
Box 1: Mechanism of Leveraging 26
Box 2: Types of Borrowers 54
Box 3: Predatory Lending Practices 57
Box 4: Potential Subprime Losses 61
Box 5: Main Credit Losses so Far 62
Box 6: Projected Economic Losses 67
Box 7: Major Market Falls in January 2008 87
Box 8: House Price Developments In Central & Eastern European Countries 93
Box 9: Indian Companies with Foreign Losses 98
Box 10: Market Intervention by RBI 108
10
ABSTRACT
The U.S. economy has over the past few decades enjoyed the status of being a financial superpower. The housing sector was booming as more and more people were eager to fulfill the ‘American Dream’ of owning a home. The spiraling housing prices enticed the people to buy homes with initial borrowing and lending rates that were extremely low; which helped to boost the demand and supply of new and existing houses. The liquidity of the banks, eagerness of borrowers to own a house and an inefficiently created structure of financial products lead to the subprime debacle.
The financial systems were overflowing with liquidity, which made them construct a mechanism of securitization that involved pooling of the loans and creating Collateralized Debt Obligations (CDO) and Mortgage Backed Securities (MBS). The low-income borrowers were enticed by the various types of mortgages such as Adjustable Rate Mortgages, Interest Only Mortgages (I/O) etc. The borrowers readily accepted these loans as these short-term low rates reduced the burden of the borrowers. All sorts of people with or without any income proof or documentation availed of these loans. The pools of these debts were smartly issued to investors depending on the risk attached to the instruments.
The housing market correction and bursting of the housing market bubble overturned the whole scenario. This increased the delinquency rates and the number of foreclosures filings were surging. To make matters worse, the increased unsold inventory further reduced the prices making it difficult for the financial institutions to sell them and recover their loans. Due to the complexity, sheer size and volume, presence of numerous players and major flaws in the subprime lending the whole U.S. economic system now stands at the verge of a possible collapse. The U.S. economy is witnessing a decline in the growth figures. The unemployment rates are rising further aggravating the inflation numbers. The strengthening Euro and Yen stand as evidence that the U.S. economy is in a downturn.
The effects from the possible recession in the U.S. and the reading of a world wide spread of the ‘economic fever’ has made the commodities prices to increase and for the capital markets to tumble. Widespread losses across the markets have brought economies to reassess their exposure to the U.S. economy and Central banks of these countries have taken steps (both reactive and pre-emptive) to control any major contagion.
The Indian economy/markets may be comparatively safe due to the strict regulations of the RBI. Even then, in the world of gross inter-linkages the chances of the system getting singed cannot be ignored. The exposure of our economy to the U.S. markets may be limited; even then the indirect impacts cannot be ignored. The study would then try to analyze the impacts both direct and indirect on the Indian financial systems.
11
INTRODUCTION
The whole world being linked with the common ties of globalization has necessitated the study of the turbulence in the U.S. economy and its impacts on the world with special relevance to the Indian economy. The subprime crisis and its effects on the U.S. economy and the world economies have been studied in detail moving onto the Indian economy.
PURPOSE OF THE STUDY
The main objective of the study is to have:
• An understanding of the ongoing Sub-prime crisis • The impact on Financial Markets, Commodities Markets (Crude Oil), Money Market of
our country • Study its impact on U.S.A, developed economies and the Indian Economy. • Future implications on the World Economic system in general. • Study the possible impact it may have on India. • Expected changes to the Indian Economy post Subprime Crisis
The world economies are at present passing through one of the most difficult phases in recent times. The sub-prime crisis, which has its roots in the U.S., threatens to rage onto the other developed economies eventually to scathe the emerging market economies in wake. Sitting in India, we may appear, at present, seem to be unaffected by the world economic problems. Statements by heads of important agencies have time and again impressed that the Indian economy has a very little exposure to the subprime and that, aside from scratches, the economy, in general, would walk tall.
However, in spite of the Indian economic systems seemingly direct insulation from the impacts, the fact remains that in the world of integrated economic systems, the U.S. recession is bound to test the resilience of the domestic economy. Already the stock markets, which seem to have the maximum exposure, have entered into a highly unpredictable and volatile state. The domino effect on the other sectors would take some more time to incident.
12
SCOPE OF THE STUDY
The project involves studying the subprime crisis as a whole. The main topics under this project are - Housing markets in the U.S.A, Leveraged Security Market & the Process of Subprime Lending. A study of the chronology of events will also be made to ascertain its incidence and the way it turned into a huge crisis engulfing the global economies. The project will also involve studying the parties in the crisis such as borrowers, lenders, banks etc. and their role.
After having an insight of all this the project shall move on to the impact and implications on U.S., some leading world economies and finally India. This will include studying:
• The Commodities Market with special emphasis on the Crude oil market and how it effects inflation.
• The Stock Markets of the world • Overall effect of subprime crisis on the money markets and interest rates in India. • Changes in forex rate of INR and the U.S.D. • The Structural Changes of Indian economy posed by the subprime crisis will also
be done.
LIMITATIONS OF THE STUDY
Subprime crisis and the fallouts to the economy thereof is a very expansive area that has gripped the biggest economy of the world. No matter how deep one goes into it, the chances of understanding it to the core may be difficult. The study would also not include aspects that are topical to U.S.A and would include
only those that are relevant in the Indian context or, which may have a bearing on India. Due to the ‘lag effect’ all the resultants may not manifest itself at the time of the study, so
while a theoretical study may be made, a comparison of the actual results may leave a lot wanting.

13
METHODOLOGY
The methodology comprises an in-depth search of various news articles, journals, reports, relevant laws and other literary work on this topic.
The report involves an analysis of the latest movements in the U.S. and the Indian Financial Markets. A search on the internet and books is another aid to the successful completion. A systematic approach has been followed which involves concentrating on the lowest
level accentuating the role of various parties who were party to the entire debacle. The next level of the study involved studying the timeline of how it transformed into such a huge problem. The impact of U.S. economy, then the inter-related world economies is the next step under the study. Finally the subprime crisis spreading its wings to the Indian Economy will be studied.
14
IINNTTRROODDUUCCTTIIOONN
“What began as a fairly contained deterioration in portions of the U.S. sub-prime market has metastasized into severe dislocations in broader credit and funding markets that now pose risks
to the macroeconomic outlook in the United States and globally”
Global Financial Stability Report, IMF, April 2008.
The recent turmoil that has inflicted the world economies is the sub-prime crisis. Related to the housing prices and engulfing the entire banking system of the U.S. economy, this crisis has spread its wings to encompass the worldwide economies in its realm translating it into a major financial crisis. The impact of this crisis has been so severe that the entire banking system of the world’s largest economy may collapse, leaving little scope for recuperations out of this crisis. The fact that the housing crisis has led to the present imbroglio is obviously undeniable.
Introduction
The outburst of the crisis after the bursting of the housing bubble in the U.S. has made this economy confront a new crisis with differently fabricated causes and effects. The high default rates on “sub-prime” and other higher-risk borrowers with lower income have resulted in the sub-prime crisis. Initially, the long term rising house prices and the attractive loan incentives encouraged borrowers to assume mortgages with the fact that they shall be able to refinance later on. However, the situation reversed when the housing prices started to drop in 2006-2007 in many parts of the U.S. making it difficult to refinance the loans. This all resulted in a vicious circle as the number of foreclosures increased, the housing inventory escalated depressing the house prices (figure 1).
Being inter-related to other sectors of the economy, these trends have lead to a contraction in the construction industry, hurting overall U.S. economic activities making it enter into a possible recession. The problem of grave concern is the falling home prices leading to a credit crunch, which is actually driving up Figure 0: Housing Sector creates a vicious circle
15
mortgage rates and making mortgages unavailable, leading to a further decline in home prices.
The whole carnage revolves around sub-prime lending by financial institutions. These institutions being accompanied by other parties such as Credit Rating Agencies, Mortgage Brokers and Underwriters etc. created a complex structure of lending and borrowing process, through the process of securitization. Being unified with common ties of globalization this American fiasco soon turned into a worldwide crisis affecting the major economies of the world.
This project studies the entire housing sector, which saw great heights and steep depths within a very short period of time. How the booming housing sector, which was a major asset of the weakest people of the society through innovative instruments and loans facilitated by various parties, saw its downfall is an interesting part, which is analyzed. Being one of the pillars of the American economy, how the movement in this pillar affected the whole economy inter-linked in various dimensions of employment, finances, and other macro-economic indicators (inflation, currency etc) has been thoroughly done. The world bonded by the Theory of Decoupling has seen new changes in growth brackets, trade movements and other global changes throughout this period.
Being an emerging economy, the Indian economy has also seen new pursuits in its economic framework and there still remain unknown pursuits and dimensions connected to the global economic architecture.
This project thus has various pursuits to explore about the American economy, world economies and Indian economy. There is a whole gamut of linkages between, inter-related and intra-related sectors, which have been studied in this project.
16
HHOOUUSSIINNGG MMAARRKKEETTSS IINN UU..SS..AA
MMaajjoorr CCoonnttrriibbuuttoorrss ttoo GGrroowwtthh
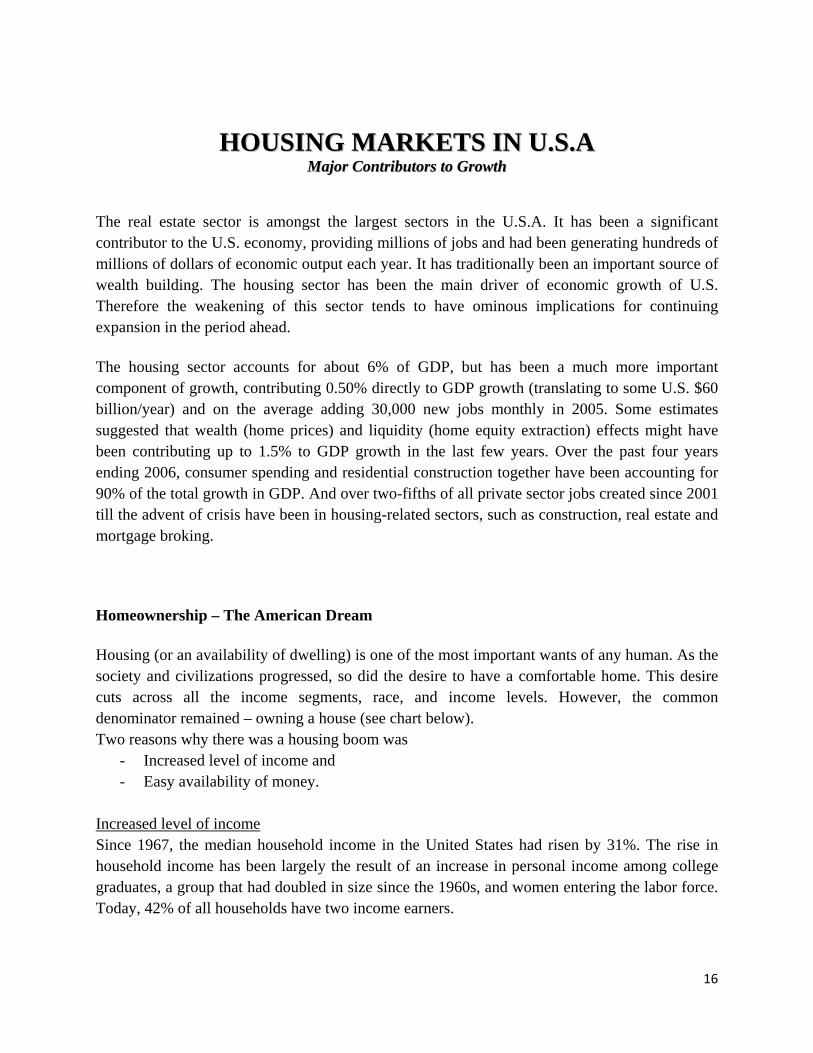
The real estate sector is amongst the largest sectors in the U.S.A. It has been a significant contributor to the U.S. economy, providing millions of jobs and had been generating hundreds of millions of dollars of economic output each year. It has traditionally been an important source of wealth building. The housing sector has been the main driver of economic growth of U.S. Therefore the weakening of this sector tends to have ominous implications for continuing expansion in the period ahead.
The housing sector accounts for about 6% of GDP, but has been a much more important component of growth, contributing 0.50% directly to GDP growth (translating to some U.S. $60 billion/year) and on the average adding 30,000 new jobs monthly in 2005. Some estimates suggested that wealth (home prices) and liquidity (home equity extraction) effects might have been contributing up to 1.5% to GDP growth in the last few years. Over the past four years ending 2006, consumer spending and residential construction together have been accounting for 90% of the total growth in GDP. And over two-fifths of all private sector jobs created since 2001 till the advent of crisis have been in housing-related sectors, such as construction, real estate and mortgage broking.
Homeownership – The American Dream
Housing (or an availability of dwelling) is one of the most important wants of any human. As the society and civilizations progressed, so did the desire to have a comfortable home. This desire cuts across all the income segments, race, and income levels. However, the common denominator remained – owning a house (see chart below). Two reasons why there was a housing boom was
- Increased level of income and - Easy availability of money.
Increased level of income Since 1967, the median household income in the United States had risen by 31%. The rise in household income has been largely the result of an increase in personal income among college graduates, a group that had doubled in size since the 1960s, and women entering the labor force. Today, 42% of all households have two income earners.
17
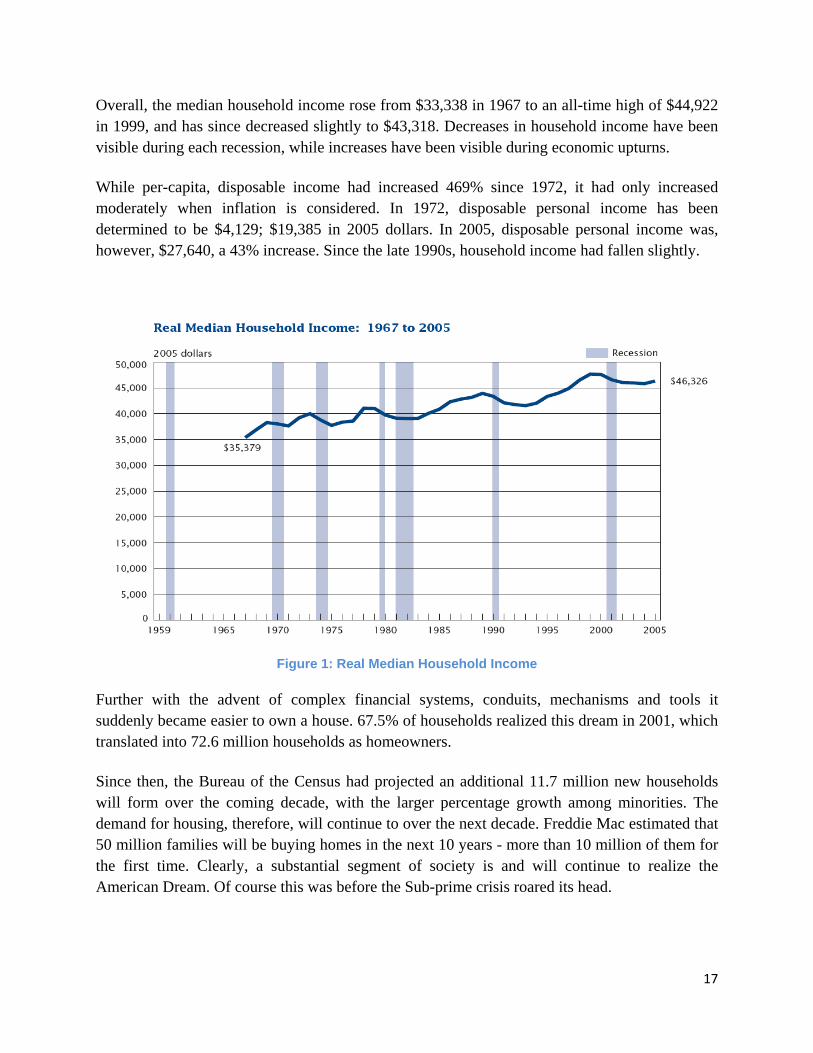
Overall, the median household income rose from $33,338 in 1967 to an all-time high of $44,922 in 1999, and has since decreased slightly to $43,318. Decreases in household income have been visible during each recession, while increases have been visible during economic upturns.
While per-capita, disposable income had increased 469% since 1972, it had only increased moderately when inflation is considered. In 1972, disposable personal income has been determined to be $4,129; $19,385 in 2005 dollars. In 2005, disposable personal income was, however, $27,640, a 43% increase. Since the late 1990s, household income had fallen slightly.
Figure 1: Real Median Household Income
Further with the advent of complex financial systems, conduits, mechanisms and tools it suddenly became easier to own a house. 67.5% of households realized this dream in 2001, which translated into 72.6 million households as homeowners.
Since then, the Bureau of the Census had projected an additional 11.7 million new households will form over the coming decade, with the larger percentage growth among minorities. The demand for housing, therefore, will continue to over the next decade. Freddie Mac estimated that 50 million families will be buying homes in the next 10 years - more than 10 million of them for the first time. Clearly, a substantial segment of society is and will continue to realize the American Dream. Of course this was before the Sub-prime crisis roared its head.
18
55,6
52
63,4
52
56,8
44
57,9
15
58,7
00
59,7
55
60,2
48
61,0
10
61,8
23
62,9
99
63,1
31
64,7
40
66,0
41
67,1
43
68,6
37
70,0
98
71,2
50
72,5
93
71,2
78
72,0
53
73,5
75
74,5
53
75,3
78
75,1
59
30,6
95 31,7
31
32,2
99
32,6
02
33,3
20
33,7
35
33,9
75
34,2
43
34,5
69
34,7
30
35,5
59
35,2
46
34,9
43
35,0
59
34,8
96
34,8
31
34,4
70
34,4
17
33,6
87
33,5
06
33,0
14
33,6
78
34,1
94
35,1
47
8,90
8 9,44
8
10,1
64
10,5
85
11,6
33
12,2
41
12,0
58
11,9
25
11,9
87
12,2
58
12,6
69
13,1
53
13,4
18
13,7
47
14,1
14
13,9
08
14,4
68
14,3
15
15,2
76
15,5
98
15,6
95
16,4
37
17,6
52
12,0
24
127,
958
126,
009
123,
926
122,
187
120,
835
119,
280
121,
478
119,
628
119,
043
117,
280
115,
620
114,
137
112,
655
110,
948
109,
716
108,
317
107,
277
106,
281
105,
731
103,
653
101,
102
99,3
07104,
631
95,2
55
0
20000
40000
60000
80000
100000
120000
140000
1984 1985 1986 1987 1988 1989 1990 1991 1992 1993 1994 1995 1996 1997 1998 1999 2000 2001 2002 2003 2004 2005 2006 2006
Vacant TotalRenter TotalOwner Total
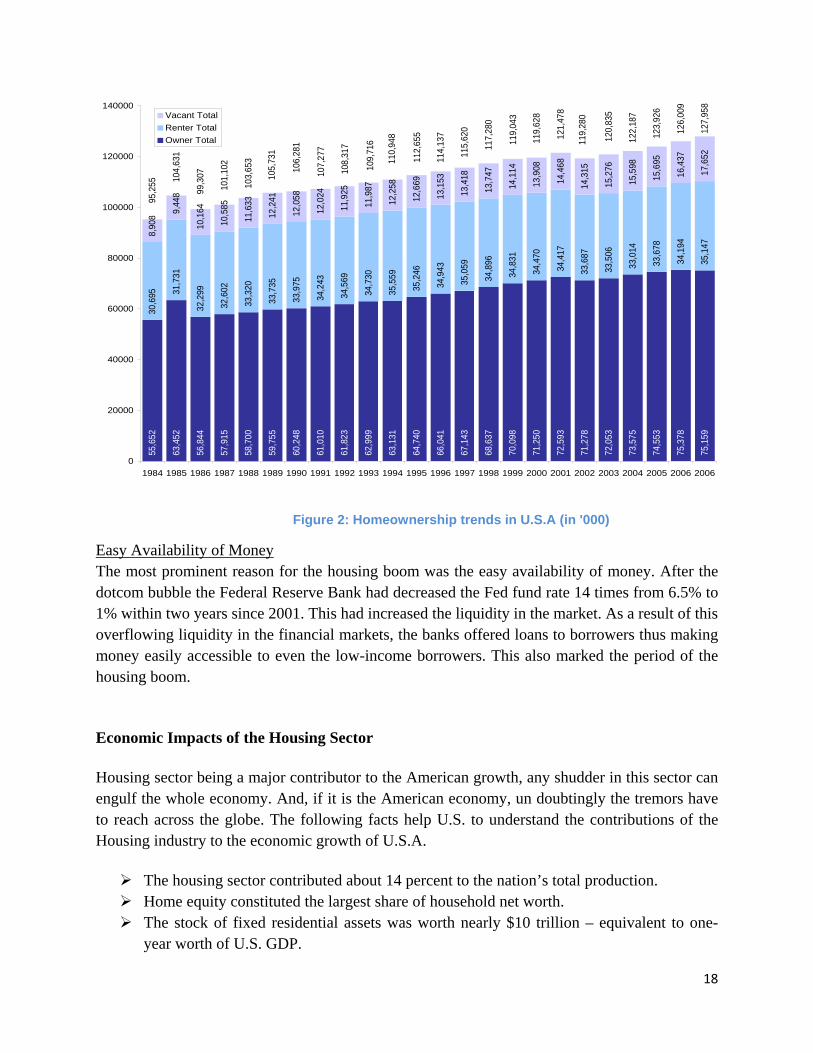
Figure 2: Homeownership trends in U.S.A (in '000)
Easy Availability of Money The most prominent reason for the housing boom was the easy availability of money. After the dotcom bubble the Federal Reserve Bank had decreased the Fed fund rate 14 times from 6.5% to 1% within two years since 2001. This had increased the liquidity in the market. As a result of this overflowing liquidity in the financial markets, the banks offered loans to borrowers thus making money easily accessible to even the low-income borrowers. This also marked the period of the housing boom.
Economic Impacts of the Housing Sector
Housing sector being a major contributor to the American growth, any shudder in this sector can engulf the whole economy. And, if it is the American economy, un doubtingly the tremors have to reach across the globe. The following facts help U.S. to understand the contributions of the Housing industry to the economic growth of U.S.A.
The housing sector contributed about 14 percent to the nation’s total production. Home equity constituted the largest share of household net worth. The stock of fixed residential assets was worth nearly $10 trillion – equivalent to one-
year worth of U.S. GDP.
19
About 1.5 million newly housing units were started each year. Housing starts have been one of the key factors in the macroeconomic business cycle. About 40 percent of monthly consumer expenditures were housing related. More than $1 trillion exchanged hands from the sale of existing and new homes. There were 288,273 establishments categorized as “real estate & rental & leasing with
over 1.7 million paid employees. 40% of the employment growth in the entire economic expansion was a result of soaring
home sales and prices. This included employment in home building directly as well as in ancillary factors such as supplies, real estate agents, appraisers, title searches and mortgage servicing.
Thus the housing sector has been one of the main sectors, which contribute both directly and indirectly to economic activity in the U.S.A.
The two line items in GDP directly associated with the housing sector are residential fixed investment1 consisting of value-put-in-place of new housing units, production of mobile homes, brokers’ commissions on the sale of existing residential properties, expenditures related to improving and additions to existing units, and net purchases of used structures from government agencies and housing service for personal consumption expenditures, purchased by residents in the United States, in the form of rent for tenants or as rental equivalence for homeowners. In 2000, residential fixed investment totaled $415 billion and housing service expenditure was $956 billion. The combined total of $1.37 trillion represented 14 percent of GDP.
Also, all economic activities produced a “Keynesian” multiplier effect. A home purchase usually resulted in further spending in other sectors of the economy (landscaping, appliances, and so on). The income earned by the landscapers was re-circulated into the economy as they spend, generating another round of income and purchases. The degree of multiplier depends on the degree of monetary policy accommodation and the “crowding out” effect. The multiplier was between 1.34 and 1.62 in the first year or two after an autonomous increase in spending. This meant that for each dollar increase in direct housing activity would increase the overall GDP by $1.34 to $1.62.
Many people’s livelihoods depended on real estate. The February 2001 report showed that 1.49 million workers were employed in the real estate industry. The Real Estate and Rental and Leasing sector, which comprises establishments primarily engaged in renting, leasing, selling, and buying real estate for others, and appraising real estate, totaled 288,273 establishments with 1.7 million paid employees. The annual payroll amounted to $41.6 billion.
Housing Sector Having Macro-economic Implication 1 Consists of purchases of private residential structures and residential equipment that is owned by landlords and rented to tenants. From www.bea.gov
20
In addition to its direct contribution to GDP, the housing sector has been playing an important role in the overall direction of the nation’s economy over the course of macroeconomic business cycles. Conversely, housing starts have made just as dramatic a change, coming out of a recession. In fact, housing starts lead the rest of the economy preceding changes in GDP. In other words, disruptions to the housing sector (arising from policy changes) are likely to be followed by a significant macroeconomic slowdown, while a stimulus to housing can lead the rest of the economy out of a slowdown.
During an economic slowdown, the Federal Reserve has been lowering the interest rates, other things equal. Consequently, the fall in interest rates during an economic slowdown has been acting as a strong buffer often providing a stimulus to the interest-sensitive housing sector. A drop in mortgage rates means lower monthly mortgage payments. This, in turn, means a lower qualifying income necessary to purchase a home. Conservatively, a one percentage drop in mortgage rates has translated into roughly 3 million additional households who would have the necessary income to qualify for a mortgage for purchasing a median priced home. Furthermore, many homeowners have refinanced their mortgages with the falling interest rates, leaving additional spending money to counter economic downturns. The economic slowdown from the mid-2000 to 2001 is a prime example of how this scenario is being played out. Housing starts and home sales began declining in spring of 2000 as the Fed has raised interest rates to cool the exceptionally fast growing economy. However, the economy has cooled much more drastically than desired and the Fed began reversing the interest rate policy by cutting the rates in early 2001. The subsequent falling interest rates have kept the housing starts and home sales to rebound to healthy levels even as the overall economy began sinking further. The economy would have undoubtedly tipped into a recession in early 2001 without the support of the housing sector during this period.
Impact on Communities
Construction of new homes provided jobs and higher tax revenues for local, state, and federal governments. Construction of each new single-family home required 1,591 worker-hours or the equivalent of 0.869 year of full-time labor. Each multifamily unit required 0.402 year of full-time labor. Projecting these estimates and accounting for productivity and price changes over the years, it is was estimated that the construction of 1,000 single-family homes generated 2,448 full-time jobs in construction and construction-related industries, $79.4 million in wages, and $42.5 million in combined federal, state and local revenues and fees. The construction of 1,000 multifamily units is estimated to have generated 1,030 full-time jobs in construction and construction-related industries, $33.5 million in wages; and $17.8 million in combined federal, state and local tax revenues and fees. Furthermore roughly 30 percent of the new home occupant’s income was spent on items produced by local businesses, such as hospitals, daycare centers, dry cleaners, and auto repair shops.
21
Almost 70 percent of all tax revenues raised by local governments in the United States came from property taxes. Homeowners contributed about 43 percent of property taxes, while commercial property accounted for 57 percent of real property tax revenues. Construction of new homes expanded the tax base and so increased the property tax revenues. using the average sales price of new homes in 2000, the local tax revenue base will increase by $185 billion.
Aside from tax revenue to local communities, home production and subsequent homeownership provided additional intangible values. Homeowners did not move as frequently as renters, providing a source of neighborhood stability. Neighborhood stability in turn conferred benefits of higher social and community involvement such as crime prevention programs. Homeowners had a stake in their neighborhoods and communities, and so were likely to behave in ways that provided benefit to everyone in the community. Owners maintain their properties in better condition than do renters of comparable housing. Such behavioral differences had been observed regardless of the age or income of homeowners. All of these social benefits to homeownership can impact property values.
Impact on Individuals
Homeownership also provided individuals with a way to accumulate wealth for the future while benefiting from the provision of shelter. A tabulation of household wealth from the Federal Reserve’s Survey of Consumer Finances (1998) shows that home equity (the value of the home net of mortgages) was the largest component of total wealth. Equity in primary residences accounted for 28% of the total family asset. Furthermore, the survey shows that 12.8% of families had some form of residential real estate in addition to primary residence (second homes, time shares, and other type of residential property), an increase from 11.8% in 1995. The value of the asset in other residential property accounted for additional 5% of the total household asset. Retirement accounts were the largest financial assets outside of primary residence, with 19.8% of the total. Only for the very wealthy (income over $100,000 per year) did the home equity portion of wealth fall below 50% of the total household wealth.
A separate survey from the Census Bureau also shows the dominant importance of home equity in determining household net worth. The Survey of Income and Program Participation periodically collects detailed wealth and asset data as a supplement to its core questions about labor force participation, income, demographic characteristics, and program participation. In 1995, median household net worth was $40,200; Median home equity for home-owning households was $50,000. Home equity constituted the largest share of household net worth, accounting for 44 percent of total net worth.
A privately owned home, therefore, was an important vehicle for wealth accumulation for a large segment of society. In addition, home investment played an important role in portfolio diversification. Home prices in the U.S., on average, have risen steadily, and have much lower
22
volatility than stock or bond prices. The historically standard deviation for stocks and bonds had been 20% and 9%, respectively. For housing, the standard deviation was about 4%. Furthermore, the correlation between home prices with stock or bond prices was very low. Homeowners were also benefited from the easy availability of home equity loans. Whether as a readily available source of funds, or just the security of a credit source, certainly added value to homeownership.
Housing Contribution to Society
Although the level and benefits of community involvement are hard to measure, several researchers have found that homeowners tend to be more involved in their communities and local governments then renters. For instance, owners participated in a greater number of non-professional organizations and had higher voter participation rates. In addition to higher civic participation, owners also tend to remain in their homes longer, adding stability and familiarity to the neighborhood, and also tend to spend more time and money maintaining their residence.
Home equity is one of the largest sources of collateral for bank loans to start new businesses. Over 740,000 businesses in 1992 reported a mortgage or home equity loan as a source of start-up capital for their business. It had been estimated in the UK that a 10 percent rise in the aggregate value of home equity increases the number of new business registration by 5 percent.
Furthermore, people want to be homeowners. Fifty eight percent of the renters responded that owning a home is either the top or very important priority according to 2000 Fannie Mae’s National Housing Survey. Freedom to alter their homes or engaging in home maintenance and improving may provide intrinsic joys.
Furthermore, others have noted that the home buying process and homeownership improve self-efficacy or a person’s sense of control over life events. And from extensive psychological studies self-efficacy is associated with better health status.
Whether it be America’s dream or an economic indicator of growth or a tool for changing the course of Macro-economic policies, the American Housing Market was such an important sector that any vibrations in the housing led banking mechanism could lead to a shake up in the entire world economies. The highly leveraged market and the whole dream of owning homes turned into a huge debacle. Economists call it bursting of the housing “bubble.” In the following pages we have tried to present the build-up of this bubble, the dynamism of the leveraged security markets, the role of parties in this crisis and the likely impact on the U.S. and other economies of the world.
23
LLEEVVEERRAAGGEEDD SSEECCUURRIITTYY MMAARRKKEETTSS TThhee DDoouubbllee EEddggeedd SSwwoorrdd
“…but in the modern fixed-income markets - where leverage is king and cheap credit is only the
current jester - a move of that magnitude can do a lot of damage.”
-Ryan Barnes, The Fuel That Fed The Sub-prime Meltdown.
Leveraging
The leveraging procedure, which intended to multiply the investments, opened new horizons for banks to offer the investors with innovatively designed debt instruments i.e. mortgage-backed securities (MBS), and collateralized debt obligations (CDO).
Leveraging is borrowing to invest. Financial leverage takes the form of a loan or other borrowings (debt), the proceeds of which are reinvested with the intent to earn a greater rate of return than the cost of borrowing. The most familiar use of leverage is using a mortgage to buy a home. In return for a down payment one receives funds to purchase an asset that would otherwise be too expensive. The homeowners either try to pay out the money from the rent that would be saved or from the income streams (the rent earned) that their vocations generate.
Leveraging helps both the investor and the firm to invest or operate. While leverage can play a positive role in the financial system, problems can arise when financial institutions go too far in extending credit to their customers and counter parties. If an investor uses leverage to make an investment and the investment moves against the investor, his or her loss is much greater than it would've been if the investment had not been leveraged - leverage magnifies both gains and losses. In the business world, a company can use leverage to try to generate shareholder wealth, but if it fails to do so, the interest expense and credit risk of default destroys shareholder value.
The build-up of the sub-prime crisis is based on the mechanism of leveraging. The layer upon layer of leverage that propelled the expansion is now operating in reverse as the leverage is being unwound.
Housing Sector: The Initial Fuel
Housing sector has been one of the prominent drivers of the U.S. economy. Not only has it made contributions to the employment, production and GDP, it has also been a major stimulus for the overall economic growth of this huge economy leading the global world. This sector has
24
important linkages to every macroeconomic aggregate like GNP, savings, interest and inflation rate and also highlights its importance in public policy decisions. The American Financial Institutions being over-flooded with liquidity magnified the housing sector as a lucrative area. The leveraging mechanism with its off springs i.e. Mortgage-Backed Securities (MBS) and Collateralized Debt Obligations (CDO) generated great opportunities for even those who could not afford to pay the cash flow mandated as among the key requirements for taking loans.
These sophisticated instruments, lackadaisical approach to adherence to prudent lending policy and the surplus of funds all contributed to the housing sector becoming the most booming sectors. As it grew, it took with itself almost the entire economy. Then an asset bubble began to form, frenzy fed on frenzy and the prices started to soar beyond what can safely be said to be the fundamentally correct prices. However, perhaps the key reason why the sub-prime crisis entrenched itself deep into the very sinews of the financial system of the U.S. was the creation of exotic leveraged instruments. That way banks now started lending more than the actual base money and that too to entities that had a very high risk-premium attached to it.
Securitization: Prime Mover of the Crisis
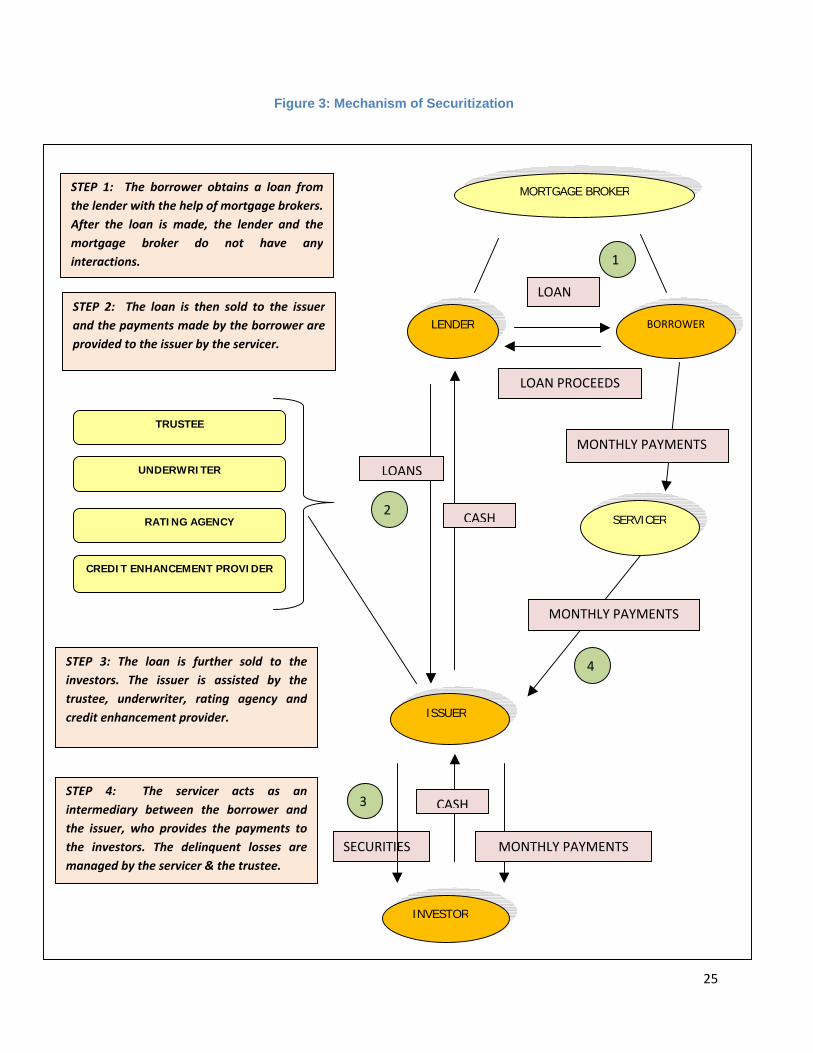
Securitization, an innovative form of financial engineering introduced two new instruments i.e. Mortgage Backed Securities and Collateralized Debt Obligations. Securitization is a structured finance process in which assets; receivables or financial instruments are acquired, classified into pools, and offered as collateral for third-party investment. Due to securitization, investor need for mortgage-backed securities (MBS), and collateralized debt obligations (CDO) as a profitable venture and the tendency of rating agencies to assign investment-grade ratings to these loans even though having a high risk of default could be originated, packaged and the risk readily transferred to others. The process of securitization has been explained with help of figure 4.
Mortgage Backed Securities (MBS) and Collateralized Debt Obligations (CDO’s) the two instruments of securitization played an important role in aggravating the whole sub-prime saga.
A mortgage-backed security (MBS) is an asset-backed security whose cash flows are backed by the principal and interest payments of a set of mortgage loans mainly on residential property. Collateralized debt obligations (CDO’s) are also type of asset-backed security and structured credit product but they are constructed from a portfolio of fixed-income assets. These assets are divided into different tranches: senior tranches (rated AAA), mezzanine tranches (AA to BB), and equity tranches (unrated). Here junior tranches offer higher coupons (interest rates) to compensate for the added default risk while senior tranches offer the lowest coupon rate offering highest safety level.
25
STEP 1: The borrower obtains a loan fromthe lender with the help of mortgage brokers.After the loan is made, the lender and themortgage broker do not have anyinteractions.
STEP 2: The loan is then sold to the issuerand the payments made by the borrower areprovided to the issuer by the servicer.
STEP 3: The loan is further sold to theinvestors. The issuer is assisted by thetrustee, underwriter, rating agency andcredit enhancement provider.
STEP 4: The servicer acts as anintermediary between the borrower andthe issuer, who provides the payments tothe investors. The delinquent losses aremanaged by the servicer & the trustee.
MORTGAGE BROKER
LENDER BORROWER
SERVICER
ISSUER
INVESTOR
TRUSTEE
UNDERWRITER
RATING AGENCY
CREDIT ENHANCEMENT PROVIDER
LOAN PROCEEDS
LOAN
MONTHLY PAYMENTS
MONTHLY PAYMENTS
LOANS
CASH
MONTHLY PAYMENTS
CASH
SECURITIES
1
2
3
4
Figure 3: Mechanism of Securitization
26
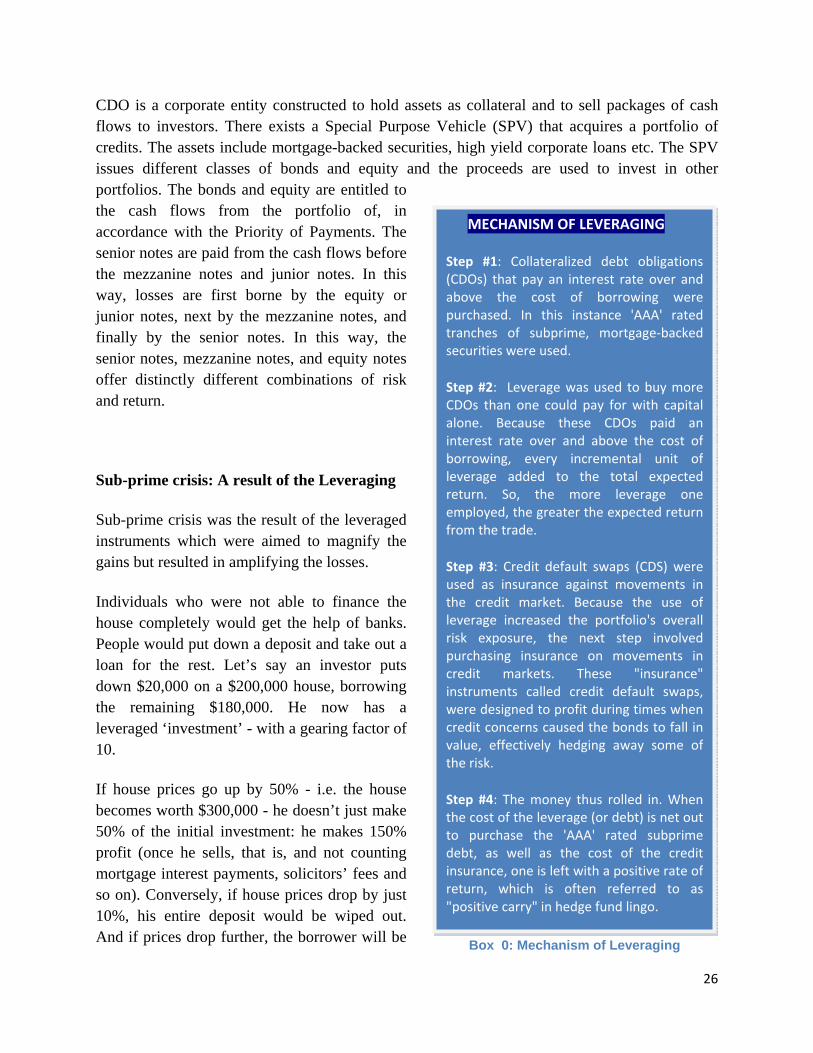
CDO is a corporate entity constructed to hold assets as collateral and to sell packages of cash flows to investors. There exists a Special Purpose Vehicle (SPV) that acquires a portfolio of credits. The assets include mortgage-backed securities, high yield corporate loans etc. The SPV issues different classes of bonds and equity and the proceeds are used to invest in other portfolios. The bonds and equity are entitled to the cash flows from the portfolio of, in accordance with the Priority of Payments. The senior notes are paid from the cash flows before the mezzanine notes and junior notes. In this way, losses are first borne by the equity or junior notes, next by the mezzanine notes, and finally by the senior notes. In this way, the senior notes, mezzanine notes, and equity notes offer distinctly different combinations of risk and return.
Sub-prime crisis: A result of the Leveraging
Sub-prime crisis was the result of the leveraged instruments which were aimed to magnify the gains but resulted in amplifying the losses.
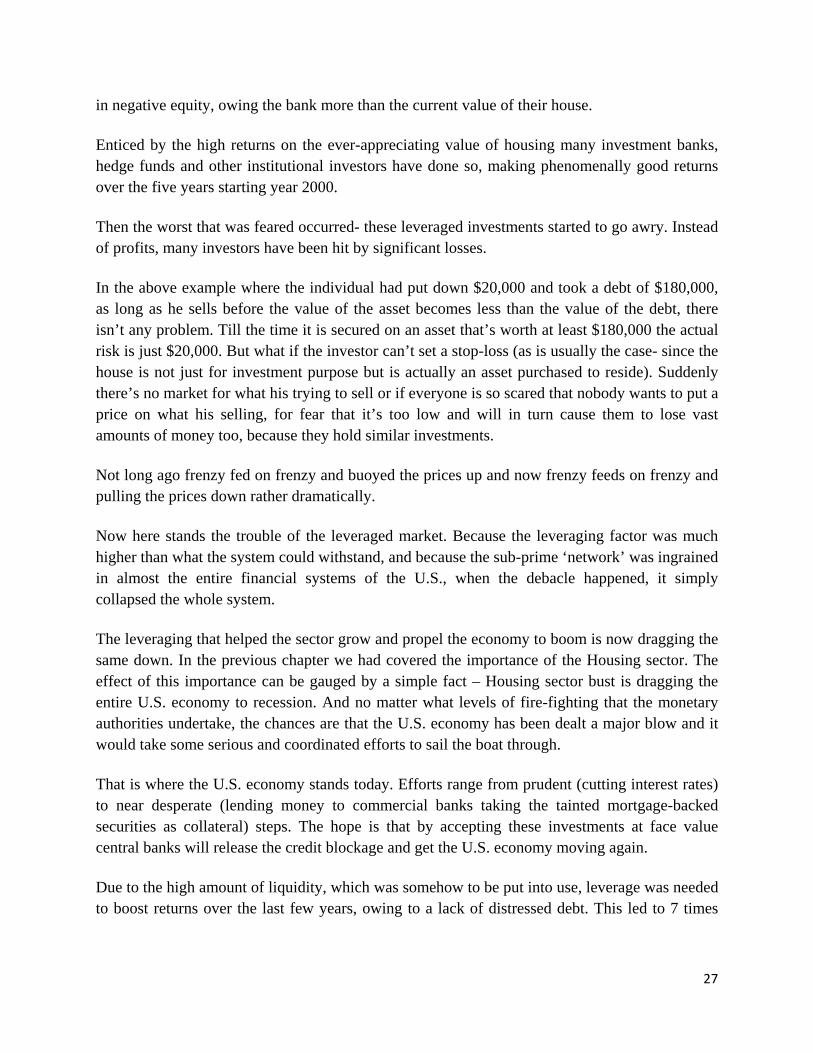
Individuals who were not able to finance the house completely would get the help of banks. People would put down a deposit and take out a loan for the rest. Let’s say an investor puts down $20,000 on a $200,000 house, borrowing the remaining $180,000. He now has a leveraged ‘investment’ - with a gearing factor of 10.
If house prices go up by 50% - i.e. the house becomes worth $300,000 - he doesn’t just make 50% of the initial investment: he makes 150% profit (once he sells, that is, and not counting mortgage interest payments, solicitors’ fees and so on). Conversely, if house prices drop by just 10%, his entire deposit would be wiped out. And if prices drop further, the borrower will be
MECHANISM OF LEVERAGING
Step #1: Collateralized debt obligations(CDOs) that pay an interest rate over andabove the cost of borrowing werepurchased. In this instance 'AAA' ratedtranches of subprime, mortgage‐backedsecurities were used.
Step #2: Leverage was used to buy moreCDOs than one could pay for with capitalalone. Because these CDOs paid aninterest rate over and above the cost ofborrowing, every incremental unit ofleverage added to the total expectedreturn. So, the more leverage oneemployed, the greater the expected returnfrom the trade.
Step #3: Credit default swaps (CDS) wereused as insurance against movements inthe credit market. Because the use ofleverage increased the portfolio's overallrisk exposure, the next step involvedpurchasing insurance on movements incredit markets. These "insurance"instruments called credit default swaps,were designed to profit during times whencredit concerns caused the bonds to fall invalue, effectively hedging away some ofthe risk.
Step #4: The money thus rolled in. Whenthe cost of the leverage (or debt) is net outto purchase the 'AAA' rated subprimedebt, as well as the cost of the creditinsurance, one is left with a positive rate ofreturn, which is often referred to as"positive carry" in hedge fund lingo.
Box 0: Mechanism of Leveraging
27
in negative equity, owing the bank more than the current value of their house.
Enticed by the high returns on the ever-appreciating value of housing many investment banks, hedge funds and other institutional investors have done so, making phenomenally good returns over the five years starting year 2000.
Then the worst that was feared occurred- these leveraged investments started to go awry. Instead of profits, many investors have been hit by significant losses.
In the above example where the individual had put down $20,000 and took a debt of $180,000, as long as he sells before the value of the asset becomes less than the value of the debt, there isn’t any problem. Till the time it is secured on an asset that’s worth at least $180,000 the actual risk is just $20,000. But what if the investor can’t set a stop-loss (as is usually the case- since the house is not just for investment purpose but is actually an asset purchased to reside). Suddenly there’s no market for what his trying to sell or if everyone is so scared that nobody wants to put a price on what his selling, for fear that it’s too low and will in turn cause them to lose vast amounts of money too, because they hold similar investments.
Not long ago frenzy fed on frenzy and buoyed the prices up and now frenzy feeds on frenzy and pulling the prices down rather dramatically.
Now here stands the trouble of the leveraged market. Because the leveraging factor was much higher than what the system could withstand, and because the sub-prime ‘network’ was ingrained in almost the entire financial systems of the U.S., when the debacle happened, it simply collapsed the whole system.
The leveraging that helped the sector grow and propel the economy to boom is now dragging the same down. In the previous chapter we had covered the importance of the Housing sector. The effect of this importance can be gauged by a simple fact – Housing sector bust is dragging the entire U.S. economy to recession. And no matter what levels of fire-fighting that the monetary authorities undertake, the chances are that the U.S. economy has been dealt a major blow and it would take some serious and coordinated efforts to sail the boat through.
That is where the U.S. economy stands today. Efforts range from prudent (cutting interest rates) to near desperate (lending money to commercial banks taking the tainted mortgage-backed securities as collateral) steps. The hope is that by accepting these investments at face value central banks will release the credit blockage and get the U.S. economy moving again.
Due to the high amount of liquidity, which was somehow to be put into use, leverage was needed to boost returns over the last few years, owing to a lack of distressed debt. This led to 7 times
28
(and sometimes as much as 10 times) leverage on U.S. leveraged buyouts. In Europe, debt multiples also were stretched, with leverage of 5.5 times in 2007, versus 4.7 times in 1998.
Thus leveraging which was intended to increase the returns and provide shelter to the people of U.S. plunged economy downwards and contributed to the chronicle of Sub-prime Crisis.
In the global economy, effects in one area of investment quickly spread to others. So when institutional investors started losing money on collateralized debt obligations (CDO’s) and residential mortgage-backed securities (RMBS’s) because of the U.S. sub-prime crisis, they quickly liquidized other investments in order to cover their losses.
For example, some of them shifted cash out of the carry trade (in which money borrowed in low-interest currencies such as the Yen is invested in higher interest currencies such as the Pound), causing the Yen to rapidly appreciate and leading to a whole slew of currency investors losing money on their leveraged positions. These currency investors in turn had to find the money to cover their losses, perhaps by selling gold, temporarily shifting the gold price downwards and causing a tranche of leveraged gold investors to face severe losses. And so it went on, and continues to go on.
The total amount of leveraged investment in the world is unknown, but it has been estimated to be many multiples of global GDP.
Thus leveraging was a double-edged sword, which was aimed at multiplying the profits, but if it acted reversely, the losses would magnify much more than the expected profits. Perhaps, that is what happened in the U.S. economy, where the reverse took place and brought the world at the verge of this crisis. The tool of leveraging mechanism i.e. the sub-prime lending provides U.S. an insight of how the construct of the sub-prime crisis took place.
29
SSUUBB PPRRIIMMEE LLEENNDDIINNGG TThhee FFllaawwss
The financial institutions overflowing with liquidity devised the securitization mechanism for which they classified the lending into three categories namely, The Prime category, the Alt-A category and Sub-prime category. The parameters of categorizing the credit seekers were:
1. Credit worthiness and documentation prudence 2. Ability to pay back the money 3. Ability to pay down payments 4. Whether it’s a first loan or an already mortgaged asset.
While the prime category of borrowers fulfilled all the parameters, the sub-prime borrowers stood at fulfilling none. Alt-A borrowers mainly were short of documentation, including proof of income. Yet these borrowers had clean histories they either had higher loan-to-value or debt-to-income ratios.
Sub-prime lending (also known as B-paper, near-prime, or second chance lending) is lending at a higher rate than the prime rate. A higher rate of interest is charged due to limited or tarnished credit history or inadequate documentation, higher loan-to-value and debt-to-income ratios. However, with the higher rates comes additional risk for lenders because there is a lack of documentation - including limited proof of the borrower's income poor credit history, and adverse financial situations usually associated with sub-prime applicants.
A high risk based pricing system is used in order to calculate the terms of loans, which are offered to borrowers with varying credit histories. The sub-prime borrowers charge high rates of interest, but still credit risk is more than interest rate risks due to the increased chances of defaults and less opportunities to refinance the loans.
Sub-prime lending was initially a helping hand to all those borrowers who aimed to fulfill their dream of owning a home. Sub-prime loans increased opportunities for homeownership and added 9 millions of households to the new status of homeowners in less than a decade and increased employment opportunities thereby increasing the growth rate.
30
However, providing loans to the low-income sections of the society was a benefit as well as fallout of the sub-prime loans. The availability of liquidity was the prominent factor that prompted the banks to provide loans at high rates, on the surety that even if the borrower fails to pay the loan amount, they may still have the option to sell the houses and recover the amount. The fact that the housing prices usually tend to appreciate, furthermore, made the bankers free from any apprehensions of recovering the losses. Also since sub-prime lending, a direct result of high liquidity, prompted banks to issue loans without any strict regulations which could help them to earn high amount of profits by the securitization mechanism as explained later.
Sub-prime borrowing was as such not flawed; rather it was the high quantum of sub-prime loans granted without proper regulations that appeared to be the major reason for the fallout. The positive picture of profit earnings hid the shortcomings of improper regulations, irresponsible lending and inefficient rating system by the credit rating agencies.
Sub-prime lending became highly controversial: Sub-prime lenders often engaged in predatory lending practices such as deliberately lending to borrowers who could never meet the terms of their loans, thus leading to default, seizure of collateral, and foreclosure. They often employed unscrupulous means by enticing, inducing, and/or assisting a borrower in taking a mortgage that carried high fees, a high interest rate etc.
Property Fraud by Lenders: With the increase in sub-prime lending there was a similar increase in the property frauds. By selling overpriced apartments to the unsuspecting buyers, the sellers took the money and disappeared. So now the entire deal was between the banks and he borrowers. In this way the sellers, earned huge amounts on the overpriced sold houses.
Second Mortgages: Irrespective of the bad credit histories, the sub-prime lending had made second mortgages easier on the existing mortgaged houses. The repayment of another loan burdened the borrowers, which ultimately had to borne by the lenders i.e. the banks, when the borrowers defaulted in making the payments.
Lax Lending Rules: Analysts say lax lending standards led some mortgage firms to grant home loans to tens of thousands of borrowers who did not have the means to meet their mortgage payments when interest rates increased.
Irresponsible Credit Rating Agencies: Credit rating agencies such as Standard and Poor's, Moody's and Fitch Ratings were urged by the panel to improve their influential reports and assumptions about a wide range of securities and corporations.
Major Banks meanwhile were encouraged to disclose more information about the securitization of complex credit instruments, such as mortgage, credit card and student loans, which they package or cut up and sell to other banks and investors.
31
Besides that the other reason why the Sub-prime mortgage crisis unfolded the way it did had also to do with the complex financial wizardry that was devised around the lending that had the effect of ‘over-lending’. That is the financial systems geared up by multiples in excess of what they could or rather should have. Due to the complexity, sheer size and volume, presence of numerous players and major flaws in the sub-prime lending have all caused the system to collapse. New forces have played important roles in Sub-prime crisis that had in the post been absent.
1. Complex investments: Financial firms wield ever more sophisticated financial tools. CDOs and MBAs enabled complex and opaque investments.
2. New institutions: Players like hedge funds and buyout firms – also called Private Equity, represent a large and rising sharing of overall investment money. Hedge funds also have taken exposure to the subprime investments. These players are significantly less regulated than the listed companies-these are less transparent and generally have a free will to do pretty much what they want. Besides that Rating agency and Credit enhancers played a very important role in certifying the quality of the subprime credit. These too are outside the purview of the agencies.
3. Leverage: the growing use of Debt or leverage by financial players magnifies the first two forces. An era of easy money has enabled more risk taking built on borrowed funds. That can accentuate in both the ups and downs of a cycle, raising the chances of panic selling during down turns and frenzied buying in upturns.
4. Globalization: Today all the nations in the world are linked through easy movement of funds. In the less regulated markets money moves both in and out freely. In the medium regulated markets like India, the movement is not easy but even then the movement is copious enough to affect massive hemorrhage. This has very telling effect. In this case for example large banks across the world had exposure to the subprime conundrum. And when the damage occurred the ripple effect wiped out a lot of financial players across the globe.
Given the gearing up and the various reasons as explained above, the subprime imbroglio was a time-bomb which was waiting to implode. And as it did it took down with it the most powerful economy in this globe.
32
TTHHEE CCRRIISSIISS AANNDD CCHHRROONNOOLLOOGGYY OOFF EEVVEENNTTSS TTiimmeelliinnee ooff IImmpplloossiioonn
“What began as a tremor in the sub-prime mortgage market that affected a relative few, has sadly gained momentum, creating a broader credit crisis that continues to threaten the middle
class and overall economic growth.”
-Senator Jack Reed
The U.S. economy was at the peak of invincible growth and incessant development with every sector enjoying a boom since the past two decades. The unemployment rates were fairly low, inflation under control, stock markets scaling new heights, banking sectors overflowing with liquidity and growth figures rising steadily accounting for 26% of the worlds GDP.
The American economy flooded with enormous liquidity and the low income citizens striving to fulfill their imperative dream of shelter had an incomprehensible tryst with each other and resulted in the whole sub-prime saga.
As it has been said that invention is the mother of necessity the financial institutions devised an innovative mechanism of securitization with Mortgage Backed Securities and Collateral Bonds Obligations as the two offsprings. The low-income people who had tarnished credit histories or no documentation were issued loans without any such requirements to be fulfilled. The funds generated from these instruments were used to create new investment vehicles i.e. MBS’s and CDO’s that were issued to investors by the bankers at varying rates of interest depending on the ability of the borrowers to repay.
The whole mechanism was a laudable creation of the financial know-how and desperately fulfilled dreams. So the sub-prime lending mechanism was an efficient fabrication of converting attractive dreams to a moneymaking business with the creation of two ingeniously thought over instruments.
The boom in the housing sector, enticing interest rates and high profit margins kept on luring the financial institutions, that they shut their eyes to the pessimistic notion that if those borrowers
33
failed to pay their debt obligations or if the collateralized houses faced a surge in the prices, the aftermath could result in the collapse in the whole banking segment on the threshold of which lies a whole economy with all the sectors interlinked to each other presenting the cascading effect.
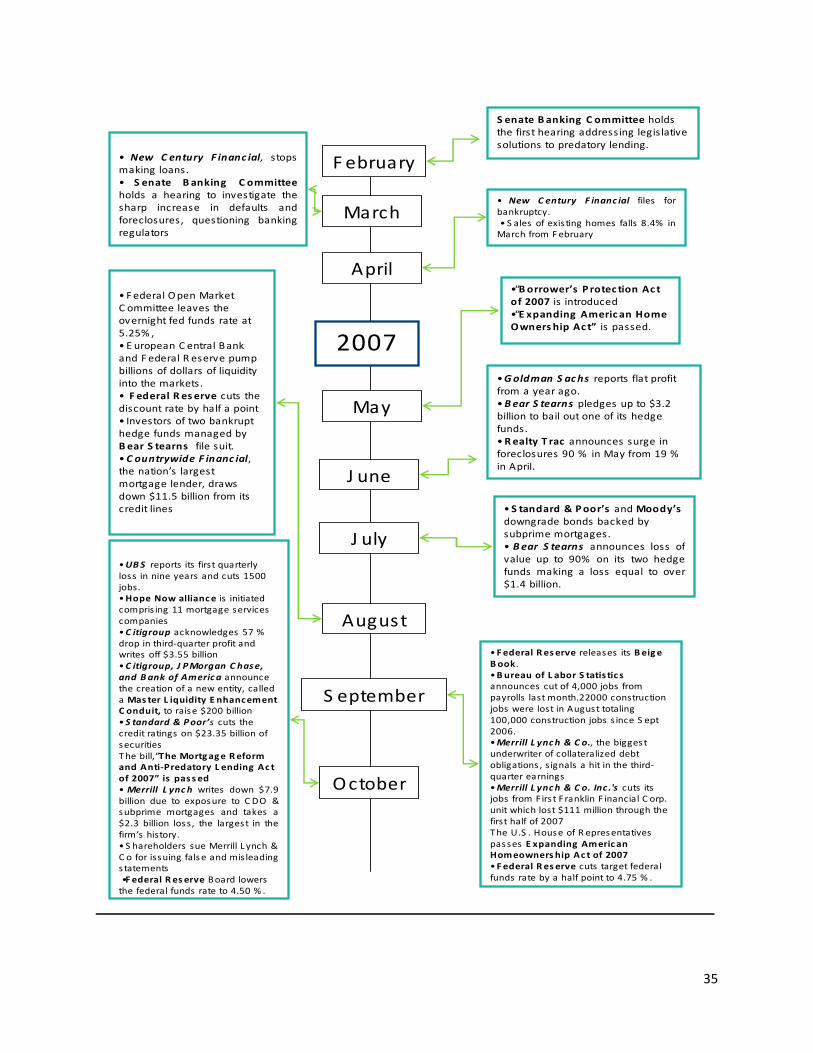
Housing markets have gone bust, interest rates have touched the pinnacles, stock markets across the world have collapsed, unemployment toll has increased, growth rates have plummeted, global inflation has been scaling to new heights, the fiscal deficit gaps are widening, corporate giants have been announcing billion dollar losses with colossal business houses being taken over at the lowest of their values. Figure 5 shows the timeline of the events.

34
Figure 4: Timeline of Implosion
35
2007
S enate Banking C ommittee holds the first hearing addressing legislative solutions to predatory lending.
S eptember
August
J uly
J une
May
April
March
F ebruary• New C entury F inanc ial, stops making loans.• S enate Banking C ommittee holds a hearing to investigate the sharp increase in defaults and foreclosures, questioning banking regulators
• S tandard & Poor’s and Moody’sdowngrade bonds backed by subprime mortgages.• Bear S tearns announces loss of value up to 90% on its two hedge funds making a loss equal to over $1.4 billion.
•“Borrower’s Protec tion Act of 2007 is introduced•“E xpanding Americ an Home Owners hip Act” is passed.
• New C entury F inanc ial files for bankruptcy.• S ales of existing homes falls 8.4% in March from F ebruary
• Federal Open Market C ommittee leaves the overnight fed funds rate at 5.25% ,• E uropean C entral Bank and F ederal R eserve pump billions of dollars of liquidity into the markets.• F ederal Res erve cuts the discount rate by half a point• Investors of two bankrupt hedge funds managed by Bear S tearns file suit.•C ountrywide F inanc ial, the nation’s largest mortgage lender, draws down $11.5 billion from its credit lines
October
•UBS reports its first quarterly loss in nine years and cuts 1500 jobs.•Hope Now alliance is initiated compris ing 11 mortgage services companies•C itigroup acknowledges 57 % drop in third‐quarter profit and writes off $3.55 billion•C itigroup, J PMorgan C hase, and Bank of Americ a announce the creation of a new entity, called a Mas ter L iquidity E nhancement C onduit, to raise $200 billion•S tandard & Poor’s cuts the credit ratings on $23.35 billion of securitiesThe bill,“The Mortgage Reform and Anti‐Predatory L ending Ac t of 2007” is pass ed• Merrill L ynch writes down $7.9 billion due to exposure to C DO & subprime mortgages and takes a $2.3 billion loss, the largest in the firm’s history.• S hareholders sue Merrill L ynch & C o for issuing false and mis leading s tatements•Federal Res erve Board lowers the federal funds rate to 4.50 % .
•Federal Res erve releases its Beige Book.•Bureau of L abor S tatis tic s announces cut of 4,000 jobs from payrolls last month.22000 construction jobs were lost in August totaling 100,000 construction jobs s ince S ept 2006.•Merrill L ynch & C o., the biggest underwriter of collateralized debt obligations , signals a hit in the third‐quarter earnings•Merrill L ynch & C o. Inc .'s cuts its jobs from F irst Franklin F inancial C orp. unit which lost $111 million through the first half of 2007The U.S . House of R epresentatives passes E xpanding American Homeowners hip Ac t of 2007•Federal Res erve cuts target federal funds rate by a half point to 4.75 % .
•Goldman S achs reports flat profit from a year ago.•Bear S tearns pledges up to $3.2 billion to bail out one of its hedge funds.•Realty T rac announces surge in foreclosures 90 % in May from 19 % in April.
36
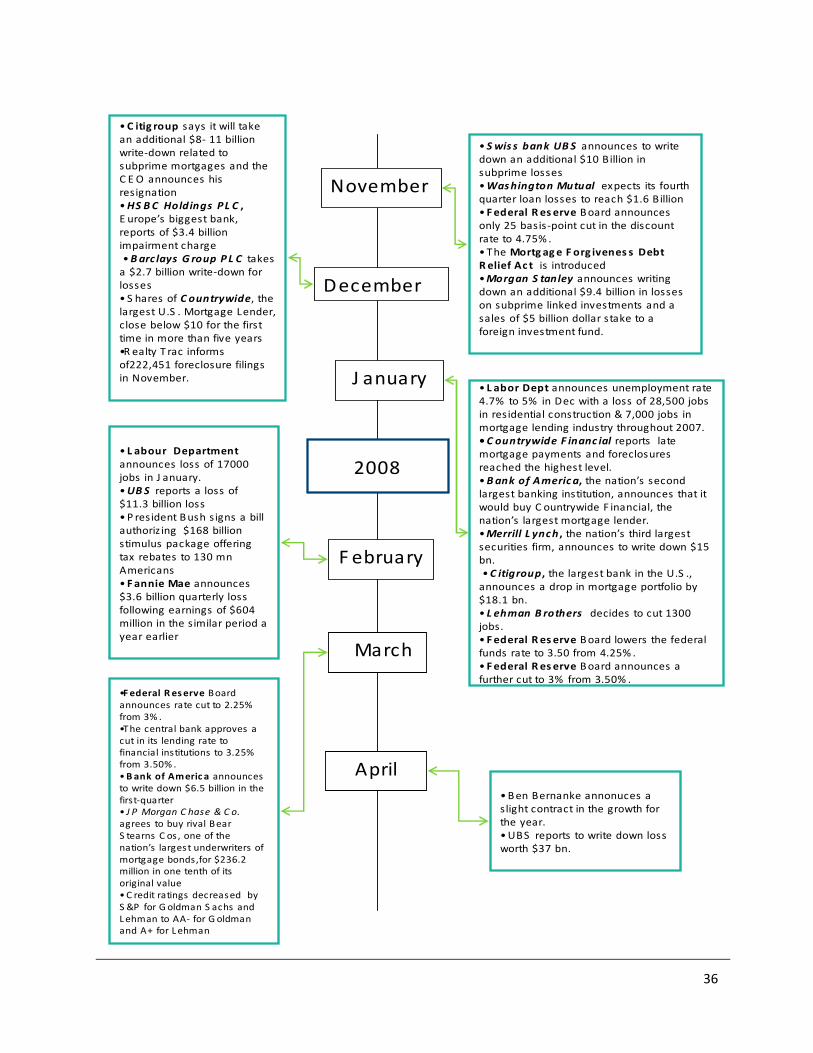
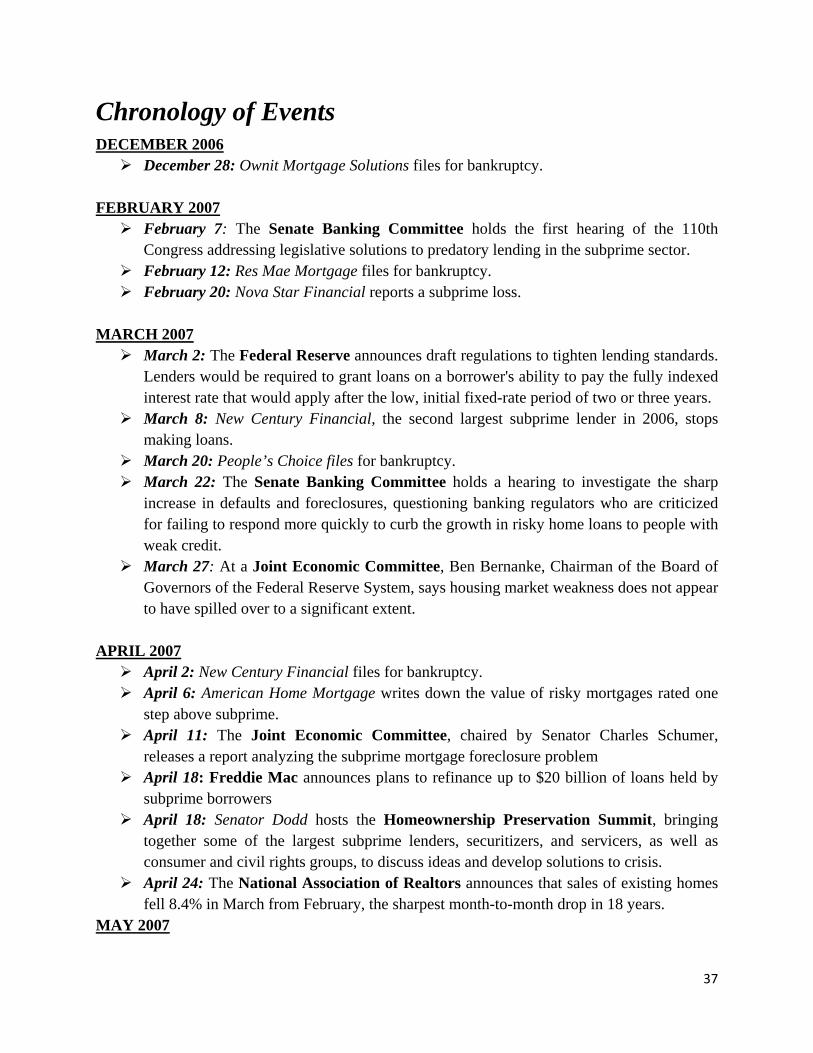
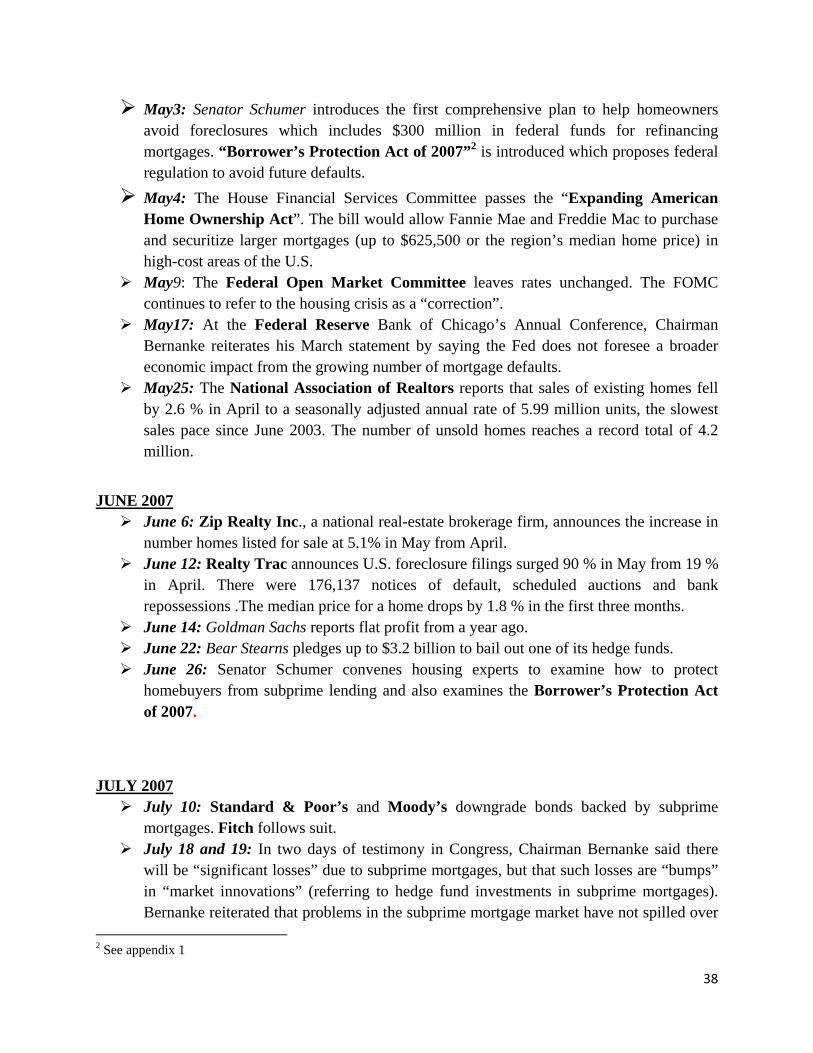
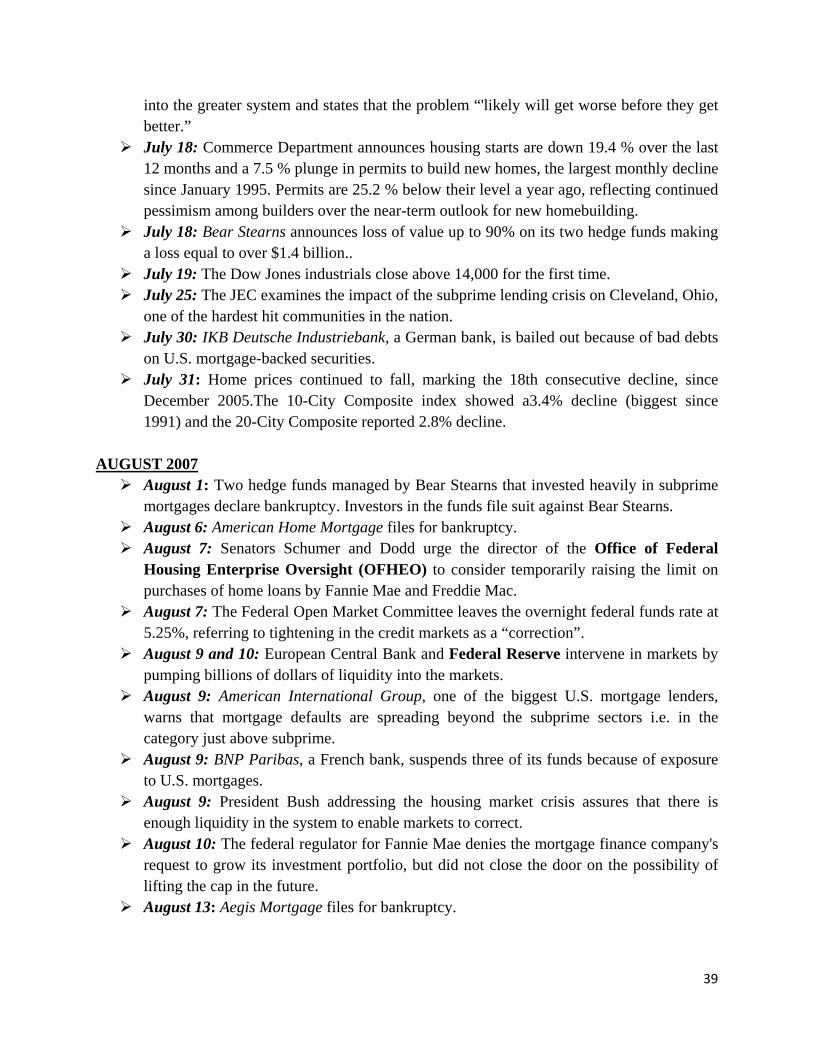
November
•C itig roup says it will take an additional $8‐ 11 billion write‐down related to subprime mortgages and the C E O announces his resignation •HS BC Holdings PL C , E urope’s biggest bank, reports of $3.4 billion impairment charge •Barc lays G roup PL C takes a $2.7 billion write‐down for losses •S hares of C ountrywide, the largest U.S . Mortgage Lender, close below $10 for the first time in more than five years•R ealty T rac informs of222,451 foreclosure filings in November.
December
• Swis s bank UBS announces to write down an additional $10 Billion in subprime losses•Washington Mutual expects its fourth quarter loan losses to reach $1.6 Billion• Federal Res erve Board announces only 25 basis‐point cut in the discount rate to 4.75% . •The Mortg age F org ivenes s Debt Relief Act is introduced•Morgan S tanley announces writing down an additional $9.4 billion in losses on subprime linked investments and a sales of $5 billion dollar stake to a foreign investment fund.
J anuary• L abor Dept announces unemployment rate 4.7% to 5% in Dec with a loss of 28,500 jobs in residential construction & 7,000 jobs in mortgage lending industry throughout 2007.•C ountrywide F inanc ial reports late mortgage payments and foreclosures reached the highest level.•Bank of America, the nation’s second largest banking institution, announces that it would buy C ountrywide F inancial, the nation’s largest mortgage lender.•Merrill L ynch , the nation’s third largest securities firm, announces to write down $15 bn.•C itigroup, the largest bank in the U.S ., announces a drop in mortgage portfolio by $18.1 bn.• L ehman B rothers decides to cut 1300 jobs.• Federal Res erve Board lowers the federal funds rate to 3.50 from 4.25% . • Federal Res erve Board announces a further cut to 3% from 3.50% .
• L abour Department announces loss of 17000 jobs in J anuary.•UBS reports a loss of $11.3 billion loss •P resident Bush signs a bill authoriz ing $168 billion stimulus package offering tax rebates to 130 mnAmericans• Fannie Mae announces $3.6 billion quarterly loss following earnings of $604 million in the similar period a year earlier
F ebruary
•Federal Reserve Board announces rate cut to 2.25% from 3% . •The central bank approves a cut in its lending rate to financial institutions to 3.25% from 3.50% .•Bank of Americ a announces to write down $6.5 billion in the first‐quarter• J P Morgan C hase & C o. agrees to buy rival Bear S tearns C os , one of the nation’s largest underwriters of mortgage bonds,for $236.2 million in one tenth of its original value•C redit ratings decreased by S &P for Goldman S achs and Lehman to AA‐ for Goldman and A+ for Lehman
•Ben Bernanke annonuces a slight contract in the growth for the year.•UBS reports to write down loss worth $37 bn.
March
April
2008
37
Chronology of Events
DECEMBER 2006 December 28: Ownit Mortgage Solutions files for bankruptcy.
FEBRUARY 2007
February 7: The Senate Banking Committee holds the first hearing of the 110th Congress addressing legislative solutions to predatory lending in the subprime sector. February 12: Res Mae Mortgage files for bankruptcy. February 20: Nova Star Financial reports a subprime loss.
MARCH 2007
March 2: The Federal Reserve announces draft regulations to tighten lending standards. Lenders would be required to grant loans on a borrower's ability to pay the fully indexed interest rate that would apply after the low, initial fixed-rate period of two or three years. March 8: New Century Financial, the second largest subprime lender in 2006, stops
making loans. March 20: People’s Choice files for bankruptcy. March 22: The Senate Banking Committee holds a hearing to investigate the sharp
increase in defaults and foreclosures, questioning banking regulators who are criticized for failing to respond more quickly to curb the growth in risky home loans to people with weak credit. March 27: At a Joint Economic Committee, Ben Bernanke, Chairman of the Board of
Governors of the Federal Reserve System, says housing market weakness does not appear to have spilled over to a significant extent.
APRIL 2007 April 2: New Century Financial files for bankruptcy. April 6: American Home Mortgage writes down the value of risky mortgages rated one
step above subprime. April 11: The Joint Economic Committee, chaired by Senator Charles Schumer,
releases a report analyzing the subprime mortgage foreclosure problem April 18: Freddie Mac announces plans to refinance up to $20 billion of loans held by
subprime borrowers April 18: Senator Dodd hosts the Homeownership Preservation Summit, bringing
together some of the largest subprime lenders, securitizers, and servicers, as well as consumer and civil rights groups, to discuss ideas and develop solutions to crisis. April 24: The National Association of Realtors announces that sales of existing homes
fell 8.4% in March from February, the sharpest month-to-month drop in 18 years. MAY 2007
38
May3: Senator Schumer introduces the first comprehensive plan to help homeowners avoid foreclosures which includes $300 million in federal funds for refinancing mortgages. “Borrower’s Protection Act of 2007”2 is introduced which proposes federal regulation to avoid future defaults. May4: The House Financial Services Committee passes the “Expanding American Home Ownership Act”. The bill would allow Fannie Mae and Freddie Mac to purchase and securitize larger mortgages (up to $625,500 or the region’s median home price) in high-cost areas of the U.S. May9: The Federal Open Market Committee leaves rates unchanged. The FOMC
continues to refer to the housing crisis as a “correction”. May17: At the Federal Reserve Bank of Chicago’s Annual Conference, Chairman
Bernanke reiterates his March statement by saying the Fed does not foresee a broader economic impact from the growing number of mortgage defaults. May25: The National Association of Realtors reports that sales of existing homes fell
by 2.6 % in April to a seasonally adjusted annual rate of 5.99 million units, the slowest sales pace since June 2003. The number of unsold homes reaches a record total of 4.2 million.
JUNE 2007 June 6: Zip Realty Inc., a national real-estate brokerage firm, announces the increase in
number homes listed for sale at 5.1% in May from April. June 12: Realty Trac announces U.S. foreclosure filings surged 90 % in May from 19 %
in April. There were 176,137 notices of default, scheduled auctions and bank repossessions .The median price for a home drops by 1.8 % in the first three months. June 14: Goldman Sachs reports flat profit from a year ago. June 22: Bear Stearns pledges up to $3.2 billion to bail out one of its hedge funds. June 26: Senator Schumer convenes housing experts to examine how to protect
homebuyers from subprime lending and also examines the Borrower’s Protection Act of 2007.
JULY 2007 July 10: Standard & Poor’s and Moody’s downgrade bonds backed by subprime
mortgages. Fitch follows suit. July 18 and 19: In two days of testimony in Congress, Chairman Bernanke said there
will be “significant losses” due to subprime mortgages, but that such losses are “bumps” in “market innovations” (referring to hedge fund investments in subprime mortgages). Bernanke reiterated that problems in the subprime mortgage market have not spilled over
2 See appendix 1
39
into the greater system and states that the problem “'likely will get worse before they get better.” July 18: Commerce Department announces housing starts are down 19.4 % over the last
12 months and a 7.5 % plunge in permits to build new homes, the largest monthly decline since January 1995. Permits are 25.2 % below their level a year ago, reflecting continued pessimism among builders over the near-term outlook for new homebuilding. July 18: Bear Stearns announces loss of value up to 90% on its two hedge funds making
a loss equal to over $1.4 billion.. July 19: The Dow Jones industrials close above 14,000 for the first time. July 25: The JEC examines the impact of the subprime lending crisis on Cleveland, Ohio,
one of the hardest hit communities in the nation. July 30: IKB Deutsche Industriebank, a German bank, is bailed out because of bad debts
on U.S. mortgage-backed securities. July 31: Home prices continued to fall, marking the 18th consecutive decline, since
December 2005.The 10-City Composite index showed a3.4% decline (biggest since 1991) and the 20-City Composite reported 2.8% decline.
AUGUST 2007
August 1: Two hedge funds managed by Bear Stearns that invested heavily in subprime mortgages declare bankruptcy. Investors in the funds file suit against Bear Stearns. August 6: American Home Mortgage files for bankruptcy. August 7: Senators Schumer and Dodd urge the director of the Office of Federal
Housing Enterprise Oversight (OFHEO) to consider temporarily raising the limit on purchases of home loans by Fannie Mae and Freddie Mac. August 7: The Federal Open Market Committee leaves the overnight federal funds rate at
5.25%, referring to tightening in the credit markets as a “correction”. August 9 and 10: European Central Bank and Federal Reserve intervene in markets by
pumping billions of dollars of liquidity into the markets. August 9: American International Group, one of the biggest U.S. mortgage lenders,
warns that mortgage defaults are spreading beyond the subprime sectors i.e. in the category just above subprime. August 9: BNP Paribas, a French bank, suspends three of its funds because of exposure
to U.S. mortgages. August 9: President Bush addressing the housing market crisis assures that there is
enough liquidity in the system to enable markets to correct. August 10: The federal regulator for Fannie Mae denies the mortgage finance company's
request to grow its investment portfolio, but did not close the door on the possibility of lifting the cap in the future. August 13: Aegis Mortgage files for bankruptcy.
40
August 16: Countrywide Financial, the nation’s largest mortgage lender, draws down $11.5 billion from its credit lines. August 16: All three major stock indexes were 10% lower than their July peaks – a
marker indicating a correction of the stock market, due to tightening in the credit markets. August 17: The Federal Reserve cuts the discount rate by half a point. Stocks rally. August 22: Realty Trace Inc announces foreclosures were up 93% in July 2007 from
July 2006. The national foreclosure rate in July was one filing for every 693 households. There were 179,599 filings reported last month, up from 92,845 a year ago. August 27: In a response to Schumer, Ben Bernanke writes: “The Federal Reserve, in
cooperation with other federal agencies, is closely monitoring developments in financial markets,” and the twelve Federal Reserve Banks “are working closely with community and industry groups dedicated to reducing the risks of foreclosure and financial distress among homebuyers.” But Chairman Bernanke opposes Senator Schumer’s proposal to raise GES portfolio caps and calls upon the private and public sectors to develop new “mortgage products” more suited for “low-and moderate-income borrowers, including those seeking to refinance.” August 27: National Association of Realtors reports that existing home sales declined
by 0.2 % in July, leaving the level of sales 9.0 % below the level 12 months prior. August 31: President Bush holds a press conference and says the “government has a role
to play” in the growing crisis and calls upon the Federal Housing Administration to help subprime borrowers refinance into loans insured by the federal agency expected to assist 60,000 delinquent borrowers and announces an additional program expected to help another 20,000 homeowners by reducing insurance premiums . August 31: Representative Barney Frank (D-MA) responds to President Bush’s press
conference and says that a greater public response is required with the Administrations cooperation and the portfolios of Fannie Mae and Freddie Mac can play a bigger role.
SEPTEMBER 2007 September 5: The National Association of Realtors releases statistics on pending sales
for existing homes. The figures reveal a 16.1 % decline in July from a year ago and a 12.2 % decline from the prior month. The July 89.9 levels the second lowest in the history of the index and its lowest since the September 11th attacks. September 5: The Federal Reserve releases its Beige Book3, a largely anecdotal report
on the economy based on interviews with business leaders throughout the country. Counter to investor sentiment, the findings do not indicate that the housing crisis is expanding into the general economy. The Dow Jones industrial average drops nearly 200 points. September 5: Senator Christopher Dodd, chairman of the Senate Banking Committee,
announces his intention to introduce a bill that would make it illegal for mortgage brokers 3 See Appendix 2
41
to steer borrowers eligible for standard mortgages into subprime loans. The bill also aims to eliminate additional predatory lending practices, such as hidden fees and prepayment penalties. September 6: The Mortgage Bankers Association releases a quarterly report showing
that the delinquency rates on one-to four-Unit residential properties was 5.12 % of all loans outstanding in the second quarter of 2007. The delinquency rate was up from 13.77 in the first quarter to 14.82 % in the second quarter. The delinquency rate for prime loans rose from 2.58% to 2.73 %. Compared to this time last year, the seriously delinquent rate is 23 basis points higher for prime loans and 304 basis points higher for subprime loans. September 7: In response to the Bureau of Labor Statistics (BLS) releases figures,
Senator Schumer calls on the Administration to act and demands strong leadership by the President, Secretary Paulson, and Chairman Bernanke. September 7: The U.S. Department of Labor’s Bureau of Labor Statistics (BLS)
releases figures showing that employers cut 4,000 jobs from payrolls last month, the first net decrease since 2003. 22000 construction jobs were lost in August, with most related to residential specialty trade contractors. Nearly 100,000 construction jobs have been lost since September 2006. Following the release, the Dow Jones Industrial Average dropped 200.87 points. September 10: Representative Barney Frank, chairman of the House Financial Services
Committee, implores Federal Reserve Chairman Ben Bernanke to raise investment caps on Fannie Mae and Freddie Mac. Frank also proposes to raise the Federal Housing Administration loan limit for single-family homes from $362,000 to $417,000. September 10: Senator Schumer introduces legislation to increase investment caps to
alleviate the credit crunch and proposes increasing the maximum for home mortgages – from $417,000 to $625,000 – that Fannie Mae and Freddie Mac are allowed to hold on their books. September 11: Secretary Henry M. Paulson reiterates the Administration’s opposition to
lifting the caps of the government-sponsored entities Fannie Mae and Freddie Mac. Secretary Paulson instead expresses support for more stringent regulation of the GSEs. September 14: Merrill Lynch & Co., the biggest underwriter of collateralized debt
obligations, signals that the subprime mortgage crisis may hurt third-quarter earnings. September 17: Merrill Lynch & Co. Inc.'s $1.3 billion bet on subprime lending takes a
turn for the worse when the world’s largest brokerage confirms job cuts at its First Franklin Financial Corp. unit. Reports with U.S. banking regulators show that Merrill Lynch Bank & Trust Co., where a lot of the First Franklin franchise is housed, lost $111 million through the first half of 2007. September 17: Nova Star Financial Inc gives up its real estate investment trust,
abandoning the lending business, because it cannot pay a $157 million dividend.
42
September 18: Realty Trac Inc. announces that home foreclosure filings surged to 243,000 in August, up 115 % from August 2006 and 36 % from July, marking the highest number of foreclosure filings. The foreclosure filing rate is now one in every 510 homes. September 18: Federal Reserve cuts target federal funds rate by a half point to 4.75 %. It
is the first rate reduction in four years and the steepest in nearly five years. In response to the rate cut, the Dow Jones industrial average jumps 200 points and closes up 335 points at 13, 739.39. September 18: The U.S. House of Representatives overwhelmingly passes H.R. 1852, the
“Expanding American Homeownership Act of 2007,” which expands funding for housing counseling, authorizes lower down payments for borrowers who can afford mortgage payments. September 19: The Joint Economic Committee holds its second hearing on the subprime
mortgage crisis. Opening the hearing, entitled “Evolution of an Economic Crisis?: The Subprime Lending Disaster and the Threat to the Broader Economy, Senator Schumer says: that the policy responses are not matching the magnitude of the risk that still lies ahead. September 19: Senator Schumer’s proposal to raise the limit on the size of home loans
insurable by the Federal Housing Administration (FHA) up to $417,000 for a single-family home, is passed out of the Senate Banking Committee as part of a major FHA reform bill put forward by Senate Banking Committee Chairman Christopher Dodd. September 19: The Office of Federal Housing Enterprise Oversight (OFHEO) agrees to
relax restrictions on the mortgage finance companies’ investment holdings, enabling Fannie Mae and Freddie Mac to buy $20 billion more in subprime mortgages September 19: The Commerce Department reports that construction of new homes fell by
2.6 % in August to the slowest pace in 12 years. September 20: Testifying before the House Financial Services Committee, Ben
Bernanke says that the credit crisis has created significant market stress. Treasury Secretary Henry Paulson adds that the administration is considering raising the Fannie Mae and Freddie Mac loan limits he also emphasizes that any changes to include so called jumbo loans must include stricter regulations for oversight. September 21: HSBC Holdings announces its plans to close its U.S. subprime unit,
Decision One Mortgage, and record an impairment charge of about $880 million. Approximately 750 U.S. employees are expected to be affected by the decision. September 25: The National Association of Realtors releases new statistics revealing
sales of existing single-family homes dropped by 4.3 % in August, compared to July which pushes the inventory of unsold homes to a record 4.58 million in August. September 25: According to the S&P/Case-Shiller’s Home Prices Indices home prices
continue to fall at an increasing rate. The 10-City Composite index shows an annual decline of 4.5 %– the largest in 16 years.
43
September 27: Ruminant Mortgage Capital, a home-loan investment company, downgrades its second-quarter profit as the bankers seize assets. September 27: The Commerce Department reports decline in sales of single-family
homes by 8.3% last month, the lowest level in seven years. The median price of a new home declined by 7.5% to $225,000 in August 2007 as compared to the same month a year ago. OCTOBER 2007 October 1: Former Federal Reserve Chairman Alan Greenspan says the housing crisis is
far from over. As in similar situations of inventory excess, one would expect home prices declines to continue until the rate of inventory liquidation reaches its peak. October 1: UBS reports its first quarterly loss in nine years. The largest wealth manager
in the world plans to write down$3.4 billion in its fixed-income portfolio and other departments and to cut 1,500 jobs in its investment bank. October 3: Residential foreclosures in New York City hit 698 during the third quarter. It
represents a 64% increase from the same period last year. Miami’s foreclosure rate per household is 116% higher than Los Angeles and 852% higher than New York City. October 4: The credit ratings agency, Moody’s Investors Service, predicts that
accelerating delinquencies from 2007 bonds are likely to surpass the number of delinquencies in 2006, which hit a peak not seen since 2000. October 9: The U.S. Securities and Exchange Commission (SEC) announces its
intention to review potential conflicts of interest in the credit rating agencies due to questionable practices associated with the ratings given to mortgage-backed securities. October 10: the National Association for Realtors revises down its outlook for home
sales. It lowers its prediction for existing home sales for the year from 5.92 million to 5.78 million. New home sales are projected to fall to 805,000 this year and to 752,000 next year. October 10: The Bush administration announces a new mortgage industry coalition to
help homeowners stay in their homes. Treasury Secretary Henry M. Paulson Jr. estimates that Hope Now Alliance will assist 2 million homeowners. The coalition includes 11 of the largest mortgage service companies, which represent 60 % of all mortgages in the nation joined by mortgage counseling agencies, investors, and large trade organizations. October 11: Senator Charles E. Schumer introduces his plan to allow Fannie Mae and
Freddie Mac to raise their portfolio caps by 10 percent in a six-month window. Of the total $147 billion increase, 85 % ($125 billion) is designated to aid subprime borrowers. Representative Barney Frank, chairman of the House Financial Services Committee, introduces a companion bill in the House. October 12: Paulson & Co., which has made money by betting on increasing
foreclosures this year, announces its intention to donate $15 million to the Center for Responsible Lending and The National Association of Consumer Advocates. The two
44
groups plan to use to the funding to establish an institute that offers legal aid to homeowners fighting foreclosure. October 15: Representative Barney Frank holds a committee field hearing entitled
“Mortgage Lending Disparities” which focuses on mortgage lending disparities in the Boston area of Black and Latino borrowers who were much more likely than whites or Asians living the same area to receive higher-priced loans. October 15: Strongly urged to act by the Treasury Department, Citigroup, JPMorgan
Chase, and Bank of America announce the creation of a new entity, called a Master Liquidity Enhancement Conduit, to raise $200 billion in order to purchase securities that are otherwise likely to be dumped on the market and further depress the housing debt crisis. October 15: Citigroup acknowledges that its risk management models failed its
customers and shareholders during this summer’s credit crisis, leading to the company’s 57 % drop in third-quarter profit. Citigroup was forced to write off $3.55 billion and set aside $2.24 billion to cover anticipated losses stemming from failing mortgages and consumer loans. October 16: The National Association of Home Builders reports that its housing market
index, which tracks builders’ perceptions of conditions and expectations for home sales over the next six months, dropped to 18, its lowest level since the inception of the index in 1985. The housing market index has declined for eight straight months October 17: The National League of Cities releases a report in which 7 out of 10
finance officers from major cities throughout the country offer pessimistic predictions for the economic future of their cities. They report that the housing downturn is causing a major decrease in city tax revenue and is only likely to worsen in the coming months. October 17: The Commerce Department reports that U.S. home construction starts fell
10.2 percent last month to their lowest level in more than 14 years. Building permit activity, an indicator of future construction plans, declined 7.3%, the largest drop since January 1995. October 17: The Federal Reserve’s “Beige Book,” a survey of businesses, indicates that
the housing crisis is intensifying and that businesses are concerned that other areas of the economy are likely to suffer as a result. October 18: Standard & Poor’s cuts the credit ratings on $23.35 billion of securities
backed by pools of home loans offered to borrowers during the first half of the year. The downgrades even hit securities rated AAA, which is the highest of the 10 investment-grade ratings and the rating of government debt. October 18: the Labor Department reports a surge in lay-offs with unemployment
benefit claims far surpassing expectations. Applications increased 28,000 from the previous week, the largest one-week jump since February 10th.
45
October 18: Senator Schumer calls upon the Securities and Exchange Commission (SEC) to investigate Countrywide Financial Corporation along with its chief executive Angelo Mozilla. October 22: Representatives Brad Miller (D-NC), Mel Watt (D-NC), and Barney Frank
(D-MA) introduce comprehensive legislation to combat abuses in the mortgage lending market, and to protect mortgage consumers and investors. The bill, H.R. 3915, “The Mortgage Reform and Anti-Predatory Lending Act of 2007,” not only reforms mortgage practices for owners but also includes foreclosure protection for renters. October 24: the House Financial Services Committee, chaired by Congressman Barney
Frank (D-MA), holds a hearing entitled “Legislative Proposals on Reforming Mortgage Practices.” October 24: Merrill Lynch writes down $7.9 billion due to exposure to collateralized debt
obligations, complex debt instruments, and subprime mortgages. As a result, the firm takes a $2.3 billion loss, the largest in the firm’s history. October 25: The Joint Economic Committee releases a report analyzing the greater
financial impact of the subprime foreclosure boom. The JEC report entitled, “The Subprime Lending Crisis: The Economic Impact on Wealth, Property Values and Tax Revenues, and How We Got Here” reveals that families, neighborhood property values, and state and local governments will lose billions of dollars as two million subprime mortgage homes are foreclosed.” October 29: John Robbins, former chairman of the Mortgage Bankers Association, says
approximately a half of million U.S. mortgage borrowers each year for the next few years risk foreclosure. He expects that 1 million borrowers will lose favor with their lenders each year and that 500,000 of them will not be able to save their home loans. October 30: Shareholders sue Merrill Lynch & Co for issuing false and misleading
statements regarding its exposure to risk mortgage investments. October 30: Reports from the S&P/Case-Sheller index indicate that housing prices have
again fallen at record rates. In the largest drop since June 1991, the 10 city index declined 5 % in August 2007 as compared to the same month during the previous year. October 30: Addressing Women in Housing and Finance, Treasury Assistant Secretary
David Nason outlines the Bush Administration’s foreclosure avoidance plan. The plan includes FHA modernization, changes in the Federal Tax Code related to mortgage debt cancellation and the Hope Now Alliance charged with coordinating efforts to reach more homeowners and find long-term solutions. October 31: The Federal Reserve Board lowers the federal funds rate by one-quarter
percentage point to 4.50 %.
NOVEMBER 2007 November 28: The National Association of Realtors reports that sales of existing
single-family homes and condominiums dropped by 1.2 % in October to a seasonally
46
adjusted annual rate of 4.97 million units. The median price of a home sold in October declined to $207,800, a drop of 5.1 % from October 2006. It is the single largest one year decline on record. November 28: With the subprime housing credit crisis spreading, the Commerce
Department reports that orders to factories for big-ticket manufactured goods declined by 0.4 % in October. It was the third consecutive decline, the longest slump in nearly four years. November 29: According to RealtyTrac, there were 222,451 foreclosure filings last
month. It is a 94 % increase from October 2006 and represents one foreclosure filing for every 555 households in the nation. The 2 % increase from September 2007 indicates that the subprime crisis is only getting worse. November 29: According to a government report released today, there were 516,000 new
homes for sale at the end of October. It would take 8.5 months to clear that inventory at the current sales pace. November 29: Federal Reserve Chairman Ben Bernanke indicates that the economy
may need another general rate cut. He expects consumers to suffer from the deepening Housing slump. November 29: California Governor Arnold Schwarzenegger rolls out a $1.2-million
education campaign to help borrowers and lenders restructure loans before a home is lost to foreclosure. November 30: Representative Barney Frank (D-MA), holds a hearing entitled
“Foreclosure Prevention and Intervention: The Importance of Loss Mitigation Strategies in Keeping Families in Their Homes.” November 26: Senator Charles E. Schumer urges the Federal Home Loan Bank System
to stop extending advances backed by predatory mortgages peddled by lenders, such as Countrywide. Senator Schumer calls for stricter collateral guidelines to reduce exposure to risky mortgages and encourages banks to modify more of their unaffordable loans. November 21: Shares of Countrywide, the largest U.S. Mortgage Lender, close below
$10 for the first time in more than five years. November 19: Fannie Mae shares are down 7.3 % to $37.70 on reports from Credit
Suisse that the government sponsored entity may report a loss of between $1 billion to $5 billion on its subprime AAA portfolio. November 15: Senator Charles E. Schumer, the senior senator from New York, releases a
new report revealing how 50,000 Upstate New Yorkers may have been duped into taking on costly subprime loans even though they could have qualified for more affordable, prime mortgages. November 15: The U.S. House of Representatives approves H.R. 3915, “The Mortgage
Reform and Anti-Predatory Lending Act of 2007,” The historic bipartisan legislation reins in the abusive lending practices that contributed to the current mortgage crisis.
47
November 15: Barclays Group PLC takes a $2.7 billion write-down for losses on securities linked to the U.S. subprime mortgage market collapse. November 2: Representative Barney Frank (D-MA), holds a hearing entitled “Progress
in Administration and Other Efforts to coordinate and Enhance Mortgage Foreclosure Prevention.” One focus of the hearing is the “HOPE NOW” initiative formed by the Departments of Treasury and Housing and Urban Development. November 4: On top of the $5.9 billion write-down reported in early October, Citigroup
says it will take an additional $8billion to $11 billion write-down related to subprime mortgages and the C.E.O. Charles O. Prince Mr. Prince announces his resignation and leaves with $105.2 million in cash and stock – in addition to the $53.1 million in compensation he took home over the past four years. November 6: David Trone, a securities analyst at Fox-Pitt Kelton, downgrades Morgan
Stanley amid speculation that the brokerage firm will suffer losses of $6 billion due to the reduced value of credit investments. November 8: Testifying before the Joint Economic Committee, Ben Bernanke expresses
his concern over the subprime housing crisis and floats the idea of providing governmental guarantees against defaults on so-called “jumbo” loans, those above the $417,000 limit on mortgages that can be backed by Fannie Mae or Freddie Mac. November 8: Senator Charles E. Schumer introduces legislation requiring better, simpler
disclosure by mortgage lenders so that loan terms are conveyed to consumers in a clear and straightforward manner. The new template would display critical loan information—such as the monthly loan payment and interest rate, before and after resets—in a separate box, apart from other terms or details. November 14: According to Realty Trac, foreclosure filings rose in 77 of the largest 100
metropolitan areas from the prior quarter. Overall, residential foreclosure filings nearly doubled in the third quarter from a year earlier. November 14: HSBC Holdings PLC, Europe’s biggest bank, reports that it took a $3.4
billion impairment charge at its U.S. consumer finance division, HSBC Finance Corp.
DECEMBER 2007 December 3: Credit agency Moody’s widens its debt review to downgrade debt worth
$116bn. December 4: Fannie Mae issues $7bn of shares to cover losses linked to the housing
markets. December 4: U.S. Senators Bob Casey (D-PA), Chris Dodd (D-CT), Charles Schumer
(D-NY), and Sherrod Brown (D-OH) write to Treasury Secretary Henry Paulson to urge him to include as many borrowers as possible in his yet-to-be-announced subprime plan. December 5: Senator Clinton calls for a 90-Day moratorium on home foreclosures and a
five-year freeze on fluctuating subprime rates.
48
December 5: The Wall Street Journal reports that New York Attorney General Andrew M. Cuomo sent out subpoenas to Major Wall Street firms including Merrill Lynch, Morgan Stanley, Deutsche Bank, Bear Sterns, and Lehmann Brothers over the late summer to explore further their role in the packaging and selling of subprime mortgages. December 6: President Bush announces measures to help many struggling homeowners.
President Bush touts the Hope Now Alliance as an example of government uniting members of the private sector to address voluntarily the housing crisis without taxpayer subsidies or government mandates. The President calls upon Congress to reform both the Federal Housing Administration and the Government Sponsored Enterprises Freddie Mac and Fannie Mae. December 6: Representative Barney Frank (D-MA), chairman of the House Financial
Services Committee, holds a hearing entitled “Loan Modification and Foreclosure Prevention” which addresses “Mortgage Reform andante-Predatory Lending Act of 2007” and “Emergency Mortgage Loan Modification Act of 2007”. December 10: Swiss bank UBS announced it would write down an additional $10 Billion
in subprime losses –possibly resulting in a net loss for all of 2007. UBS also announced it has solicited a cash infusion of $11.5 Billion from GIC, Singapore’s sovereign wealth fund, and an unknown Middle Eastern investor. December 10: Fannie Mae and Freddie Mac announce that they are changing their
criteria for purchasing delinquent home loans. The two government-sponsored entities, which together own or guarantee approximately two-fifths of U.S. home mortgage debt, have recently set aside billions of dollars to compensate for bad home loans. Their profits have declined at a time when home prices are falling and defaults are soaring on high-risk mortgages. December 11: Contrary to the recommendations of several regional Fed Banks, the
Federal Reserve Board announced only 25 basis-point cut in the discount rate to 4.75%. December 11: Washington Mutual announced that it expected its fourth quarter loan
losses would reach $1.6 Billion and expected that 3,000 Washington Mutual employees would be laid off. December 14: The US Senate passed legislation giving needed tax relief to those at risk
of foreclosure on their subprime Mortgages. The Mortgage Forgiveness Debt Relief Act both extends the tax deductions on mortgage insurance premiums and eliminates taxes accrued by receiving debt forgiveness. Previous to this legislation, debt forgiveness was treated as income and taxed accordingly, further crippling struggling American families. December 17: Treasury Secretary Henry Paulson announced he favors temporarily
allowing Fannie Mae and Freddie Mac to purchase home loans in excess of $417,000.This allows Fannie Mae and Freddie Mac to provide home loans in more areas throughout the country. December 18: The Federal Reserve proposed new rules governing mortgage lenders.
49
December 18: The Commerce Department reported that housing construction was down 3.7 % for the month of November to a seasonally adjusted rate of 1.187 million units. This marked a 24.2 % drop in new home construction in the 12 month period and the lowest level of home construction in more than 16 years. December 19: Senator Chuck Schumer addressed the current subprime lending crisis as
well as the potential for a recession in a speech at the Brookings Institution. In his speech, Schumer highlighted the shortcomings of the Bush administration's recent proposals to address the subprime mortgage crisis saying, “When we’re facing as many as 2.2 million foreclosures over the next two years, dealing with only 10% of the borrowers at risk is simply not good enough.” December 19: Morgan Stanley announced it would be writing down an additional $9.4
billion in losses on subprime linked investments and it would be selling a $5 billion dollar stake to a foreign investment fund. December 20: Senator Chuck Schumer, Chairman of the Joint Economic Committee and
Congresswoman Carolyn Maloney, Vice Chair of the JEC, released the Committee’s Annual Economic Report that concluded that the subprime mortgage crisis was the result of a failure to oversee financial markets effectively. Schumer also criticized the administration.
JANUARY 2008 January 4: The Labor department announced that the unemployment rate skyrocketed
from 4.7% to 5% in December. These numbers were fueled by the loss of 28,500 jobs in residential construction and 7,000 jobs lost in the mortgage lending industry throughout 2007. The fall to 5% made December’s unemployment jump the largest unemployment increase since the days after Sept. 11, 2001. January 10: Countrywide Financial reported that late mortgage payments and
foreclosures reached the highest level ever recorded this past December. The foreclosure rate on Countrywide’s mortgages grew from just 0.7% a year ago to 1.44%last month. On the announcement of this news, shares in Countrywide dropped to their lowest price in over a decade. January 11: Merrill Lynch, the nation’s third largest securities firm, announced it would
need to write down more than double its initial projection i.e.$15 billion related to subprime mortgage losses instead of $7 billion. January 11: Bank of America, the nation’s second largest banking institution, announced
that it would buy Countrywide Financial, the nation’s largest mortgage lender. This acquisition ended days of speculation that Countrywide, due to its role in the proliferation of subprime mortgages, would be forced to declare bankruptcy. January 11: Representative Barney Frank said that Bank of America’s purchase of
Countrywide could be a positive development in the subprime crisis.
50
January 15: Citigroup, the largest bank in the U.S., announced that its mortgage portfolio dropped in value by $18.1 Billion and its first quarterly loss in 16 years. January 17: Lehman Brothers said it would no longer continue the practice of wholesale
mortgage lending. As a pioneer in issuing mortgage backed securities, Lehman Brothers also announced it would cut 1,300 jobs. These job cuts come on top of 2,500 other jobs eliminated since June 2007. January 22: The Federal Reserve Board lowers the federal funds rate by three-quarter
percentage point to 3.50 from 4.25%. The Dow Jones industrial average closes 11,971, down 128 points, or 1.1%, after rebounding nearly 400 points off session lows and Standard & Poor's 500 falls 15 points, or 1.1%, to 1,311. January 29: The number of houses in foreclosure rose 79% in 2007, states Realty Trac. January 30: Federal Reserve Board announced a 50 basis-point cut in the discount rate
to 3% from 3.50%. January 30: Standards & Poor’s announces to cut credit ratings of $534 billion in
subprime mortgage backed securities.
FEBRUARY 2008 February 2: Labour Department announces loss of 17000 jobs in January, the first
negative month for employment growth. February 5: UBS reports a loss of $11.3 billion loss related to mortgage-backed
securities. February 6: President Bush signed a bill authorizing a $168 billion stimulus package that
will offer tax rebates to 130 million Americans. February 8: S&P 500 fell 8.9% this week as fears of corporate debt defaults rose as the
cost of insuring that debt rose to record highs. Weekly report claims jobless people at 345,000, a slight decrease from the prior week's 356,000. February 14: Treasury Secretary Henry Paulson and Federal Reserve Chairman Ben
Bernanke testify before the Senate Banking Committee in Washington. The Dow falls to 56 points, or 0.5%, to 12,321, while the S&P 500 is off 4 points. February 19: Credit Suisse, announces to write down $1 billion in subprime losses. February26: Fannie Mae announced $3.6 billion quarterly loss for the three months
ending on Dec. 31, following earnings of $604 million in the similar period a year earlier. February 27: Federal Reserve Chairman Ben Bernanke told Congress that the world's
financial markets have been in turmoil since last summer, credit is tight and inflation is rising.
MARCH 2008
March 6: HSBC announced a $17.2bn (£8.7bn) loss after the decline in the US housing market.
51
March 6: Over 900,000 households are in the foreclosure process, up 71% from a year ago, according to a survey by the Mortgage Bankers Association. That figure represents 2.04% of all mortgages, the highest rate in the report's quarterly in the 36-year history. March10: A loss of 63000 jobs has been estimated in the month of February due to the
recession. March 11: The Fed boosted the size of its 28-day loans to banks to $200 billion this
month from $160 billion. The central bank announced on March 11 a $200 billion swap of Treasuries for mortgage bonds held by dealers to facilitate market-making. March 12: Foreclosure filings jumped 60 percent and bank seizures more than doubled in
February, according to data from RealtyTrac Inc., a data vendor. More than 223,000 properties were in some stage of default, equal to 1 in every 557 U.S. households, March 16: The Fed acted just after JP Morgan Chase & Co. agreed to buy rival Bear
Stearns Cos(one of the nation’s largest underwriters of mortgage bonds) for $236.2 million in a deal (one tenth of its original value) that represents a stunning collapse for one of the world's largest and most venerable investment banks. It will provide up to $30 million to JP Morgan Chase to help it in financing. March16: The central bank approves a cut in its lending rate to financial institutions to
3.25% from 3.50%, effective immediately, and created another lending facility for big investment banks to secure short-term loans. The "discount" rate cut announced Sunday covers only short-term loans that financial institutions get directly from the Federal Reserve and does not apply to individual investors. March17: Mortgage losses at banks and investment firms now total $195 billion,
according to Bloomberg calculations. Dollar tumbled to 12 year low against yen March 18: Federal Reserve Board announces a75 basis-point cut in the discount rate to
2.25% from 3%. March 19: Federal regulators agree to let Fannie Mae and Freddie Mac take on another
$200 billion in subprime mortgage debt. March 23: Goldman Sachs Group and smaller rival Lehman Brothers Holdings have
their credit-rating outlook cut to negative by Standard & Poor’s which affirmed its long-term credit rating of AA- for Goldman and A+ for Lehman. March 26: Bank of America announces to write down $6.5 billion in the first-quarter. March 28: The US Federal Reserve announces to make a further $100bn available to
major banks in April, trying to ease concerns about a global credit crunch. March 31: The Fed would essentially serve as a financial markets moderator, stepping in
if the nation's markets were again threatened by an episode like the near collapse of Bear Stearns. The plan would also give the central bank greater oversight of investment banks and previously unregulated entities like hedge funds and private equity firms that have wielded growing influence in financial markets in recent years.
52
APRIL 2008 April 1: US Treasury Secretary, Mr. Henry Paulson proposes new regulations vesting
new powers in the Federal Reserve as a “market stability regulator”. The Commodity Future Trading Commission would be merged with the Securities and Exchange Commission. He further proposes the establishment of a “Mortgage Origination Commission” to set licensing standards for mortgage brokers. April 1: Swiss financial giant UBS reports that its write downs have more than doubled
to about $37bn with a loss of $19bn for the last quarter of the fiscal year. Deutsch Bank reveals a write-down of $4 bn. April 3: Federal Chairman Ben Bernanke testified before Congress's Joint Economic
Committee and announces that the US economy is likely to enter into a recession. He quoted that “It now appears likely that real gross domestic product (GDP) will not grow much, if at all, over the first half of 2008 and could even contract slightly”. April 4: US unemployment rate increases to 5.1% with payrolls falling to 80000. April 16: US release the “Beige Book” which announces weak economy due to the
subprime meltdown. April 16: Privately owned housing starts fell to a seasonally adjusted 947,000 annual rate
in March, according to the Commerce Department. April 18: Merrill Lynch reports a $2 billion loss in the first quarter of 2008. April 18: Citibank writes down $5.11 billion quarterly loss.
The actual countdown began in the year 2004 when the Federal Reserve began a series of interest rate hikes that raised the cost of borrowing from the lowest levels since 1950. It increased the interest rates seventeen times and paused only in June 2006 when the borrowing cost touched 5.25 per cent. As a result of this housing market began sliding in August 2005 and that continued through 2006. Building rates and housing prices tumbled. The leveraging process, the securitization mechanism and various parties helped to result in a whole subprime saga.
Today the whole scenario has changed from what it was three years prior to this period. The Federal Reserve Bank has been frequently lowering the fed interest rates. Billions of dollars are being pumped into the economy. Joint Economic Committee and Securities and Exchange Committee along with the federal bank left no stone unturned to help the economy from slipping into recession. With all these events taking place it becomes necessary to understand the role of various parties involved in the whole carnage.
53
However, today the whole scenario has changed from what it was three years prior to this period. The Federal Reserve Bank has been frequently lowering the fed interest rates. Billions of dollars are being pumped into the economy. Joint Economic Committee and Securities and Exchange Committee along with the federal bank left no stone unturned to help the economy from slipping into recession. With all these events taking place it becomes necessary to understand the role of various parties involved in the whole carnage.
54
TTHHEE PPAARRTTIIEESS IINN TTHHEE CCRRIISSIISS AANNDD TTHHEEIIRR RROOLLEE
WWaallkkiinngg tthhee LLiinnee
“US Financial markets, it turns out were characterized less by sophistication than by sophistry, which my dictionary defines as ‘a deliberately invalid argument displaying ingenuity in
reasoning in the hope of deceiving someone’. E.g., repackaging dubious loans into collateralized debt obligations creates a lot of perfectly safe, AAA assets that will never go bad.”
- Paul Krugman
The sub-prime carnage is the consequence of too much money in the economic system, over ambitious lenders, innovatively created financial instruments that had their in-built flaws and lax regulatory systems. The unwillingness of many homeowners to sell their homes at reduced market prices, increasing foreclosure rates and overbuilding during the boom period, had significantly increased the availability of housing inventory. American banks with great liquidity, lax standards of the authorities, inefficient credit ratings by the agencies etc, each contributed to this carnage in their own ways. This excess supply of home inventory decreased the prices of the houses and more homeowners were at risk of default and foreclosure. A variety of factors have contributed to an increase in the payment delinquency rate for sub-prime Adjustable Rate Mortgages borrowers.
The role of various parties that have amplified this situation is elucidated below:
Role of Borrowers
"As the decision-maker, the role of the consumer is to acquire the financial acumen necessary and take advantage of the competitive marketplace, shop compare, ask questions
and expect answers." - Harry Dinham, president of the National Association of Mortgage Brokers
The whole sub-prime saga started with the unsuitable borrowers having limited or tarnished credit history. The loans issued to these borrowers tend to carry more credit risk but less interest rate risk than securities backed by prime loans. This was because sub-prime borrowers had a shorter time horizon and fewer opportunities to refinance when interest rates fell.
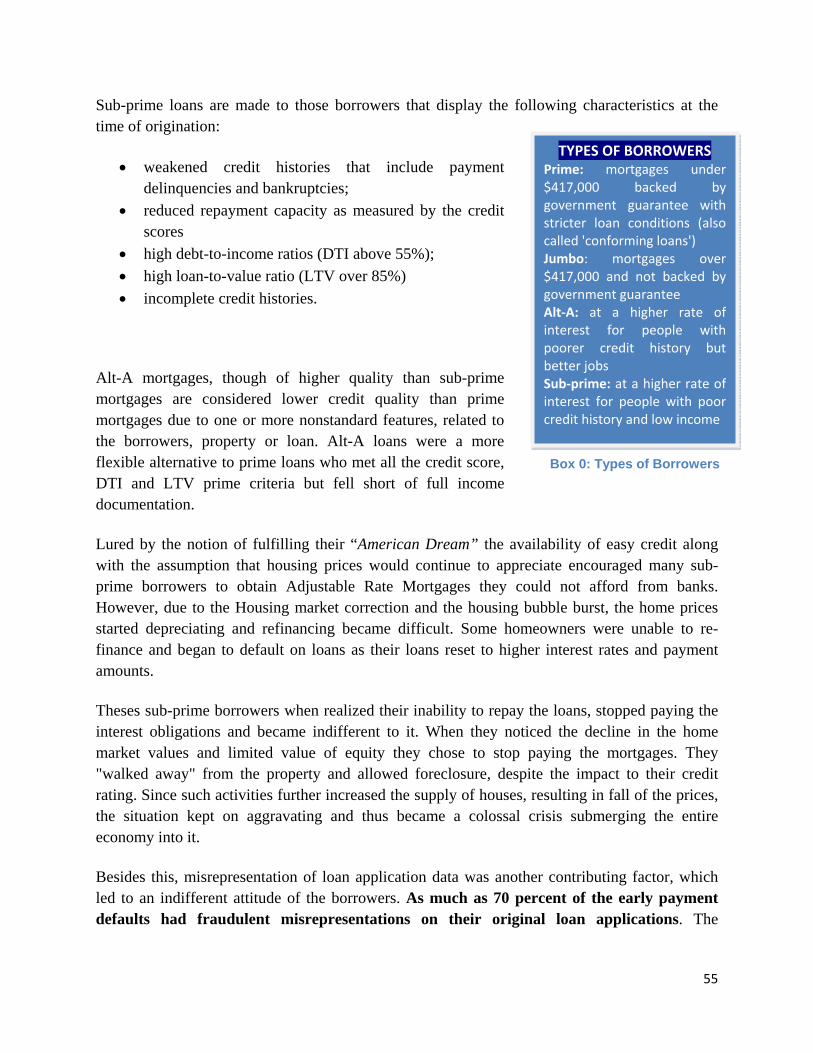
55
Sub-prime loans are made to those borrowers that display the following characteristics at the time of origination:
• weakened credit histories that include payment delinquencies and bankruptcies;
• reduced repayment capacity as measured by the credit scores
• high debt-to-income ratios (DTI above 55%); • high loan-to-value ratio (LTV over 85%) • incomplete credit histories.
Alt-A mortgages, though of higher quality than sub-prime mortgages are considered lower credit quality than prime mortgages due to one or more nonstandard features, related to the borrowers, property or loan. Alt-A loans were a more flexible alternative to prime loans who met all the credit score, DTI and LTV prime criteria but fell short of full income documentation.
Lured by the notion of fulfilling their “American Dream” the availability of easy credit along with the assumption that housing prices would continue to appreciate encouraged many sub-prime borrowers to obtain Adjustable Rate Mortgages they could not afford from banks. However, due to the Housing market correction and the housing bubble burst, the home prices started depreciating and refinancing became difficult. Some homeowners were unable to re-finance and began to default on loans as their loans reset to higher interest rates and payment amounts.
Theses sub-prime borrowers when realized their inability to repay the loans, stopped paying the interest obligations and became indifferent to it. When they noticed the decline in the home market values and limited value of equity they chose to stop paying the mortgages. They "walked away" from the property and allowed foreclosure, despite the impact to their credit rating. Since such activities further increased the supply of houses, resulting in fall of the prices, the situation kept on aggravating and thus became a colossal crisis submerging the entire economy into it.
Besides this, misrepresentation of loan application data was another contributing factor, which led to an indifferent attitude of the borrowers. As much as 70 percent of the early payment defaults had fraudulent misrepresentations on their original loan applications. The
TYPES OF BORROWERS Prime: mortgages under$417,000 backed bygovernment guarantee withstricter loan conditions (alsocalled 'conforming loans') Jumbo: mortgages over$417,000 and not backed bygovernment guarantee Alt‐A: at a higher rate ofinterest for people withpoorer credit history butbetter jobs Sub‐prime: at a higher rate ofinterest for people with poorcredit history and low income
Box 0: Types of Borrowers
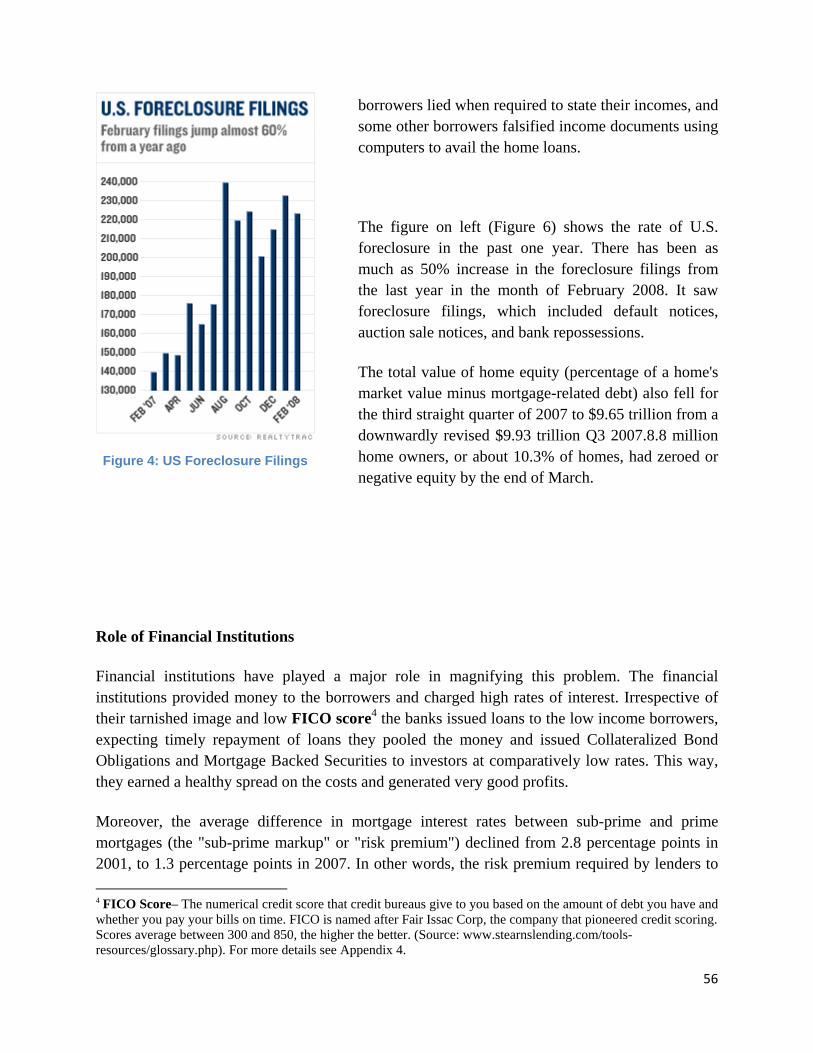
56
borrowers lied when required to state their incomes, and some other borrowers falsified income documents using computers to avail the home loans.
The figure on left (Figure 6) shows the rate of U.S. foreclosure in the past one year. There has been as much as 50% increase in the foreclosure filings from the last year in the month of February 2008. It saw foreclosure filings, which included default notices, auction sale notices, and bank repossessions.
The total value of home equity (percentage of a home's market value minus mortgage-related debt) also fell for the third straight quarter of 2007 to $9.65 trillion from a downwardly revised $9.93 trillion Q3 2007.8.8 million home owners, or about 10.3% of homes, had zeroed or negative equity by the end of March.
Role of Financial Institutions
Financial institutions have played a major role in magnifying this problem. The financial institutions provided money to the borrowers and charged high rates of interest. Irrespective of their tarnished image and low FICO score4 the banks issued loans to the low income borrowers, expecting timely repayment of loans they pooled the money and issued Collateralized Bond Obligations and Mortgage Backed Securities to investors at comparatively low rates. This way, they earned a healthy spread on the costs and generated very good profits.
Moreover, the average difference in mortgage interest rates between sub-prime and prime mortgages (the "sub-prime markup" or "risk premium") declined from 2.8 percentage points in 2001, to 1.3 percentage points in 2007. In other words, the risk premium required by lenders to 4 FICO Score– The numerical credit score that credit bureaus give to you based on the amount of debt you have and whether you pay your bills on time. FICO is named after Fair Issac Corp, the company that pioneered credit scoring. Scores average between 300 and 850, the higher the better. (Source: www.stearnslending.com/tools-resources/glossary.php). For more details see Appendix 4.
Figure 4: US Foreclosure Filings
57
offer a sub-prime loan declined. This occurred even though sub-prime borrower and loan characteristics declined overall during the 2001-2006 period, which should have had the opposite effect. In essence this very less difference in the interest rates made the sub-prime loans all the more attractive to the borrowers.
In addition to considering higher-risk borrowers, lenders had offered increasingly high-risk loan options and incentives by introducing different types of mortgages such as:
• Interest Only Mortgages: These loans require the borrower to pay only the interest portion of the loan for the first few years thus keeping the payment relatively low for the first few years before the interest only component expires. Then the borrower must pay the principle and interest component of the mortgage payment, which is a much higher amount.
• Adjustable Rate Mortgages: Unlike traditional mortgages that have a fixed interest rate making the payment same each month, with an adjustable rate mortgage if interest rates rises (as they have been recently) the monthly mortgage payment goes up as well. An adjustable rate mortgage (ARM) is a mortgage loan where the interest rate is periodically adjusted based on a variety of indexes.
• Low Initial Fixed Rate Mortgages: These mortgages that initially have very low fixed rates and then quickly convert to ARM.
When the indices shot up, the interest rates on the Adjustable Rate Mortgages also increased and reset at higher levels. The resets caused payments to rise by at least 30 percent to an amount that many borrowers could no longer afford. Further payment of high interests and the initial amount of the house yet to be repaid, made the housing a very costly affair for them. This prompted the low-income borrowers to leave the houses and let it be foreclosed.
Role of securitization Securitization is a structured finance process in which assets, receivables or financial instruments are acquired, classified into pools, and offered as collateral for third-party investment. Due to securitization, investor appetite for Mortgage-Backed Securities (MBS), and Collateralized Debt Obligations (CDO) and the tendency of rating agencies to assign investment-grade ratings to these loans with a high risk of default could be originated, packaged and the risk readily transferred to others.
The borrower takes loan from the lender who underwrites and funds the loans with the help of a mortgage broker. The lender then sells the loan to the issuer, who is a bankruptcy-remote special purpose entity (SPE) formed to facilitate a securitization and to issue securities to investors. The
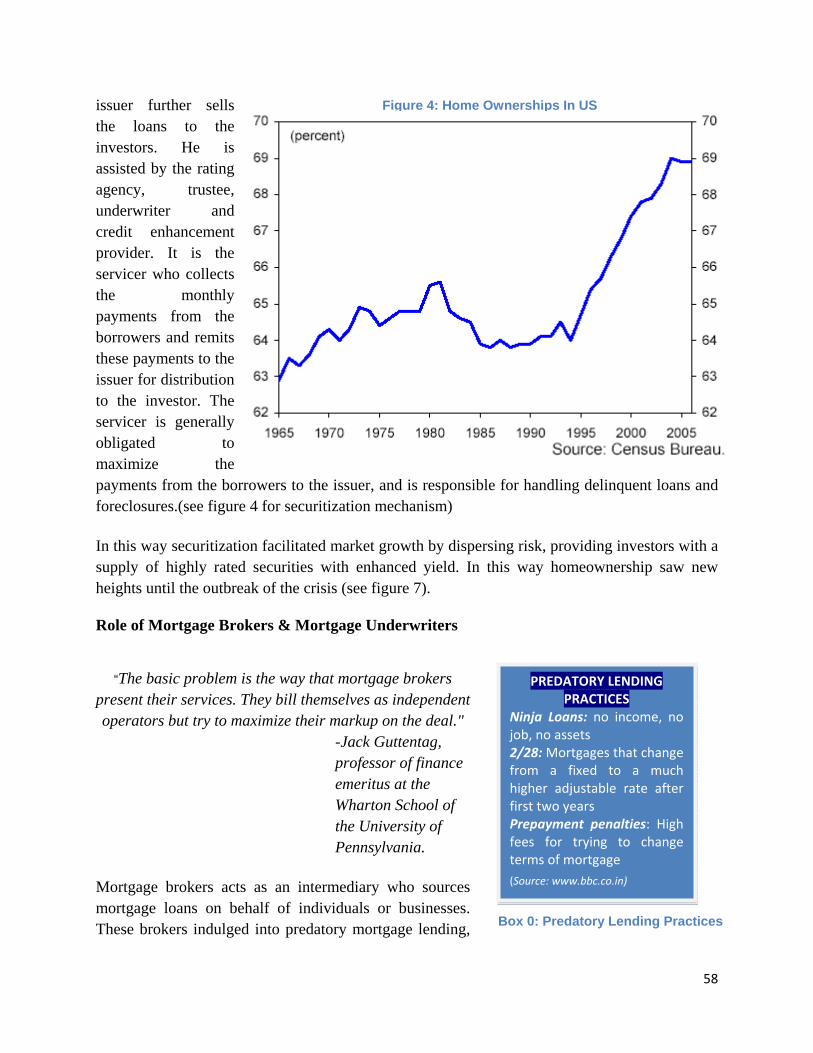
58
issuer further sells the loans to the investors. He is assisted by the rating agency, trustee, underwriter and credit enhancement provider. It is the servicer who collects the monthly payments from the borrowers and remits these payments to the issuer for distribution to the investor. The servicer is generally obligated to maximize the payments from the borrowers to the issuer, and is responsible for handling delinquent loans and foreclosures.(see figure 4 for securitization mechanism)
In this way securitization facilitated market growth by dispersing risk, providing investors with a supply of highly rated securities with enhanced yield. In this way homeownership saw new heights until the outbreak of the crisis (see figure 7).
Role of Mortgage Brokers & Mortgage Underwriters
“The basic problem is the way that mortgage brokers
present their services. They bill themselves as independent operators but try to maximize their markup on the deal."
-Jack Guttentag, professor of finance emeritus at the Wharton School of the University of Pennsylvania.
Mortgage brokers acts as an intermediary who sources mortgage loans on behalf of individuals or businesses. These brokers indulged into predatory mortgage lending,
Figure 4: Home Ownerships In US
PREDATORY LENDING PRACTICES
Ninja Loans: no income, nojob, no assets 2/28:Mortgages that changefrom a fixed to a muchhigher adjustable rate afterfirst two years Prepayment penalties: Highfees for trying to changeterms of mortgage (Source: www.bbc.co.in)
Box 0: Predatory Lending Practices
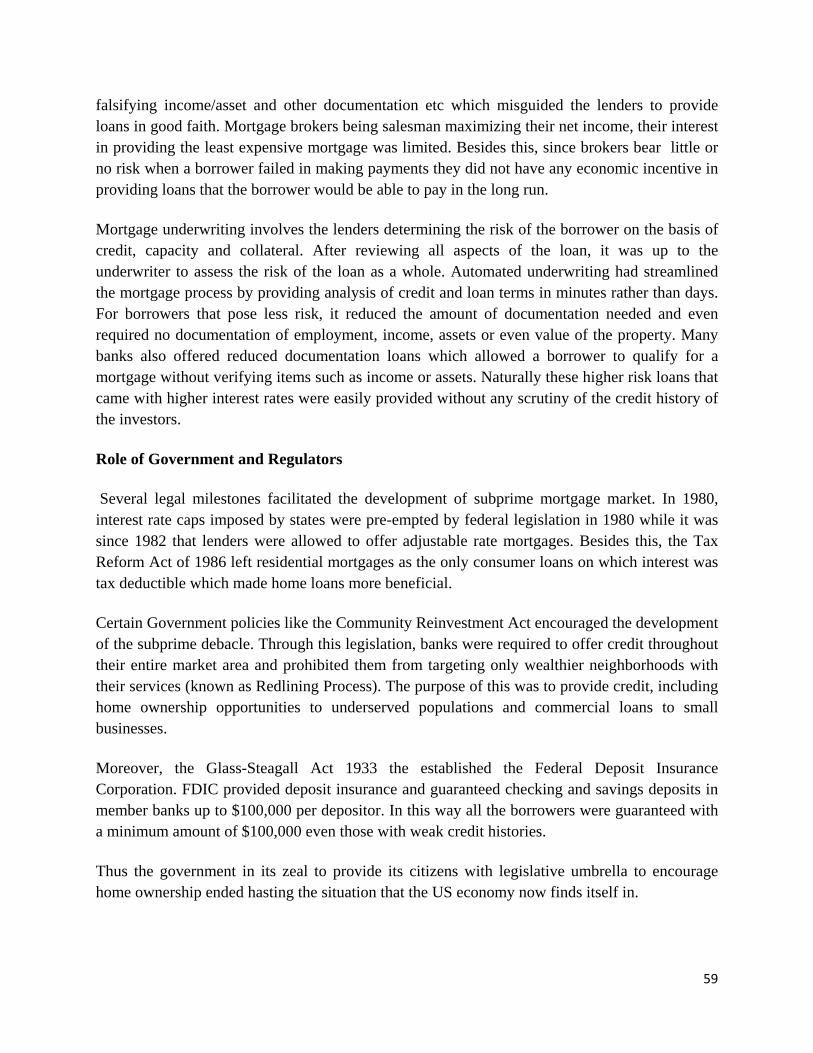
59
falsifying income/asset and other documentation etc which misguided the lenders to provide loans in good faith. Mortgage brokers being salesman maximizing their net income, their interest in providing the least expensive mortgage was limited. Besides this, since brokers bear little or no risk when a borrower failed in making payments they did not have any economic incentive in providing loans that the borrower would be able to pay in the long run.
Mortgage underwriting involves the lenders determining the risk of the borrower on the basis of credit, capacity and collateral. After reviewing all aspects of the loan, it was up to the underwriter to assess the risk of the loan as a whole. Automated underwriting had streamlined the mortgage process by providing analysis of credit and loan terms in minutes rather than days. For borrowers that pose less risk, it reduced the amount of documentation needed and even required no documentation of employment, income, assets or even value of the property. Many banks also offered reduced documentation loans which allowed a borrower to qualify for a mortgage without verifying items such as income or assets. Naturally these higher risk loans that came with higher interest rates were easily provided without any scrutiny of the credit history of the investors.
Role of Government and Regulators
Several legal milestones facilitated the development of subprime mortgage market. In 1980, interest rate caps imposed by states were pre-empted by federal legislation in 1980 while it was since 1982 that lenders were allowed to offer adjustable rate mortgages. Besides this, the Tax Reform Act of 1986 left residential mortgages as the only consumer loans on which interest was tax deductible which made home loans more beneficial.
Certain Government policies like the Community Reinvestment Act encouraged the development of the subprime debacle. Through this legislation, banks were required to offer credit throughout their entire market area and prohibited them from targeting only wealthier neighborhoods with their services (known as Redlining Process). The purpose of this was to provide credit, including home ownership opportunities to underserved populations and commercial loans to small businesses.
Moreover, the Glass-Steagall Act 1933 the established the Federal Deposit Insurance Corporation. FDIC provided deposit insurance and guaranteed checking and savings deposits in member banks up to $100,000 per depositor. In this way all the borrowers were guaranteed with a minimum amount of $100,000 even those with weak credit histories.
Thus the government in its zeal to provide its citizens with legislative umbrella to encourage home ownership ended hasting the situation that the US economy now finds itself in.
60
Role of Credit Rating Agencies "You can't expect an individual investor to know the details of these complex regulations, these
complex packages. As society gets more complicated, we rely more and more on these credit rating agencies."
-Senator Charles S Schumer
Credit rating agencies have played a major role in escalating the problem of the sub-prime crisis. The credit rating agencies assigned credit ratings to different types of debt instruments. The higher levels, which were the last to take losses if and when mortgages defaulted, were given high credit ratings and the lower levels that were the first to take losses were given the sub-prime ratings.
The process was that if an agency did not like the rating it received, it could opt to not pay the credit agency that issued that rating. The system had been like this since the 1970s, when it shifted from investor to agency funding. At issue was the transparency of the ratings system, which had come under fire recently for its complicated terms.
There was a contradiction between rating agencies receiving fees from a security’s creator and their ability to give an unbiased assessment of risk. Rating agencies were enticed to give better ratings to receive higher service fees. On the other hand, it was difficult to sell a security if it was not rated. They incorrectly gave investment-grade ratings to securitisation transactions holding sub prime mortgages. This allowed investment bankers to sell off a large portion of the sub-prime loans as debt instruments with above prime credit ratings thus expanding the number of potential buyers of that debt.
Role of Central Bank
“For the second time in seven years, the bursting of a major-asset bubble has inflicted great damage on world financial markets. In both cases--the equity bubble in 2000 and the credit bubble in 2007--central banks were asleep at the switch. The lack of monetary discipline has become a hallmark of unfettered globalization. Central banks have failed to provide a stable
underpinning to world financial markets and to an increasingly asset-dependent global economy.”
- Stephen Roach, Morgan Stanley
61
The U.S. Central Bank being “the lender of last resort” is required to manage the economy by managing the rate of inflation and avoiding recessions through its various monetary policy reforms. So the Central Bank must ensure liquidity in the system, which the U.S. economy was short of. During the year 2006, the great amount of liquidity in the market along with low rates of ARM’s assured the low-income borrowers that they will be able to repay the loans expecting the rates to be low in the future.
During the sub-prime crisis the Central bank was criticized to wake very late to this problem.
On March 27, 2007, Fed Chairman Ben Bernanke said at a Joint Economic Committee, that the housing market weakness “does not” appear to have spilled over to a significant extent. While on September 20, 2007, that Chairman Bernanke acknowledged that the credit crisis has created significant market stress.
By the outburst of the crisis, the markets were already low overflowing with illiquid funds. By the time the central bank realized how grave this problem was, it was left with little option but to panic measures like reduce the Fed rates. This move, on one hand, aimed to increase the liquidity in the system, but on the other hand, it caused too much inflation. The Fed rate which was 5.25 in September 2007 was reduced to as low as 2.25 in March 2008 (300 bps in the space of t months) to infuse more liquidity.
Thus the Fed played a very inadequate role during the whole crisis and did not live up to its responsibility of the bank of the Country with mandate to monitor and control the financial systems to avoid any severe situation.
The sub-prime crisis which stands today as a housing market catastrophe and a financial market blunder is mixed bag of anxious borrowers, short-sighted lenders, inefficiently knit mechanism of securitization, lax set standards, easily ‘swayed by profits’ brokers and a hyper active economic system! It is this gamut of irresponsible behaviors of all the parties that the sub-prime crisis is falling to new depths of losses and failures.

62
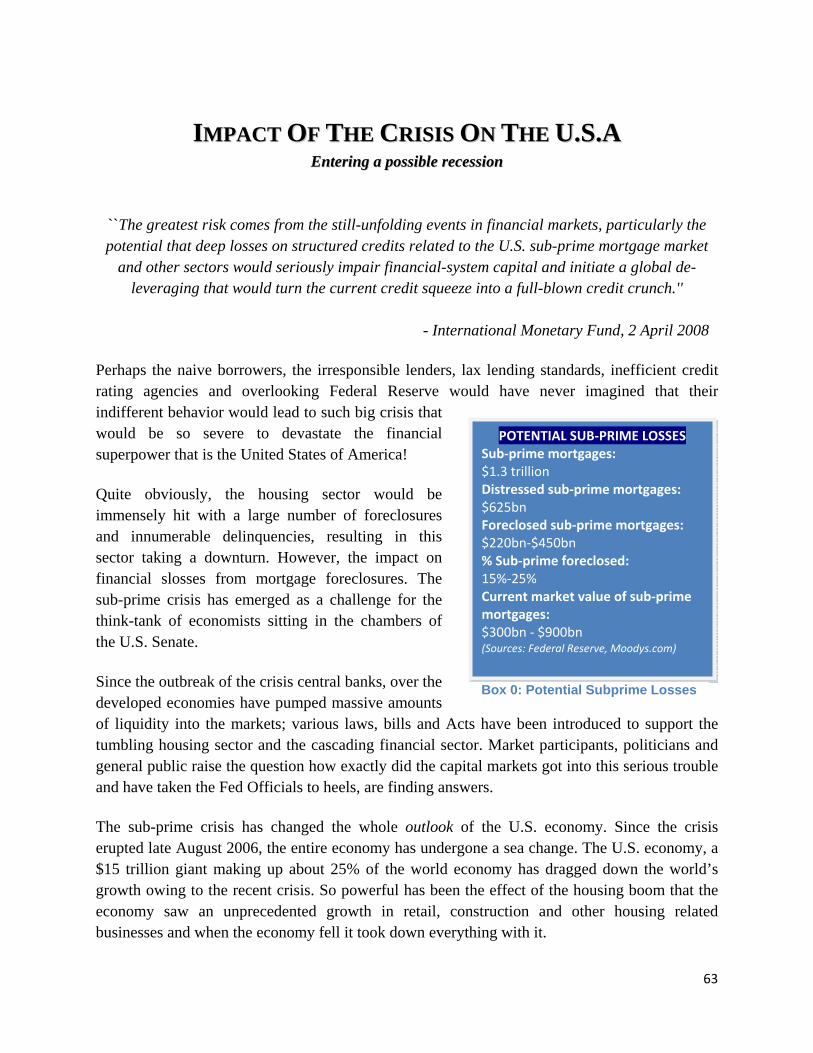
63
IIMMPPAACCTT OOFF TTHHEE CCRRIISSIISS OONN TTHHEE UU..SS..AA EEnntteerriinngg aa ppoossssiibbllee rreecceessssiioonn
``The greatest risk comes from the still-unfolding events in financial markets, particularly the potential that deep losses on structured credits related to the U.S. sub-prime mortgage market
and other sectors would seriously impair financial-system capital and initiate a global de-leveraging that would turn the current credit squeeze into a full-blown credit crunch.''
- International Monetary Fund, 2 April 2008
Perhaps the naive borrowers, the irresponsible lenders, lax lending standards, inefficient credit rating agencies and overlooking Federal Reserve would have never imagined that their indifferent behavior would lead to such big crisis that would be so severe to devastate the financial superpower that is the United States of America!
Quite obviously, the housing sector would be immensely hit with a large number of foreclosures and innumerable delinquencies, resulting in this sector taking a downturn. However, the impact on financial slosses from mortgage foreclosures. The sub-prime crisis has emerged as a challenge for the think-tank of economists sitting in the chambers of the U.S. Senate.
Since the outbreak of the crisis central banks, over the developed economies have pumped massive amounts of liquidity into the markets; various laws, bills and Acts have been introduced to support the tumbling housing sector and the cascading financial sector. Market participants, politicians and general public raise the question how exactly did the capital markets got into this serious trouble and have taken the Fed Officials to heels, are finding answers.
The sub-prime crisis has changed the whole outlook of the U.S. economy. Since the crisis erupted late August 2006, the entire economy has undergone a sea change. The U.S. economy, a $15 trillion giant making up about 25% of the world economy has dragged down the world’s growth owing to the recent crisis. So powerful has been the effect of the housing boom that the economy saw an unprecedented growth in retail, construction and other housing related businesses and when the economy fell it took down everything with it.
POTENTIAL SUB‐PRIME LOSSES Sub‐prime mortgages: $1.3 trillion Distressed sub‐prime mortgages: $625bn Foreclosed sub‐prime mortgages: $220bn‐$450bn % Sub‐prime foreclosed: 15%‐25% Current market value of sub‐prime mortgages: $300bn ‐ $900bn (Sources: Federal Reserve, Moodys.com)
Box 0: Potential Subprime Losses
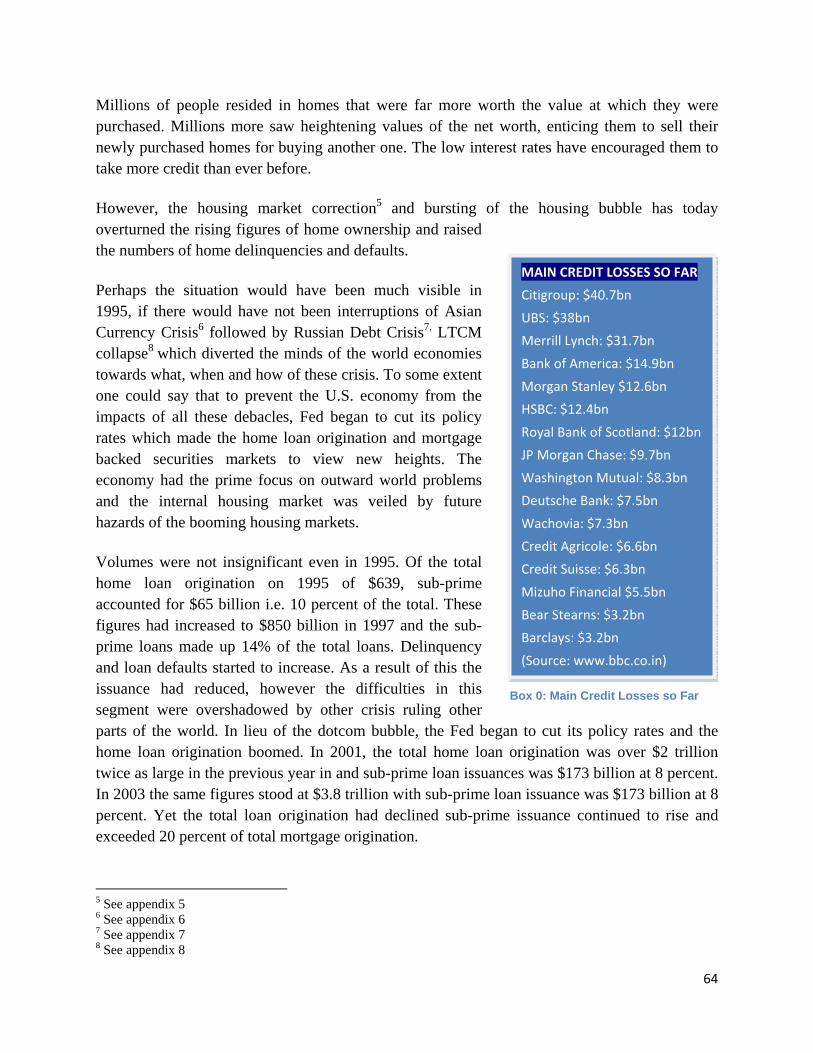
64
Millions of people resided in homes that were far more worth the value at which they were purchased. Millions more saw heightening values of the net worth, enticing them to sell their newly purchased homes for buying another one. The low interest rates have encouraged them to take more credit than ever before.
However, the housing market correction5 and bursting of the housing bubble has today overturned the rising figures of home ownership and raised the numbers of home delinquencies and defaults.
Perhaps the situation would have been much visible in 1995, if there would have not been interruptions of Asian Currency Crisis6 followed by Russian Debt Crisis7, LTCM collapse8 which diverted the minds of the world economies towards what, when and how of these crisis. To some extent one could say that to prevent the U.S. economy from the impacts of all these debacles, Fed began to cut its policy rates which made the home loan origination and mortgage backed securities markets to view new heights. The economy had the prime focus on outward world problems and the internal housing market was veiled by future hazards of the booming housing markets.
Volumes were not insignificant even in 1995. Of the total home loan origination on 1995 of $639, sub-prime accounted for $65 billion i.e. 10 percent of the total. These figures had increased to $850 billion in 1997 and the sub-prime loans made up 14% of the total loans. Delinquency and loan defaults started to increase. As a result of this the issuance had reduced, however the difficulties in this segment were overshadowed by other crisis ruling other parts of the world. In lieu of the dotcom bubble, the Fed began to cut its policy rates and the home loan origination boomed. In 2001, the total home loan origination was over $2 trillion twice as large in the previous year in and sub-prime loan issuances was $173 billion at 8 percent. In 2003 the same figures stood at $3.8 trillion with sub-prime loan issuance was $173 billion at 8 percent. Yet the total loan origination had declined sub-prime issuance continued to rise and exceeded 20 percent of total mortgage origination.
5 See appendix 5 6 See appendix 6 7 See appendix 7 8 See appendix 8
MAIN CREDIT LOSSES SO FAR
Citigroup: $40.7bn
UBS: $38bn
Merrill Lynch: $31.7bn
Bank of America: $14.9bn
Morgan Stanley $12.6bn
HSBC: $12.4bn
Royal Bank of Scotland: $12bn
JP Morgan Chase: $9.7bn
Washington Mutual: $8.3bn
Deutsche Bank: $7.5bn
Wachovia: $7.3bn
Credit Agricole: $6.6bn
Credit Suisse: $6.3bn
Mizuho Financial $5.5bn
Bear Stearns: $3.2bn
Barclays: $3.2bn
(Source: www.bbc.co.in)
Box 0: Main Credit Losses so Far
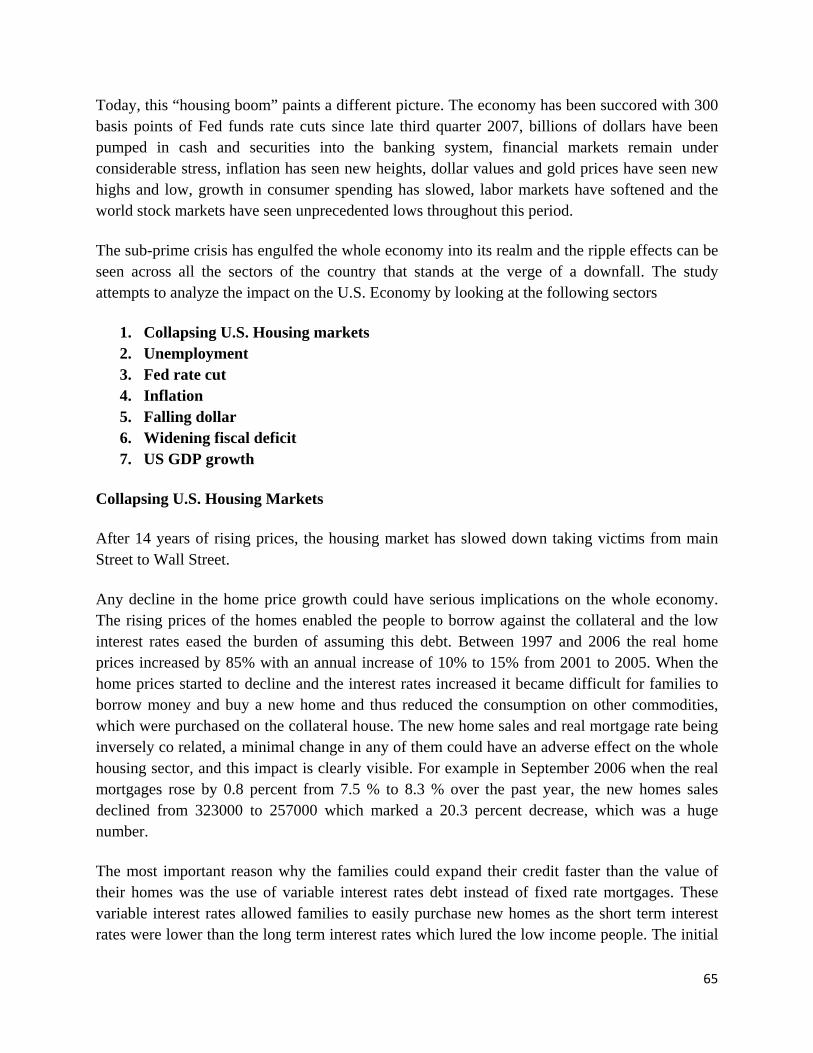
65
Today, this “housing boom” paints a different picture. The economy has been succored with 300 basis points of Fed funds rate cuts since late third quarter 2007, billions of dollars have been pumped in cash and securities into the banking system, financial markets remain under considerable stress, inflation has seen new heights, dollar values and gold prices have seen new highs and low, growth in consumer spending has slowed, labor markets have softened and the world stock markets have seen unprecedented lows throughout this period.
The sub-prime crisis has engulfed the whole economy into its realm and the ripple effects can be seen across all the sectors of the country that stands at the verge of a downfall. The study attempts to analyze the impact on the U.S. Economy by looking at the following sectors
1. Collapsing U.S. Housing markets 2. Unemployment 3. Fed rate cut 4. Inflation 5. Falling dollar 6. Widening fiscal deficit 7. US GDP growth
Collapsing U.S. Housing Markets
After 14 years of rising prices, the housing market has slowed down taking victims from main Street to Wall Street.
Any decline in the home price growth could have serious implications on the whole economy. The rising prices of the homes enabled the people to borrow against the collateral and the low interest rates eased the burden of assuming this debt. Between 1997 and 2006 the real home prices increased by 85% with an annual increase of 10% to 15% from 2001 to 2005. When the home prices started to decline and the interest rates increased it became difficult for families to borrow money and buy a new home and thus reduced the consumption on other commodities, which were purchased on the collateral house. The new home sales and real mortgage rate being inversely co related, a minimal change in any of them could have an adverse effect on the whole housing sector, and this impact is clearly visible. For example in September 2006 when the real mortgages rose by 0.8 percent from 7.5 % to 8.3 % over the past year, the new homes sales declined from 323000 to 257000 which marked a 20.3 percent decrease, which was a huge number.
The most important reason why the families could expand their credit faster than the value of their homes was the use of variable interest rates debt instead of fixed rate mortgages. These variable interest rates allowed families to easily purchase new homes as the short term interest rates were lower than the long term interest rates which lured the low income people. The initial
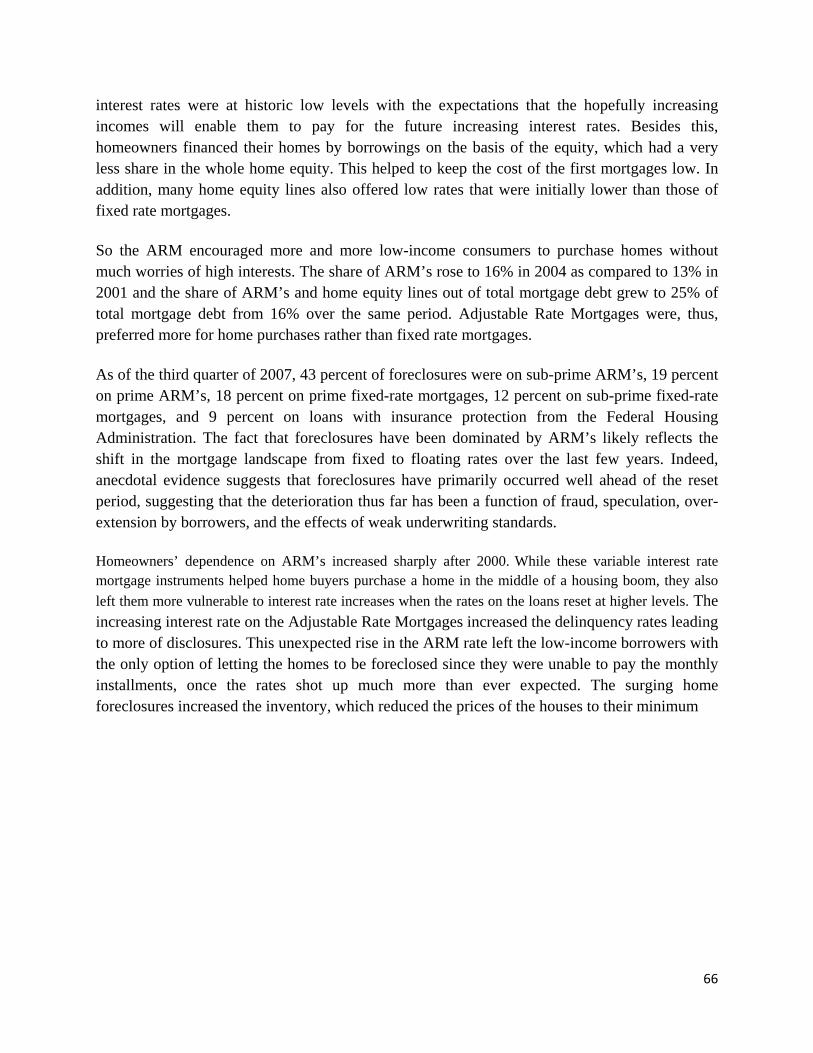
66
interest rates were at historic low levels with the expectations that the hopefully increasing incomes will enable them to pay for the future increasing interest rates. Besides this, homeowners financed their homes by borrowings on the basis of the equity, which had a very less share in the whole home equity. This helped to keep the cost of the first mortgages low. In addition, many home equity lines also offered low rates that were initially lower than those of fixed rate mortgages.
So the ARM encouraged more and more low-income consumers to purchase homes without much worries of high interests. The share of ARM’s rose to 16% in 2004 as compared to 13% in 2001 and the share of ARM’s and home equity lines out of total mortgage debt grew to 25% of total mortgage debt from 16% over the same period. Adjustable Rate Mortgages were, thus, preferred more for home purchases rather than fixed rate mortgages.
As of the third quarter of 2007, 43 percent of foreclosures were on sub-prime ARM’s, 19 percent on prime ARM’s, 18 percent on prime fixed-rate mortgages, 12 percent on sub-prime fixed-rate mortgages, and 9 percent on loans with insurance protection from the Federal Housing Administration. The fact that foreclosures have been dominated by ARM’s likely reflects the shift in the mortgage landscape from fixed to floating rates over the last few years. Indeed, anecdotal evidence suggests that foreclosures have primarily occurred well ahead of the reset period, suggesting that the deterioration thus far has been a function of fraud, speculation, over- extension by borrowers, and the effects of weak underwriting standards.
Homeowners’ dependence on ARM’s increased sharply after 2000. While these variable interest rate
mortgage instruments helped home buyers purchase a home in the middle of a housing boom, they also left them more vulnerable to interest rate increases when the rates on the loans reset at higher levels. The increasing interest rate on the Adjustable Rate Mortgages increased the delinquency rates leading to more of disclosures. This unexpected rise in the ARM rate left the low-income borrowers with the only option of letting the homes to be foreclosed since they were unable to pay the monthly installments, once the rates shot up much more than ever expected. The surging home foreclosures increased the inventory, which reduced the prices of the houses to their minimum
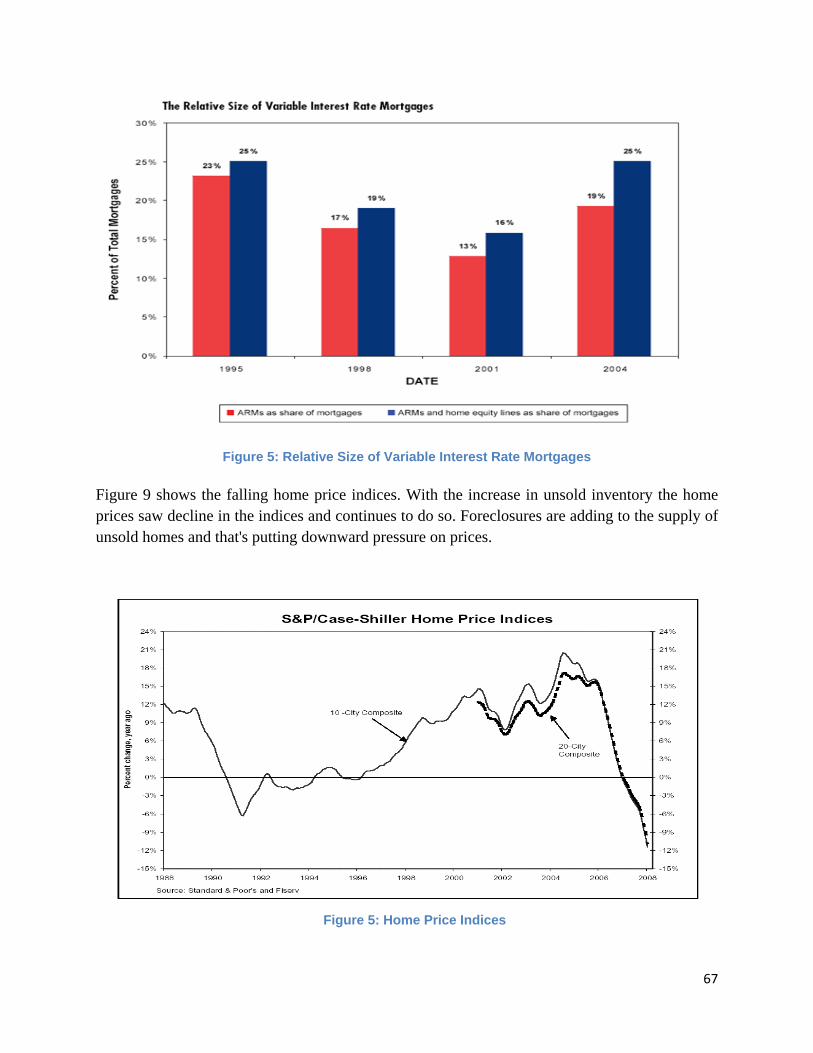
67
Figure 5: Relative Size of Variable Interest Rate Mortgages
Figure 9 shows the falling home price indices. With the increase in unsold inventory the home prices saw decline in the indices and continues to do so. Foreclosures are adding to the supply of unsold homes and that's putting downward pressure on prices.
Figure 5: Home Price Indices

68
U.S. home prices dropped 8.9 % in the final quarter of 2007 compared with a year ago. The number of homes facing foreclosure climbed 57 % in January from the previous year (see figure 10) and more lenders are being forced to take possession of homes, which they are unable to dump at auctions.
Due to the declining prices investors are taking huge losses to rewrite the declining value of securities backed by mortgages. Stalled by swelling inventories and weak demand, homebuilders have been recording record losses quarter after quarter. The unprecedented decline in U.S. house prices will lead to further pain for financial institutions, who collectively own more than $1 trillion worth of sub-prime debt. Economists worry the housing slump will plunge the broader economy into a recession.
Figure 6: Foreclosure starts rate
Housing sector contributing 12% of the total service sector to the GDP growth, any hit in this sector can lead to huge losses engulfing the whole financial sector of the economy and ultimately affecting other economies of the world linked through ties of globalization.
69
PROJECTED ECONOMIC LOSSES‐JOINT ECONOMIC COMMITEE
* 2 million foreclosures will occur by the time the riskiest subprime adjustable rate mortgages (ARMs) reset over the course of this year and next. * Approximately $71 billion in housing wealth will be directly destroyed because each foreclosure reduces the value of a home. * More than $32 billion dollars in housing wealth will be indirectly destroyed by the spillover effect of foreclosures, which reduce the value of neighboring properties. * States will lose more than $917 million in property tax revenue as a result of the destruction of housing wealth caused by subprime foreclosures. * The ten states with the greatest number of estimated foreclosures are California, Florida, Ohio, New York, Michigan, Texas, Illinois, Arizona and Pennsylvania. But there are several others that are close behind in the rankings. * On top of the losses due to foreclosures, which this report examines, a 10 percent decline in housing prices would lead to a $2.3 trillion economic loss.
*States and local governments will lose more then $917 million in property tax revenues as a result of destruction of housing wealth caused by subprime foreclosures.
(Source: New JEC Report: Subprime Crisis To Cost Billions In Family Wealth, Property)Values, And Tax Revenues Unless Action)
Box 0: Projected Economic Losses
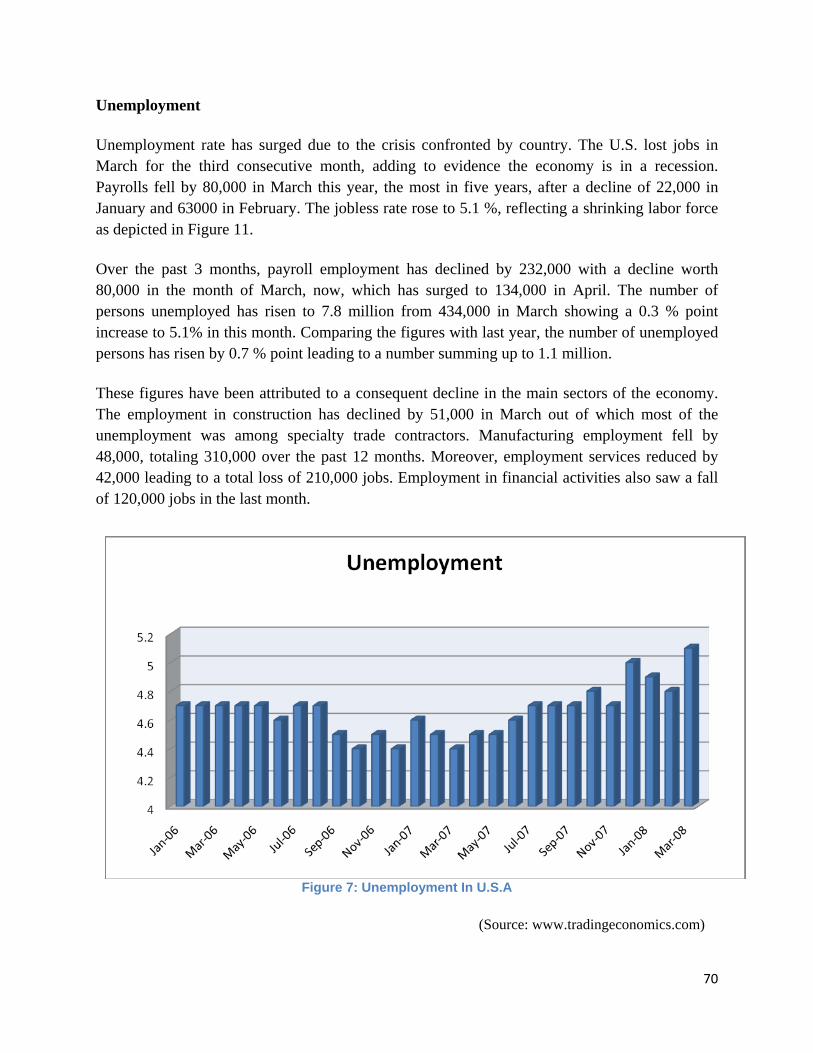
70
Unemployment
Unemployment rate has surged due to the crisis confronted by country. The U.S. lost jobs in March for the third consecutive month, adding to evidence the economy is in a recession. Payrolls fell by 80,000 in March this year, the most in five years, after a decline of 22,000 in January and 63000 in February. The jobless rate rose to 5.1 %, reflecting a shrinking labor force as depicted in Figure 11.
Over the past 3 months, payroll employment has declined by 232,000 with a decline worth 80,000 in the month of March, now, which has surged to 134,000 in April. The number of persons unemployed has risen to 7.8 million from 434,000 in March showing a 0.3 % point increase to 5.1% in this month. Comparing the figures with last year, the number of unemployed persons has risen by 0.7 % point leading to a number summing up to 1.1 million.
These figures have been attributed to a consequent decline in the main sectors of the economy. The employment in construction has declined by 51,000 in March out of which most of the unemployment was among specialty trade contractors. Manufacturing employment fell by 48,000, totaling 310,000 over the past 12 months. Moreover, employment services reduced by 42,000 leading to a total loss of 210,000 jobs. Employment in financial activities also saw a fall of 120,000 jobs in the last month.
Figure 7: Unemployment In U.S.A
(Source: www.tradingeconomics.com)
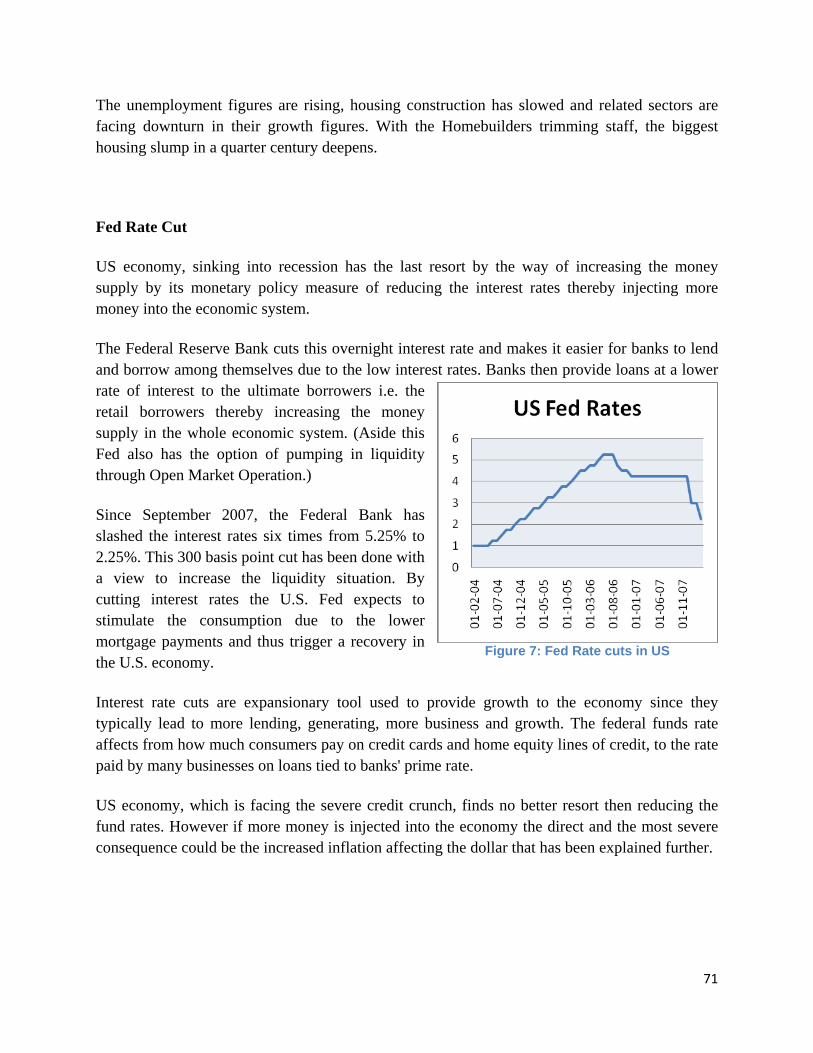
71
The unemployment figures are rising, housing construction has slowed and related sectors are facing downturn in their growth figures. With the Homebuilders trimming staff, the biggest housing slump in a quarter century deepens.
Fed Rate Cut
US economy, sinking into recession has the last resort by the way of increasing the money supply by its monetary policy measure of reducing the interest rates thereby injecting more money into the economic system.
The Federal Reserve Bank cuts this overnight interest rate and makes it easier for banks to lend and borrow among themselves due to the low interest rates. Banks then provide loans at a lower rate of interest to the ultimate borrowers i.e. the retail borrowers thereby increasing the money supply in the whole economic system. (Aside this Fed also has the option of pumping in liquidity through Open Market Operation.)
Since September 2007, the Federal Bank has slashed the interest rates six times from 5.25% to 2.25%. This 300 basis point cut has been done with a view to increase the liquidity situation. By cutting interest rates the U.S. Fed expects to stimulate the consumption due to the lower mortgage payments and thus trigger a recovery in the U.S. economy.
Interest rate cuts are expansionary tool used to provide growth to the economy since they typically lead to more lending, generating, more business and growth. The federal funds rate affects from how much consumers pay on credit cards and home equity lines of credit, to the rate paid by many businesses on loans tied to banks' prime rate.
US economy, which is facing the severe credit crunch, finds no better resort then reducing the fund rates. However if more money is injected into the economy the direct and the most severe consequence could be the increased inflation affecting the dollar that has been explained further.
Figure 7: Fed Rate cuts in US
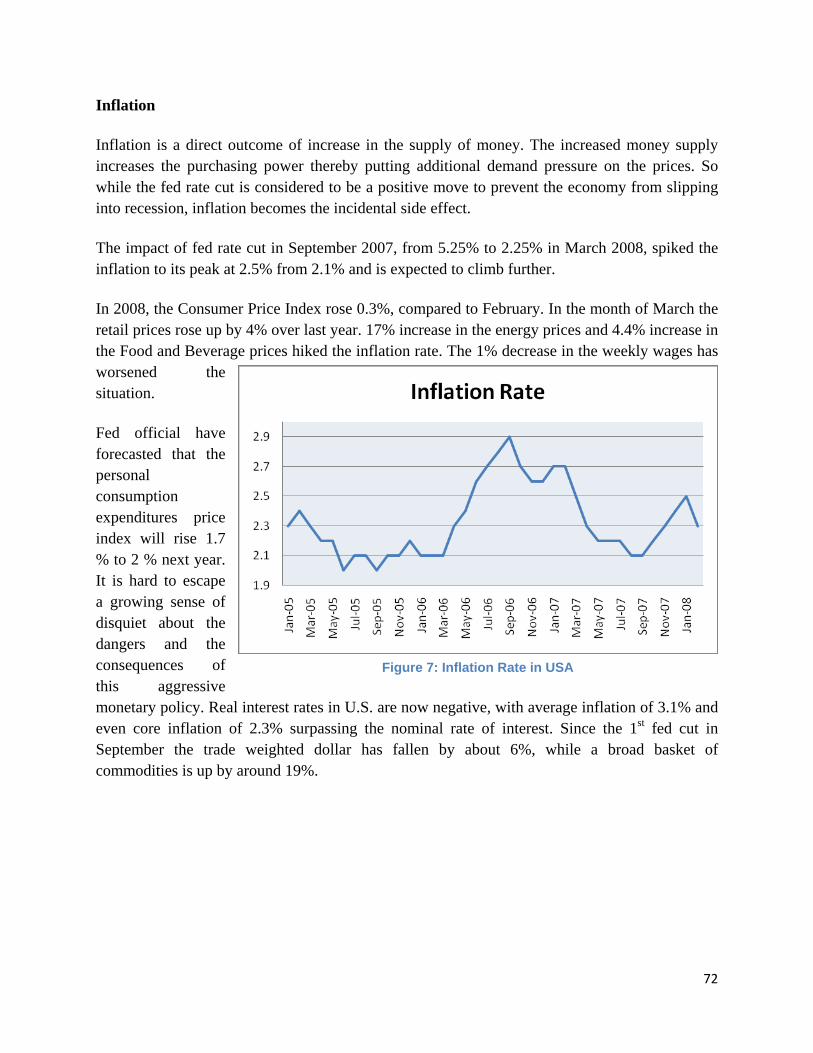
72
Inflation
Inflation is a direct outcome of increase in the supply of money. The increased money supply increases the purchasing power thereby putting additional demand pressure on the prices. So while the fed rate cut is considered to be a positive move to prevent the economy from slipping into recession, inflation becomes the incidental side effect.
The impact of fed rate cut in September 2007, from 5.25% to 2.25% in March 2008, spiked the inflation to its peak at 2.5% from 2.1% and is expected to climb further.
In 2008, the Consumer Price Index rose 0.3%, compared to February. In the month of March the retail prices rose up by 4% over last year. 17% increase in the energy prices and 4.4% increase in the Food and Beverage prices hiked the inflation rate. The 1% decrease in the weekly wages has worsened the situation.
Fed official have forecasted that the personal consumption expenditures price index will rise 1.7 % to 2 % next year. It is hard to escape a growing sense of disquiet about the dangers and the consequences of this aggressive monetary policy. Real interest rates in U.S. are now negative, with average inflation of 3.1% and even core inflation of 2.3% surpassing the nominal rate of interest. Since the 1st fed cut in September the trade weighted dollar has fallen by about 6%, while a broad basket of commodities is up by around 19%.
Figure 7: Inflation Rate in USA
73
Falling Dollar
“The dollar is our currency but your problem” Treasury Secretary John Connally
The decline in the value of dollar has one of the most severe effects that can cripple the whole economy and paralyze the markets. The hit on the dollar has affected the value of currencies worldwide with Euro and Yen trying to overtake the U.S. dollar.
The depreciation of dollar implies a loss in its value in comparison to other currencies. In simple words we can say that dollar can buy fewer foreign goods as it could previously. If the value of dollar decreases then more dollars have to be paid to buy a commodity. This in turn implies that foreign goods become expensive in comparison to the domestic goods. In such a case imports have to be decreased to avoid excessive outflow of currency and maintain the liquidity situation.
But the shortage of liquidity could be met either by increasing the government savings (accumulated through more of tax collections) or by resorting to foreign aid i.e. debt. Since there is a shortage of liquidity interest rates have to be decreased but again crops in the problem of increased liquidity further depreciating the dollars! But the major concern, which the U.S. economy is facing, is that has the liquidity dried up?
Aggressive moves by the Fed Bank by reducing the Fed Rates and pumping in more cash into the economy, leads to greater liquidity which reduces the value of the ‘excessively available money (i.e. the dollar) leading to depreciation of dollar. This weakening of dollar strengthens other currencies.
Moreover, a rate cut also means global currencies moving to countries that offer high interest rates due to arbitrage opportunities. This leads to appreciation of currencies across continents and depreciation of U.S. Dollar. When dollar depreciates, goods from other countries become costlier in U.S. leading to inflation. The goods available in other markets at cheap prices encourage exports in the economy. Weakening of the dollar correspondingly strengthens the U.S. exports. However a weak dollar could erode interest of international investors in buying dollar-denominated securities and investments in treasuries as explained later.
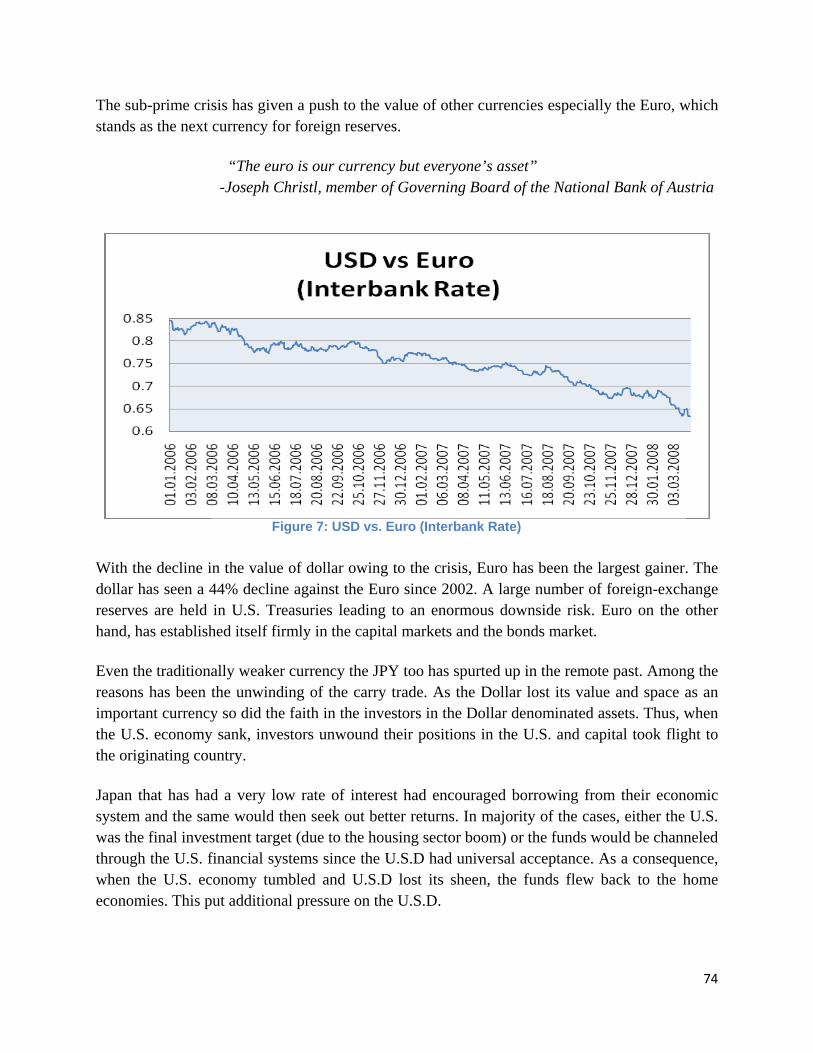
74
The sub-prime crisis has given a push to the value of other currencies especially the Euro, which stands as the next currency for foreign reserves.
“The euro is our currency but everyone’s asset” -Joseph Christl, member of Governing Board of the National Bank of Austria
With the decline in the value of dollar owing to the crisis, Euro has been the largest gainer. The dollar has seen a 44% decline against the Euro since 2002. A large number of foreign-exchange reserves are held in U.S. Treasuries leading to an enormous downside risk. Euro on the other hand, has established itself firmly in the capital markets and the bonds market.
Even the traditionally weaker currency the JPY too has spurted up in the remote past. Among the reasons has been the unwinding of the carry trade. As the Dollar lost its value and space as an important currency so did the faith in the investors in the Dollar denominated assets. Thus, when the U.S. economy sank, investors unwound their positions in the U.S. and capital took flight to the originating country.
Japan that has had a very low rate of interest had encouraged borrowing from their economic system and the same would then seek out better returns. In majority of the cases, either the U.S. was the final investment target (due to the housing sector boom) or the funds would be channeled through the U.S. financial systems since the U.S.D had universal acceptance. As a consequence, when the U.S. economy tumbled and U.S.D lost its sheen, the funds flew back to the home economies. This put additional pressure on the U.S.D.
Figure 7: USD vs. Euro (Interbank Rate)
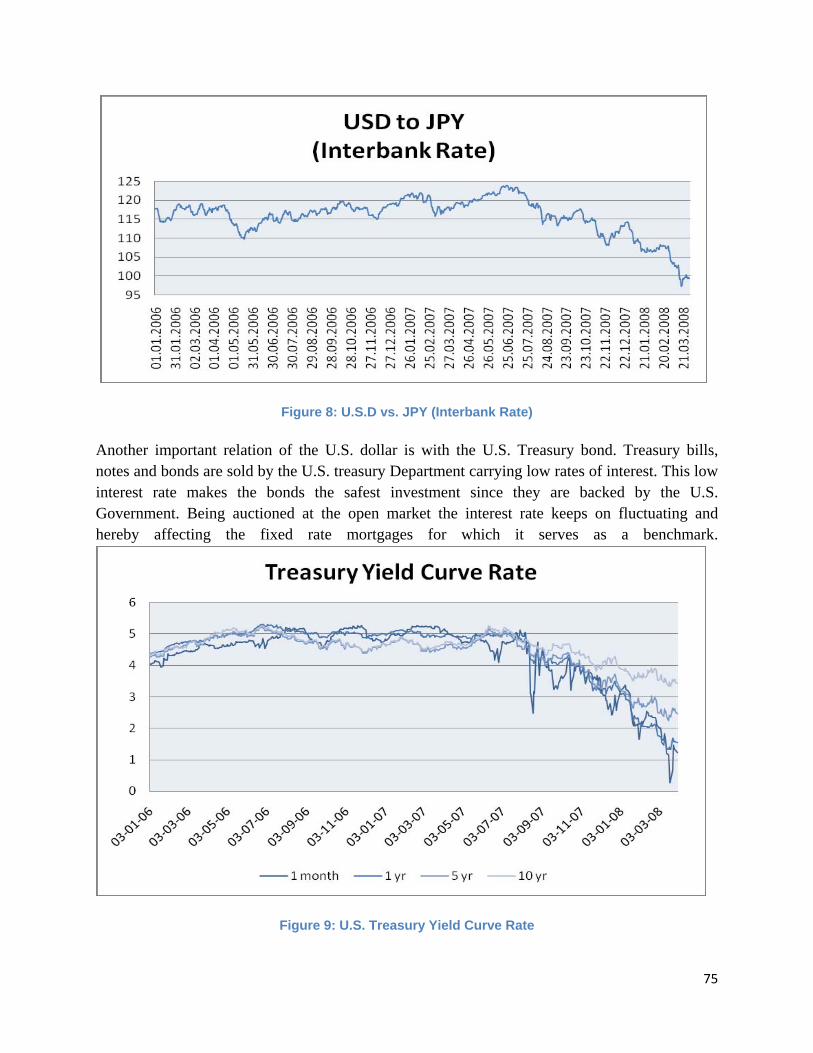
75
Figure 8: U.S.D vs. JPY (Interbank Rate)
Another important relation of the U.S. dollar is with the U.S. Treasury bond. Treasury bills, notes and bonds are sold by the U.S. treasury Department carrying low rates of interest. This low interest rate makes the bonds the safest investment since they are backed by the U.S. Government. Being auctioned at the open market the interest rate keeps on fluctuating and hereby affecting the fixed rate mortgages for which it serves as a benchmark.
Figure 9: U.S. Treasury Yield Curve Rate
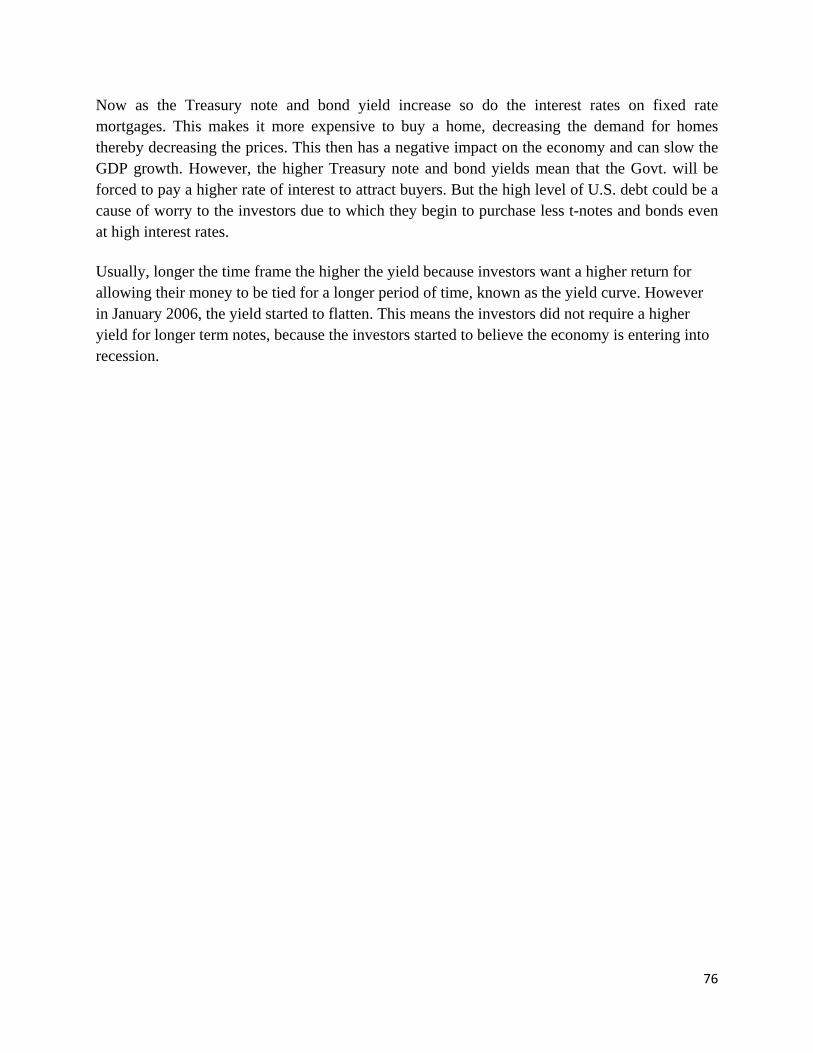
76
Now as the Treasury note and bond yield increase so do the interest rates on fixed rate mortgages. This makes it more expensive to buy a home, decreasing the demand for homes thereby decreasing the prices. This then has a negative impact on the economy and can slow the GDP growth. However, the higher Treasury note and bond yields mean that the Govt. will be forced to pay a higher rate of interest to attract buyers. But the high level of U.S. debt could be a cause of worry to the investors due to which they begin to purchase less t-notes and bonds even at high interest rates.
Usually, longer the time frame the higher the yield because investors want a higher return for allowing their money to be tied for a longer period of time, known as the yield curve. However in January 2006, the yield started to flatten. This means the investors did not require a higher yield for longer term notes, because the investors started to believe the economy is entering into recession.
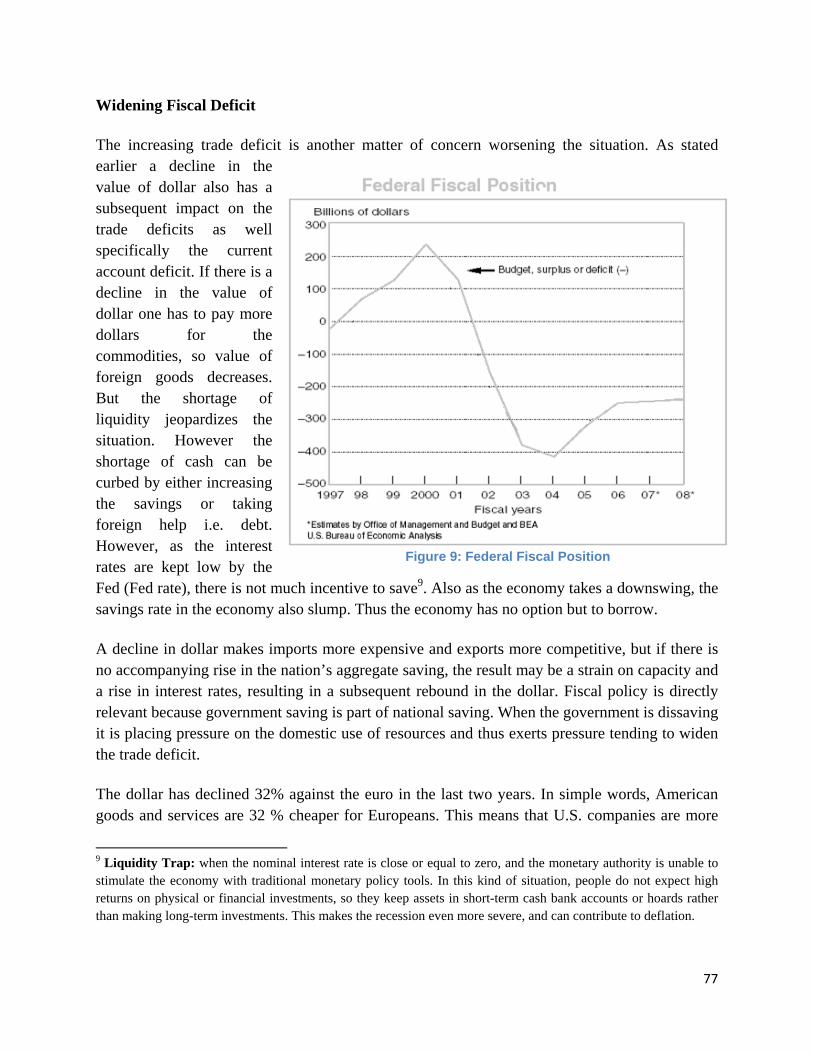
77
Widening Fiscal Deficit
The increasing trade deficit is another matter of concern worsening the situation. As stated earlier a decline in the value of dollar also has a subsequent impact on the trade deficits as well specifically the current account deficit. If there is a decline in the value of dollar one has to pay more dollars for the commodities, so value of foreign goods decreases. But the shortage of liquidity jeopardizes the situation. However the shortage of cash can be curbed by either increasing the savings or taking foreign help i.e. debt. However, as the interest rates are kept low by the Fed (Fed rate), there is not much incentive to save9. Also as the economy takes a downswing, the savings rate in the economy also slump. Thus the economy has no option but to borrow.
A decline in dollar makes imports more expensive and exports more competitive, but if there is no accompanying rise in the nation’s aggregate saving, the result may be a strain on capacity and a rise in interest rates, resulting in a subsequent rebound in the dollar. Fiscal policy is directly relevant because government saving is part of national saving. When the government is dissaving it is placing pressure on the domestic use of resources and thus exerts pressure tending to widen the trade deficit.
The dollar has declined 32% against the euro in the last two years. In simple words, American goods and services are 32 % cheaper for Europeans. This means that U.S. companies are more
9 Liquidity Trap: when the nominal interest rate is close or equal to zero, and the monetary authority is unable to stimulate the economy with traditional monetary policy tools. In this kind of situation, people do not expect high returns on physical or financial investments, so they keep assets in short-term cash bank accounts or hoards rather than making long-term investments. This makes the recession even more severe, and can contribute to deflation.
Figure 9: Federal Fiscal Position
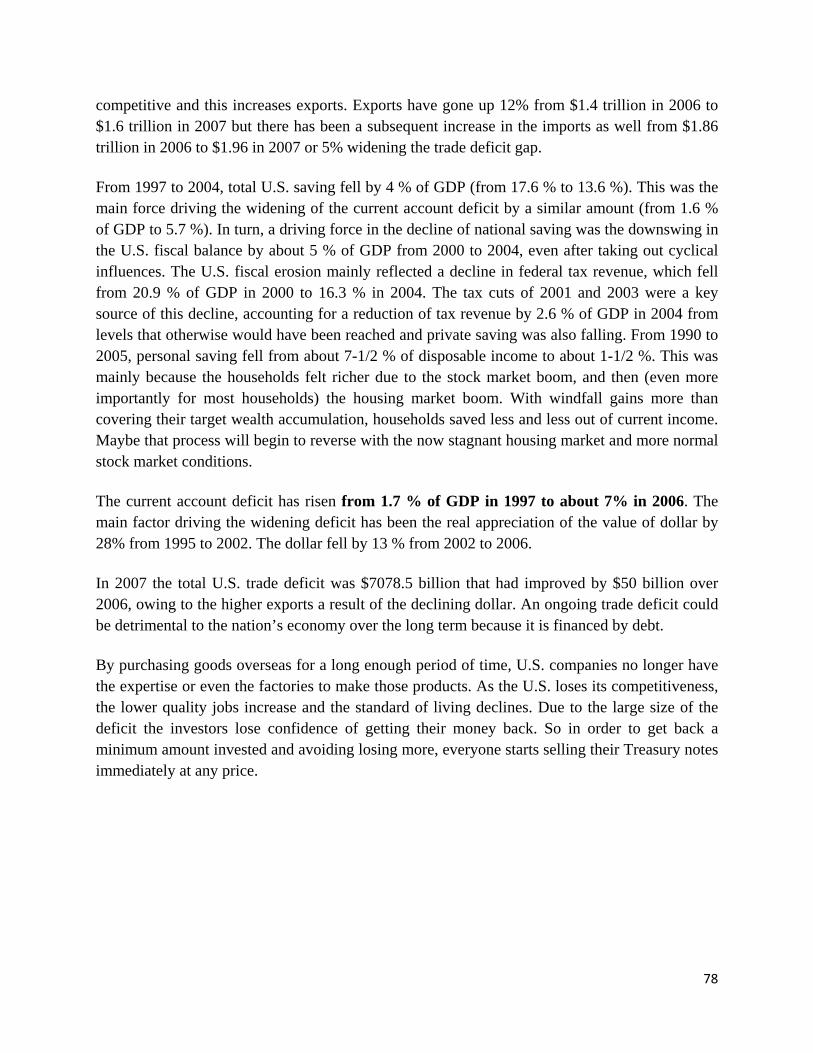
78
competitive and this increases exports. Exports have gone up 12% from $1.4 trillion in 2006 to $1.6 trillion in 2007 but there has been a subsequent increase in the imports as well from $1.86 trillion in 2006 to $1.96 in 2007 or 5% widening the trade deficit gap.
From 1997 to 2004, total U.S. saving fell by 4 % of GDP (from 17.6 % to 13.6 %). This was the main force driving the widening of the current account deficit by a similar amount (from 1.6 % of GDP to 5.7 %). In turn, a driving force in the decline of national saving was the downswing in the U.S. fiscal balance by about 5 % of GDP from 2000 to 2004, even after taking out cyclical influences. The U.S. fiscal erosion mainly reflected a decline in federal tax revenue, which fell from 20.9 % of GDP in 2000 to 16.3 % in 2004. The tax cuts of 2001 and 2003 were a key source of this decline, accounting for a reduction of tax revenue by 2.6 % of GDP in 2004 from levels that otherwise would have been reached and private saving was also falling. From 1990 to 2005, personal saving fell from about 7-1/2 % of disposable income to about 1-1/2 %. This was mainly because the households felt richer due to the stock market boom, and then (even more importantly for most households) the housing market boom. With windfall gains more than covering their target wealth accumulation, households saved less and less out of current income. Maybe that process will begin to reverse with the now stagnant housing market and more normal stock market conditions.
The current account deficit has risen from 1.7 % of GDP in 1997 to about 7% in 2006. The main factor driving the widening deficit has been the real appreciation of the value of dollar by 28% from 1995 to 2002. The dollar fell by 13 % from 2002 to 2006.
In 2007 the total U.S. trade deficit was $7078.5 billion that had improved by $50 billion over 2006, owing to the higher exports a result of the declining dollar. An ongoing trade deficit could be detrimental to the nation’s economy over the long term because it is financed by debt.
By purchasing goods overseas for a long enough period of time, U.S. companies no longer have the expertise or even the factories to make those products. As the U.S. loses its competitiveness, the lower quality jobs increase and the standard of living declines. Due to the large size of the deficit the investors lose confidence of getting their money back. So in order to get back a minimum amount invested and avoiding losing more, everyone starts selling their Treasury notes immediately at any price.
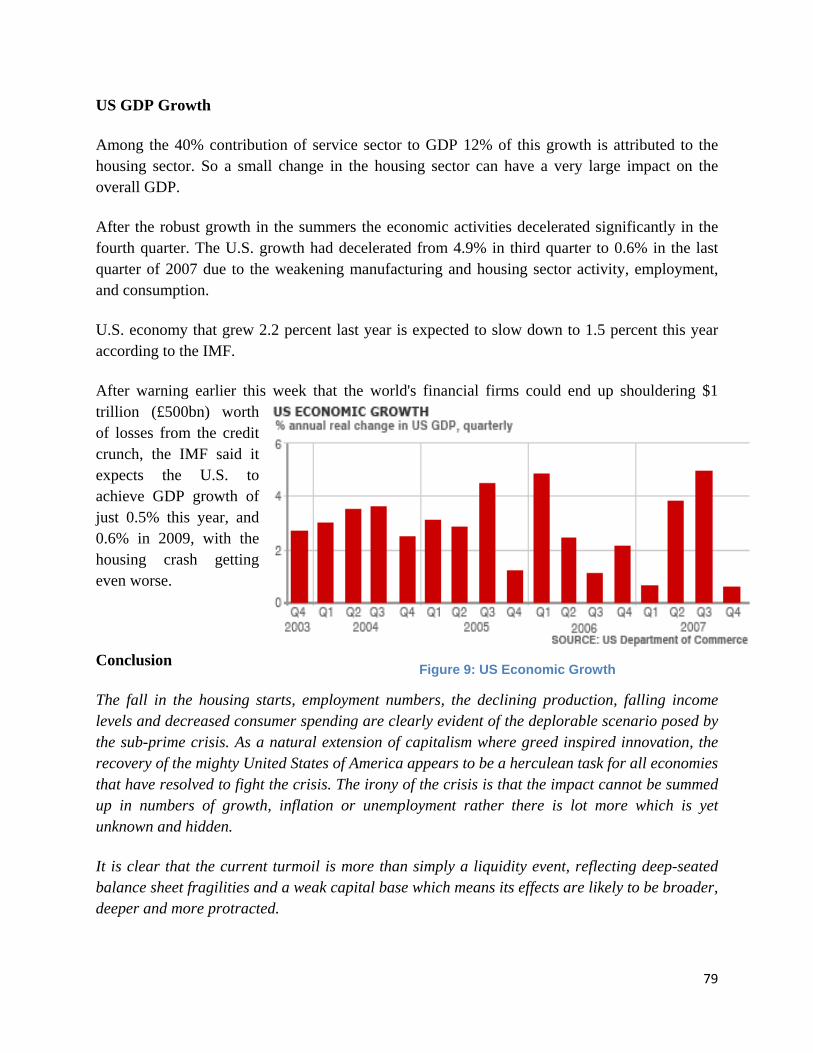
79
US GDP Growth
Among the 40% contribution of service sector to GDP 12% of this growth is attributed to the housing sector. So a small change in the housing sector can have a very large impact on the overall GDP.
After the robust growth in the summers the economic activities decelerated significantly in the fourth quarter. The U.S. growth had decelerated from 4.9% in third quarter to 0.6% in the last quarter of 2007 due to the weakening manufacturing and housing sector activity, employment, and consumption.
U.S. economy that grew 2.2 percent last year is expected to slow down to 1.5 percent this year according to the IMF.
After warning earlier this week that the world's financial firms could end up shouldering $1 trillion (£500bn) worth of losses from the credit crunch, the IMF said it expects the U.S. to achieve GDP growth of just 0.5% this year, and 0.6% in 2009, with the housing crash getting even worse.
Conclusion
The fall in the housing starts, employment numbers, the declining production, falling income levels and decreased consumer spending are clearly evident of the deplorable scenario posed by the sub-prime crisis. As a natural extension of capitalism where greed inspired innovation, the recovery of the mighty United States of America appears to be a herculean task for all economies that have resolved to fight the crisis. The irony of the crisis is that the impact cannot be summed up in numbers of growth, inflation or unemployment rather there is lot more which is yet unknown and hidden.
It is clear that the current turmoil is more than simply a liquidity event, reflecting deep-seated balance sheet fragilities and a weak capital base which means its effects are likely to be broader, deeper and more protracted.
Figure 9: US Economic Growth
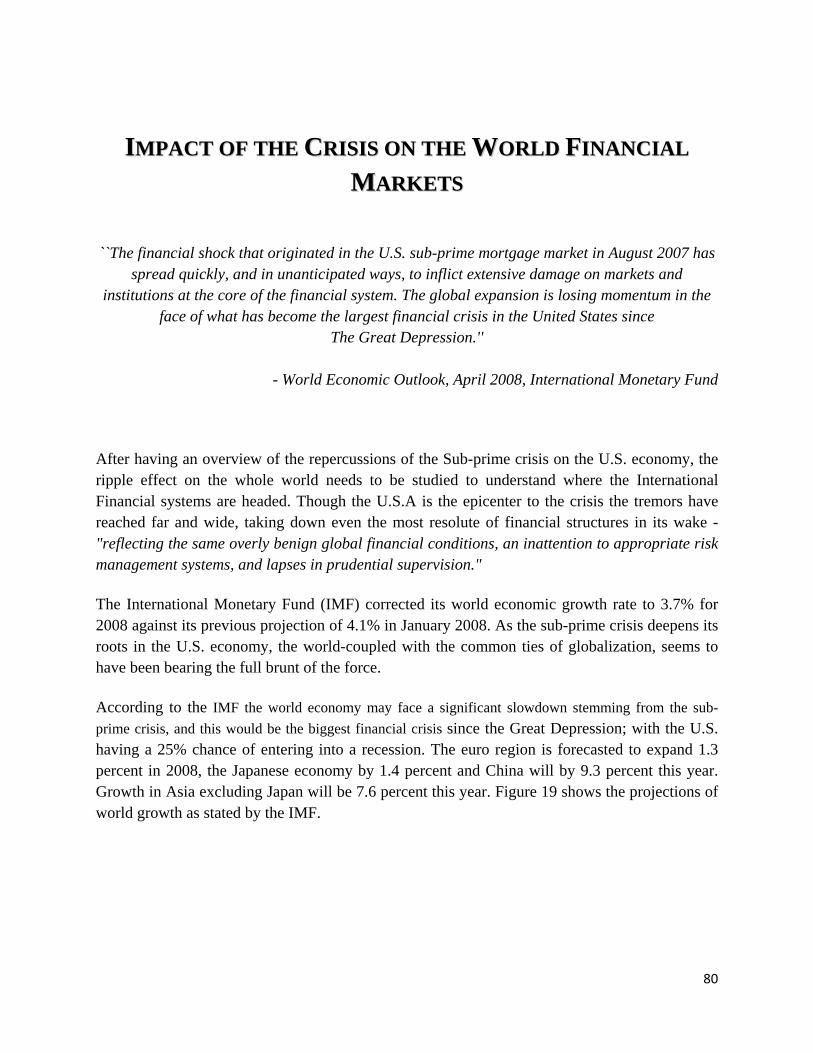
80
IIMMPPAACCTT OOFF TTHHEE CCRRIISSIISS OONN TTHHEE WWOORRLLDD FFIINNAANNCCIIAALL
MMAARRKKEETTSS
``The financial shock that originated in the U.S. sub-prime mortgage market in August 2007 has spread quickly, and in unanticipated ways, to inflict extensive damage on markets and
institutions at the core of the financial system. The global expansion is losing momentum in the face of what has become the largest financial crisis in the United States since
The Great Depression.''
- World Economic Outlook, April 2008, International Monetary Fund
After having an overview of the repercussions of the Sub-prime crisis on the U.S. economy, the ripple effect on the whole world needs to be studied to understand where the International Financial systems are headed. Though the U.S.A is the epicenter to the crisis the tremors have reached far and wide, taking down even the most resolute of financial structures in its wake - "reflecting the same overly benign global financial conditions, an inattention to appropriate risk management systems, and lapses in prudential supervision."
The International Monetary Fund (IMF) corrected its world economic growth rate to 3.7% for 2008 against its previous projection of 4.1% in January 2008. As the sub-prime crisis deepens its roots in the U.S. economy, the world-coupled with the common ties of globalization, seems to have been bearing the full brunt of the force.
According to the IMF the world economy may face a significant slowdown stemming from the sub-prime crisis, and this would be the biggest financial crisis since the Great Depression; with the U.S. having a 25% chance of entering into a recession. The euro region is forecasted to expand 1.3 percent in 2008, the Japanese economy by 1.4 percent and China will by 9.3 percent this year. Growth in Asia excluding Japan will be 7.6 percent this year. Figure 19 shows the projections of world growth as stated by the IMF.
81
The following figure shows that there has been a subsequent decrease in the growth rates of each country and that of the entire world owing to the sub-prime crisis. There have been persistent liquidity shortages, pressure on capital of banks and other financial institutions, increasing credit risks that are hampering the growth of other economies. The downside risks for global stability is increasing the stress, forcing institutions to expand credit, making it difficult to maintain the balance between the macroeconomic stability and the world growth.
Rising spreads have led to mark-to-market losses for banks on their holdings of debt securities. The cost of credit has thus increased as growth prospects have decreased. The pressures on equity valuations have also increased as the shares of companies have been hit really hard.
As the developed economies face a rising tide of sub-prime turmoil’s mess, the emerging markets and developing economies seem to have been somewhat insulated from much direct adverse impact, due to the strong productivity gains, improvements in terms of trade reflecting healthy commodity prices, and improved policy frameworks that have helped sustain access to capital. The fact that many of these markets still operate under a fairly strongly regulated financial system, too helped reduce the impact to a large extent. The combination of strong internal growth dynamics, a rising share in the global economy, and more resilient policy frameworks appear to have helped reduce the dependence of growth performance of emerging economies on the advanced economies' business cycle. Though, it may be wrong to state that the Emerging market economies have been completely insulated, it may be safe to say that the
Figure 10: World Economic Growth
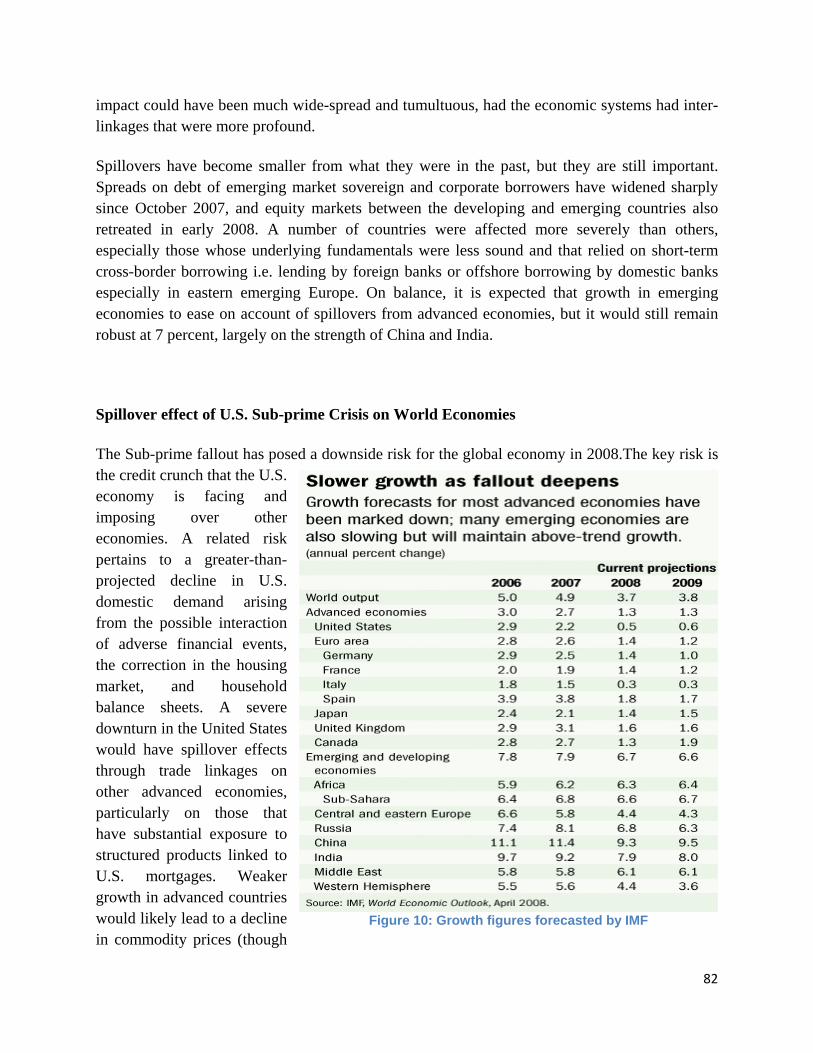
82
impact could have been much wide-spread and tumultuous, had the economic systems had inter-linkages that were more profound.
Spillovers have become smaller from what they were in the past, but they are still important. Spreads on debt of emerging market sovereign and corporate borrowers have widened sharply since October 2007, and equity markets between the developing and emerging countries also retreated in early 2008. A number of countries were affected more severely than others, especially those whose underlying fundamentals were less sound and that relied on short-term cross-border borrowing i.e. lending by foreign banks or offshore borrowing by domestic banks especially in eastern emerging Europe. On balance, it is expected that growth in emerging economies to ease on account of spillovers from advanced economies, but it would still remain robust at 7 percent, largely on the strength of China and India.
Spillover effect of U.S. Sub-prime Crisis on World Economies
The Sub-prime fallout has posed a downside risk for the global economy in 2008.The key risk is the credit crunch that the U.S. economy is facing and imposing over other economies. A related risk pertains to a greater-than-projected decline in U.S. domestic demand arising from the possible interaction of adverse financial events, the correction in the housing market, and household balance sheets. A severe downturn in the United States would have spillover effects through trade linkages on other advanced economies, particularly on those that have substantial exposure to structured products linked to U.S. mortgages. Weaker growth in advanced countries would likely lead to a decline in commodity prices (though
Figure 10: Growth figures forecasted by IMF
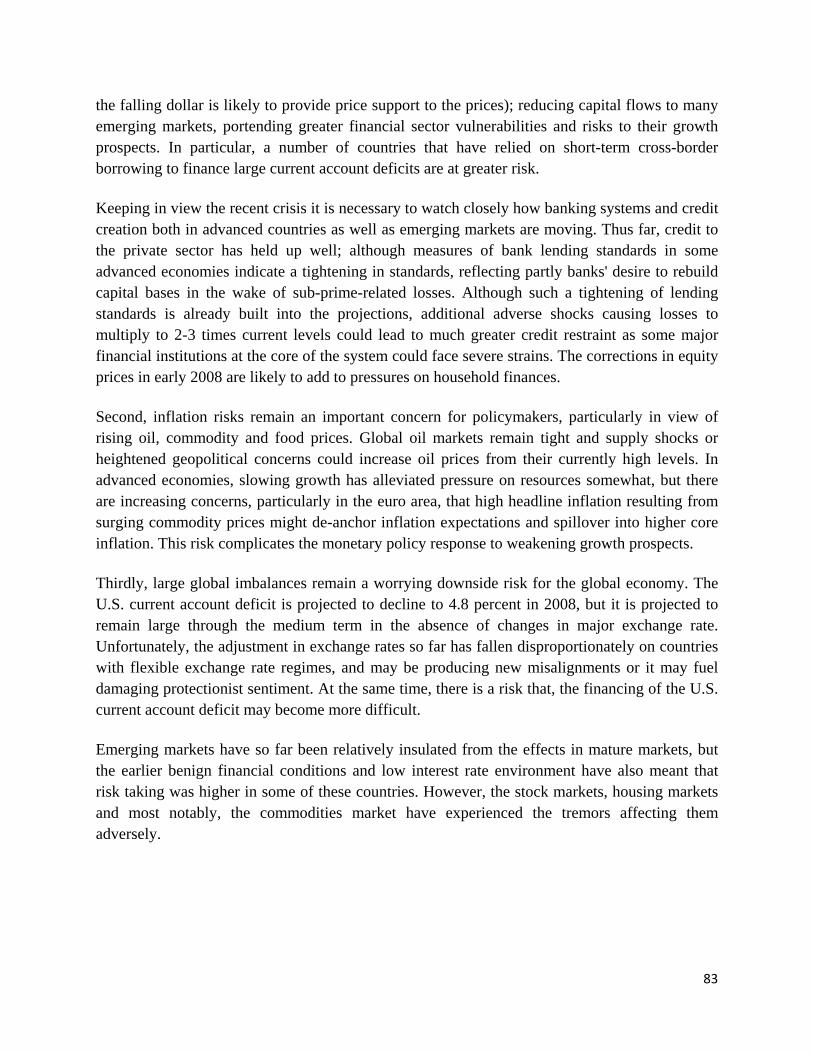
83
the falling dollar is likely to provide price support to the prices); reducing capital flows to many emerging markets, portending greater financial sector vulnerabilities and risks to their growth prospects. In particular, a number of countries that have relied on short-term cross-border borrowing to finance large current account deficits are at greater risk.
Keeping in view the recent crisis it is necessary to watch closely how banking systems and credit creation both in advanced countries as well as emerging markets are moving. Thus far, credit to the private sector has held up well; although measures of bank lending standards in some advanced economies indicate a tightening in standards, reflecting partly banks' desire to rebuild capital bases in the wake of sub-prime-related losses. Although such a tightening of lending standards is already built into the projections, additional adverse shocks causing losses to multiply to 2-3 times current levels could lead to much greater credit restraint as some major financial institutions at the core of the system could face severe strains. The corrections in equity prices in early 2008 are likely to add to pressures on household finances.
Second, inflation risks remain an important concern for policymakers, particularly in view of rising oil, commodity and food prices. Global oil markets remain tight and supply shocks or heightened geopolitical concerns could increase oil prices from their currently high levels. In advanced economies, slowing growth has alleviated pressure on resources somewhat, but there are increasing concerns, particularly in the euro area, that high headline inflation resulting from surging commodity prices might de-anchor inflation expectations and spillover into higher core inflation. This risk complicates the monetary policy response to weakening growth prospects.
Thirdly, large global imbalances remain a worrying downside risk for the global economy. The U.S. current account deficit is projected to decline to 4.8 percent in 2008, but it is projected to remain large through the medium term in the absence of changes in major exchange rate. Unfortunately, the adjustment in exchange rates so far has fallen disproportionately on countries with flexible exchange rate regimes, and may be producing new misalignments or it may fuel damaging protectionist sentiment. At the same time, there is a risk that, the financing of the U.S. current account deficit may become more difficult.
Emerging markets have so far been relatively insulated from the effects in mature markets, but the earlier benign financial conditions and low interest rate environment have also meant that risk taking was higher in some of these countries. However, the stock markets, housing markets and most notably, the commodities market have experienced the tremors affecting them adversely.
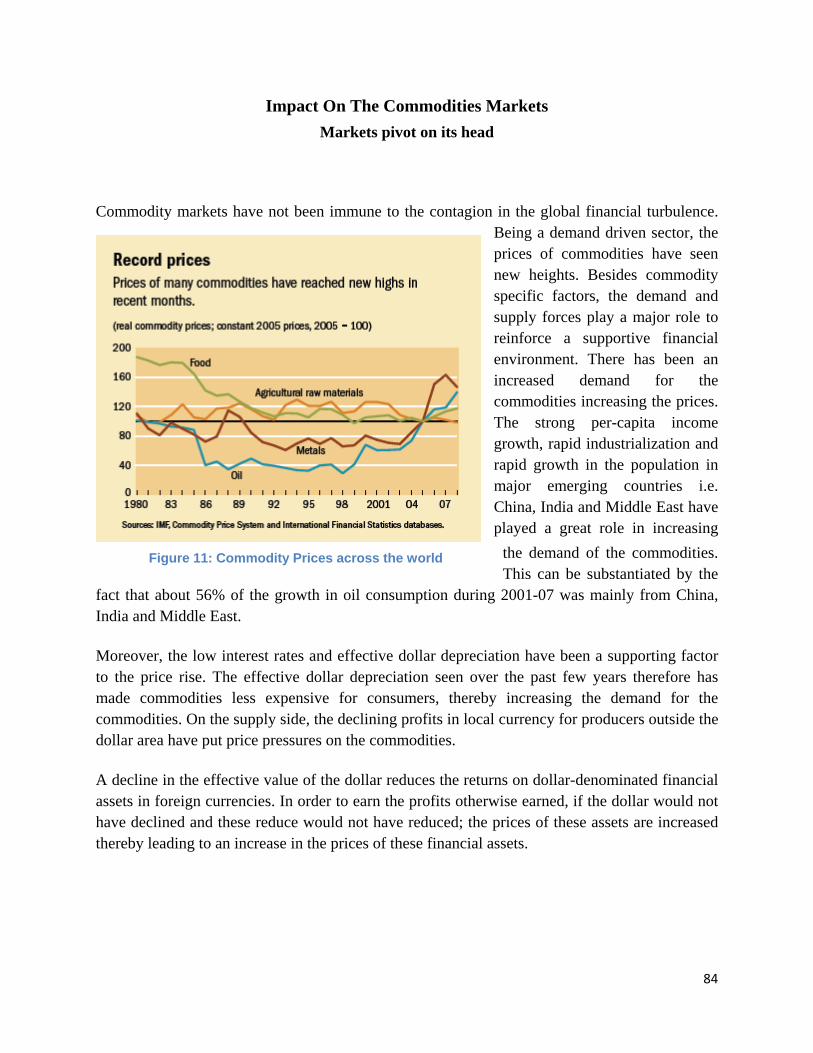
84
Impact On The Commodities Markets Markets pivot on its head
Commodity markets have not been immune to the contagion in the global financial turbulence. Being a demand driven sector, the prices of commodities have seen new heights. Besides commodity specific factors, the demand and supply forces play a major role to reinforce a supportive financial environment. There has been an increased demand for the commodities increasing the prices. The strong per-capita income growth, rapid industrialization and rapid growth in the population in major emerging countries i.e. China, India and Middle East have played a great role in increasing
the demand of the commodities. This can be substantiated by the
fact that about 56% of the growth in oil consumption during 2001-07 was mainly from China, India and Middle East.
Moreover, the low interest rates and effective dollar depreciation have been a supporting factor to the price rise. The effective dollar depreciation seen over the past few years therefore has made commodities less expensive for consumers, thereby increasing the demand for the commodities. On the supply side, the declining profits in local currency for producers outside the dollar area have put price pressures on the commodities.
A decline in the effective value of the dollar reduces the returns on dollar-denominated financial assets in foreign currencies. In order to earn the profits otherwise earned, if the dollar would not have declined and these reduce would not have reduced; the prices of these assets are increased thereby leading to an increase in the prices of these financial assets.
Figure 11: Commodity Prices across the world
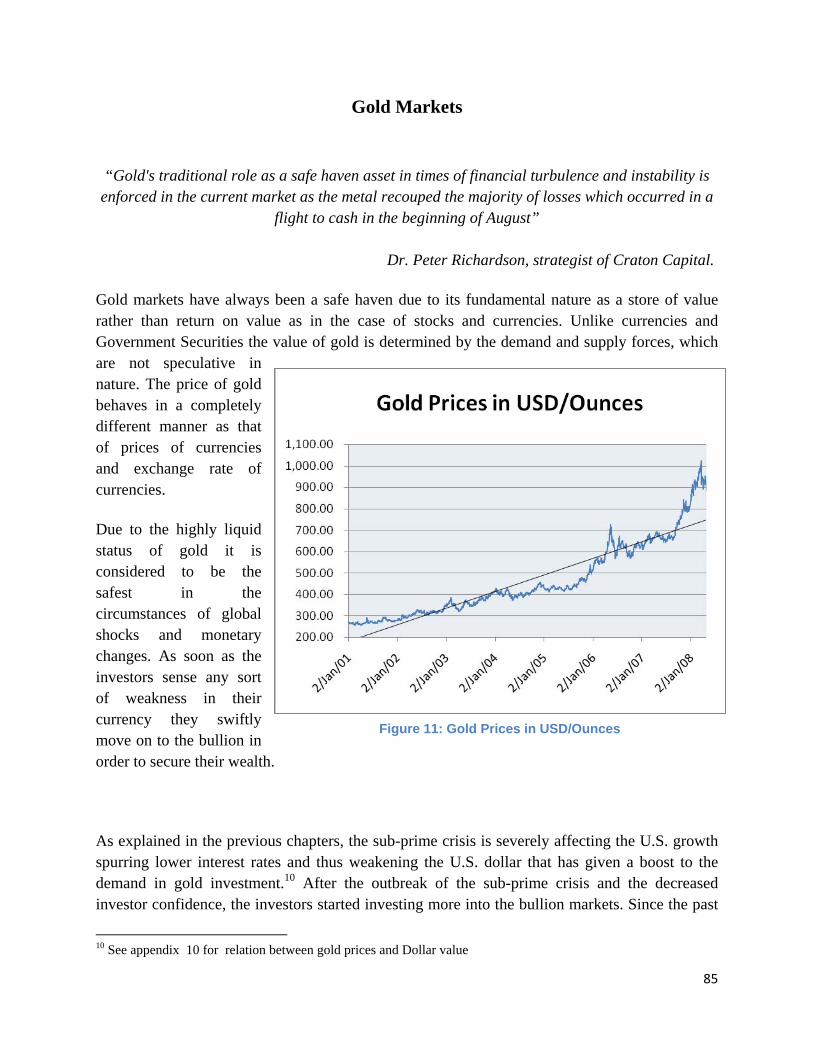
85
Gold Markets
“Gold's traditional role as a safe haven asset in times of financial turbulence and instability is enforced in the current market as the metal recouped the majority of losses which occurred in a
flight to cash in the beginning of August” Dr. Peter Richardson, strategist of Craton Capital.
Gold markets have always been a safe haven due to its fundamental nature as a store of value rather than return on value as in the case of stocks and currencies. Unlike currencies and Government Securities the value of gold is determined by the demand and supply forces, which are not speculative in nature. The price of gold behaves in a completely different manner as that of prices of currencies and exchange rate of currencies.
Due to the highly liquid status of gold it is considered to be the safest in the circumstances of global shocks and monetary changes. As soon as the investors sense any sort of weakness in their currency they swiftly move on to the bullion in order to secure their wealth.
As explained in the previous chapters, the sub-prime crisis is severely affecting the U.S. growth spurring lower interest rates and thus weakening the U.S. dollar that has given a boost to the demand in gold investment.10 After the outbreak of the sub-prime crisis and the decreased investor confidence, the investors started investing more into the bullion markets. Since the past
10 See appendix 10 for relation between gold prices and Dollar value
Figure 11: Gold Prices in USD/Ounces
86
two years from January 2006 till 30 April 2008 there has been a remarkable increase in the value of gold by nearly 71%, while the same period saw a subsequent decrease in the value of dollar of 25%.
Gold touched the pinnacle of $1023.50 an ounce on 17 March 2008 a day before the Federal Reserve Bank announced the seventh rate cut in its process of injecting liquidity through its monetary mechanism. Figure 22 shows the increase in the value of gold due to high investor’s confidence on gold as an investment instrument.
The declining value of dollar has pushed the prices of gold making investors to hedge through the gold market. The long-term inverse correlation between gold and the U.S. dollar and the persistent rise in gold investment demand since 2001 suggest that the gold might keep on strengthening and remain an anchor to the Government reserves.
Besides this, the changes in the real interest rates have marked impact on investor perceptions about the attractiveness of gold as a hedge against this financial asset risk. An inverse relationship between real interest rates and gold price further increases the demand of gold surging the prices.
As a result, the U.S. sub-prime credit crisis could be particularly beneficial to the gold prices.
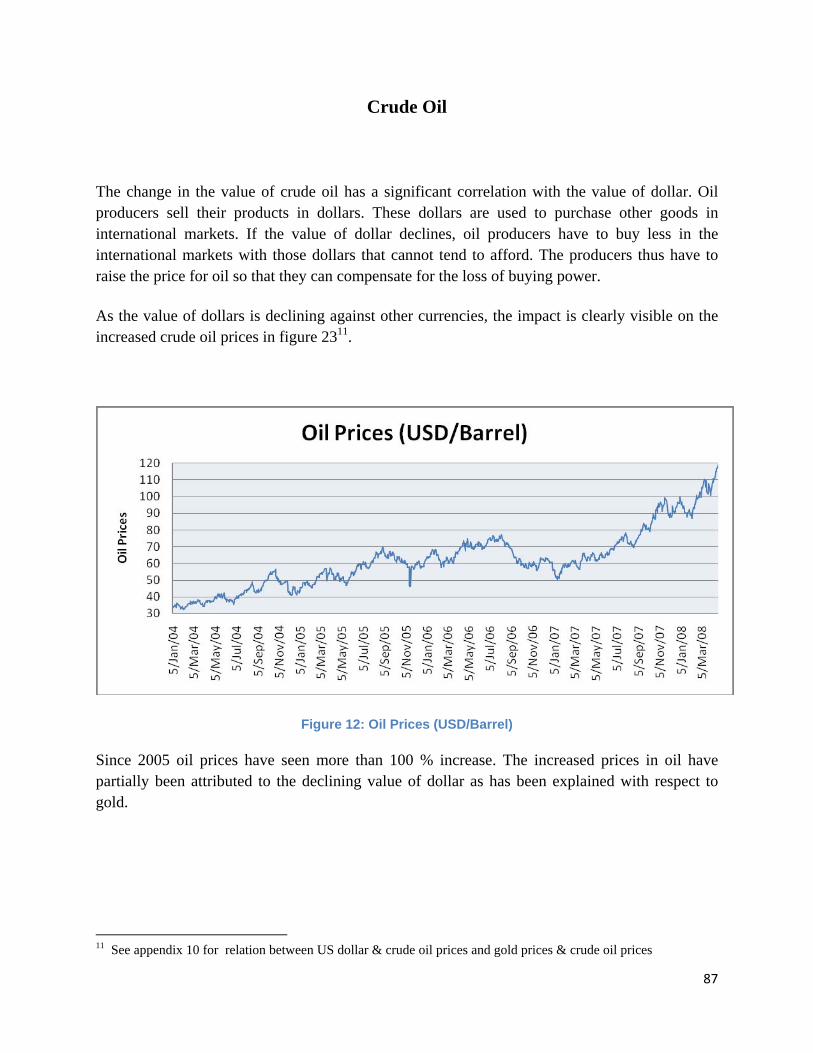
87
Crude Oil
The change in the value of crude oil has a significant correlation with the value of dollar. Oil producers sell their products in dollars. These dollars are used to purchase other goods in international markets. If the value of dollar declines, oil producers have to buy less in the international markets with those dollars that cannot tend to afford. The producers thus have to raise the price for oil so that they can compensate for the loss of buying power.
As the value of dollars is declining against other currencies, the impact is clearly visible on the increased crude oil prices in figure 2311.
Figure 12: Oil Prices (USD/Barrel)
Since 2005 oil prices have seen more than 100 % increase. The increased prices in oil have partially been attributed to the declining value of dollar as has been explained with respect to gold.
11 See appendix 10 for relation between US dollar & crude oil prices and gold prices & crude oil prices
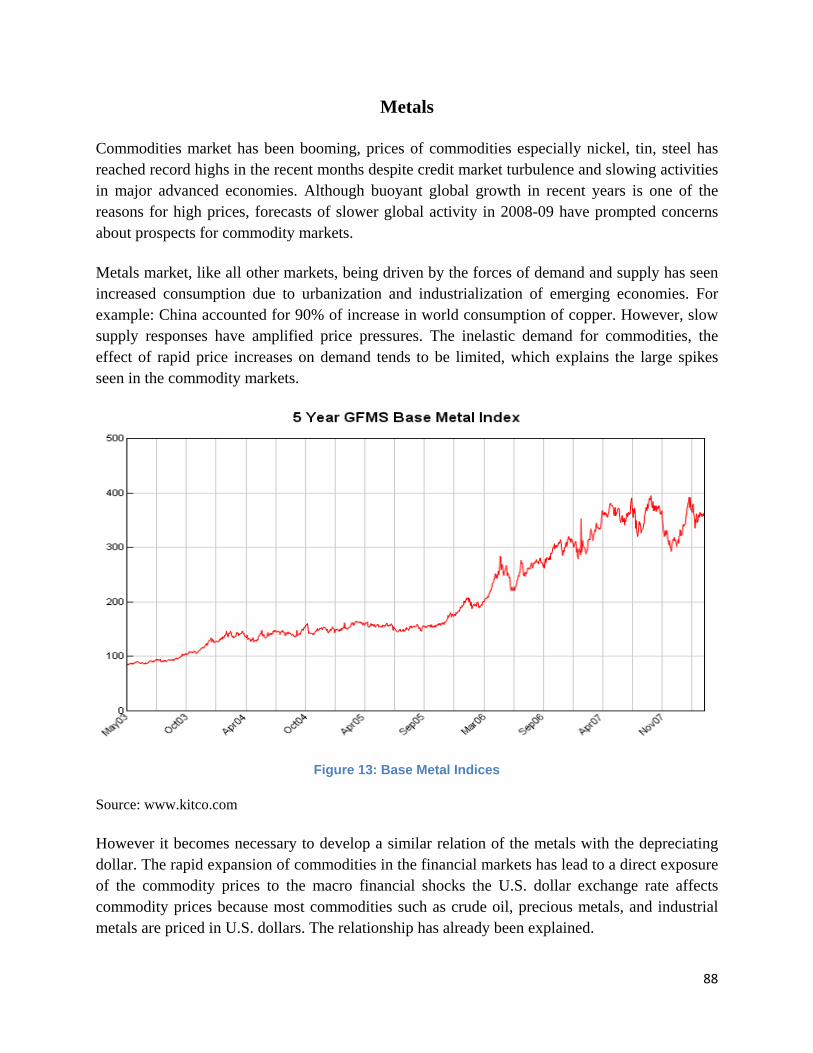
88
Metals
Commodities market has been booming, prices of commodities especially nickel, tin, steel has reached record highs in the recent months despite credit market turbulence and slowing activities in major advanced economies. Although buoyant global growth in recent years is one of the reasons for high prices, forecasts of slower global activity in 2008-09 have prompted concerns about prospects for commodity markets.
Metals market, like all other markets, being driven by the forces of demand and supply has seen increased consumption due to urbanization and industrialization of emerging economies. For example: China accounted for 90% of increase in world consumption of copper. However, slow supply responses have amplified price pressures. The inelastic demand for commodities, the effect of rapid price increases on demand tends to be limited, which explains the large spikes seen in the commodity markets.
Figure 13: Base Metal Indices
Source: www.kitco.com
However it becomes necessary to develop a similar relation of the metals with the depreciating dollar. The rapid expansion of commodities in the financial markets has lead to a direct exposure of the commodity prices to the macro financial shocks the U.S. dollar exchange rate affects commodity prices because most commodities such as crude oil, precious metals, and industrial metals are priced in U.S. dollars. The relationship has already been explained.
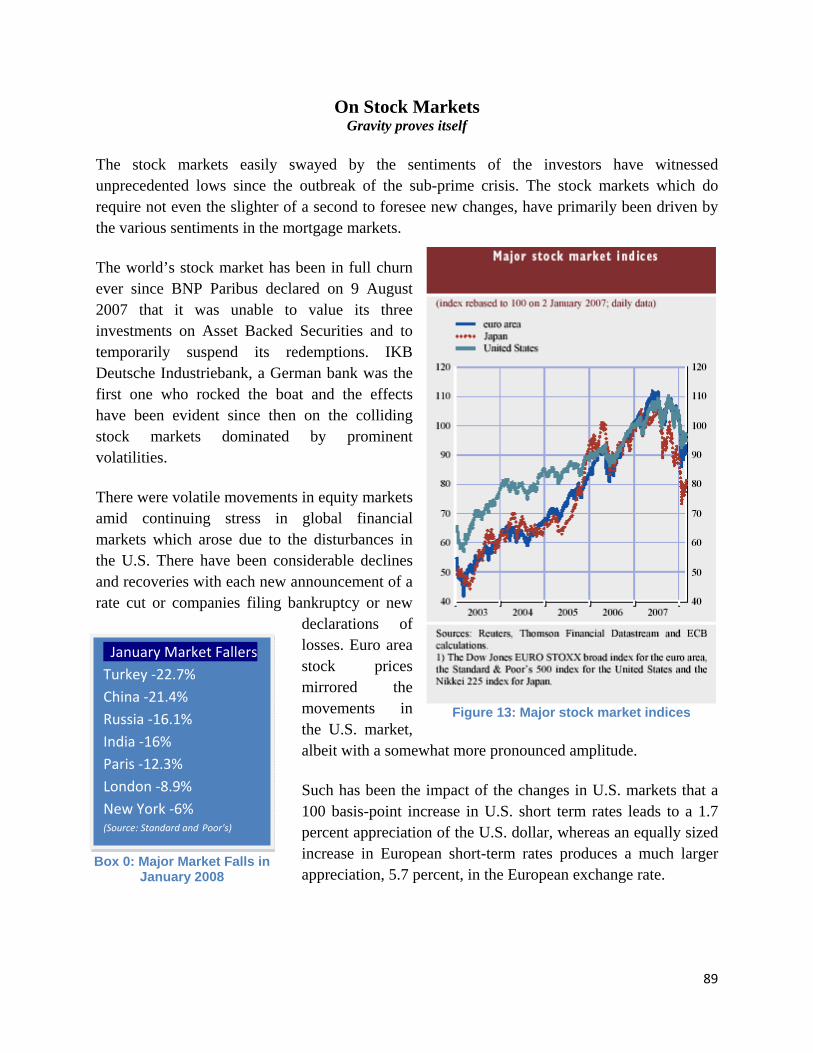
89
On Stock Markets Gravity proves itself
The stock markets easily swayed by the sentiments of the investors have witnessed unprecedented lows since the outbreak of the sub-prime crisis. The stock markets which do require not even the slighter of a second to foresee new changes, have primarily been driven by the various sentiments in the mortgage markets.
The world’s stock market has been in full churn ever since BNP Paribus declared on 9 August 2007 that it was unable to value its three investments on Asset Backed Securities and to temporarily suspend its redemptions. IKB Deutsche Industriebank, a German bank was the first one who rocked the boat and the effects have been evident since then on the colliding stock markets dominated by prominent volatilities.
There were volatile movements in equity markets amid continuing stress in global financial markets which arose due to the disturbances in the U.S. There have been considerable declines and recoveries with each new announcement of a rate cut or companies filing bankruptcy or new
declarations of losses. Euro area stock prices mirrored the movements in the U.S. market, albeit with a somewhat more pronounced amplitude.
Such has been the impact of the changes in U.S. markets that a 100 basis-point increase in U.S. short term rates leads to a 1.7 percent appreciation of the U.S. dollar, whereas an equally sized increase in European short-term rates produces a much larger appreciation, 5.7 percent, in the European exchange rate.
Figure 13: Major stock market indices
January Market Fallers Turkey ‐22.7% China ‐21.4% Russia ‐16.1% India ‐16% Paris ‐12.3% London ‐8.9% New York ‐6% (Source: Standard and Poor's)
Box 0: Major Market Falls in January 2008
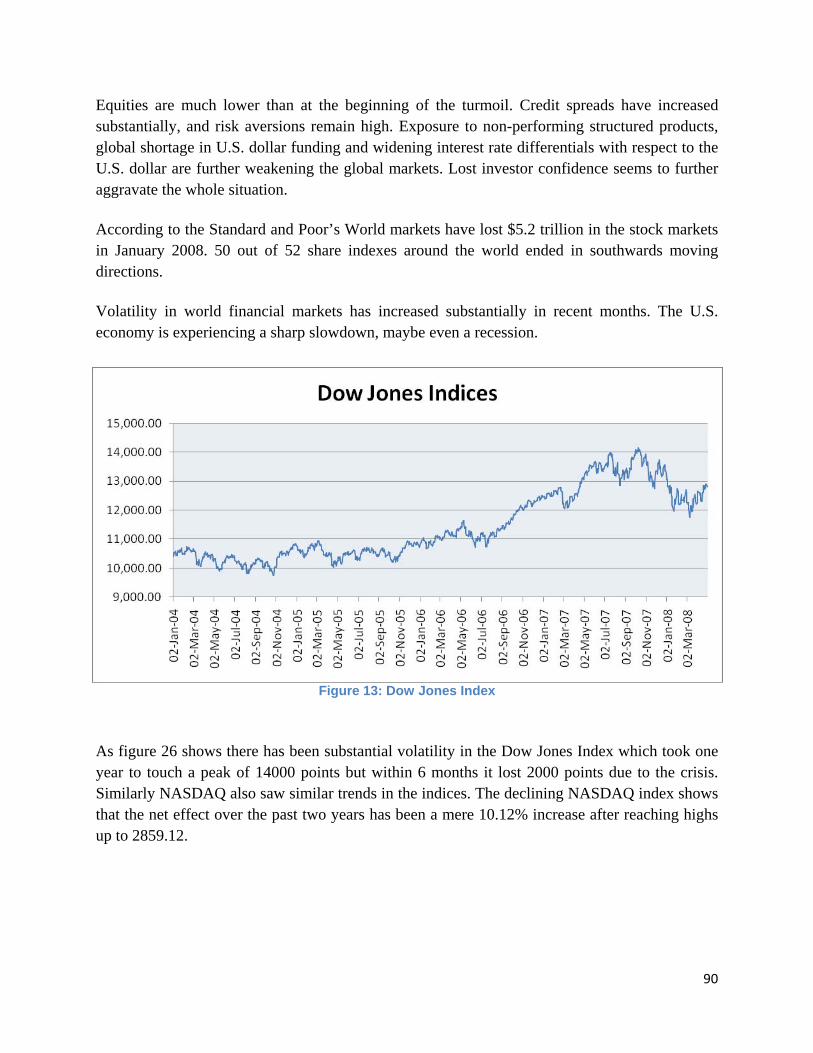
90
Equities are much lower than at the beginning of the turmoil. Credit spreads have increased substantially, and risk aversions remain high. Exposure to non-performing structured products, global shortage in U.S. dollar funding and widening interest rate differentials with respect to the U.S. dollar are further weakening the global markets. Lost investor confidence seems to further aggravate the whole situation.
According to the Standard and Poor’s World markets have lost $5.2 trillion in the stock markets in January 2008. 50 out of 52 share indexes around the world ended in southwards moving directions.
Volatility in world financial markets has increased substantially in recent months. The U.S. economy is experiencing a sharp slowdown, maybe even a recession.
As figure 26 shows there has been substantial volatility in the Dow Jones Index which took one year to touch a peak of 14000 points but within 6 months it lost 2000 points due to the crisis. Similarly NASDAQ also saw similar trends in the indices. The declining NASDAQ index shows that the net effect over the past two years has been a mere 10.12% increase after reaching highs up to 2859.12.
Figure 13: Dow Jones Index
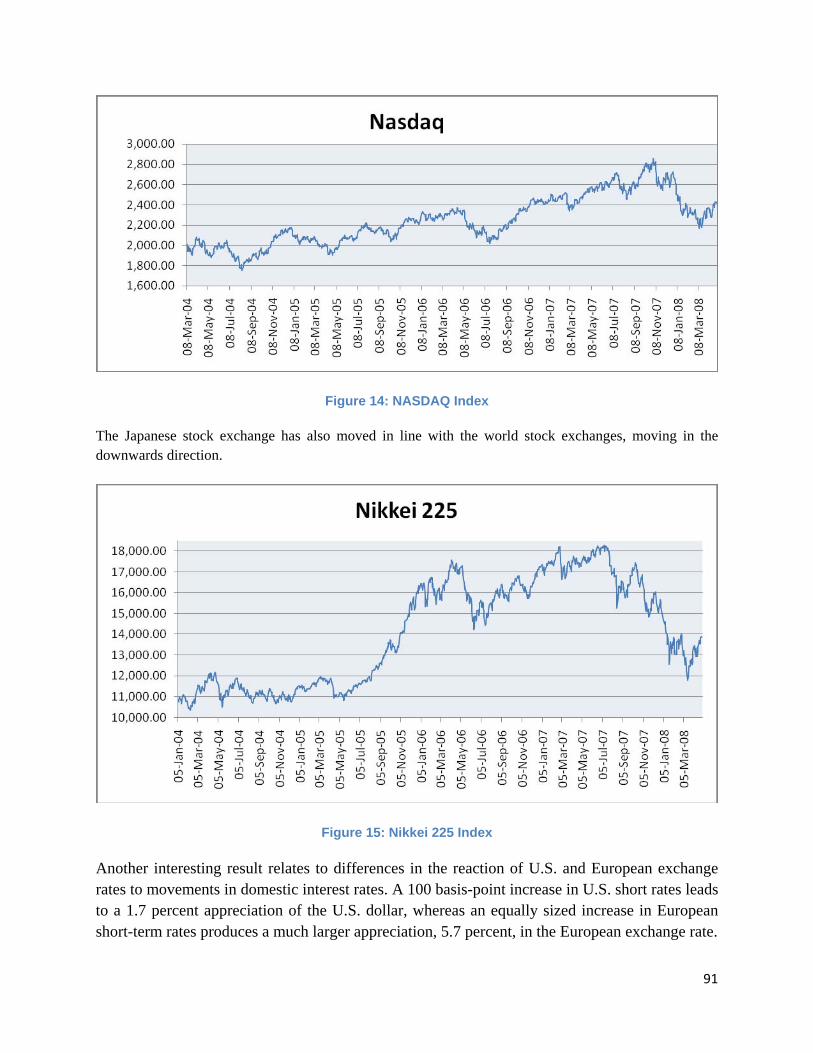
91
Figure 14: NASDAQ Index
The Japanese stock exchange has also moved in line with the world stock exchanges, moving in the downwards direction.
Figure 15: Nikkei 225 Index
Another interesting result relates to differences in the reaction of U.S. and European exchange rates to movements in domestic interest rates. A 100 basis-point increase in U.S. short rates leads to a 1.7 percent appreciation of the U.S. dollar, whereas an equally sized increase in European short-term rates produces a much larger appreciation, 5.7 percent, in the European exchange rate.
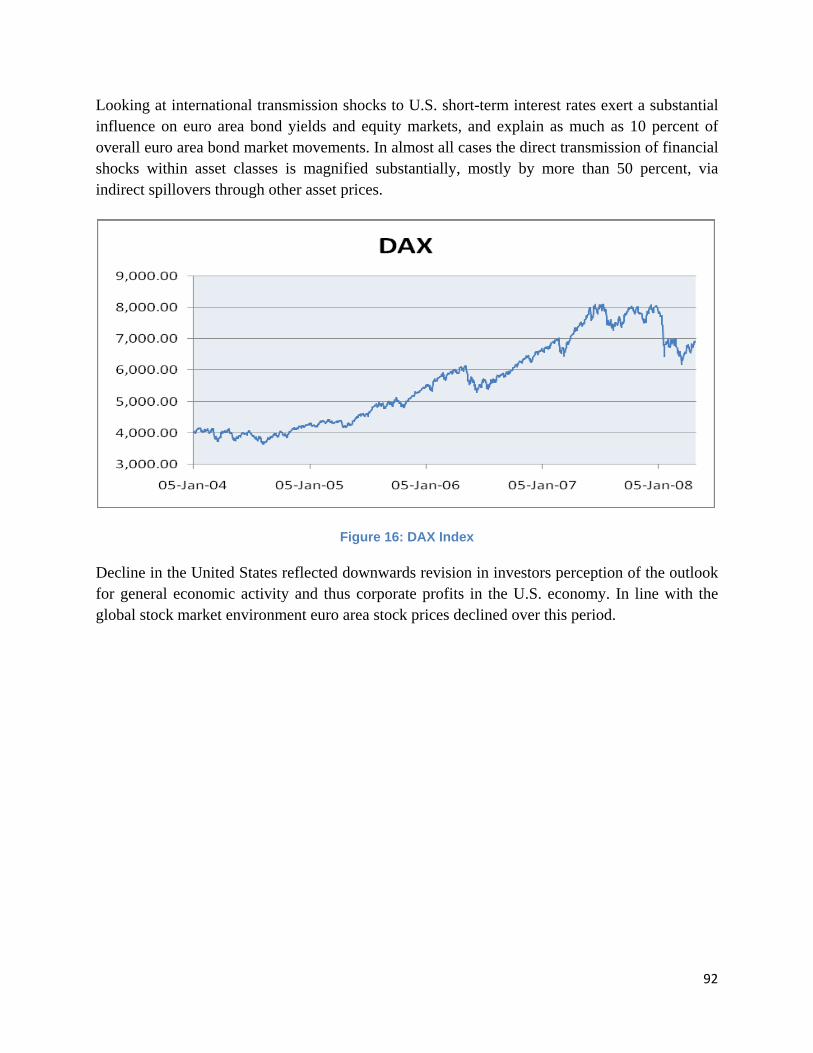
92
Looking at international transmission shocks to U.S. short-term interest rates exert a substantial influence on euro area bond yields and equity markets, and explain as much as 10 percent of overall euro area bond market movements. In almost all cases the direct transmission of financial shocks within asset classes is magnified substantially, mostly by more than 50 percent, via indirect spillovers through other asset prices.
Figure 16: DAX Index
Decline in the United States reflected downwards revision in investors perception of the outlook for general economic activity and thus corporate profits in the U.S. economy. In line with the global stock market environment euro area stock prices declined over this period.
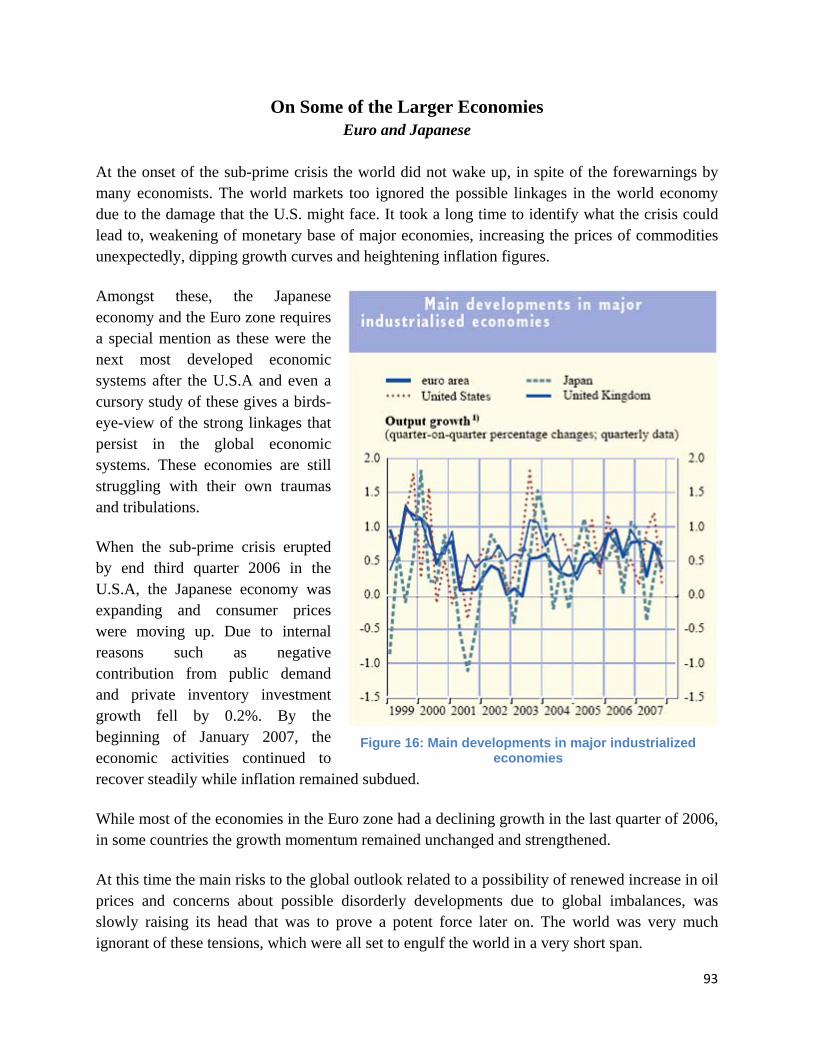
93
On Some of the Larger Economies Euro and Japanese
At the onset of the sub-prime crisis the world did not wake up, in spite of the forewarnings by many economists. The world markets too ignored the possible linkages in the world economy due to the damage that the U.S. might face. It took a long time to identify what the crisis could lead to, weakening of monetary base of major economies, increasing the prices of commodities unexpectedly, dipping growth curves and heightening inflation figures.
Amongst these, the Japanese economy and the Euro zone requires a special mention as these were the next most developed economic systems after the U.S.A and even a cursory study of these gives a birds-eye-view of the strong linkages that persist in the global economic systems. These economies are still struggling with their own traumas and tribulations.
When the sub-prime crisis erupted by end third quarter 2006 in the U.S.A, the Japanese economy was expanding and consumer prices were moving up. Due to internal reasons such as negative contribution from public demand and private inventory investment growth fell by 0.2%. By the beginning of January 2007, the economic activities continued to recover steadily while inflation remained subdued.
While most of the economies in the Euro zone had a declining growth in the last quarter of 2006, in some countries the growth momentum remained unchanged and strengthened.
At this time the main risks to the global outlook related to a possibility of renewed increase in oil prices and concerns about possible disorderly developments due to global imbalances, was slowly raising its head that was to prove a potent force later on. The world was very much ignorant of these tensions, which were all set to engulf the world in a very short span.
Figure 16: Main developments in major industrialized economies
94
In the first quarter of 2007 the Japanese economy continued to recover steadily with strong exports and robust domestic demand. The real GDP grew by 1.3% and the CPI inflation had declined. The overall outlook for the external environment was favorable.
As a reaction to the spreading financial market turbulence the U.S. Federal Open Market Committee announced a 50 basis point reduction in the primary credit rate to 4.75% in September 2007. However the Bank of Japan left the rates unchanged at 0.50%. Due to a slowdown in the private residential investment the real GDP grew by mere 0.1% against 0.8% in the previous quarter. Negative contributions, most notably from housing, continued to dampen the inflation. On the other hand, some of the European banks announced increases in the interest rates to counteract the inflationary pressures (this trend was to reverse soon).
Throwing light on the housing situation, many of the non-euro area EU countries had experienced rapid growth in residential housing property. In most of the countries mortgage instruments had become widely available at lower cost, longer maturities and on flexible terms. In many countries low nominal and real interest rates prevailed due to the improved macroeconomic stability and lower risk premia, along with other factors like output growth, rising employment and higher income expectations. (See Box 8)
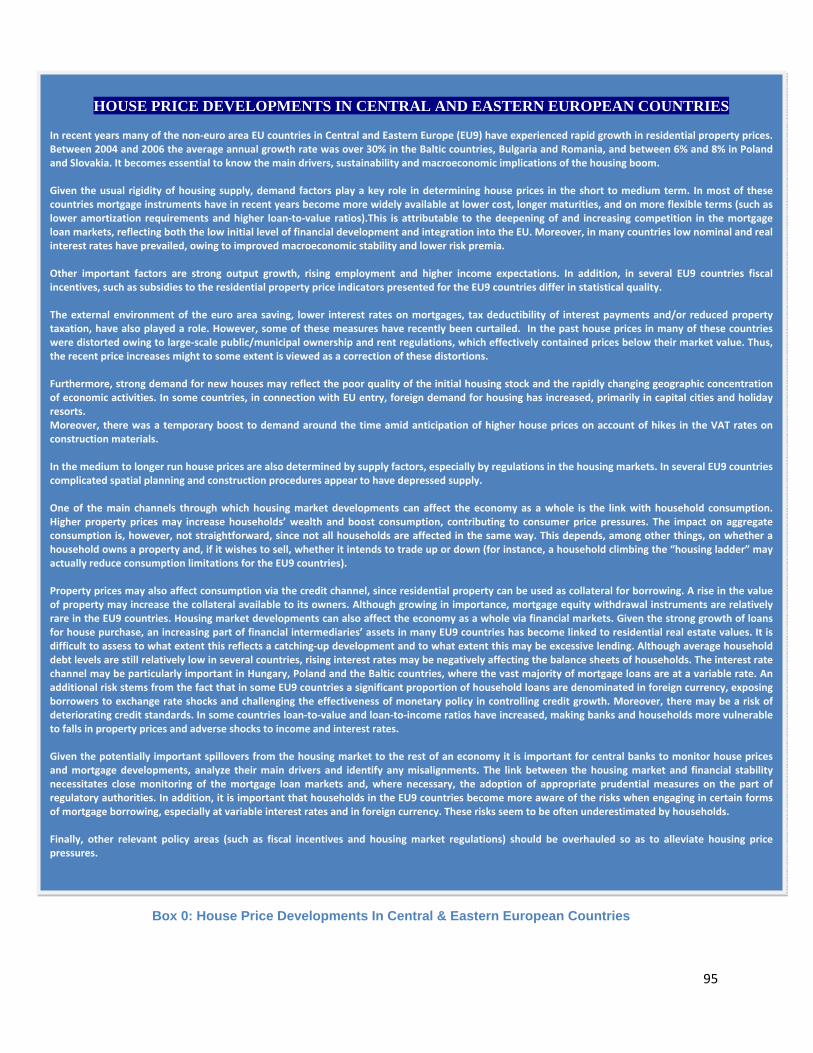
95
HOUSE PRICE DEVELOPMENTS IN CENTRAL AND EASTERN EUROPEAN COUNTRIES
In recent years many of the non‐euro area EU countries in Central and Eastern Europe (EU9) have experienced rapid growth in residential property prices.Between 2004 and 2006 the average annual growth rate was over 30% in the Baltic countries, Bulgaria and Romania, and between 6% and 8% in Polandand Slovakia. It becomes essential to know the main drivers, sustainability and macroeconomic implications of the housing boom. Given the usual rigidity of housing supply, demand factors play a key role in determining house prices in the short to medium term. In most of thesecountries mortgage instruments have in recent years become more widely available at lower cost, longer maturities, and on more flexible terms (such aslower amortization requirements and higher loan‐to‐value ratios).This is attributable to the deepening of and increasing competition in the mortgageloan markets, reflecting both the low initial level of financial development and integration into the EU. Moreover, in many countries low nominal and realinterest rates have prevailed, owing to improved macroeconomic stability and lower risk premia. Other important factors are strong output growth, rising employment and higher income expectations. In addition, in several EU9 countries fiscalincentives, such as subsidies to the residential property price indicators presented for the EU9 countries differ in statistical quality. The external environment of the euro area saving, lower interest rates on mortgages, tax deductibility of interest payments and/or reduced propertytaxation, have also played a role. However, some of these measures have recently been curtailed. In the past house prices in many of these countrieswere distorted owing to large‐scale public/municipal ownership and rent regulations, which effectively contained prices below their market value. Thus,the recent price increases might to some extent is viewed as a correction of these distortions. Furthermore, strong demand for new houses may reflect the poor quality of the initial housing stock and the rapidly changing geographic concentrationof economic activities. In some countries, in connection with EU entry, foreign demand for housing has increased, primarily in capital cities and holidayresorts. Moreover, there was a temporary boost to demand around the time amid anticipation of higher house prices on account of hikes in the VAT rates onconstruction materials. In the medium to longer run house prices are also determined by supply factors, especially by regulations in the housing markets. In several EU9 countriescomplicated spatial planning and construction procedures appear to have depressed supply. One of the main channels through which housing market developments can affect the economy as a whole is the link with household consumption.Higher property prices may increase households’ wealth and boost consumption, contributing to consumer price pressures. The impact on aggregateconsumption is, however, not straightforward, since not all households are affected in the same way. This depends, among other things, on whether ahousehold owns a property and, if it wishes to sell, whether it intends to trade up or down (for instance, a household climbing the “housing ladder” mayactually reduce consumption limitations for the EU9 countries). Property prices may also affect consumption via the credit channel, since residential property can be used as collateral for borrowing. A rise in the valueof property may increase the collateral available to its owners. Although growing in importance, mortgage equity withdrawal instruments are relativelyrare in the EU9 countries. Housing market developments can also affect the economy as a whole via financial markets. Given the strong growth of loansfor house purchase, an increasing part of financial intermediaries’ assets in many EU9 countries has become linked to residential real estate values. It isdifficult to assess to what extent this reflects a catching‐up development and to what extent this may be excessive lending. Although average householddebt levels are still relatively low in several countries, rising interest rates may be negatively affecting the balance sheets of households. The interest ratechannel may be particularly important in Hungary, Poland and the Baltic countries, where the vast majority of mortgage loans are at a variable rate. Anadditional risk stems from the fact that in some EU9 countries a significant proportion of household loans are denominated in foreign currency, exposingborrowers to exchange rate shocks and challenging the effectiveness of monetary policy in controlling credit growth. Moreover, there may be a risk ofdeteriorating credit standards. In some countries loan‐to‐value and loan‐to‐income ratios have increased, making banks and households more vulnerableto falls in property prices and adverse shocks to income and interest rates. Given the potentially important spillovers from the housing market to the rest of an economy it is important for central banks to monitor house pricesand mortgage developments, analyze their main drivers and identify any misalignments. The link between the housing market and financial stabilitynecessitates close monitoring of the mortgage loan markets and, where necessary, the adoption of appropriate prudential measures on the part ofregulatory authorities. In addition, it is important that households in the EU9 countries become more aware of the risks when engaging in certain formsof mortgage borrowing, especially at variable interest rates and in foreign currency. These risks seem to be often underestimated by households. Finally, other relevant policy areas (such as fiscal incentives and housing market regulations) should be overhauled so as to alleviate housing pricepressures.
Box 0: House Price Developments In Central & Eastern European Countries
96
Even by the end of the year, the subprime crisis did not show much effect on the developed markets, even when the crisis were in full swing elsewhere. In December 2007 economic activities in Japan recovered steadily which is evident by the 0.5% growth figures in the last quarter of year 2007 against 0.4% in the previous quarter. The CPI fell to 0.4% from 0.6% in September 2007. The growth in European economies was however unaffected by the turmoil and persisted to grow at a favorable pace. However there were risks emanating from oil market and elevating oil prices.
In January 2008, the global activities remained resilient due to the global repercussions of the US slowdown. On account of higher commodity prices consumer price indices remained at a high level. Japanese economy as well as the European nations did not see much deviation in the growth figures
By February, the Japanese economic had slowed down due to the revision in the Building Standard Law12 in June 2007 which resulted in a significant drop in housing corporate construction starts in the second half of 2007. The CPI inflation had turned to a positive figure up to 0.7%. Most of the European nations witnessed increased inflation along with a decreased consumer confidence. The Bank of England (BoE) decided to cut its main policy rate by 25 basis points to 5.25%. Growth momentum decelerated on the back of tighter credit conditions, negative wealth effects stemming from the weakness in house and equity prices, and weaker foreign demand.
During the month of March, due to the persistently high market volatility and new announced data pronouncing weakness in U.S. economic activity, the global area had weakened in the last month of the first quarter of 2008. In the fourth quarter of the year 2007, the real GDP grew by 0.9% quarter-on-quarter basis due to strong exports. For the whole year the real GDP grew by 2.1% against 2.4% in 2006. While the CPI stood at stood at 0.8% in the previous month. Bank of England (BoE) further decided to leave the main policy rates unchanged after previous rate cuts in February. There were falling investments and employment intentions. Inflation rates were rising due to increases in prices of fuel and imports.
In April, the outlook for the Japanese economy had become more uncertain. Risks had increased on the downside, in the wake of the global financial turmoil and rising raw material prices that could lead to decreased private consumptions. The European countries, mainly England witnessed a slow growth at 0.6% with down consumer confidence indicators and weak growth in non-food sales predominantly. Considering the rate cuts by Fed Bank, even the BoE decided to cut its main policy rate to 5.00% from 5.25%. Inflation in other countries remained at high levels and the GDP growth in few nations (Denmark and Sweden) were just below long-term averages for each company. 12 In 1981 the Building Standard law was amended to introduce plastic designs into architecture of buildings which were exposed to seismic forces, in order to protect humans and property from earthquakes.
97
Both the weakness of U.S. economic activity and high financial market volatility are having a dampening effect on the pace of the global expansions. However global economic activities continue to be supported by the resilience of economic markets, mainly Asian market.
Conclusion:
The shortcoming of the not so inefficient sub-prime mechanism was that the quantum of losses that may result from the sub-prime lending mechanism was not understood well, nor was the trajectory with which the contagion could spread engulfing the whole world economies. Finally, the high-liquidity fed, low risk priced global capital market is contextually not well equipped to deal with a situation where a trillion dollars or more of assets were to suddenly turn illiquid.
98
IIMMPPAACCTT OONN IINNDDIIAA
“India has always been outside the epicenter of events and yet we get drawn in by the sheer
gravitational pull of our geography, resources and potential.”
Anand Mahindra, Indian Economic Summit. 2-4 December 2007
Life is usually always easier thousands of kilometers away from the epicenter of any crisis. While it augurs true for events of real nature, when it comes to economic affairs ripple-effect almost always ensures that the chain of events does have some incidental fallouts (both anticipated and unanticipated). The degree and intensity vary according to the proximity to the origin of the ripple. In India’s case we lie in the outlier of the ripple, meaning that the effects of the events would be felt, only after a lag and that too the effects shall to a large extent remain muted. The effects on the Indian economy would be either through the investments made in dollar denominated investments, indispensable need of crude oil or hedging of gold – all being governed by the mighty dollar. The Indian economy as one of the emerging market economies (EME’s) was not exposed to complicated mechanisms of the sub-prime lending and its offspring’s-CDO’s and MBS. Owing to the strong macroeconomic fundamentals, non-convertibility of current account and highly regulated financial systems the economy appeared to be completely insulated from the emerging crisis. It was only later on that ICICI rocked the boat and sowed the seeds of doubt that the Indian economy may not be safe, altogether and that there may actually be direct linkages.
The world unified with common ties of globalization had always been hungry to relish the taste of new instruments aimed at higher yields in shortest possible time. This threat in the immensely expanded universe of quantity and variety was satisfied by some Indian banks/companies as well; which were yet to create both challenges and pitfalls manifold times then the reality.
With inflationary pressures in the world economy, speculative bubbles in the Asian markets downfalls in the stock markets, increasing risks in the commodities markets, falling interest rate in the money market supported by the increasing domestic demand, Indian economy may, after all, be feeling the ripple effects. Indirect though, the impact cannot be altogether ignored being an emerging nation that is preparing itself to maintain its hegemony in the next few decades.
Backed by the strong fundamentals, tight rules and regulations by RBI, the Indian economy has always played safe and emerged unscathed in the global volatility, which every now and then has affected the world. Be it the Asian Currency Crisis or the American dotcom bubble shaking one
99
of the strongest income generating sectors, the Indian economy has been able to sustain itself and stood at such a pedestal through its skilled manpower and semi-controlled market setup.
There have been several factors, which have insulated the economy from the adverse impacts: First and foremost, the promising figure of over 8% GDP makes India a booming
economy which can very well nurture the financial inflow i.e. investments by the foreigners in our country, and translate them into more finances. The hot money entering into the economy provides lucrative avenues to the investors. Capital Account Convertibility, which prohibits the Indian investors to make direct
investments abroad, acts as a shield that jeopardizes the money of Indian Investors. Moreover, our economy is highly regulated through various rules and regulations
imposed by the Banking Mechanism. For example, there are caps on the Foreign Direct Investments (FDI) made in India and not every sector is open to FDI’s.
Though Indian markets have managed to protect themselves from a greater damage, the Sub-prime Crisis is to be viewed as a wakeup call for the Indian regulatory authorities, to continue to bolster the economy and be on a stringent lookout with adequate measures in place. The much maligned regulations have worked in our favor and probably saved U.S. from the dire consequences. Nevertheless as we see in the following pages, our economy has been hurt by the sub-prime crisis and we have tried to trace the linkages.
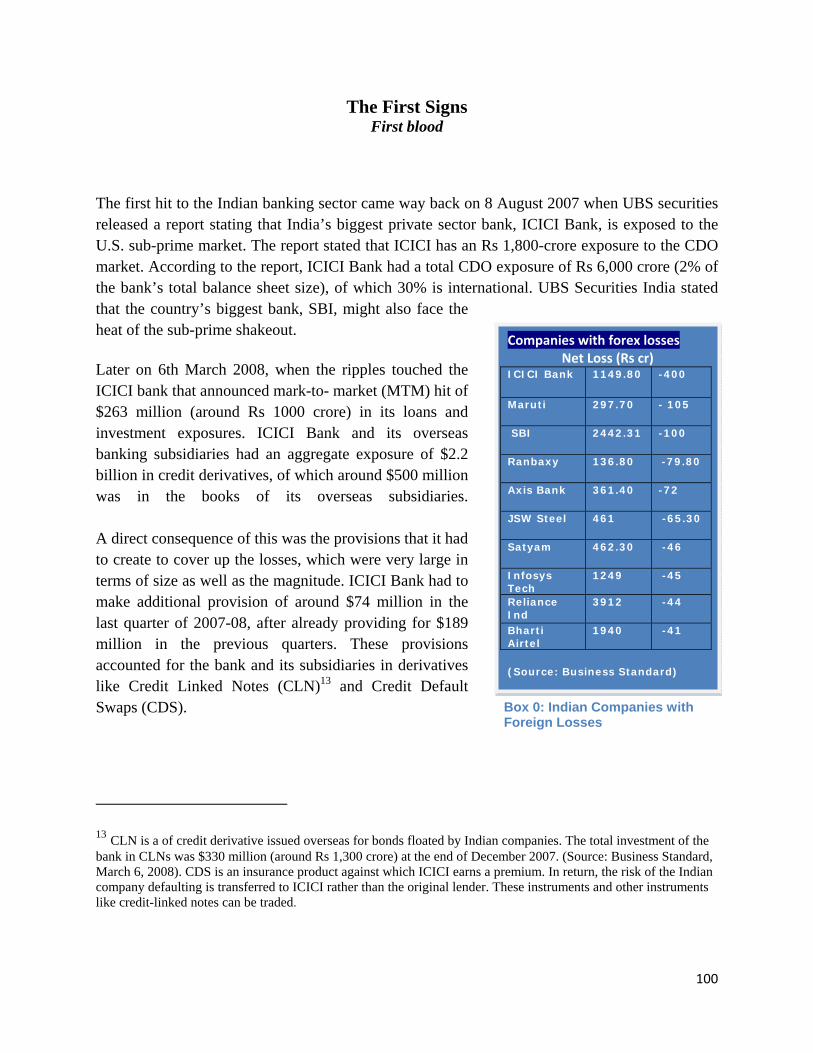
100
The First Signs First blood
The first hit to the Indian banking sector came way back on 8 August 2007 when UBS securities released a report stating that India’s biggest private sector bank, ICICI Bank, is exposed to the U.S. sub-prime market. The report stated that ICICI has an Rs 1,800-crore exposure to the CDO market. According to the report, ICICI Bank had a total CDO exposure of Rs 6,000 crore (2% of the bank’s total balance sheet size), of which 30% is international. UBS Securities India stated that the country’s biggest bank, SBI, might also face the heat of the sub-prime shakeout.
Later on 6th March 2008, when the ripples touched the ICICI bank that announced mark-to- market (MTM) hit of $263 million (around Rs 1000 crore) in its loans and investment exposures. ICICI Bank and its overseas banking subsidiaries had an aggregate exposure of $2.2 billion in credit derivatives, of which around $500 million was in the books of its overseas subsidiaries. A direct consequence of this was the provisions that it had to create to cover up the losses, which were very large in terms of size as well as the magnitude. ICICI Bank had to make additional provision of around $74 million in the last quarter of 2007-08, after already providing for $189 million in the previous quarters. These provisions accounted for the bank and its subsidiaries in derivatives like Credit Linked Notes (CLN)13 and Credit Default Swaps (CDS).
13 CLN is a of credit derivative issued overseas for bonds floated by Indian companies. The total investment of the bank in CLNs was $330 million (around Rs 1,300 crore) at the end of December 2007. (Source: Business Standard, March 6, 2008). CDS is an insurance product against which ICICI earns a premium. In return, the risk of the Indian company defaulting is transferred to ICICI rather than the original lender. These instruments and other instruments like credit-linked notes can be traded.
Companies with forex losses Net Loss (Rs cr)
ICICI Bank 1149.80 -400
Maruti 297.70 - 105
SBI 2442.31 -100
Ranbaxy 136.80 -79.80
Axis Bank 361.40 -72
JSW Steel 461 -65.30
Satyam 462.30 -46
Infosys Tech
1249 -45
Reliance Ind
3912 -44
Bharti Airtel
1940 -41
(Source: Business Standard)
Box 0: Indian Companies with Foreign Losses
101
Among PSB’s, State Bank of India (SBI) is having the largest exposure of about $700-million to Credit-Linked Notes (CLN’s), issued on behalf of Indian corporate. SBI is followed by Bank of India ($400 mn) and Bank of Baroda ($329 mn).
SBI has confirmed that the bank may suffer a MTM loss of up to Rs 700 crore at the end of March 2008 due to derivative transactions, after making a provision of Rs.40 crore in the last quarter.
Bank of India has reported to raise its provisioning by another Rs 4 crore, over its already existing present provisioning of about Rs 4 crore. On the other hand, the bank’s international branches also have an exposure of up to $30 million, which are likely to result in a potential loss for the bank.
Bank of Baroda is also expected to set a provision for an additional $2.50 million (around Rs 10 crore) for its investments in Credit Linked Notes.
Moreover, private banks such as Axis Bank have also stated about the potential losses which they may suffer. Axis Bank had stated in March 2008 that it has made a provision of $5 million for depreciation in the value of credit-linked notes. It has also reported that at the end of March, its clients were having 188 derivatives transactions with an aggregate MTM loss of Rs 673.55 crore. Of the 188 deals, 113 were outstanding transactions dealing in foreign exchange derivatives where the aggregate MTM loss was Rs 547.72 crore.
Recently, mark-to-market losses worth Rs1365 crores have been recorded of 46 Indian companies on account of foreign exchange contracts, fluctuation in exchange rates and commodity hedging. (See box 9)
Internationally, the overall derivative market stands at $ 415 trillion with credit derivatives at around $41 trillion, growing at more than 25%. The squeeze in the financial markets has suddenly brought out the embedded risks in these products.
Thanks to the RBI policies which have restricted the Indian Financial companies to make investments in foreign markets directly, these companies are to a great extent impervious to the direct vulnerabilities of CDO’s and MBS’s.
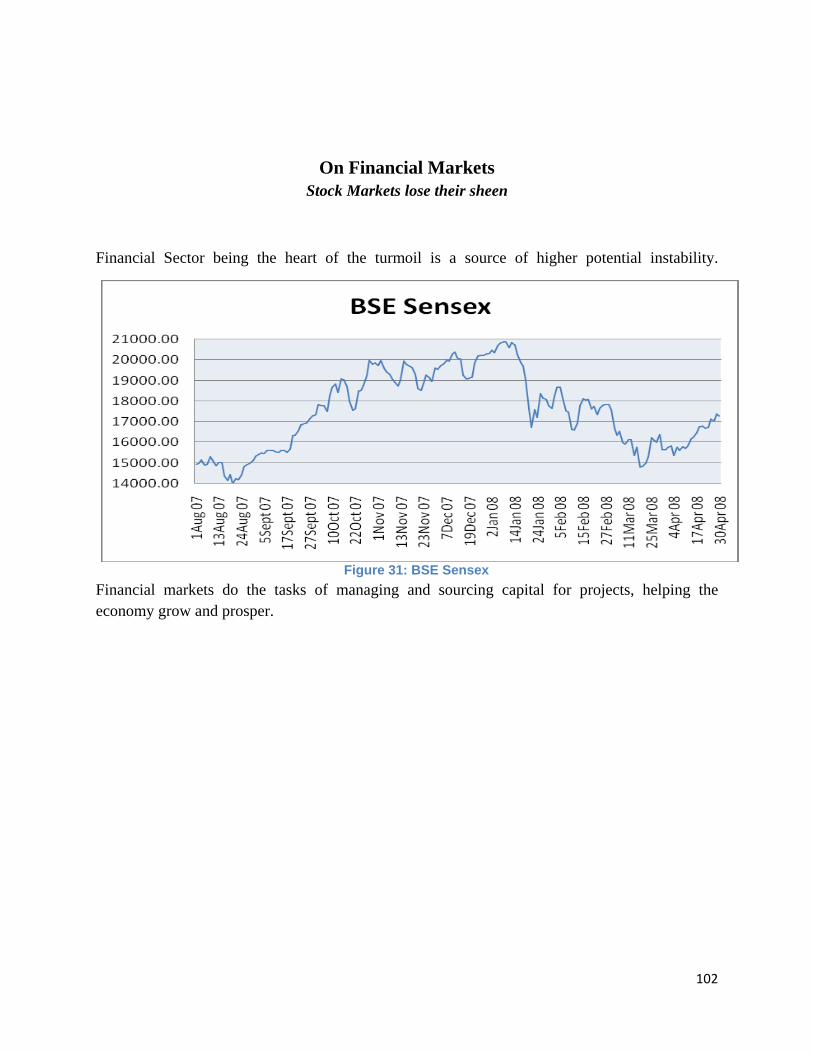
102
On Financial Markets
Stock Markets lose their sheen
Financial Sector being the heart of the turmoil is a source of higher potential instability.
Financial markets do the tasks of managing and sourcing capital for projects, helping the economy grow and prosper.
Figure 31: BSE Sensex
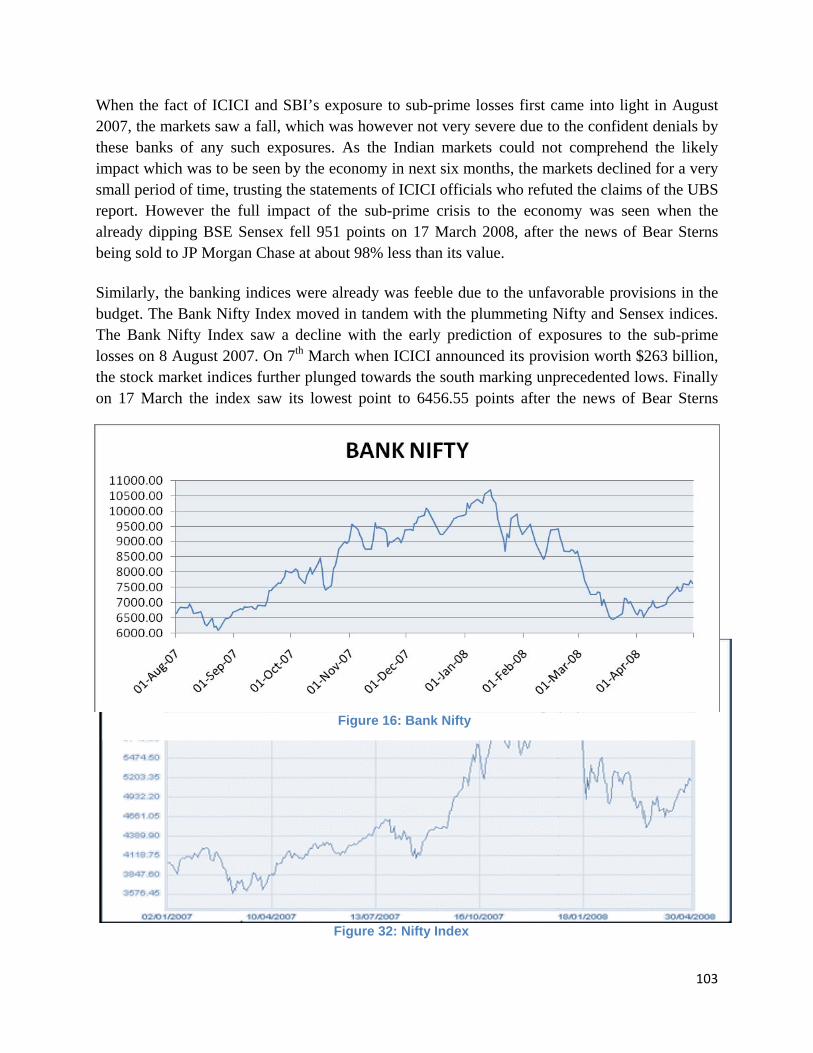
103
When the fact of ICICI and SBI’s exposure to sub-prime losses first came into light in August 2007, the markets saw a fall, which was however not very severe due to the confident denials by these banks of any such exposures. As the Indian markets could not comprehend the likely impact which was to be seen by the economy in next six months, the markets declined for a very small period of time, trusting the statements of ICICI officials who refuted the claims of the UBS report. However the full impact of the sub-prime crisis to the economy was seen when the already dipping BSE Sensex fell 951 points on 17 March 2008, after the news of Bear Sterns being sold to JP Morgan Chase at about 98% less than its value.
Similarly, the banking indices were already was feeble due to the unfavorable provisions in the budget. The Bank Nifty Index moved in tandem with the plummeting Nifty and Sensex indices. The Bank Nifty Index saw a decline with the early prediction of exposures to the sub-prime losses on 8 August 2007. On 7th March when ICICI announced its provision worth $263 billion, the stock market indices further plunged towards the south marking unprecedented lows. Finally on 17 March the index saw its lowest point to 6456.55 points after the news of Bear Sterns
Figure 32: Nifty Index
Figure 16: Bank Nifty
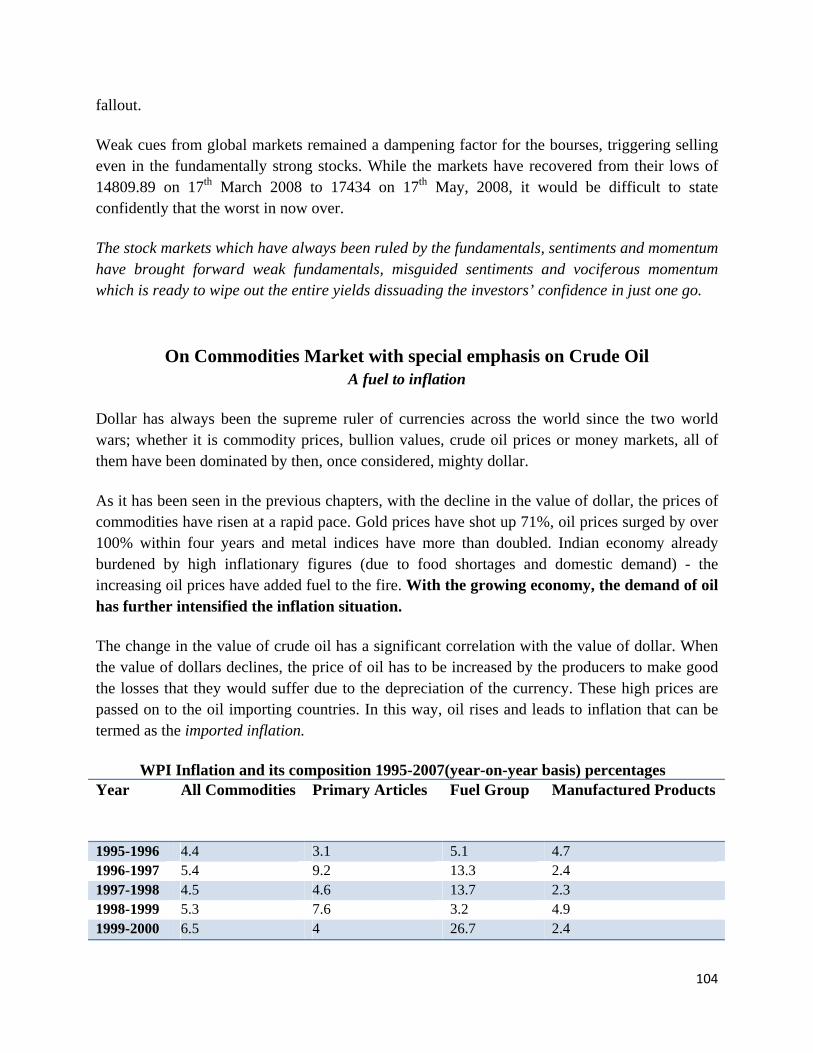
104
fallout.
Weak cues from global markets remained a dampening factor for the bourses, triggering selling even in the fundamentally strong stocks. While the markets have recovered from their lows of 14809.89 on 17th March 2008 to 17434 on 17th May, 2008, it would be difficult to state confidently that the worst in now over.
The stock markets which have always been ruled by the fundamentals, sentiments and momentum have brought forward weak fundamentals, misguided sentiments and vociferous momentum which is ready to wipe out the entire yields dissuading the investors’ confidence in just one go.
On Commodities Market with special emphasis on Crude Oil
A fuel to inflation
Dollar has always been the supreme ruler of currencies across the world since the two world wars; whether it is commodity prices, bullion values, crude oil prices or money markets, all of them have been dominated by then, once considered, mighty dollar.
As it has been seen in the previous chapters, with the decline in the value of dollar, the prices of commodities have risen at a rapid pace. Gold prices have shot up 71%, oil prices surged by over 100% within four years and metal indices have more than doubled. Indian economy already burdened by high inflationary figures (due to food shortages and domestic demand) - the increasing oil prices have added fuel to the fire. With the growing economy, the demand of oil has further intensified the inflation situation.
The change in the value of crude oil has a significant correlation with the value of dollar. When the value of dollars declines, the price of oil has to be increased by the producers to make good the losses that they would suffer due to the depreciation of the currency. These high prices are passed on to the oil importing countries. In this way, oil rises and leads to inflation that can be termed as the imported inflation.
WPI Inflation and its composition 1995-2007(year-on-year basis) percentages Year
All Commodities Primary Articles Fuel Group Manufactured Products
1995-1996 4.4 3.1 5.1 4.7 1996-1997 5.4 9.2 13.3 2.4 1997-1998 4.5 4.6 13.7 2.3 1998-1999 5.3 7.6 3.2 4.9 1999-2000 6.5 4 26.7 2.4
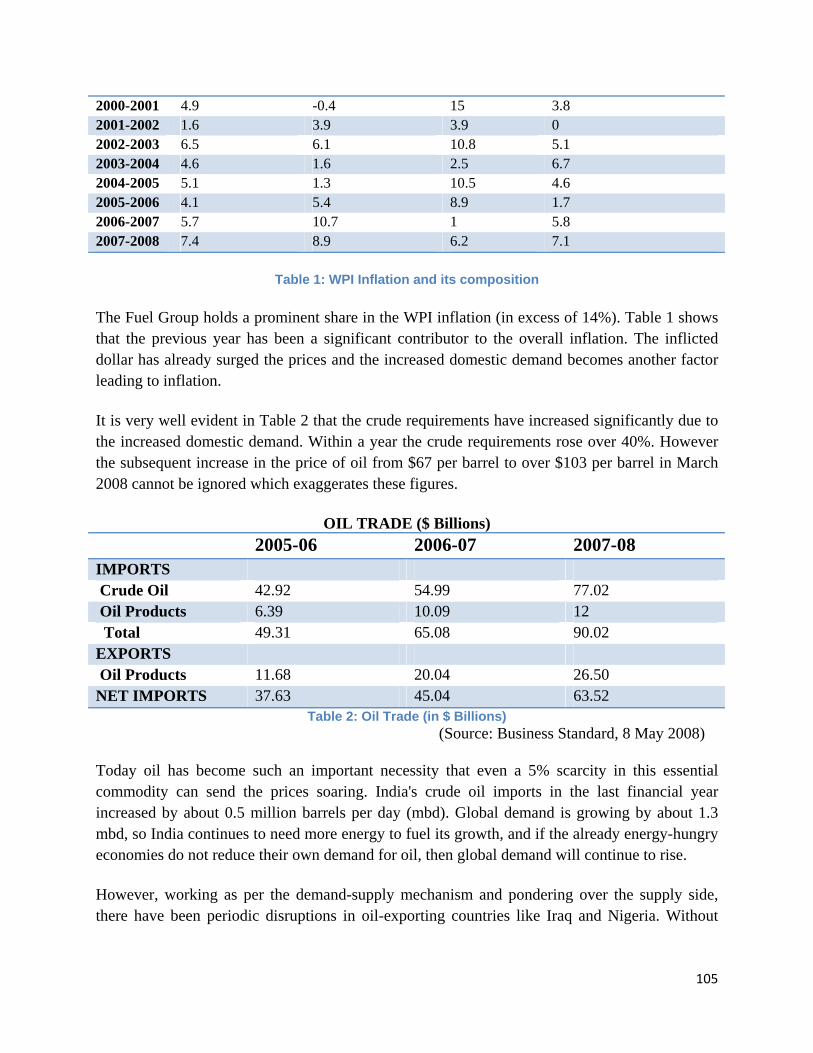
105
2000-2001 4.9 -0.4 15 3.8 2001-2002 1.6 3.9 3.9 0 2002-2003 6.5 6.1 10.8 5.1 2003-2004 4.6 1.6 2.5 6.7 2004-2005 5.1 1.3 10.5 4.6 2005-2006 4.1 5.4 8.9 1.7 2006-2007 5.7 10.7 1 5.8 2007-2008 7.4 8.9 6.2 7.1
Table 1: WPI Inflation and its composition
The Fuel Group holds a prominent share in the WPI inflation (in excess of 14%). Table 1 shows that the previous year has been a significant contributor to the overall inflation. The inflicted dollar has already surged the prices and the increased domestic demand becomes another factor leading to inflation.
It is very well evident in Table 2 that the crude requirements have increased significantly due to the increased domestic demand. Within a year the crude requirements rose over 40%. However the subsequent increase in the price of oil from $67 per barrel to over $103 per barrel in March 2008 cannot be ignored which exaggerates these figures.
OIL TRADE ($ Billions) 2005-06 2006-07 2007-08 IMPORTS Crude Oil 42.92 54.99 77.02 Oil Products 6.39 10.09 12 Total 49.31 65.08 90.02 EXPORTS Oil Products 11.68 20.04 26.50 NET IMPORTS 37.63 45.04 63.52
Table 2: Oil Trade (in $ Billions) (Source: Business Standard, 8 May 2008)
Today oil has become such an important necessity that even a 5% scarcity in this essential commodity can send the prices soaring. India's crude oil imports in the last financial year increased by about 0.5 million barrels per day (mbd). Global demand is growing by about 1.3 mbd, so India continues to need more energy to fuel its growth, and if the already energy-hungry economies do not reduce their own demand for oil, then global demand will continue to rise.
However, working as per the demand-supply mechanism and pondering over the supply side, there have been periodic disruptions in oil-exporting countries like Iraq and Nigeria. Without
106
additional production the only possible outcome is higher prices, especially since alternative fuels like ethanol have quickly become a source of controversy.
To further intensify the inflationary figures, the recent statement by Goldman Sachs stating ‘crude oil prices could surge to $200 a barrel in the next two years, which would be none less than a super spike, considering the fact that within 10 years there has been a 120% increase from $10 to $120 per barrel since 1998’ provides no ray of hope to our economy confronted with the issue of inflation.
Indian economy per se is strong enough to wither almost any economic crisis, given its strong macroeconomic foundations and stable economic situation. The only nemesis which could dig the grave to the collapse of our economy could be the surging oil prices, ruled by global factors, which renders the economy helpless.
On Money Markets and Interest Rates The hinges of growth
The money markets, unlike stock markets, are governed by RBI policies, macro-economic mechanism of demand and supply of money, and to a great extent, the global market forces. Our economy had till the recent past been resilient to the adverse impact of the sub-prime crisis inflicting some of the major world economies.
As the country is confronted by inflation, RBI has played its moves to help the economy. Through its macro- economic tools of Cash Reserve Ratio, Statutory Liquidity Ratio, Repo and Reserve Rates etc, it tried to channelize the liquidity of the entire nation, thereby calibrating growth and attempting to rein in inflation.
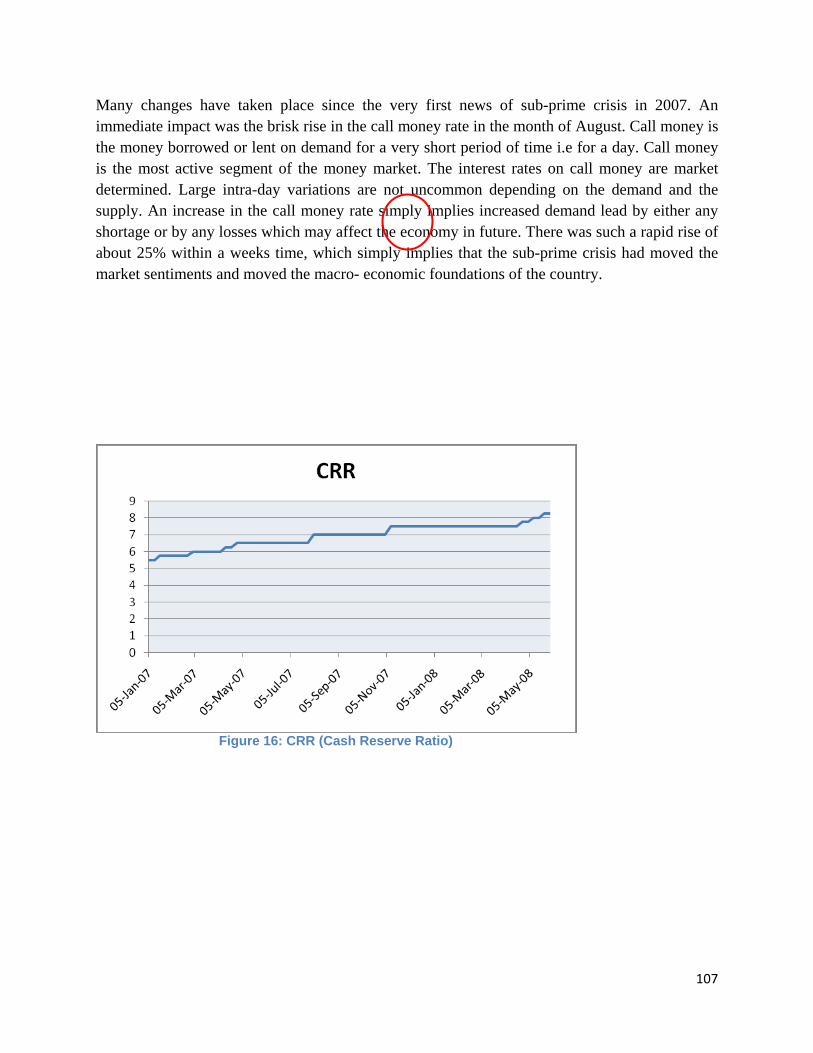
107
Many changes have taken place since the very first news of sub-prime crisis in 2007. An immediate impact was the brisk rise in the call money rate in the month of August. Call money is the money borrowed or lent on demand for a very short period of time i.e for a day. Call money is the most active segment of the money market. The interest rates on call money are market determined. Large intra-day variations are not uncommon depending on the demand and the supply. An increase in the call money rate simply implies increased demand lead by either any shortage or by any losses which may affect the economy in future. There was such a rapid rise of about 25% within a weeks time, which simply implies that the sub-prime crisis had moved the market sentiments and moved the macro- economic foundations of the country.
Figure 16: CRR (Cash Reserve Ratio)

108
Perhaps the RBI had to modify its two very popular tools i.e.Cash Reserve Ratio 14(CRR) and Statutory Liquidity Ratio15 (SLR) to avoid the liquidity crunch which it would have possibly located in the near future. The CRR was increased 10 times since 2007, yet the SLR remained the same.
14 CRR is the mimimum amount of cash that banks have to maintain. It is the percentage of bank reserves to total deposits of the bank. 15 Statutory Liquidity Ratio (SLR) is the amont which a abnk has to maintain in the form of cash, gold or approved securities.
Figure 16: Call Money Borrowing
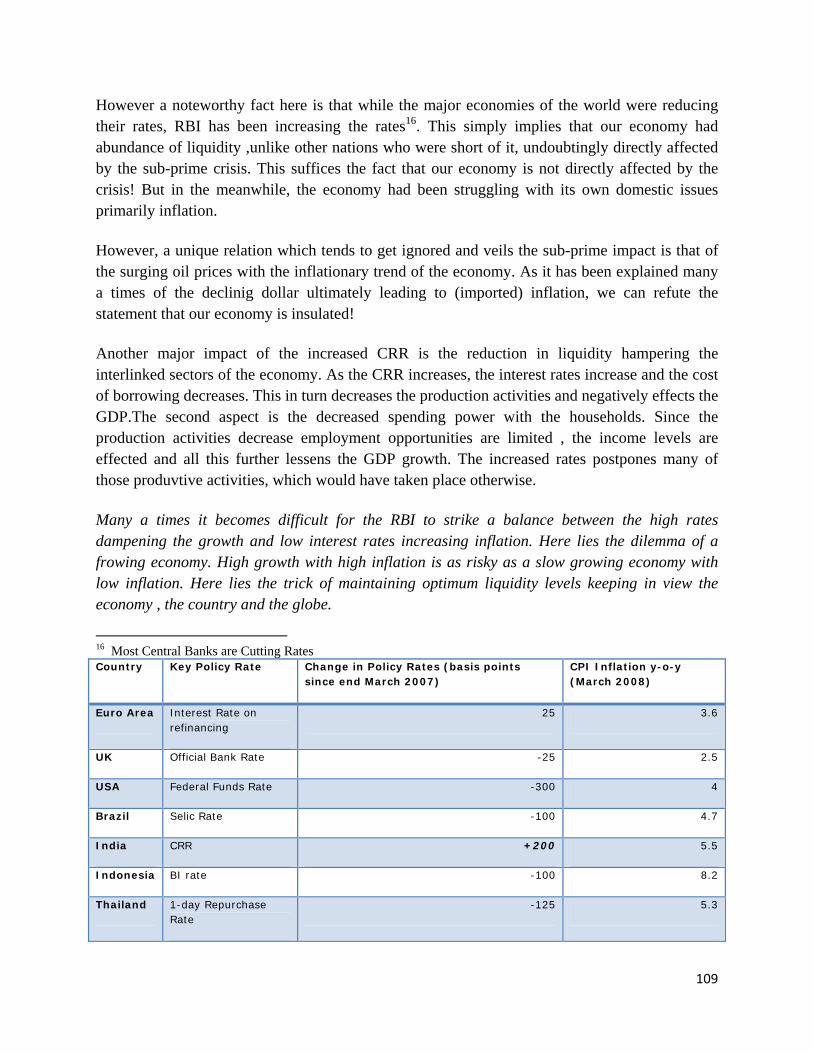
109
However a noteworthy fact here is that while the major economies of the world were reducing their rates, RBI has been increasing the rates16. This simply implies that our economy had abundance of liquidity ,unlike other nations who were short of it, undoubtingly directly affected by the sub-prime crisis. This suffices the fact that our economy is not directly affected by the crisis! But in the meanwhile, the economy had been struggling with its own domestic issues primarily inflation.
However, a unique relation which tends to get ignored and veils the sub-prime impact is that of the surging oil prices with the inflationary trend of the economy. As it has been explained many a times of the declinig dollar ultimately leading to (imported) inflation, we can refute the statement that our economy is insulated!
Another major impact of the increased CRR is the reduction in liquidity hampering the interlinked sectors of the economy. As the CRR increases, the interest rates increase and the cost of borrowing decreases. This in turn decreases the production activities and negatively effects the GDP.The second aspect is the decreased spending power with the households. Since the production activities decrease employment opportunities are limited , the income levels are effected and all this further lessens the GDP growth. The increased rates postpones many of those produvtive activities, which would have taken place otherwise.
Many a times it becomes difficult for the RBI to strike a balance between the high rates dampening the growth and low interest rates increasing inflation. Here lies the dilemma of a frowing economy. High growth with high inflation is as risky as a slow growing economy with low inflation. Here lies the trick of maintaining optimum liquidity levels keeping in view the economy , the country and the globe.
16 Most Central Banks are Cutting Rates Country Key Policy Rate Change in Policy Rates (basis points
since end March 2007) CPI Inflation y-o-y (March 2008)
Euro Area Interest Rate on refinancing
25 3.6
UK Official Bank Rate -25 2.5
USA Federal Funds Rate -300 4
Brazil Selic Rate -100 4.7
India CRR +200 5.5
Indonesia BI rate -100 8.2
Thailand 1-day Repurchase Rate
-125 5.3
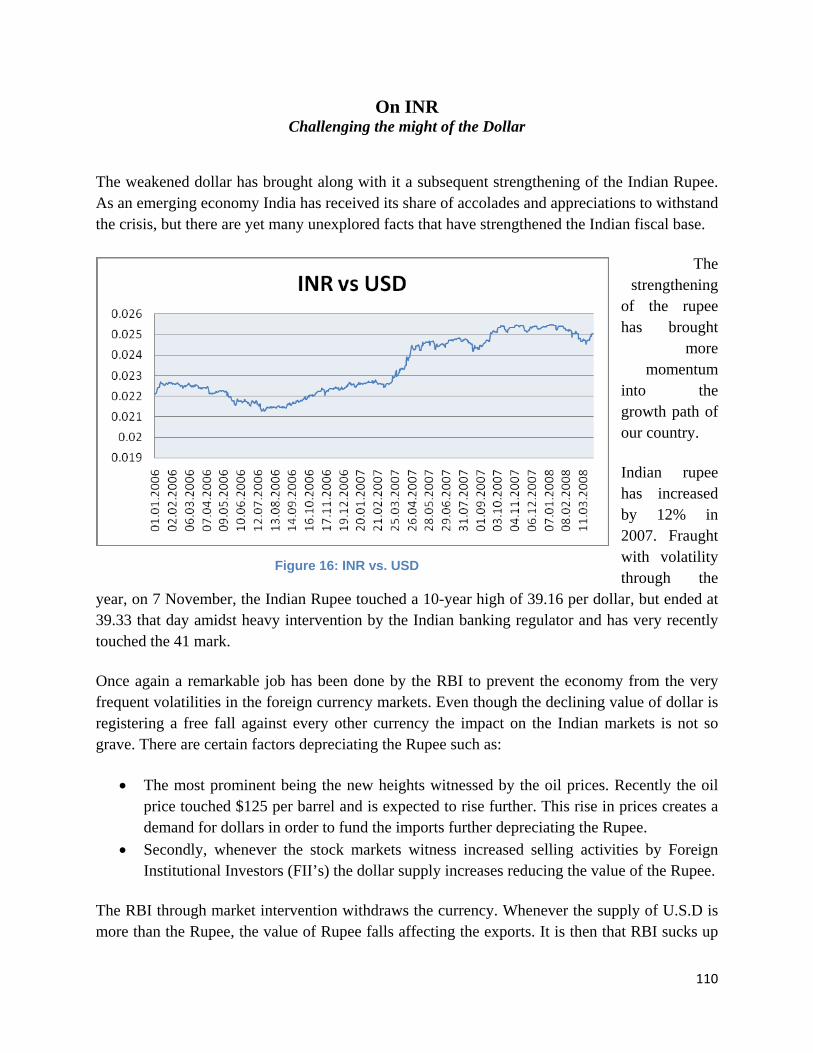
110
On INR Challenging the might of the Dollar
The weakened dollar has brought along with it a subsequent strengthening of the Indian Rupee. As an emerging economy India has received its share of accolades and appreciations to withstand the crisis, but there are yet many unexplored facts that have strengthened the Indian fiscal base.
The strengthening
of the rupee has brought
more momentum
into the growth path of our country.
Indian rupee has increased by 12% in 2007. Fraught with volatility through the
year, on 7 November, the Indian Rupee touched a 10-year high of 39.16 per dollar, but ended at 39.33 that day amidst heavy intervention by the Indian banking regulator and has very recently touched the 41 mark.
Once again a remarkable job has been done by the RBI to prevent the economy from the very frequent volatilities in the foreign currency markets. Even though the declining value of dollar is registering a free fall against every other currency the impact on the Indian markets is not so grave. There are certain factors depreciating the Rupee such as:
• The most prominent being the new heights witnessed by the oil prices. Recently the oil price touched $125 per barrel and is expected to rise further. This rise in prices creates a demand for dollars in order to fund the imports further depreciating the Rupee.
• Secondly, whenever the stock markets witness increased selling activities by Foreign Institutional Investors (FII’s) the dollar supply increases reducing the value of the Rupee.
The RBI through market intervention withdraws the currency. Whenever the supply of U.S.D is more than the Rupee, the value of Rupee falls affecting the exports. It is then that RBI sucks up
Figure 16: INR vs. USD
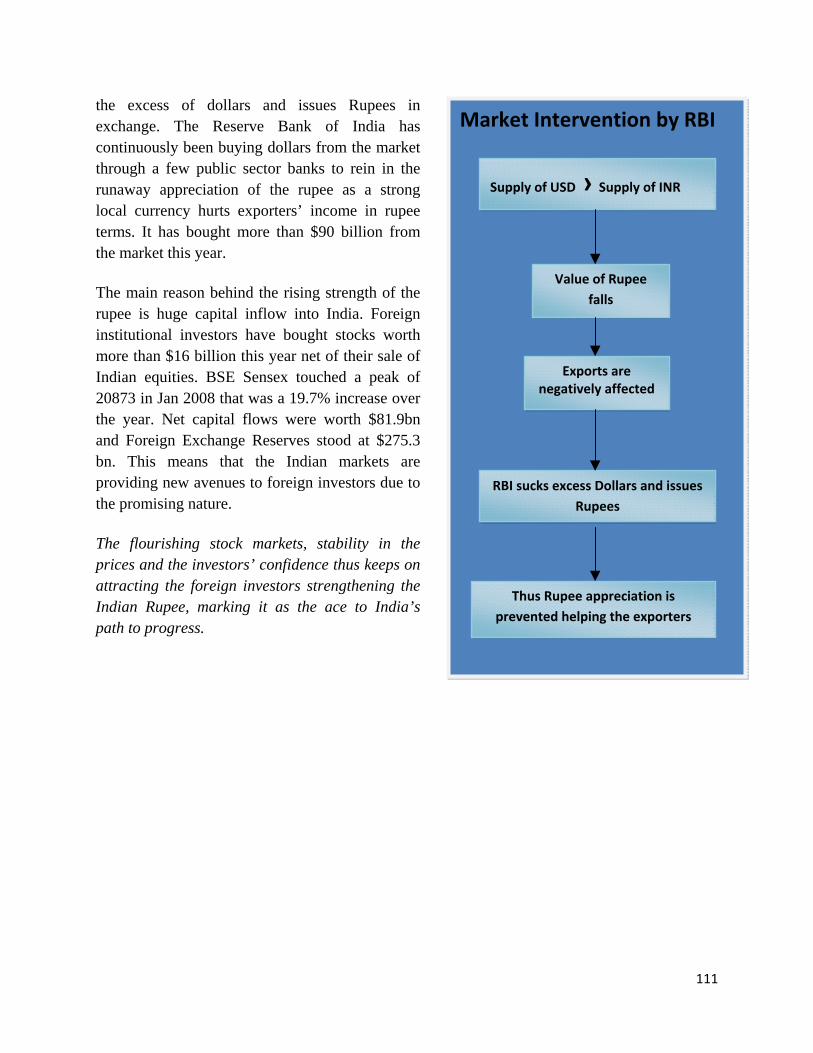
111
the excess of dollars and issues Rupees in exchange. The Reserve Bank of India has continuously been buying dollars from the market through a few public sector banks to rein in the runaway appreciation of the rupee as a strong local currency hurts exporters’ income in rupee terms. It has bought more than $90 billion from the market this year.
The main reason behind the rising strength of the rupee is huge capital inflow into India. Foreign institutional investors have bought stocks worth more than $16 billion this year net of their sale of Indian equities. BSE Sensex touched a peak of 20873 in Jan 2008 that was a 19.7% increase over the year. Net capital flows were worth $81.9bn and Foreign Exchange Reserves stood at $275.3 bn. This means that the Indian markets are providing new avenues to foreign investors due to the promising nature.
The flourishing stock markets, stability in the prices and the investors’ confidence thus keeps on attracting the foreign investors strengthening the Indian Rupee, marking it as the ace to India’s path to progress.
Box 1: Market Intervention by RBI
Market Intervention by RBI
Supply of USD › Supply of INR
RBI sucks excess Dollars and issuesRupees
Value of Rupee falls
Exports are negatively affected
Thus Rupee appreciation is prevented helping the exporters
112
Indian Housing Markets Following the Footsteps
The Indian real estate sector has witnessed a revolution, driven by the booming economy, favorable demographics and liberalized foreign direct investment (FDI) regime. Growing at a scorching 30 per cent, it has emerged as one of the most appealing investment areas for domestic as well as foreign investors. Property prices in India are rising fast, and not just in the biggest cities. As the tech boom spreads across the country, as more Indians buy homes, and as the economy grows at faster than 8% a year, real estate is attracting more investors.
The second largest employing sector in India (including construction and facilities management), real estate is linked to about 250 ancillary industries like cement, brick and steel through backward and forward linkages. Consequently, a unit increase in expenditure in this sector has a multiplier effect and the capacity to generate income as high as five times.
Rising income levels of a growing middle class along with increase in nuclear families, low interest rates, modern attitudes to home ownership (the average age of a new homeowner in 2006 was 32 years compared with 45 years a decade ago) and a change of attitude amongst the young working population from that of 'save and buy' to 'buy and repay' have all combined to boost housing demand.
According to 'Housing Skyline of India 2007-08', there will be demand for over 24.3 million new dwellings for self-living in urban India alone by 2015. Consequently, this segment is likely to throw huge investment opportunities. In fact, an estimated U.S.$ 25 billion investment will be required over the next five years in urban housing, says a report by Merrill Lynch also stating that the Indian realty sector will grow from $12 billion in 2005 to $90 billion by 2015
Prominent global players like Carlyle, Blackstone, Morgan Stanley, Trikona, Warbus Pincus, HSBC Financial Services, Americorp Ventures, Barclays, Merrill Lynch and Citigroup have all already checked into the Indian realty market.
In fact, real estate has been instrumental in India emerging as the top destination in Asia (excluding Japan) in attracting private equity investments during the first ten months of this year. Real estate accounted for 26 per cent of total value of private equity investments, with 32 deals valued at U.S.$ 2.6 billion expecting to pour another U.S.$ 10-20 billion into the sector in the next three years.
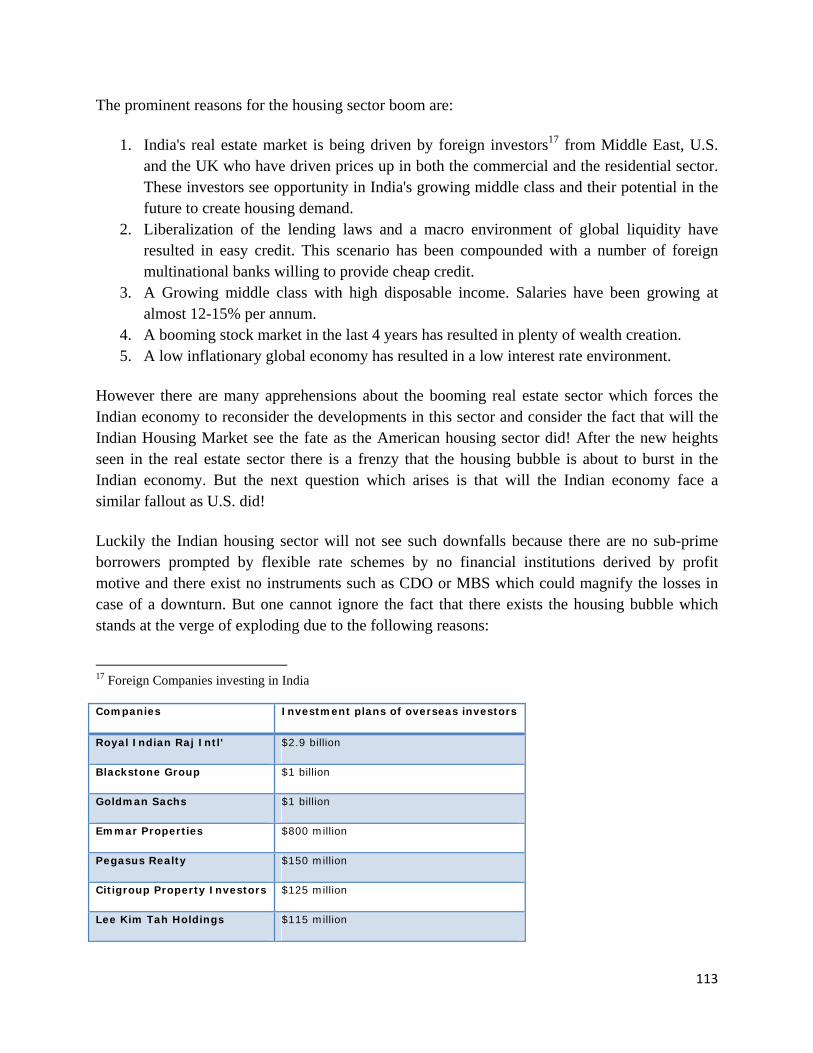
113
The prominent reasons for the housing sector boom are:
1. India's real estate market is being driven by foreign investors17 from Middle East, U.S. and the UK who have driven prices up in both the commercial and the residential sector. These investors see opportunity in India's growing middle class and their potential in the future to create housing demand.
2. Liberalization of the lending laws and a macro environment of global liquidity have resulted in easy credit. This scenario has been compounded with a number of foreign multinational banks willing to provide cheap credit.
3. A Growing middle class with high disposable income. Salaries have been growing at almost 12-15% per annum.
4. A booming stock market in the last 4 years has resulted in plenty of wealth creation. 5. A low inflationary global economy has resulted in a low interest rate environment.
However there are many apprehensions about the booming real estate sector which forces the Indian economy to reconsider the developments in this sector and consider the fact that will the Indian Housing Market see the fate as the American housing sector did! After the new heights seen in the real estate sector there is a frenzy that the housing bubble is about to burst in the Indian economy. But the next question which arises is that will the Indian economy face a similar fallout as U.S. did!
Luckily the Indian housing sector will not see such downfalls because there are no sub-prime borrowers prompted by flexible rate schemes by no financial institutions derived by profit motive and there exist no instruments such as CDO or MBS which could magnify the losses in case of a downturn. But one cannot ignore the fact that there exists the housing bubble which stands at the verge of exploding due to the following reasons:
17 Foreign Companies investing in India Companies Investment plans of overseas investors
Royal Indian Raj Intl' $2.9 billion
Blackstone Group $1 billion
Goldman Sachs $1 billion
Emmar Properties $800 million
Pegasus Realty $150 million
Citigroup Property Investors $125 million
Lee Kim Tah Holdings $115 million
114
1. A global liquidity crisis has forced banks in the U.S. to tighten credit for borrowers. This is resulting in real estate prices to fall in the U.S. If the credit worsens some of the multinational banks in India may need to tighten credit policies in India as well.
2. The prices have reached levels where it is practically unaffordable for the common man to buy any property in decent localities. Although wages have considerably increased, real estate prices are almost out of reach now for the common man in India.
3. Real estate prices are being driven up by speculators, foreign investors and business men who are buying houses purely for investment and not to reside in them.
4. Inflationary indicators are moving up showing signs of a recession in the U.S. or at least slow GDP growth in year 2008. A slowing down of U.S. economy will impact the exports of all the developing countries.
5. The strengthening of the rupee is beginning to hurt exporters in India. If the rupee strengthens further it has a potential to trigger a slide in the Indian stock market.
6. The Reserve Bank of India is taking steps to curb speculation in the Indian Real Estate Market.
A real estate market is never as transparent as the stock market and any such predictions of booms or busts are only speculator in nature. However, the macroeconomic indicators are pointing to a change and the year 2008 will probably make it clear on whether these prices are sustainable.
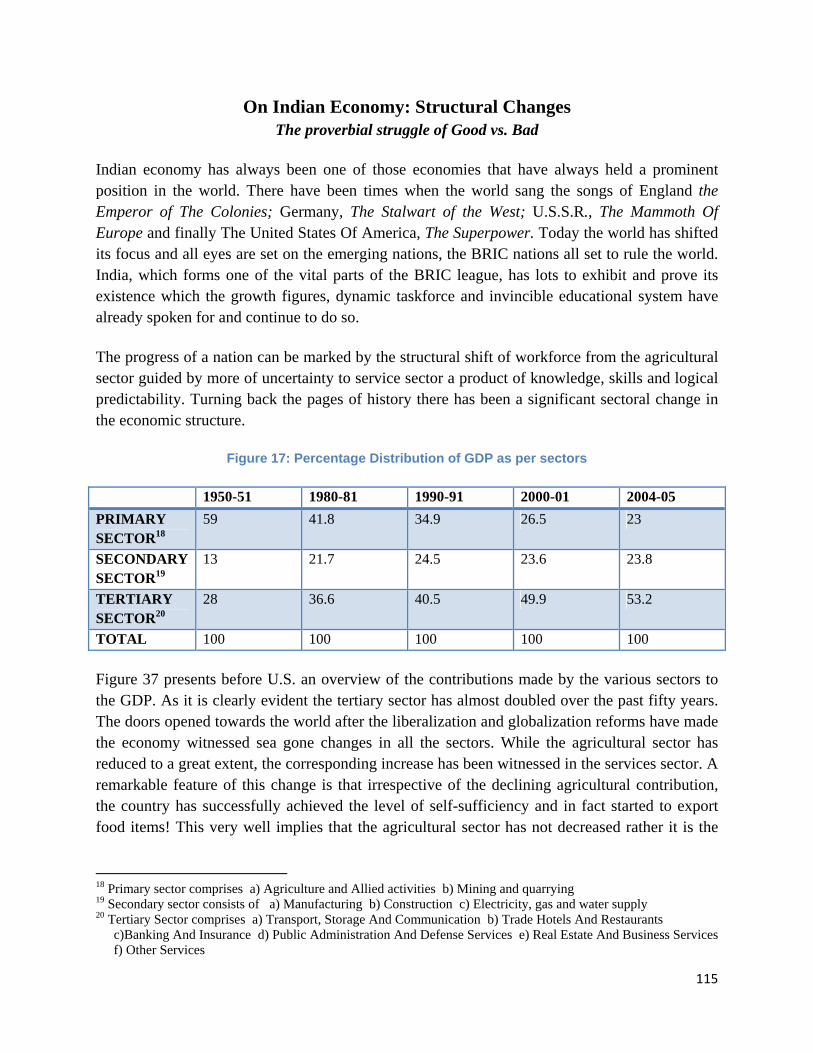
115
On Indian Economy: Structural Changes The proverbial struggle of Good vs. Bad
Indian economy has always been one of those economies that have always held a prominent position in the world. There have been times when the world sang the songs of England the Emperor of The Colonies; Germany, The Stalwart of the West; U.S.S.R., The Mammoth Of Europe and finally The United States Of America, The Superpower. Today the world has shifted its focus and all eyes are set on the emerging nations, the BRIC nations all set to rule the world. India, which forms one of the vital parts of the BRIC league, has lots to exhibit and prove its existence which the growth figures, dynamic taskforce and invincible educational system have already spoken for and continue to do so.
The progress of a nation can be marked by the structural shift of workforce from the agricultural sector guided by more of uncertainty to service sector a product of knowledge, skills and logical predictability. Turning back the pages of history there has been a significant sectoral change in the economic structure.
Figure 17: Percentage Distribution of GDP as per sectors
1950-51 1980-81 1990-91 2000-01 2004-05 PRIMARY SECTOR18
59 41.8 34.9 26.5 23
SECONDARY SECTOR19
13 21.7 24.5 23.6 23.8
TERTIARY SECTOR20
28 36.6 40.5 49.9 53.2
TOTAL 100 100 100 100 100
Figure 37 presents before U.S. an overview of the contributions made by the various sectors to the GDP. As it is clearly evident the tertiary sector has almost doubled over the past fifty years. The doors opened towards the world after the liberalization and globalization reforms have made the economy witnessed sea gone changes in all the sectors. While the agricultural sector has reduced to a great extent, the corresponding increase has been witnessed in the services sector. A remarkable feature of this change is that irrespective of the declining agricultural contribution, the country has successfully achieved the level of self-sufficiency and in fact started to export food items! This very well implies that the agricultural sector has not decreased rather it is the
18 Primary sector comprises a) Agriculture and Allied activities b) Mining and quarrying 19 Secondary sector consists of a) Manufacturing b) Construction c) Electricity, gas and water supply 20 Tertiary Sector comprises a) Transport, Storage And Communication b) Trade Hotels And Restaurants
c)Banking And Insurance d) Public Administration And Defense Services e) Real Estate And Business Services f) Other Services
116
service sector, which has gained momentum and has brought new heights to the growth figures of India.
Shifting our focus to the financial services sector, no doubt we stand at the horizon where the destiny of India is ready to take new leaps in the global arena. The surging stock markets due to consistent investor’s confidence, rising commodities markets due to strong fundamentals governed by macroeconomic policies and the favorable financial ambiance guided by tight rules and regulations have brought the financial system at a stratum never explored or realized.
Still there remains a question that the direction towards which we are headed, does it hold good and really provide U.S. a platform to change the destiny of our conservative economy to rule the world. The term ‘conservative’ is very much controversial. The opening of the Indian cocoon to the mighty world far ahead of U.S. in terms of capital, know-how and technology questions the conservatism of the economy. These hurdles were, however, confidently confronted with which ruled out the notion that we might be blown away with these violent tides. But the contradiction to the above example is the ‘no current-account convertibility’. The RBI has always played the role of the idol, which safeguards the economy through the perils of the outwards world. Conservatism can thus be replaced by risk-averseness.
So when one considers, criticizes or condemns the stringent rules and regulations and tight monetary mechanism limiting the economy to an indefinite exposure to global financial innovations, the sub-prime crisis will continue to present a successful example of efficient financial know how and strokes of monetary success!
Conclusion:
The Indian economy which has been known for her conservative approach towards the global markets has been insulated to a great extent from this crisis which is engulfing the whole wide world in its realms. However the strengthening Indian Rupee, increased investors confidence on Indian Markets all seem to open new door for the country which may lead the country to the path of progress and development.
117
TThhee NNeeww WWoorrlldd OOrrddeerr TThhee rriissee ooff tthhee bbeehheemmootthh
From the stretch of the horizon, to the depth of the sea, Such will be the vigor of this nation that only India shall one see…
-Anonymous
Yet again another crisis unfolded in the world markets, spreading its realm to financial markets across the globe, with a different magnitude, trajectory and consequence this time. The world has always re-adjusted itself into new brackets of growth figures after passing through such scenario. The financial systems and economic frameworks being incidental to the ‘lag effect’ complicate the arrival to a clear conclusion. The mystifying question which has taken the whole world by storm, left economists as well as entrepreneurs baffled, has traders as well as consumers wondering if the subprime crisis will mark the end of the hegemony of The United States of America! After the dotcom bubble, the housing sector was the next big thing! But very soon the housing sector reached its saturation point and there could be no more lucrative ventures in housing constructions. So when this tangible asset got exhausted the next thing to play with were the finances and financial instruments. Does this reversal in the housing trends indicate a major shift in the economic paradigm of this nation! The U.S. economy has over two decades seen such heights, that this fall in the growth has not only been rapid but even steep enough that the recovery may not only be very slow but may even result in further slipping into the steep valley of negative growth.
Today the Indian economy stands at a point, which may change her course in the next few decades. Indian economy since long has been appreciated for its policies, which have protected her from, localized financial mismanagements (in case of East Asian Crisis), overwhelming sectoral growths (as in the case U.S. dotcom bubble), volatile structural changes (as in the case of Housing Market Bubbles) and niftily created instruments (as in the case of Subprime Crisis). Call it conservatism or vigilance; we have emerged largely unscathed out of these fiascos and many minor ones that keep cropping up but have an effect of far lesser magnitude. However the past is never a perfect guide and India’s economy may still feel some after-shocks (if not shocks), yet the magnitude remains to be seen.
118
The Rising Indian Economy: Two Sides of a Coin
There remains a lot unexplored with the Indian economy. It’s lately been gaining a lot of attention for its huge size, surging growth figures, macro-economic fundamentals and an efficiently built financial system. Investor’s confidence remains upbeat and there is a general optimistic outlook towards progress and development. All these factors rule out the fact that Indian economy could fall into a situation of turmoil. However, the penetration of the structural changes deep down the economies is and will remain unknown till long periods of time as is evident from the previous debacles.
There is a very bright ray of optimism that proposes new pursuits of growth and development. Unlike the U.S. housing sector which had reached its saturation point, the Indian housing market is much in its nascent stage where lot remains to be done to provide the people with homes. The flourishing Indian stock markets have always fascinated foreign investors and may continue to do so. The underlying difference being that in the case of India, it is still on the trajectory of growth, whereas in U.S.As case, the growth levels had reached a level of saturation.
“With markets so exciting here, one may ask why invest abroad.”
Richard C. Wastcoat Managing Director, Fidelity Investments International, on India’s prospect as an investment destination.
Considering the present scenario, inspite of all the losses suffered by the Indian banks which figure out tso be minuscule in comparison to the trillions of losses suffered by the financial institutions world wide the economy stands upright and still promises investor confidence who are anxious after this trubulence. The downfall in the U.S. dollar which has appreciated the Indian Rupee appears to provide an impetus to the Indian exports. Moreover, the developing Indian economy has much in its kitty to offer the world, which remains unknown and unexplored to her.
Given below are quotes from some well known market practioners and academics. Almost all of them underline the strength of this economy.
India is a long-term bet with stability ... China is a short-term bet with volatility.
Stefan Krause Head of Sales and Marketing
BMW AG
Now things have changed - many Indians educated and working in America are returning to India because India has changed. India is the new land of opportunities.
119
Bala V Balachandran
Padma Shri awardee Distinguished professor, Kellogg School of Management, Chicago
What's struck me is the energy and restless ambition in India. You can actually, tangibly feel the drive...
Peter Knapp
Executive Creative Director Landor Associates
Because of the dynamism of the (Indian) economy, there is a very optimistic view of the direction of the country.
Lee Howell, World Economic Forum
In the foregone pages we have covered in a fair bit of details on the crisis that the U.S. economy has been facing and the fallouts that could possibly see the U.S. economy getting into recession (though now a new school of thought has emerged that says that the U.S. economy may not actually get into recession but would slowdown, already the probability of recession has been reduced from 90% to 45%). The chances of these hitting India may not be ruled out. Though the effects may be far muted than in U.S. and may be much insignificant, they would eventually reach India, both directly through direct exposures and indirectly through global inter-linkages.
At the end though, India may stand to gain. For one as covered above, India is a strong growth story (RBI’s anti-inflationary steps notwithstanding). As a growing economy India’s demand is concentrated domestically. That means that so long as the central bank and the government concentrate of keeping the buying power with its people, the chances of the economy doing well cannot be questioned. The continuous rate cuts that happen in the U.S.A would make cheap capital available for off take. As the confidence in the economy is still to build up, the chances are that the capital would fly out of the U.S. and seek actively burgeoning markets or the EME’s. India and China figure on the top of that list. With funds flowing into an economy that needs that fuel for growth, the economy is sure get the fillip.
As the economy enters a state of pregnant uneasiness, with unsurely of the fallouts of the crisis and the deliberate slowdown measures taken by the central bank, there remains a space of unpredictable ness and an unknown future. The high commodity price too adds to the cause.
However, as the economic growth trajectory maintains (assuming that the Indian economy growth rate does not go below 8.00%), it is sure that in another three to four decades the Indian economy would overtake the U.S. and the Japanese economy. The de-coupling theory, where in
120
it was said that the EME’s would decouple from the rest of the world and continue on its own trajectory, pulling the world in its wake, had been put to test at the time of subprime debacle. At that time the theory could not stand its ground. But perhaps with the ‘worse’ of the direct impacts out of the way and also with the ‘speculative’ elements laid to rest, the decoupling theory may after all be not just some words on paper.
The coming half a century belongs to India. India as we know is changing. And it is changing fast. Big roads, bigger cars, malls, multiplexes, swanky hotels, expressways, dedicated web technology are all being redefined. The country is accepting this and wants more. The infrastructure is out of breath trying to keep pace with this fast development, the economic systems are totally on an over drive lubricating the growth process and financial systems are in a constant catch-up state. Economic progress is direct function of lot of variables-benign atmosphere for growth, easy credit situation, global stability and positive policy structure. While all these may not be favorable to India at this point, some of these surely are on track at varying degrees of success and therefore it’s just a matter of time before even the rest fall on track.
Goldman Sachs had predicted in their report that the Indian economy would overtake the U.S. by 2050. The U.S. subprime crisis seems to be a trigger to the change in the Indian fortune. It will act as a catalyst that would speed up this process of India emerging. How well the Indian economy uses these fallouts at its advantage and bolsters its growth is yet to be seen!
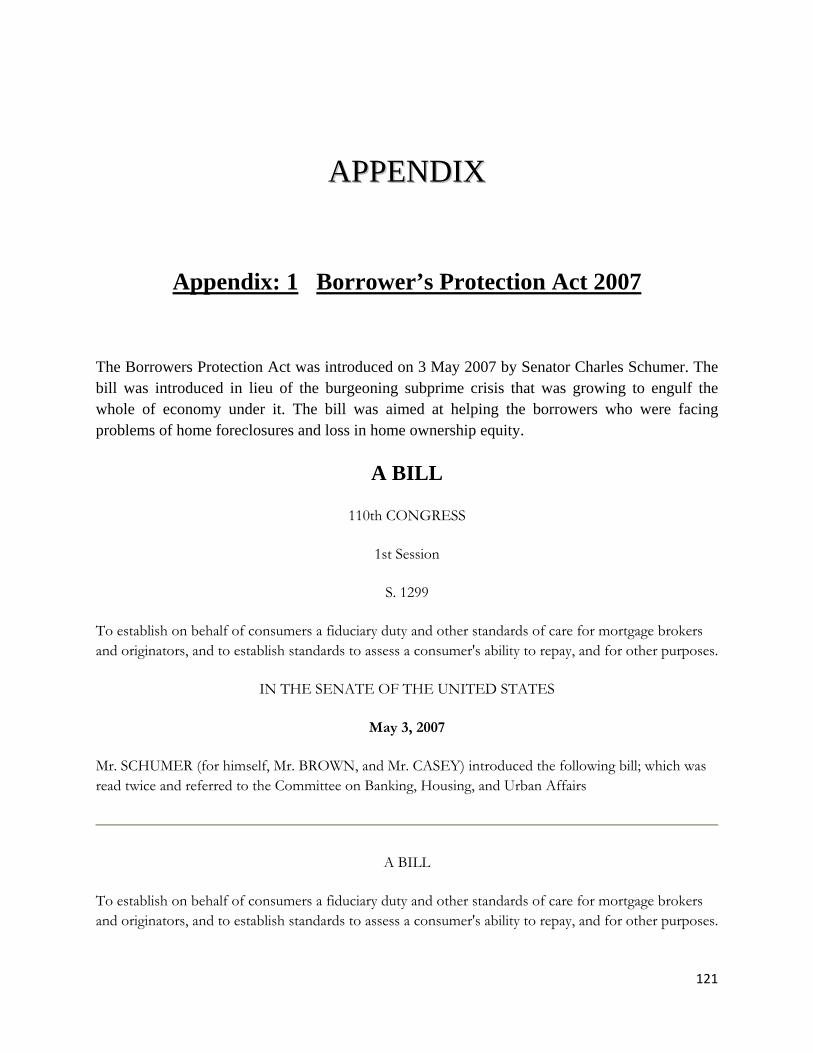
121
AAPPPPEENNDDIIXX
Appendix: 1 Borrower’s Protection Act 2007
The Borrowers Protection Act was introduced on 3 May 2007 by Senator Charles Schumer. The bill was introduced in lieu of the burgeoning subprime crisis that was growing to engulf the whole of economy under it. The bill was aimed at helping the borrowers who were facing problems of home foreclosures and loss in home ownership equity.
A BILL
110th CONGRESS
1st Session
S. 1299
To establish on behalf of consumers a fiduciary duty and other standards of care for mortgage brokers and originators, and to establish standards to assess a consumer's ability to repay, and for other purposes.
IN THE SENATE OF THE UNITED STATES
May 3, 2007
Mr. SCHUMER (for himself, Mr. BROWN, and Mr. CASEY) introduced the following bill; which was read twice and referred to the Committee on Banking, Housing, and Urban Affairs
A BILL
To establish on behalf of consumers a fiduciary duty and other standards of care for mortgage brokers and originators, and to establish standards to assess a consumer's ability to repay, and for other purposes.
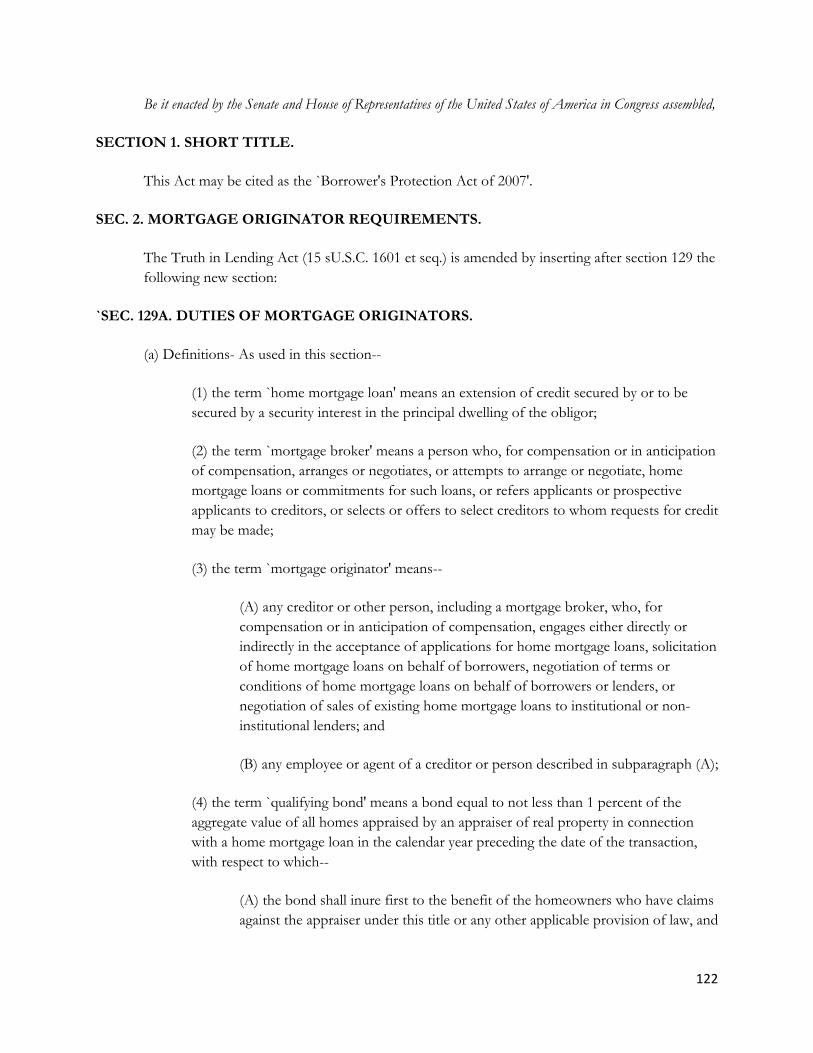
122
Be it enacted by the Senate and House of Representatives of the United States of America in Congress assembled,
SECTION 1. SHORT TITLE.
This Act may be cited as the `Borrower's Protection Act of 2007'.
SEC. 2. MORTGAGE ORIGINATOR REQUIREMENTS.
The Truth in Lending Act (15 sU.S.C. 1601 et seq.) is amended by inserting after section 129 the following new section:
`SEC. 129A. DUTIES OF MORTGAGE ORIGINATORS.
(a) Definitions- As used in this section--
(1) the term `home mortgage loan' means an extension of credit secured by or to be secured by a security interest in the principal dwelling of the obligor;
(2) the term `mortgage broker' means a person who, for compensation or in anticipation of compensation, arranges or negotiates, or attempts to arrange or negotiate, home mortgage loans or commitments for such loans, or refers applicants or prospective applicants to creditors, or selects or offers to select creditors to whom requests for credit may be made;
(3) the term `mortgage originator' means--
(A) any creditor or other person, including a mortgage broker, who, for compensation or in anticipation of compensation, engages either directly or indirectly in the acceptance of applications for home mortgage loans, solicitation of home mortgage loans on behalf of borrowers, negotiation of terms or conditions of home mortgage loans on behalf of borrowers or lenders, or negotiation of sales of existing home mortgage loans to institutional or non-institutional lenders; and
(B) any employee or agent of a creditor or person described in subparagraph (A);
(4) the term `qualifying bond' means a bond equal to not less than 1 percent of the aggregate value of all homes appraised by an appraiser of real property in connection with a home mortgage loan in the calendar year preceding the date of the transaction, with respect to which--
(A) the bond shall inure first to the benefit of the homeowners who have claims against the appraiser under this title or any other applicable provision of law, and
123
second to the benefit of originating creditors that complied with their duty of good faith and fair dealing in accordance with this title; and
(B) any assignee or subsequent transferee or trustee shall be a beneficiary of the bond, only if the originating creditor qualified for such treatment; and
(5) the term `rate spread mortgage transaction' means a home mortgage loan that has an annual percentage rate of interest that equals or exceeds the rate that would require reporting under the Home Mortgage Disclosure Act (12 U.S.C. 2801 et seq.) as a rate spread loan, without regard to whether such loan is otherwise subject to the Home Mortgage Disclosure Act.
(b) Standard of Care-
(1) FIDUCIARY RELATIONSHIP- In the case of a home mortgage loan, the mortgage broker shall be deemed to have a fiduciary relationship with the consumer, and each such mortgage broker shall be subject to all requirements for fiduciaries otherwise applicable under State or Federal law.
(2) FAIR DEALING- Each mortgage originator shall, in addition to the duties imposed by otherwise applicable provisions of State or Federal law, with respect to each home mortgage loan in which the mortgage originator is involved--
(A) act with reasonable skill, care, and diligence; and
(B) act in good faith and with fair dealing in any transaction, practice, or course of business associated with the transaction.
(c) Assessment of Ability to Repay-
(1) IN GENERAL- Each mortgage originator shall, before entering into or otherwise facilitating any home mortgage loan, verify the reasonable ability of the borrower to pay the principal and interest on the loan, and any real estate taxes and homeowners insurance fees and premiums.
(2) VARIABLE MORTGAGE RATES- In the case of a home mortgage loan with respect to which the applicable rate of interest may vary, for purposes of paragraph (1), the ability to pay shall be determined based on the maximum possible monthly payment that could be due from the borrower during the first 7 years of the loan term, which amount shall be calculated by--
(A) U.S.ing the maximum interest rate allowable under the loan; and
124
(B) assuming no default by the borrower, a repayment schedule which achieves full amortization over the life of the loan.
(3) REQUIRED VERIFICATION DOCUMENTS-
(A) IN GENERAL- For purposes of paragraph (1), a mortgage originator shall base a determination of the ability to pay on--
i) documentation of the income and financial resources of the borrower, including tax returns, payroll receipts, bank records, or other similarly reliable documents; and
ii) the debt-to-income ratio and residual income of the borrower, as determined under section 36.4337 of title 38 of the Code of Federal Regulations, or any successor thereto.
(B) LIMITATION- A statement provided by the borrower of the income and financial resources of the borrower, without other documentation referred to in this paragraph, is not sufficient verification for purposes of assessing the ability of the consumer to pay.
(d) Rate Spread Mortgages-
(1) ESCROW ACCOUNT REQUIRED- In the case of a rate spread mortgage transaction, the obligor shall be required to make monthly payments into an escrow account established by the mortgage originator for the purpose of paying taxes, hazard insurance premiums, and, if applicable, flood insurance premiums.
(2) EXCEPTION- This paragraph does not apply in any case in which the mortgage originator reasonably believes that, following the loan closing, the obligor will be required, or will continue to be required, to make escrow payments described in paragraph (1) on the property securing the loan in connection with another loan secured by the same property.
(3) LENDER AND BROKER LIABILITY- In any case in which a mortgage broker sells or delivers a rate spread mortgage loan to a lender, the lender shall be liable for the acts, omissions, and representations made by the mortgage broker in connection with that mortgage loan.
(e) Steering Prohibited-
(1) IN GENERAL- In connection with a home mortgage loan, a mortgage originator may not steer, counsel, or direct a consumer to rates, charges, principal amount, or prepayment terms that are not reasonably advantageous to the consumer, in light of all
125
of the circumstances associated with the transaction, including the characteristics of the property that secures or will secure the extension of credit and the loan terms for which the consumer qualifies.
(2) DUTIES TO CONSUMERS- If unable to suggest, offer, or recommend to a consumer a reasonably advantageous home loan, a mortgage originator shall--
(A) based on the information reasonably available and U.S.ing the skill, care, and diligence reasonably expected for a mortgage originator, originate or otherwise facilitate a reasonably advantageous home mortgage loan by another creditor to a consumer, if permitted by and in accordance with all otherwise applicable law; or
(B) disclose to a consumer--
(i) that the creditor does not offer a home mortgage loan that would be reasonably advantageous to a consumer, but that other creditors may offer such a loan; and
(ii) the reasons that the products and services offered by the mortgage originator are not available to or reasonably advantageous for the consumer.
(3) PROHIBITED CONDUCT- In connection with a home mortgage loan, a mortgage originator may not--
(A) mischaracterize the credit history of a consumer or the home loans available to a consumer;
(B) mischaracterize or suborn mischaracterization of the appraised value of the property securing the extension of credit; or
(C) if unable to suggest, offer, or recommend to a consumer a reasonably advantageous home mortgage loan, discourage a consumer from seeking a home mortgage loan from another creditor or with another mortgage originator.
(4) RULE OF CONSTRUCTION- Nothing in this subsection shall be deemed to prohibit a mortgage originator from providing a consumer with accurate, unbiased, general information about home mortgage loans, underwriting standards, ways to improve credit history, or any other matter relevant to a consumer.
(f) Good Faith and Fair Dealing in Appraisal Process-
126
(1) IN GENERAL- No mortgage originator may enter into a home mortgage loan with respect to which the mortgage originator has reason to believe that, with respect to the appraisal of the value of the property securing the loan--
(A) the appraiser failed to act in good faith and fair dealing with respect to the consumer in connection with the appraisal;
(B) the appraisal was conducted other than in accordance with all applicable State and Federal standards required of certified appraisers, or was otherwise not accurate and reasonable;
(C) the appraiser had a direct or indirect interest in the property or the transaction;
(D) the appraiser charged, sought, or received compensation for the appraisal, and the appraisal was not covered by a qualifying bond; or
(E) the appraisal order or any other communication in any form includes the requested loan amount or any estimate of value for the property to serve as collateral, either express or implied.
(2) PROHIBITED INFLUENCE- No mortgage originator may, with respect to a home mortgage loan, in any way--
(A) seek to influence an appraiser or otherwise to encourage a targeted value in order to facilitate the making or pricing of the home mortgage loan; or
(B) select an appraiser on the basis of an expectation that such appraiser would provide a targeted value in order to facilitate the making or pricing of the home mortgage loan.
(3) LIMITATION ON DEFENSES- It shall not be a defense to enforcement of the requirements of this subsection that the mortgage originator U.S.ed another person in the appraisal process or to review the appraisal process.
(4) NOTICE OF APPRAISAL- In any case in which an appraisal is performed in connection with a home mortgage loan, the mortgage originator shall provide a copy of the appraisal report to an applicant for a home mortgage loan, whether credit is granted, denied, or the application was withdrawn.'.
SEC. 3. CONFORMING AND CLERICAL AMENDMENTS.
The Truth in Lending Act (15 U.S.C. 1601 et seq.) is amended--
127
(1) in section 103(u) (15 U.S.C. 1602(u)), by striking `disclosures required by section 129(a)' and inserting `provisions of section 129 and 129A';
(2) in section 130 (15 U.S.C. 1640) by inserting `or 129A' after `section 129' each place that term appears; and
(3) in the table of sections for chapter 2 (15 U.S.C. 1631 et seq.), by inserting after the item relating to section 129 the following:
`129A. Duties of mortgage originators.
128
Appendix 2: Beige Book
(Summary of Commentary on Current Economic Conditions by Federal Reserve District)
The Summary of Commentary on Current Economic Conditions by Federal Reserve District, or Beige Book, comprises anecdotal and discussion-based summaries of regional economic activities and provides the first chance to investors to see how the Fed draws logical and intuitive conclusions from the raw data presented in other indicator releases. This report is published eight times per year i.e. two Wednesdays before every Federal Open Market Committee (FOMC) meeting.
Each Federal Reserve Bank gathers anecdotal information on current economic conditions in its District through reports from Bank and Branch directors and interviews with key business contacts, economists, market experts, and other sources. The Beige Book summarizes this information by District and sector. An overall summary of the twelve district reports is prepared by a designated Federal Reserve Bank on a rotating basis.
This gives the investors to see and understand how the Fed draws logical and intuitive conclusions from the raw data presented in other indicator releases.
Strengths:
• Contains forward-looking comments - the Fed districts aim to draw relative conclusions in the Beige Book, not just regurgitate facts already presented
• Gives investors a "man on the street" perspective of economic health by taking first-hand accounts from business owners, economist, and the like
• Aims to put pieces from different reports together into an explanatory whole, giving qualitative measurements instead of quantitative figures
• It's the only indicator that gives reports by geographic region, rather than just by industry group or sector.
• Most regions will report on the state of the service industries, an area not well covered in other indicator reports, although it is a large component of real gross domestic product.
Weaknesses:
• Rarely is any new statistical data presented, only anecdotal reports • Filled with measured "Fed-speak" • Specific industry conclusions are hard to draw from the report.
129
• Each Fed district can use its discretion on what to include in its report; one region may discuss manufacturing activity while others don't report on the topic.
• Private forecasts compiled by economists and analysts tend to closely match what is reported in the Beige Book, so estimates rarely change following the release.
The Beige Book is not likely to send shock waves through the market on its release, but it provides an original point of view about economic activity and is a marked departure from the dry raw data releases of the other indicators. It also gives investors insight into how the Fed approaches its monetary policy decisions and responsibilities.
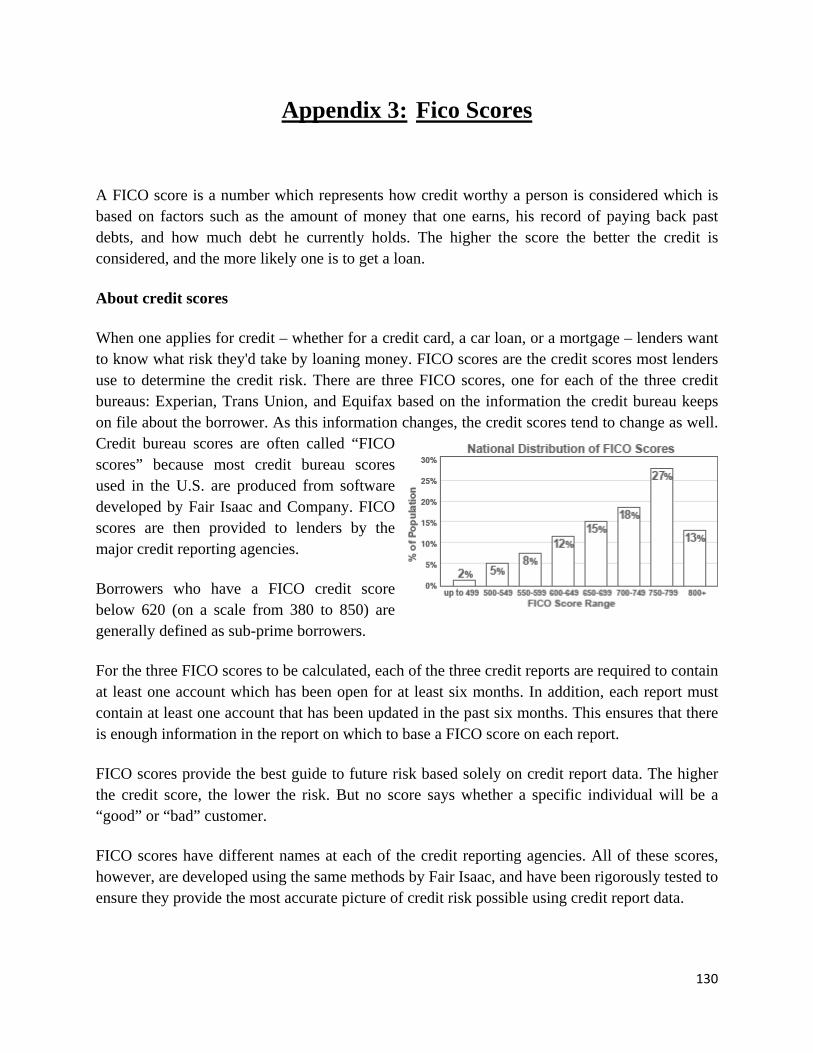
130
Appendix 3: Fico Scores
A FICO score is a number which represents how credit worthy a person is considered which is based on factors such as the amount of money that one earns, his record of paying back past debts, and how much debt he currently holds. The higher the score the better the credit is considered, and the more likely one is to get a loan.
About credit scores
When one applies for credit – whether for a credit card, a car loan, or a mortgage – lenders want to know what risk they'd take by loaning money. FICO scores are the credit scores most lenders use to determine the credit risk. There are three FICO scores, one for each of the three credit bureaus: Experian, Trans Union, and Equifax based on the information the credit bureau keeps on file about the borrower. As this information changes, the credit scores tend to change as well. Credit bureau scores are often called “FICO scores” because most credit bureau scores used in the U.S. are produced from software developed by Fair Isaac and Company. FICO scores are then provided to lenders by the major credit reporting agencies.
Borrowers who have a FICO credit score below 620 (on a scale from 380 to 850) are generally defined as sub-prime borrowers.
For the three FICO scores to be calculated, each of the three credit reports are required to contain at least one account which has been open for at least six months. In addition, each report must contain at least one account that has been updated in the past six months. This ensures that there is enough information in the report on which to base a FICO score on each report.
FICO scores provide the best guide to future risk based solely on credit report data. The higher the credit score, the lower the risk. But no score says whether a specific individual will be a “good” or “bad” customer.
FICO scores have different names at each of the credit reporting agencies. All of these scores, however, are developed using the same methods by Fair Isaac, and have been rigorously tested to ensure they provide the most accurate picture of credit risk possible using credit report data.
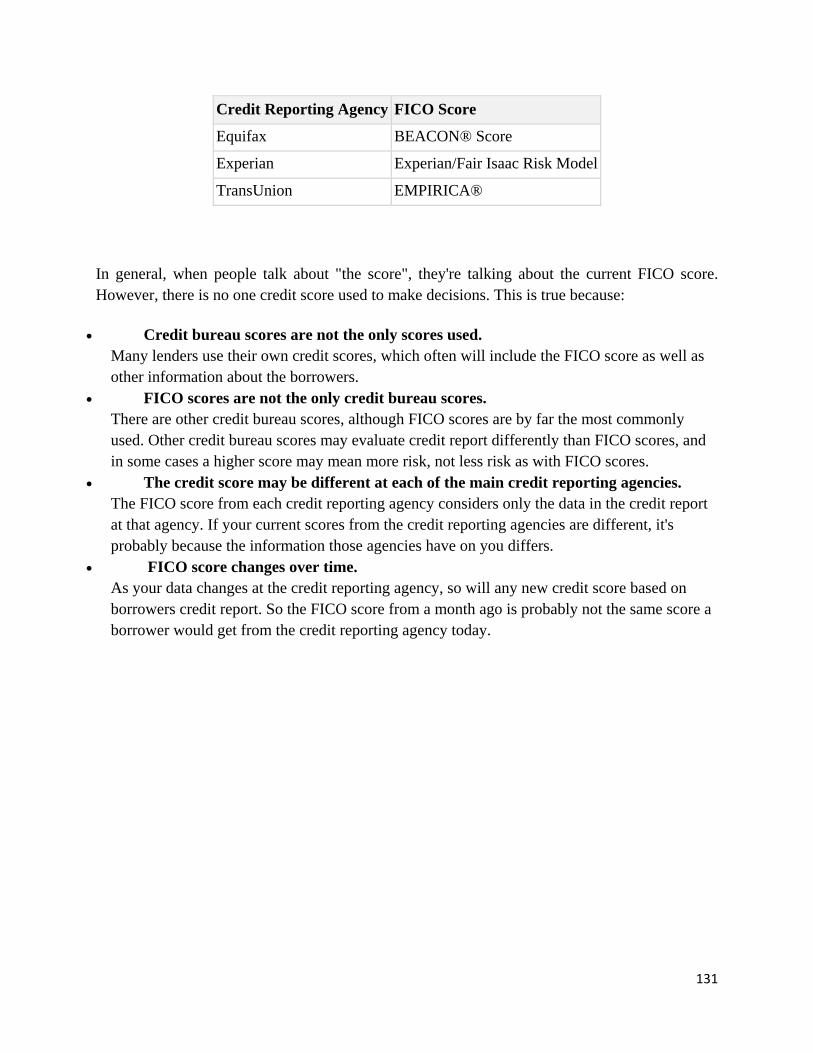
131
Credit Reporting Agency FICO Score
Equifax BEACON® Score
Experian Experian/Fair Isaac Risk Model
TransUnion EMPIRICA®
In general, when people talk about "the score", they're talking about the current FICO score. However, there is no one credit score used to make decisions. This is true because:
• Credit bureau scores are not the only scores used. Many lenders use their own credit scores, which often will include the FICO score as well as other information about the borrowers.
• FICO scores are not the only credit bureau scores. There are other credit bureau scores, although FICO scores are by far the most commonly used. Other credit bureau scores may evaluate credit report differently than FICO scores, and in some cases a higher score may mean more risk, not less risk as with FICO scores.
• The credit score may be different at each of the main credit reporting agencies. The FICO score from each credit reporting agency considers only the data in the credit report at that agency. If your current scores from the credit reporting agencies are different, it's probably because the information those agencies have on you differs.
• FICO score changes over time. As your data changes at the credit reporting agency, so will any new credit score based on borrowers credit report. So the FICO score from a month ago is probably not the same score a borrower would get from the credit reporting agency today.
132
Appendix 4: Role of Freddie Mac & Fannie Mae
The Federal National Mortgage Association (FNMA) commonly known as Fannie Mae is known to be a government sponsored enterprise (GSE), which is a shareholder-owned corporation authorized to make loans and loan guarantees. However in 1968, it was converted into a private corporation and ceased to be the guarantor of government issued mortgages. (This responsibility was transferred to Government National Mortgage Association (Ginnie Mae)). The Federal Home Loan Mortgage Corporation commonly known as Freddie Mac, like Fannie Mae is also authorized to make loans and loan guarantees
Fannie Mae and Freddie Mac purchased the various subprime and Alt-A mortgages. Presently they are in possession of more than 80% of all mortgages bought by investors in the first quarter of this year. After purchasing the mortgages it either held them in its own portfolio or sold them to the investors. Thus Fannie Mae and Freddie Mac did not directly lend to the home buyers. Rather they bought mortgages from banks and other lenders and thereby provided fresh capital for home loans. The companies kept some of the mortgages they bought, hoping to earn profit from them and sold the rest to the investors with the guarantee to pay off the loan if the borrower defaulted.
Because of the widespread perception that the government would intervene if either company failed, they borrowed money at low interest rates than their competitors. As a result they earned enormous profits that enriched shareholders and managers alike. From 1990 to 2000, each company’s stock grew more than 500% and its top executives earned tens of millions of dollars. However, after the arrival of competitors in this business threatened their profits and later on it was discovered that these companies had manipulated their profits. To keep the profits aloft the companies began buying huge numbers of subprime and Alt-A mortgages. By the end of last year the companies had invested or guaranteed in $717 billion of subprime and Alt-A loans. When the housing bubble burst, the companies revealed a $6 billion combined loss and the stock prices fell more than 25% in two weeks.
Thus both these organizations acted as a cushion against any losses. Investors always had this perception that they always earn returns because of the government backing on these loans (up to the limit of $730,000 against previous $417,000).
At the end of 2007, Fannie Mae held mortgages as investments worth $724 billion and had a core capital comprising retained earnings and capital from shareholders worth $45billion. If the assets declined because of foreclosures the company’s core capital will decline in order to cover up these losses. Besides this, the company held guaranteed mortgages as liabilities worth $2.1
133
trillion, which were guaranteed by the company. If the borrower failed to repay the mortgages, Fannie had to make up the differences, which had to be funded from the core capital. As per the laws, it was necessary that core capital was 3% of the assets. So if Fannie Mae U.S.ed the core capital to repay the mortgages reducing its core capital, the government would take over the company and would become responsible for the liabilities, which stood at $796 billion.
In any case, the investors were confident due to the government backing that they shall not have to suffer any losses.
134
Appendix 5: Housing Market Correction and Bursting Of Housing Bubble
A housing market correction is a market correction or "bubble bursting" of a housing bubble; that started in 2005. A real estate bubble is a type of economic bubble that occurs periodically in local or global real estate markets. A housing bubble is characterized by rapid increases in the valuations of real property such as housing until unsustainable levels are reached relative to incomes, price-to-rent ratios, and other economic indicators of affordability. This in turn is followed by a market correction in which decreases in home prices can result in many owners holding negative equity and a mortgage debt higher than the value of the property.
Appendix 6: Asian Currency Crisis
The East Asian Financial Crisis was a period of financial crisis that gripped much of Asia beginning in the summer of (July) 1997 and raised fears of a worldwide economic meltdown (financial contagion). Until 1997, Asia attracted almost half of the total capital inflow to developing countries. The economies of Southeast Asia in particular maintained high interest rates attractive to foreign investors looking for a high rate of return. As a result the region's economies received a large inflow of money and experienced a dramatic run-up in asset prices. At the same time, the regional economies of Thailand, Malaysia, Indonesia, the Philippines, Singapore, and South Korea experienced high growth rates, 8-12% GDP, in the late 1980s and early 1990s. This achievement was widely acclaimed by financial institutions including the IMF and World Bank.
The crisis started in Thailand with the financial collapse of the Thai baht caused by the decision of the Thai government to float the baht, cutting its peg to the USD, after exhaustive efforts to support it in the face of a severe financial overextension that was in part real estate driven. Thailand's economy developed into a bubble fueled by "hot money". More and more was required as the size of the bubble grew. The same type of situation happened in Malaysia. At the time of the mid-1990s, Thailand, Indonesia and South Korea had large private current account deficits and the maintenance of fixed exchange rates encouraged external borrowing and led to excessive exposure to foreign exchange risk in both the financial and corporate sectors.
As the U.S. economy recovered from a recession in the early 1990s, the U.S. Federal Reserve Bank under Alan Greenspan began to raise U.S. interest rates to head off inflation. This made the U.S. a more attractive investment destination relative to Southeast Asia, which had attracted hot money flows through high short-term interest rates, and raised the value of the U.S. dollar, to which many Southeast Asian nations' currencies were pegged, thus making their exports less
135
competitive. At the same time, Southeast Asia's export growth slowed dramatically in the spring of 1996, deteriorating their current account position. Many economists believe that the Asian crisis was created not by market psychology or technology, but by policies that distorted incentives within the lender-borrower relationship. The resulting large quantities of credit that became available generated a highly-leveraged economic climate, and pushed up asset prices to an unsustainable level. These asset prices eventually began to collapse, causing individuals and companies to default on debt obligations. The resulting panic among lenders led to a large withdrawal of credit from the crisis countries, causing a credit crunch and further bankruptcies.
In addition, as investors attempted to withdraw their money, the exchange market was flooded with the currencies of the crisis countries, putting depreciative pressure on their exchange rates. In order to prevent a collapse of the currency values, these countries' governments were forced to raise domestic interest rates to exceedingly high levels (to help diminish the flight of capital by making lending to that country relatively more attractive to investors) and to intervene in the exchange market, buying up any excess domestic currency at the fixed exchange rate with foreign reserves. The resulting depreciated value of those currencies meant that foreign currency-denominated liabilities grew substantially in domestic currency terms, causing more bankruptcies and further deepening the crisis.
After the Asian crisis, international investors were reluctant to lend to developing countries, leading to economic slowdowns in developing countries in many parts of the world. The powerful negative shock also sharply reduced the price of oil, which reached a low of $8 per barrel towards the end of 1998, causing a financial pinch in OPEC nations and other oil exporters. Such sharply reduced oil revenue in turn contributed to the Russian financial crisis in 1998.
Appendix 7: Russian Debt Crisis
The Russian financial crisis (also called "Ruble crisis") hit Russia on 17 August 1998. It was exacerbated by the global recession of 1998, which started with the Asian financial crisis in July 1997. Given the ensuing decline in world commodity prices, countries heavily dependent on the export of raw materials, such as oil, were among those most severely hit. (Petroleum, natural gas, metals, and timber accounted for more than 80% of Russian exports, leaving the country vulnerable to swings in world prices. Oil was also a major source of government tax revenue.) The sharp decline in the price of oil had severe consequences for Russia. However, the primary cause of the Russian Financial Crisis was not the fall of oil prices directly, but the result of non-payment of taxes by the energy and manufacturing industries
136
Appendix 8: Long-Term Capital Management
Long-Term Capital Management (LTCM) was a hedge fund founded in 1994 by John Meriwether (the former vice-chairman and head of bond trading at Salomon Brothers). Board of director’s members included Myron Scholes and Robert C. Merton, who shared the 1997 Nobel Memorial Prize in Economics. Initially enormously successful with annualized returns of over 40% in its first years, in 1998 it lost $4.6 billion in less than four months and became a prominent example of the risk potential in the hedge fund industry. The fund folded in early 2000.
The company had developed complex mathematical models to take advantage of fixed income arbitrage deals (termed convergence trades) U.S.ually with U.S., Japanese, and European government bonds. The basic idea was that over time the value of long-dated bonds issued a short time apart would tend to become identical. However, the rate at which these bonds approached this price would be different, and more heavily traded bonds such as U.S. Treasury bonds would approach the long term price more quickly than less heavily traded and less liquid bonds.
Thus, by a series of financial transactions (essentially amounting to buying the cheaper 'off-the-run' bond and short selling the more expensive, but more liquid, 'on-the-run' bond), it would be possible to make a profit as the difference in the value of the bonds narrowed when a new bond came on run.
As LTCM's capital base grew, they felt pressed to invest that capital somewhere and had run out of good bond-arbitrage bets. This led LTCM to undertake trading strategies outside their expertise. Although these trading strategies were non-market directional, i.e. they were not dependent on overall interest rates or stock prices going up (or down), they were not convergence trades as such. By 1998, LTCM had extremely large positions in areas such as merger arbitrage and S&P 500 options.
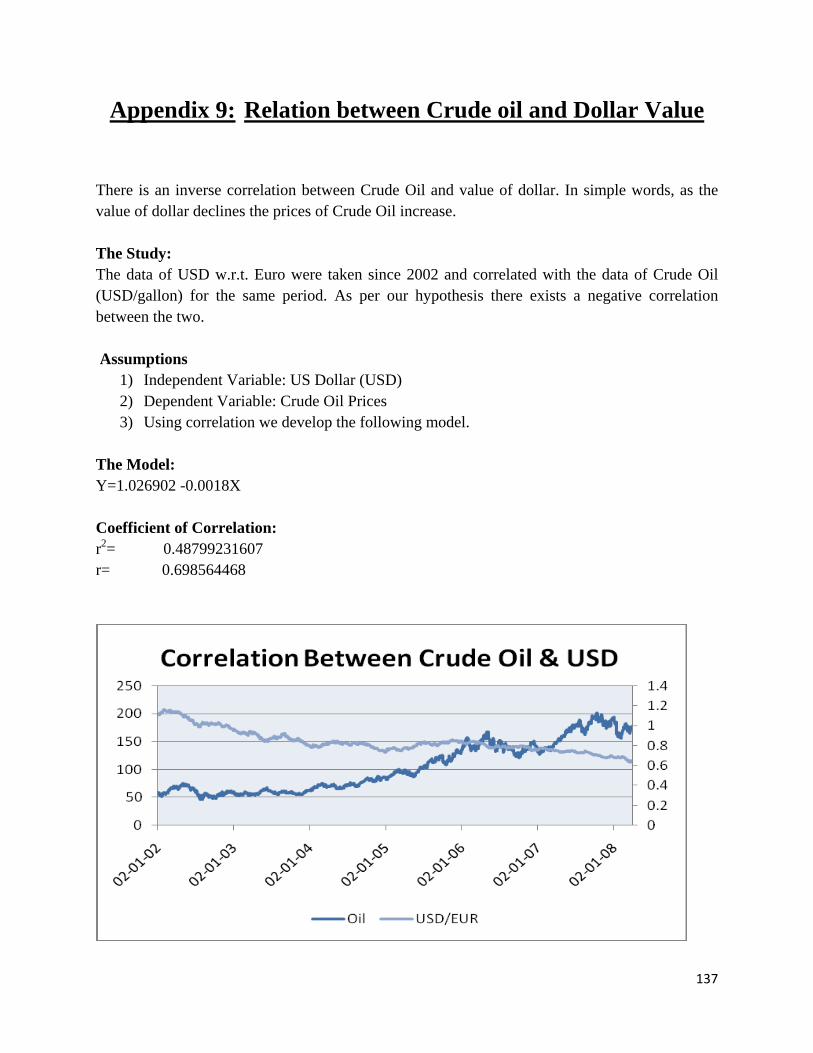
137
Appendix 9: Relation between Crude oil and Dollar Value
There is an inverse correlation between Crude Oil and value of dollar. In simple words, as the value of dollar declines the prices of Crude Oil increase. The Study: The data of USD w.r.t. Euro were taken since 2002 and correlated with the data of Crude Oil (USD/gallon) for the same period. As per our hypothesis there exists a negative correlation between the two. Assumptions
1) Independent Variable: US Dollar (USD) 2) Dependent Variable: Crude Oil Prices 3) Using correlation we develop the following model.
The Model: Y=1.026902 -0.0018X Coefficient of Correlation: r2= 0.48799231607 r= 0.698564468
138
Crude oil prices and value of dollar bear a negative relationship. The depreciation of dollar implies a loss in its value in comparison to other currencies. In simple words we can say that dollar can buy fewer foreign goods as it could previously. When the value of dollar declines the amount of crude oil which could be purchased initially, would not remain the same and more amounts will have to be paid. This implies that crude oil becomes expensive when the value of dollar declines. Thus our hypothesis holds good.
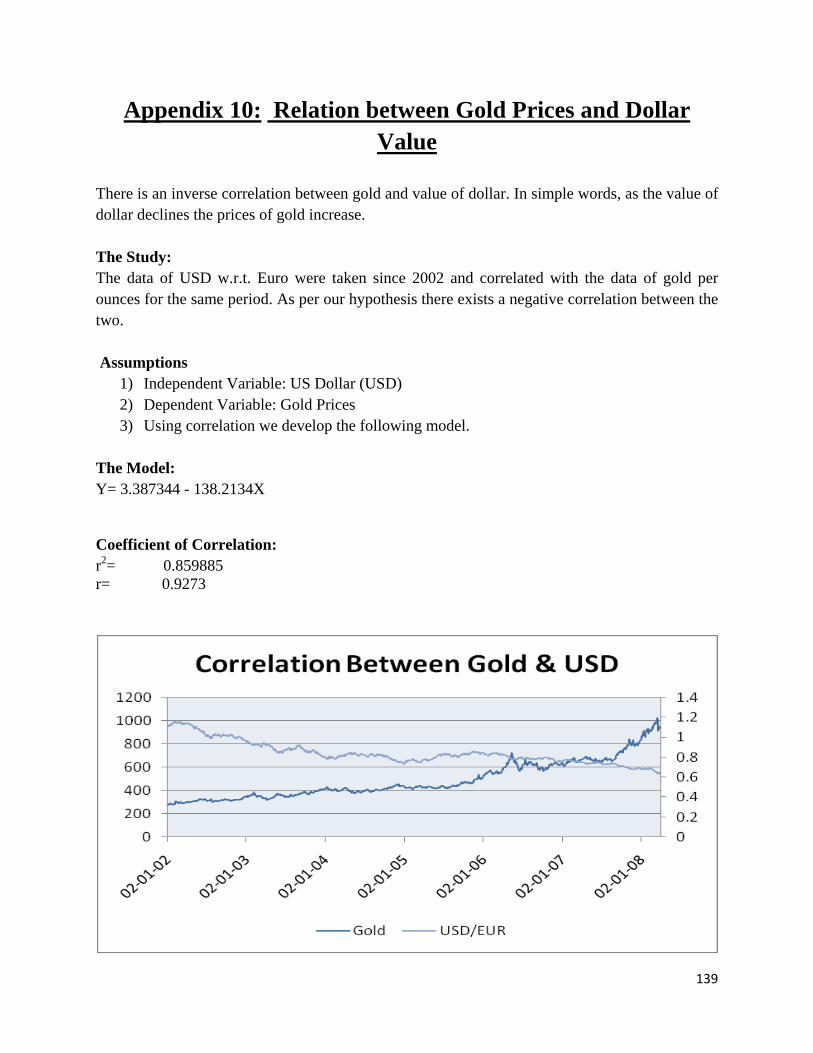
139
Appendix 10: Relation between Gold Prices and Dollar Value
There is an inverse correlation between gold and value of dollar. In simple words, as the value of dollar declines the prices of gold increase. The Study: The data of USD w.r.t. Euro were taken since 2002 and correlated with the data of gold per ounces for the same period. As per our hypothesis there exists a negative correlation between the two. Assumptions
1) Independent Variable: US Dollar (USD) 2) Dependent Variable: Gold Prices 3) Using correlation we develop the following model.
The Model: Y= 3.387344 - 138.2134X
Coefficient of Correlation: r2= 0.859885 r= 0.9273
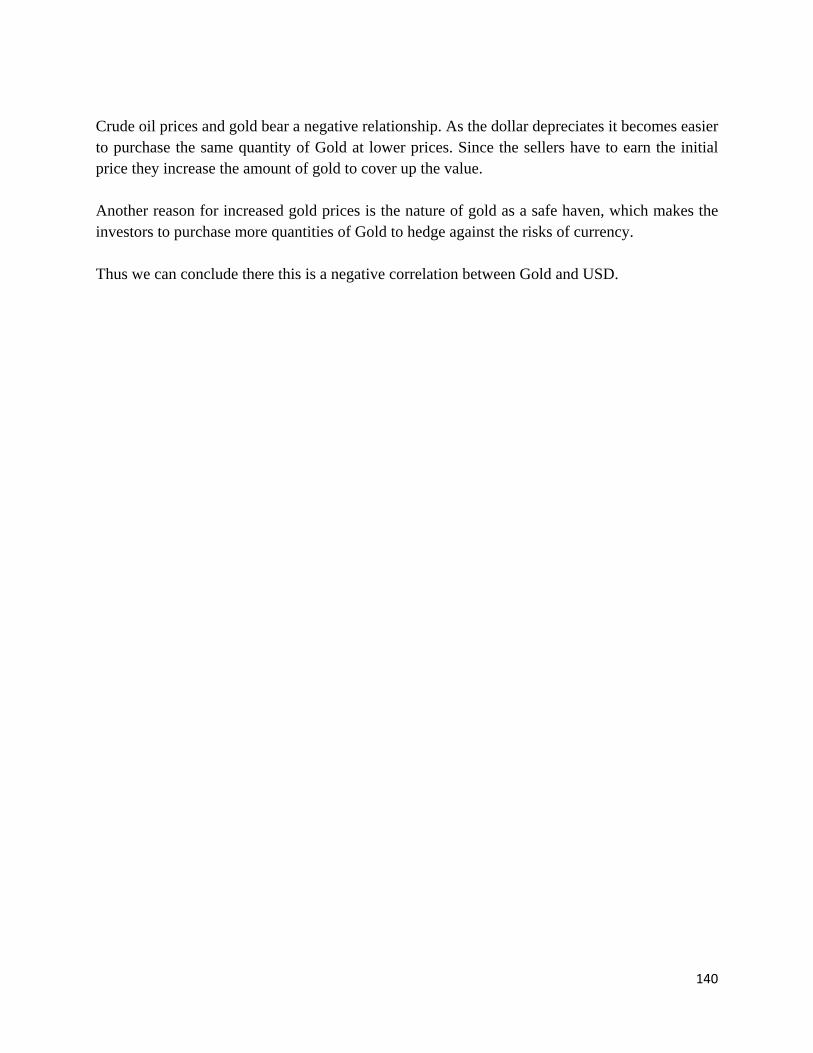
140
Crude oil prices and gold bear a negative relationship. As the dollar depreciates it becomes easier to purchase the same quantity of Gold at lower prices. Since the sellers have to earn the initial price they increase the amount of gold to cover up the value. Another reason for increased gold prices is the nature of gold as a safe haven, which makes the investors to purchase more quantities of Gold to hedge against the risks of currency. Thus we can conclude there this is a negative correlation between Gold and USD.
141
Appendix 11: Relation between Crude Oil Prices and Gold Prices There is a positive correlation between Crude Oil Prices and Gold Value. In simple words, as the value of dollar declines the prices of Crude Oil increase. The Study: The data of Crude Oil Prices were taken since 2002 and correlated with the corresponding values of Gold. As per our hypothesis there exists a positive correlation between the two. Assumptions
1) Independent Variable: Crude Oil Prices 2) Dependent Variable: Gold Prices 3) Using correlation we develop the following model.
The Model: Y=1.11-0.000543X Coefficient of Correlation: r2= 0.5949028 r=0.771299454

142
Crude oil prices and gold bear a positive relationship, as clearly evident in the above figure. Being negatively correlated to the dollar both the Crude oil prices and gold prices move in the same direction. Thus we can conclude that crude oil prices and gold bear a positive relationship.
143
Appendix 12: Theory of Decoupling
The theory of decoupling holds that the emerging economies from Europe and Asia have broadened and deepened to such a point that these economies no longer depend on the United States for growth. In other words, they are insulated from a severe slowdown or even a fully fledged recession. This faith in this theory has been so grave that stocks have outperformed irrespective of the subprime crisis inflicting the United States. In January 2008 as fears of recession mounted in the United States, stocks declined heavily.
Contrary to what the decouplers would have expected, the losses were greater outside the United States, with the worst experienced in emerging markets and developed economies like Germany and Japan. Exports make up especially large portions of economic activity in those places, but that was not supposed to matter anymore in a decoupled world because domestic activity was thought to be so robust.
If this theory would have held truth then these economies would have witnessed a downfall much severe than the impact on the U.S. economy. But this did not happen due to the following reasons:
• Emerging markets collectively send more than half their total exports to other emerging markets. "China's growth in exports to America slowed to only 5% (in dollar terms) in the year to January, but exports to Brazil, India and Russia were up by more than 60%, and those to oil exporters by 45%," says The Economist. "Half of China's exports now go to other emerging economies. Likewise, South Korea's exports to the United States tumbled by 20% in the year to February, but its total exports rose by 20%, thanks to trade with other developing nations."
• Emerging markets as a group now export more to China than to the United States. • IMF data make clear that in 2007, India and China accounted for more global growth
than the U.S. • The four biggest emerging economies, which accounted for two-fifths of global GDP
growth last year, are the least dependent on the United States: exports to America account for just 8% of China's GDP, 4% of India's, 3% of Brazil's and 1% of Russia's.
• Trade surpluses have allowed emerging markets to build up $3.2 trillion in foreign exchange reserves ($2.1 trillion excluding China), which provides a strong buffer against any credit market disruptions in the developed world. Assuming that emerging market fundamentals remain relatively insulated from developed world credit troubles, trade between emerging nations will flourish and demand for commodities will remain high.
Thus the theory does not hold good keeping in view the above points.
144
GLOSSARY
Recession:
A recession is a decline in a country's real gross domestic product (GDP), or negative real economic growth, for two or more successive quarters of a year.
Recession is a significant decline in economic activity spread across the economy, lasting more than a few months, normally visible in real GDP, real income, employment, industrial production, and wholesale-retail sales. A recession begins just after the economy reaches a peak of activity and ends as the economy reaches its trough.
A recession may involve simultaneous declines in coincident measures of overall economic activity such as employment, investment, and corporate profits and may be associated with falling prices (deflation), or, alternatively, sharply rising prices (inflation) in a process known as stagflation.
Depression:
A severe and prolonged recession characterized by inefficient economic productivity, high unemployment and falling price levels is termed as a depression. Although the distinction between a recession and a depression is not clearly defined, it is often said that a decline in GDP of more than 10% constitutes a depression.
Economic Expansion:
An economic expansion is an increase in the level of economic activity, and of the goods and services available in the market place. Typically it relates to an upturn in production and utilization of resources. Economic recovery and prosperity are two successive phases of expansion. It may be caused by factors external to the economy, such as weather, or by factors internal to the economy, such as fiscal policies, monetary policies, and the availability of credit, interest rates, regulatory policies or other impacts on producer incentives. Global condition may influence the levels of economic activity in various countries.
Economic contraction and expansion relate to the overall output of all goods and services, whilst the terms inflation and deflation relate to the value of money.
Inflation:
An increase in the general level of prices in an economy that is sustained over a period of time is called inflation. The main causes for inflation is that too much money is available to purchase
145
too few goods and services or when the demand is outpacing supply. This situation mainly occurs when an economy is buoyant that there are widespread shortages of labor and materials. People can charge higher prices for the same goods or services.
Stagflation:
It is the combination of high unemployment and economic stagnation with inflation. This happened in industrialized countries during 1970s when a bad economy was combined with OPEC raising oil prices.
Deflation:
It is when the general level of prices is falling. It is the opposite of inflation.
146
BIBLIOGRAPHY
http://www.mortgagebankers.org
http://www.oanda.com
http://finance.google.com/finance
http://www.kitcometals.com/
Daily Treasury Yield Curve Rates. (n.d.). Retrieved from http://www.ustreas.gov
Adam, S. (2008, April 2). IMF Cuts Global Forecast on Worst Crisis Since 1930s . Retrieved from www.bloomberg.com
After ICICI, BoB provisions for sub‐prime losses. (2008, March 6). Retrieved from http://in.rediff.com
Atif R. Mian, A. S. (2008, January 1). The Consequences of Mortgage Credit Expansion: Evidence from the 2007 Mortgage Default Crisis. Retrieved from Social Science Research Network: http://papers.ssrn.com
Barnes, R. (n.d.). The Fuel That Fed The Subprime Meltdown. Retrieved from http://www.investopedia.com
Barr, A. ( 2007, April 10). Subprime crisis shines light on mortgage brokers. Retrieved from The Wall Street Journal: http://www.marketwatch.com
Becker, W. ( 2007, May 4). Euro riding high as an international reserve currency. Retrieved from www.dbresearch.com
Chandran, P. (2008, May 7). Lessons From Sub‐prime Meltdown. Retrieved from www.crisil.com
Charles E. Schumer, C. B. (October 2007). TheSubprime Lending Crisis: The Economic Impact on Wealth, Property Values and Tax Revenues, and How We Got Here,. IMF.
Credit Crisis 101: Blame the credit‐rating agencies. (2008, April 29). Retrieved from www.cnnmoney.com
Dodd, R. (December 2007). Subprime: Tentacles of a Crisis. Finance & Development,IMF .
FDI in real estate to touch 26 per cent by March 2007: ASSOCHAM. (2006, December 26). Retrieved from http://www.domain‐b.com
(April 2008). Global Finacial Stability Report Containing Systematic Risks and Restoring Finacial Soundness. IMF.
147
Impact of U.S. Subprime Crisis On India And China. (n.d.). Retrieved from http://www.economywatch.com
John Kiff, P. M. (July 2007). Money For Nothing and Checks for Free:Recent Developments in U.S. Subprime Mortgage Markets. IMF.
Jorion, P. (2007, September 28). The subprime crisis and the future of securitization. Retrieved from http://www.pauljorion.com
Lozada, C. (September 2005). Interactions of U.S. and European Financial Markets . NBER.
Mehta, V. H. (2008, February 10). The subprime crisis and Implications for India. The Financial Express .
Mills, J. K. (2007, July). Money for Nothing and Checks for Free:Recent Developments in U.S. Subprime. IMF Working Paper .
Mishkin, F. S. (October 2007). Housing and the Monetary Transmission Mechanism. NBER.
Mohammad, A. ( 2008, May 14 ). Will U.S. subprime crisis impact Indian realty mart? Economic Times .
Money And Finance. (September 2007). ICRA.
Morris, B. (2008, January 7). 2008‐the return of the dollar? BBC News , p. http://news.bbc.co.uk.
Morrison, C. E. (December 2007). State of The Region 2007‐2008. Pacific Economic Co‐operation Council.
Musall, J. (2007, April 10). The Declining Dollar and What it Means to Americans. Retrieved from http://www.associatedcontent.com
New JEC Report: Subprime Crisis To Cost Billion In Family Wealth, Property Values, And Tax Revenues Unless Action Is Taken To Prevent Foreclosures. (2007, October 25). Retrieved from http://jec.senate.gov
Oil Crisis No. 4. (May 16, 2008). Business Standard .
Petroff, E. (n.d.). Who Is To Blame For The Subprime Crisis? Retrieved from http://www.investopedia.com
Pitalwalla, Y. A. (2006, July 5). Indian real estate: boom or bubble? Retrieved from www.money.cnn.com
Portugal, M. M. (March 7, 2008 ). Navigating the Financial Storm: The Financial Market Crisis and the Global Economic Outlook‐Lessons and Policy Challenges. Annual Meeting of Institute for International Finance.
148
Rating agencies defend role in subprime crisis. ( 2008, January 14). Retrieved from http://www.reuters.com
Real Estate. (2008, April‐June ). Retrieved from http://www.ibef.org
Real Estate Boon In India‐ Will it continue? (2007, December 13). Retrieved from http://www.manfromindia.com
Reddy, Y. V. ( April 2008). Annual Policy Statement for the Year 2008‐09 . Reserve Bank of India.
Schumer, C. E. (March 2008). Subprime Mortgage Market Crisis Timeline. Joint Economic Committee.
Senate Examines Role Of Credit Rating Agencies In Subprime Crisis. (2007, September 26). Retrieved from http://www.tradingmarkets.com
Sicilia, J. (January 2006). U.S. Economic Perspectives: The importance of the housing sector. Economic Research Department.
Stephen G. Cecchetti. ( 2008, April). Monetary Policy and the Financial Crisis 2007‐08. Retrieved from Policy Insight No 21: www.cepr.org
Subprime mortgage crisis. (n.d.). Retrieved from www.wikipedia.com
The Monetary Policy of the ECB. (n.d.). Retrieved from www.ecb.com
The U.S. sub‐prime crisis in graphics. (2007, November 21). Retrieved from www.bbc.co.in
Thomas Helbling, V. M.‐B. (2008, March). Commodities Boom: Riding A Wave. Finance And Development , pp. 10‐15.
Timeline: Sub‐prime losses. (2008, May 12). Retrieved from www.bbc.co.in
Trends in Housing‐Related Employment. (2007, May). Retrieved from www.mortgagebankers.org
US Economic Outlook. (n.d.). Retrieved from www.mfc.com
US Department Of Labour. (n.d.). Retrieved from Bureau of Labour Statistics: www.bls.gov.in
US economy at a glance. (2008, January 31). Retrieved from www.bbc.co.in.
Weller, C. E. (December 2006). The End of the Great American Housing Boom: What it means for You, Me and the U.S. Economy. Centre for American Progress.
149
Will a subprime crisis sink India's economy? (n.d.). Retrieved from www.window2india.com
William Adams, L. E. (2007, April). Liquidity Constraints and Imperfect Information In Subprime Lending. Retrieved from NBER Working Paper Series: http://www.nber.org/papers/w13067
Williamson, J. (2006, May 13). Why Capital Account Convertibility in India is premature? Economic And Political Weekly , pp. 1848‐1850.
Yuliya Demyanyk, O. V. (2008, February 29). Understanding the Subprime Mortgage Crisis . Retrieved from Social Science Research Network: http://papers.ssrn.com