u.s. metalcasting forecast & trends webinar alfred spada director of marketing, pr &...
TRANSCRIPT

U.S. Metalcasting Forecast & Trends
Webinar
Alfred SpadaAlfred SpadaDirector of Marketing, PR Director of Marketing, PR
& Communications& Communications

Outline
• U.S. Metalcasting Profile
• U.S. Casting Forecast
• Global Competition

Profile of the U.S. Metalcasting Industry
2170 Casting Facilities– 700+ Ferrous;
1400+ Nonferrous– Employs More Than 200,000– 80% Are Small Businesses
(less than 100 employees)– 2007: $32.3 Billion;
13.4 Million Tons– 2008: $33-34 Billion??;
13.4 Million Tons??– 2nd in Production

What Happened in 2007?
• Imports for Light Vehicles: Forecasted at 21% of Demand; Reality is 24% of Demand
• Med. To Heavy Trucks & Trailers: Forecasted 15% reduction (420,000 trucks/260,000 trailers); Reality is 25% reduction (370,000 trucks/229,000 trailers)
• Housing Starts: Forecasted 3% growth; Reality 8% decline
• Ductile Iron Pipe: Forecasted 2.3 million tons; Reality 2.07 million tons

U.S. Production
• 1955—6150 Plants• 1991—3200 Plants• 2008—2170 Plants• From ’91-’07, production
capacity off only 4%• From ’91-’07, Alum growth at 91% (1.1 to 2.1 mil. Tons)• From ’91-’07, Mg growth at 331% (29,000 to 125,000 tons)• Greater number of castings produced today than in ‘91

2008 Capacity & Utilization
Metal Capacity (Tons) Utilization (%)
Iron 11,250,000 84
Steel 1,680,000 82
Aluminum 2,600,000 81
Copper Base 380,000 87
Magnesium 170,000 74
Zinc/Lead 370,000 88
Other Nonferrous 70,000 87
Investment 200,000 74
TOTAL 16,720,000 83

2008 Shipment Mix: Tons
Other4%
Mag1%
Zinc2%
Alum16%
Copper2%
Gray Iron33%
Steel9%
Ductile Iron33%

2008 Shipment Mix: Sales
Mag3%
Other13%
Aluminum32%
Cu-Alloy4%
Zinc 2%
Iron35%
Steel11%

Casting End-Use MarketsOther19%
Car/Truck31%
Spec Ind-3%
Municipal3%
Pumps & Comp-3%
Railroad-6%
Int Comb Eng 5%
Valves-5%Constr., Mining,
Oil Field-6%
Farm Mach4%
Pipe & Fittings
15%
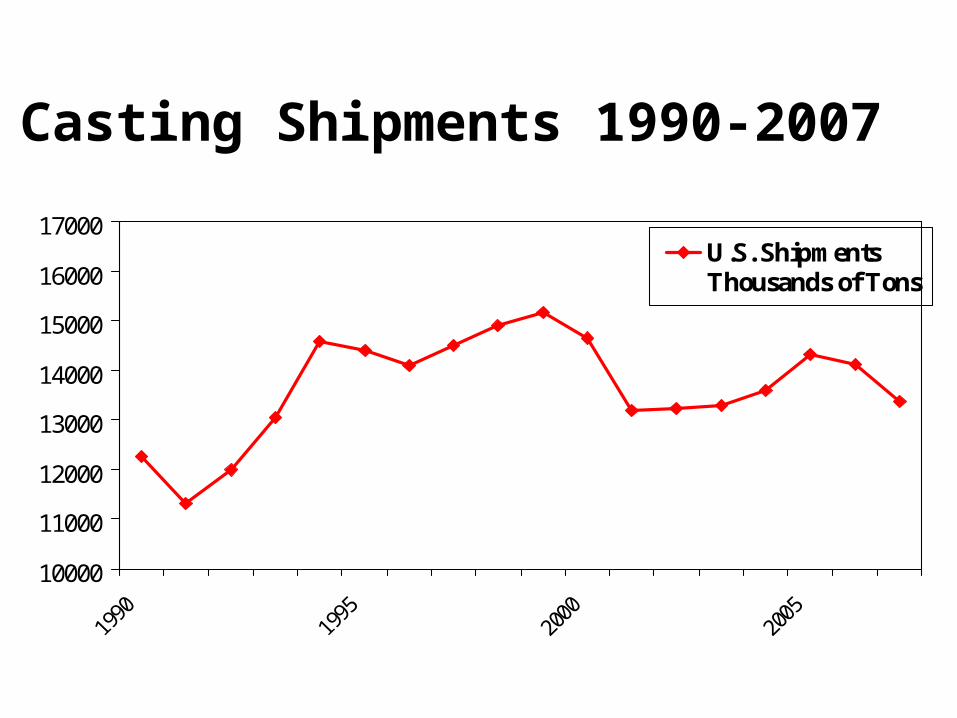
Casting Shipments 1990-2007
10000
11000
12000
13000
14000
15000
16000
17000U.S. ShipmentsThousands of Tons

Projected Shipments
(all metals)
• 2009: 13.4 million tons$34.2 Billion in sales
• 2011: 12.3 million tons; $31.8 Billion in sales
• 2017: 14.14 million tons$42 billion in sales
Forecast based on GDP, housing starts, auto, railcar and truck production, construction activity, end-user and supplier interviews.
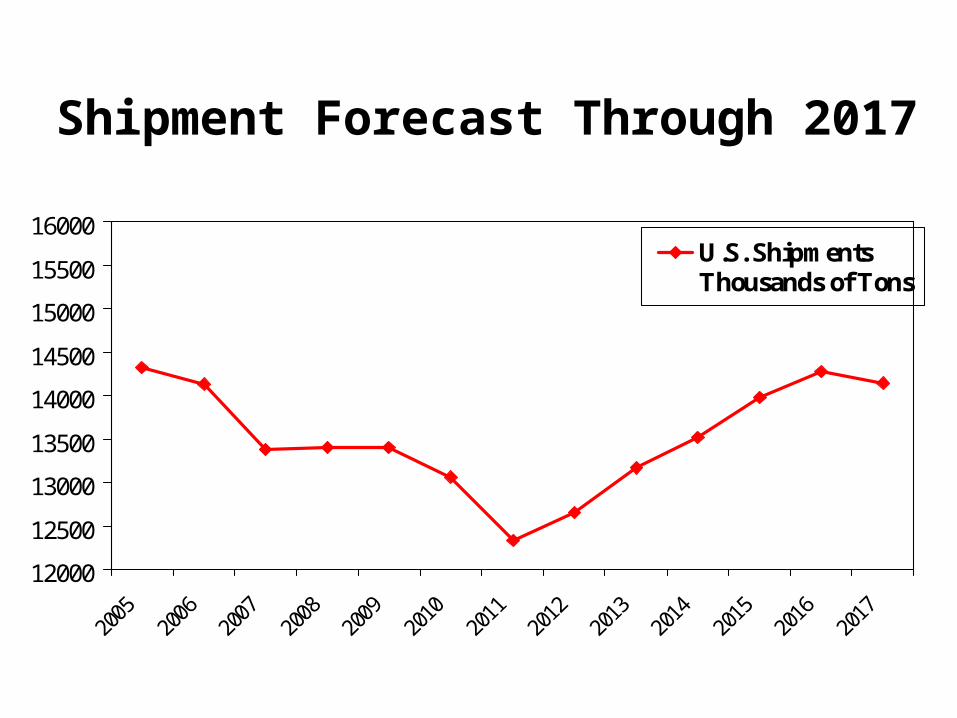
Shipment Forecast Through 2017
12000
12500
13000
13500
14000
14500
15000
15500
16000U.S. ShipmentsThousands of Tons

Sales Forecast Through 2017
30
32
34
36
38
40
42
44
46
U.S. Sales in Billions

What Happens in 2010-13?
• Cyclical economic recession is expected every 10 years, affecting auto, rail, truck, construction, etc.
• Happened in 2001, 1991, 1981, 1971, etc.• Forecasted by economic experts for 2011• Similar Shipment tonnage as 2001• Sales hit a low of $31.7 billion in 2011• Truck/Trailer: 300,000/190,000 in 2012• Freight Cars: 40,000 in 2012• GDP: -0.2% growth in 2010-11

Globalization & Imports

Imports 2008
• Gray Iron: 1,630,000 tons (29% of demand)
• Ductile Iron: 576,000 tons (12% of demand)
• Carbon and Low Alloy Steel: 266,000 tons (21% of demand)
• Aluminum Die Castings: 334,000 tons (25% of demand)
• Aluminum Permanent Mold/Sand: 566,000 tons (44% of demand)
• Copper-Base: 67,000 tons (19% of demand)
3,681,000 tons of castings
23.4% of demand (from 7% in 1998)

Imports to U.S. By Market: 2008
Motor Vehicle1,446,000 tons
39.8%
Internal Combustion
Engines379,000 tons
11.1%
Valves & Fittings
308,000 tons8%
Municipal310,000 tons
8.5%
Contruc., Mining & Oil171,000 tons
4.8%
Other661,000 tons
20.9%
Farm Equip.101,000 tons
2.7%
Railroad153,000 tons
4.2%

Imports to U.S. By Country: 2008
China23%
India11%
Other Asian18%
Europe10%
Canada11%
Mexico11%
Brazil10% Other
6%

Metalcasting Across the Globe

Global Production (in 000s metric tons)
2004 2005 2006
Gray Iron 40,435 40,788 42,539
Ductile Iron 18,706 19,591 21,685
Mall. Iron 1,122 1,233 1,150
Steel 6,594 9,002 9,938
Cu-base 1,239 1,511 1,485
Aluminum 10,357 11,718 12,278
Mag 134 239 1,256
Zinc 907 936 941
TOTAL 79,745 85,741 91,368

Global Production 2006 (metric tons)
1. China: 28.1 million—26,000 plants2. U.S.: 12.5 million—2190 plants3. Japan: 7.9 million—1701 plants4. India: 7.2 million—4750 plants5. Russia: 6.9 million—1900 plants6. Germany: 5.5 million—619 plants 7. Brazil: 3.1 million—1372 plants8. Italy: 2.6 million—1171 plants9. France: 2.4 million—469 plants10.Korea: 1.9 million—851 plants

The Global Pie
China
31%
Japan
9%
Other Asian
6%
U.S. 14%Brazil
3%
EU
17%
Easter Europe
2%
Russia
7%
OthersIndia
8%14%

Comparison of Casting Labor/Benefit Rates 2008
0
5
10
15
20
25
30
35
U.S
. $/
ho
ur
GER JAP U.S. FRA ITL CAN KOR BRA MEX CHN

European MarketsGermany– Capacity Utilization: 92% for ductile iron, 83%
for gray iron, 90% for aluminum; Maybe Higher– Normally a net exporter: 400,000 tons of
ferrous casting in 2006– 33% of gray and 30% of ductile iron production
for Western Europe– Highest productivity per plant by 30%
Russia– Produced 26 million tons in 1991 as Soviet
Union; 7 million tons today– Suppliers love the possibilities– Capacity Utilization: 67% for ductile iron, 59%
for gray iron, 92% for aluminum

Brazil– 3.1 million
metric tons production– 1300 plants– Engineering Skill– Currency problems
Mexico– Nemak-largest aluminum
caster in world– 1.7 million tons– Several large, rest small,
no medium – Costs raising to U.S. levels
Latin America

China•
– 26,000 plants– 13.9 million tons gray,
6.8 million ductile, 3.8 million steel, 2.3 million aluminum
– 15% growth from 2005-06– Capacity Utilization:
67% gray iron and 75% for ductile iron and aluminum
– Export 3.2 million tons in 2006

India• 4750 Plants• 4th in the World: 4.8
million tons gray iron, 0.7 ductile, 0.9 steel, 0.5 aluminum
• Since 2002, India’s output has doubled
• Productivity rose 17.5% from 2005-06
• 160,000 employees

Global Productivity Per Plant

For Further Information
• Metalcasting Forecast & Trends 2008– Data Available By Metal, End-Use Market
• Demand & Supply Forecast for Metal Castings in the U.S. (Vol 1 & 2)
• Further Questions for AFS Corporate Members, email [email protected]
Thank You