us loan market 2021: charting the market rebound
TRANSCRIPT

US Loan Market –2021: Charting the Market Rebound
A Refinitiv LPC Special Report
June 2021

2
Effectiveness of vaccine rollout and distribution saves lives in the USFor 137 days straight, between Nov. 6, 2020, and Mar. 22, 2021, the US averaged over 1,000 Covid-related deaths per day, totaling over 307k during that span
Since late December, Covid-related deaths have dropped below 500/day as over 300 million Americans have been vaccinated against the Covid-19 virus
Source: Our World in Data
0
50
100
150
200
250
300
350
0.0
500.0
1,000.0
1,500.0
2,000.0
2,500.0
3,000.0
3,500.0
4,000.0
7-M
ar-
20
20-M
ar-
20
2-A
pr-
20
15-A
pr-
20
28-A
pr-
20
11-M
ay-2
0
24-M
ay-2
0
6-J
un-2
0
19-J
un-2
0
2-J
ul-20
15-J
ul-20
28-J
ul-20
10-A
ug-2
0
23-A
ug-2
0
5-S
ep-2
0
18-S
ep-2
0
1-O
ct-2
0
14-O
ct-2
0
27-O
ct-2
0
9-N
ov-2
0
22-N
ov-2
0
5-D
ec-
20
18-D
ec-
20
31-D
ec-
20
13-J
an-2
1
26-J
an-2
1
8-F
eb-2
1
21-F
eb-2
1
6-M
ar-
21
19-M
ar-
21
1-A
pr-
21
14-A
pr-
21
27-A
pr-
21
10-M
ay-2
1
23-M
ay-2
1
5-J
un-2
1
(Left) US Covid-19 deaths (7-day avg) & (Right) US Total Vaccinations (m)
US Covid-19 deaths (7-day avg) US Total Vaccinations (m)
Refinitiv LPC Special Report - June 2021

3
Refinitiv LPC Special Report - June 2021
Despite inflation concerns and recent employment numbers coming up short of expectations, vaccine rollout accelerates reopening
-3%
-2%
-1%
0%
1%
2%
3%
4%
5%
2Q
17
3Q
17
4Q
17
1Q
18
2Q
18
3Q
18
4Q
18
1Q
19
2Q
19
3Q
19
4Q
19
1Q
20
2Q
20
3Q
20
4Q
20
1Q
21
US Gross Domestic Product (% change from preceding period)
Source: U.S. Bureau of Economic Analysis, Bureau of Labor Statistics/U.S. Department of Labor, The Conference Board
0%2%4%6%8%
10%12%14%16%
Jul 2010
Nov 2
010
Mar
2011
Jul 2011
Nov 2
011
Mar
2012
Jul 2012
Nov 2
012
Mar
2013
Jul 2013
Nov 2
013
Mar
2014
Jul 2014
Nov 2
014
Mar
2015
Jul 2015
Nov 2
015
Mar
2016
Jul 2016
Nov 2
016
Mar
2017
Jul 2017
Nov 2
017
Mar
2018
Jul 2018
Nov 2
018
Mar
2019
Jul 2019
Nov 2
019
Mar
2020
Jul 2020
Nov 2
020
Mar
2021
US Unemployment Rate
-1.0%
-0.5%
0.0%
0.5%
1.0%
May-1
9
Jun-1
9
Jul-19
Aug-1
9
Sep-1
9
Oct
-19
Nov-1
9
Dec-
19
Jan-2
0
Feb-2
0
Mar-
20
Apr-
20
May-2
0
Jun-2
0
Jul-20
Aug-2
0
Sep-2
0
Oct
-20
Nov-2
0
Dec-
20
Jan-2
1
Feb-2
1
Mar-
21
Apr-
21
May-2
1
US Consumer Price Index
One lender recently told Refinitiv LPC that supply chain logistical issues and the struggle for companies to hire people were impacting things “across the
board,” but noted it was not devastating, and more a market functionality frustration
70.080.090.0
100.0110.0120.0130.0140.0
1-J
un-2
019
1-J
ul-2019
1-A
ug-2
019
1-S
ep-2
019
1-O
ct-2
019
1-N
ov-2
019
1-D
ec-
2019
1-J
an-2
020
1-F
eb-2
020
1-M
ar-
2020
1-A
pr-
2020
1-M
ay-2
020
1-J
un-2
020
1-J
ul-2020
1-A
ug-2
020
1-S
ep-2
020
1-O
ct-2
020
1-N
ov-2
020
1-D
ec-
2020
1-J
an-2
021
1-F
eb-2
021
1-M
ar-
2021
1-A
pr-
2021
1-M
ay-2
021
US Consumer Confidence

4
Refinitiv LPC Special Report - June 2021
OpenTable seated diner data shows restaurants are near-to 2019 levels, while TSA travel numbers show continued increases in number of airline passengersHowever, airlines expect to continue to see sub-2019 travel volumes due to a slower pick-up in business and international travel
Source: OpenTable Inc, TSA.gov
OpenTable Seated Diners: 2021 vs 2019, 2020 vs 2019
0.0
0.5
1.0
1.5
2.0
2.5
3.0
1-J
an
8-J
an
15-J
an
22-J
an
29-J
an
5-F
eb
12-F
eb
19-F
eb
26-F
eb
5-M
ar
12-M
ar
19-M
ar
26-M
ar
2-A
pr
9-A
pr
16-A
pr
23-A
pr
30-A
pr
7-M
ay
14-M
ay
21-M
ay
28-M
ay
TSA Checkpoint Travel Numbers (M): Jan. through May 2019, 2020, 2021
2021 Traveler Throughput 2020 Traveler Throughput 2019 Traveler Throughput

5
Wells Fargo & Co
The bank said in March it plans to start bringing workers
back to its offices after Labor Day due to the increasing
availability of vaccines. The company is evaluating whether
to allow certain businesses or functional subgroups in the
United States to return to the workplace before Labor Day.
Refinitiv LPC Special Report - June 2021
Major financial institutions are plotting a return to the office and laying out visions for a future hybrid model
Goldman Sachs Group Inc
The bank is planning to bring U.S. employees back to
the office by mid-June.
JPMorgan Chase & Co
The largest U.S. bank will bring its employees in the United
States back to the office on a rotational basis from July and
plans to maintain a 50% occupancy cap during the return-to-
office phase.
Citigroup Inc
Chief Executive Officer Jane Fraser said in a memo in March
that post-pandemic, most of the employees would be able to
work in a "hybrid" setting, allowing them to work from home for
up to two days a week.
Barclays Plc
Chief Executive Officer Jes Staley has said the bank will adopt
a hybrid working model and will reduce its real estate footprint
but maintain its main offices in London and New York.
Credit Suisse
Credit Suisse in July 2020 launched a global program
evaluating various work-from-home options, which are
expected to shape its post-pandemic working models. It has
been monitoring and adapting work arrangements since
launching work-from-home globally in March 2020, taking into
account local guidelines.
Source: Reuters

6
Refinitiv LPC Special Report - June 2021
Refinitiv LPC’s lender survey showed most respondents are expecting that by this fall they will shake hands, network at conferences, or get on a plane to win new business
Source: Refinitiv LPC’s Quarterly Buyside & Sellside Survey
0% 20% 40% 60% 80%
Never
Once I'm vaccinated
Fall '21
Summer '21
Spring '21
Winter '20
Fall '20
Summer '20
When do you expect to shake hands?
2Q20 Survey 3Q20 Survey
4Q20 Survey 1Q21 Survey
0% 20% 40% 60% 80% 100%
Never
Once I'm vaccinated
Fall '21
Summer '21
Spring '21
Winter '20
Fall '20
Summer '20
When do you expect to attend a local conference/networking event?
2Q20 Survey 3Q20 Survey
4Q20 Survey 1Q21 Survey
0% 20% 40% 60% 80%
Never
Once I'mvaccinated
Fall '21
Summer '21
Spring '21
Winter '20
Fall '20
Summer '20
When do you expect to get on a plane to do introductory face to face meeting for new business or due diligence?
2Q20 Survey 3Q20 Survey
4Q20 Survey 1Q21 Survey

7
Refinitiv LPC Special Report - June 2021
Most surveyed lenders said winning new business and the quality of engagement with clients and co-workers had some upsides but plateaued by this spring while the pace of virtual meetings increased as deal flow picks up dramatically
Source: Refinitiv LPC’s Quarterly Buyside & Sellside Survey
0%
5%
10%
15%
20%
25%
30%
35%
40%
45%
No – struggles
with finding new
business are the same
Maybe – Hopeful
for a shift as
things open up
Yes – it has
become easier
Have the wins/losses shifted as you work to win new business virtually? (% of respondents)
1Q21 Survey
0%
10%
20%
30%
40%
50%
60%
Deteriorated –
Harder to reach
people
Improved - Moremeaningful and
substantive
Stayed the same
– Moderate to
meaningful
How has the quality of engagement with clients and co-workers changed?
4Q20 Survey 1Q21 Survey
0%
10%
20%
30%
40%
50%
60%
Meeting requestsare about the
same
Meeting requestshave slowed
There aren’t
enough hours in
the day to reply to all the meeting
requests
How has the pace of meetings and calls changed?
4Q20 Survey 1Q21 Survey
8
Refinitiv LPC Special Report - June 2021
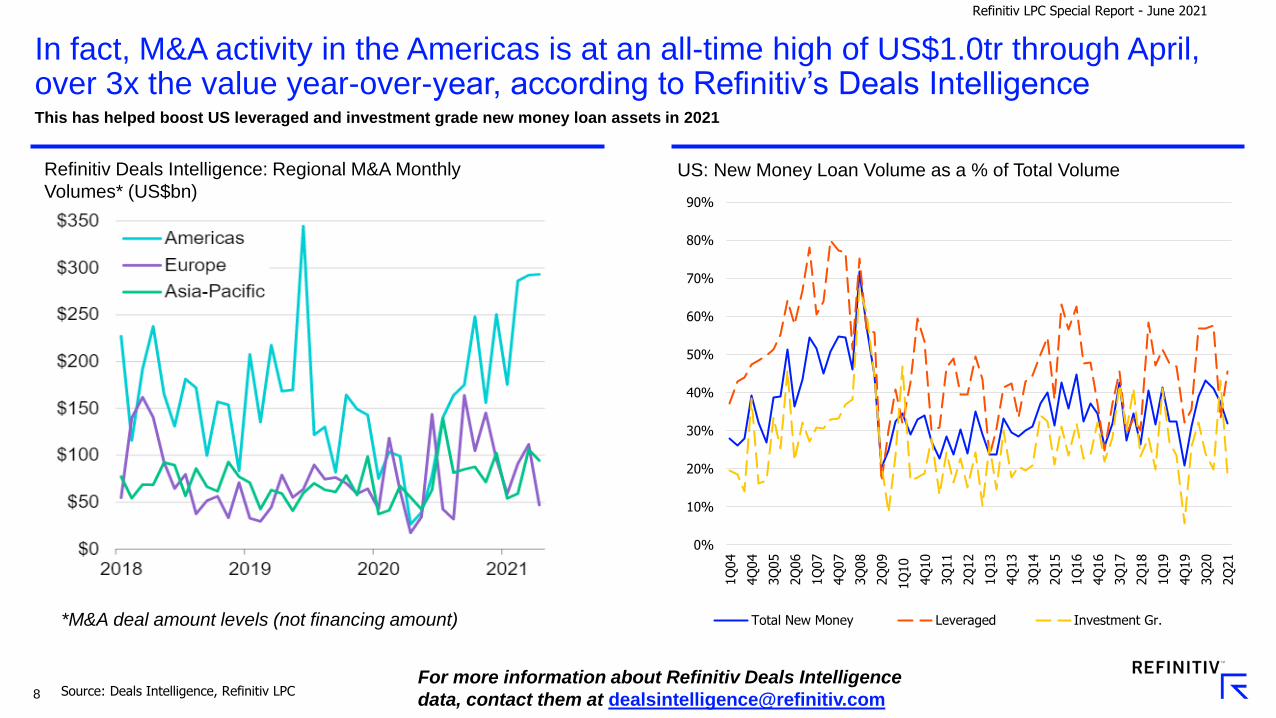
In fact, M&A activity in the Americas is at an all-time high of US$1.0tr through April, over 3x the value year-over-year, according to Refinitiv’s Deals IntelligenceThis has helped boost US leveraged and investment grade new money loan assets in 2021
Source: Deals Intelligence, Refinitiv LPC
0%
10%
20%
30%
40%
50%
60%
70%
80%
90%
1Q
04
4Q
04
3Q
05
2Q
06
1Q
07
4Q
07
3Q
08
2Q
09
1Q
10
4Q
10
3Q
11
2Q
12
1Q
13
4Q
13
3Q
14
2Q
15
1Q
16
4Q
16
3Q
17
2Q
18
1Q
19
4Q
19
3Q
20
2Q
21
US: New Money Loan Volume as a % of Total Volume
Total New Money Leveraged Investment Gr.
Refinitiv Deals Intelligence: Regional M&A Monthly
Volumes* (US$bn)
*M&A deal amount levels (not financing amount)
For more information about Refinitiv Deals Intelligence
data, contact them at [email protected]

9
Refinitiv LPC Special Report - June 2021
Public and private equity fundraising are going full throttleUS private equity has surpassed US$180bn this year and is on pace for another >US$300bn year
According to Refinitiv Deals Intelligence, a global total of 670 IPOs were tracked through mid-May, the most in more than 20 years
0.0
50.0
100.0
150.0
200.0
250.0
300.0
350.0
400.0
2000
2001
2002
2003
2004
2005
2006
2007
2008
2009
2010
2011
2012
2013
2014
2015
2016
2017
2018
2019
2020
YTD
-21
US Private Equity Fundraising (US$bn)
Turnaround/Distressed Debt Mezzanine Generalist Buyouts
Source: Refinitiv, Refinitiv Deals Intelligence
Refinitiv Deals Intelligence: Global IPO Volume
For more information about Refinitiv Deals Intelligence
data, contact them at [email protected]
10
Refinitiv LPC Special Report - June 2021
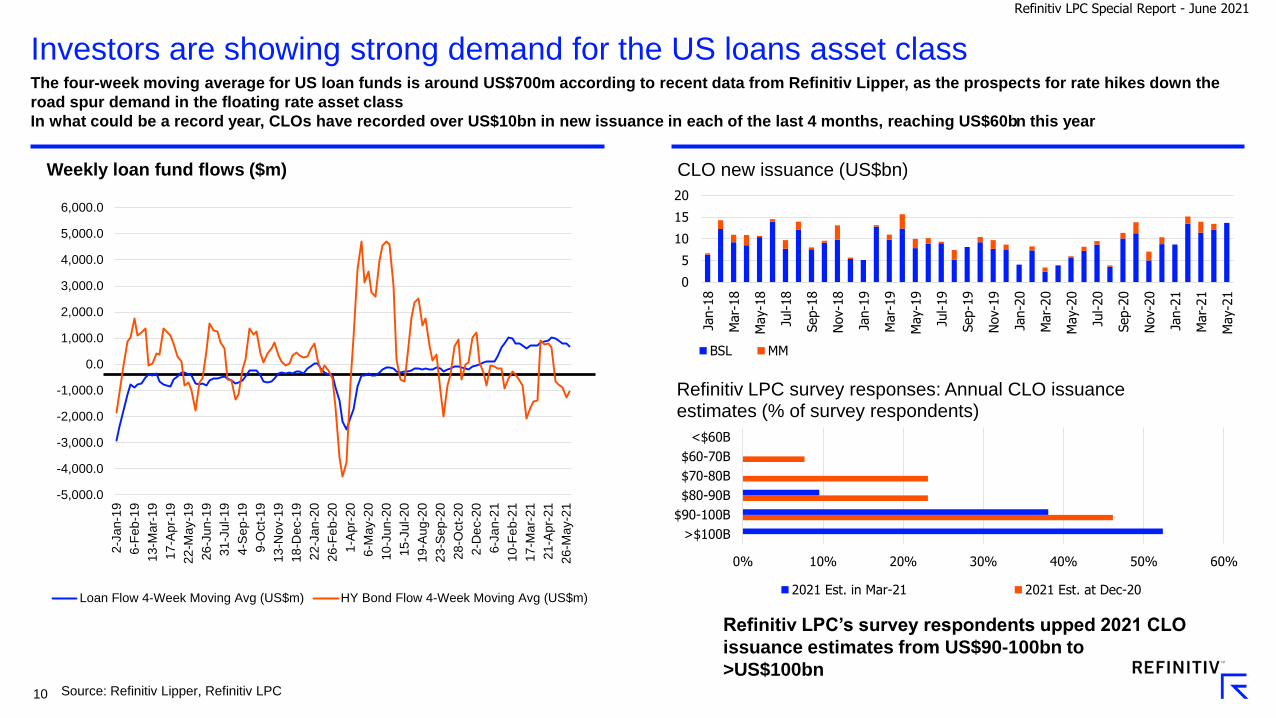
Investors are showing strong demand for the US loans asset class
Source: Refinitiv Lipper, Refinitiv LPC
The four-week moving average for US loan funds is around US$700m according to recent data from Refinitiv Lipper, as the prospects for rate hikes down the
road spur demand in the floating rate asset class
In what could be a record year, CLOs have recorded over US$10bn in new issuance in each of the last 4 months, reaching US$60bn this year
0
5
10
15
20
Jan-1
8
Mar-
18
May-1
8
Jul-18
Sep-1
8
Nov-1
8
Jan-1
9
Mar-
19
May-1
9
Jul-19
Sep-1
9
Nov-1
9
Jan-2
0
Mar-
20
May-2
0
Jul-20
Sep-2
0
Nov-2
0
Jan-2
1
Mar-
21
May-2
1
CLO new issuance (US$bn)
BSL MM
0% 10% 20% 30% 40% 50% 60%
>$100B
$90-100B
$80-90B
$70-80B
$60-70B
<$60B
Refinitiv LPC survey responses: Annual CLO issuance estimates (% of survey respondents)
2021 Est. in Mar-21 2021 Est. at Dec-20
-5,000.0
-4,000.0
-3,000.0
-2,000.0
-1,000.0
0.0
1,000.0
2,000.0
3,000.0
4,000.0
5,000.0
6,000.0
2-J
an-1
9
6-F
eb
-19
13
-Ma
r-1
9
17
-Ap
r-1
9
22
-Ma
y-1
9
26
-Ju
n-1
9
31
-Jul-
19
4-S
ep-1
9
9-O
ct-
19
13
-No
v-1
9
18
-De
c-1
9
22
-Ja
n-2
0
26
-Fe
b-2
0
1-A
pr-
20
6-M
ay-2
0
10
-Ju
n-2
0
15
-Ju
l-2
0
19
-Au
g-2
0
23
-Sep
-20
28
-Oct-
20
2-D
ec-2
0
6-J
an-2
1
10
-Fe
b-2
1
17
-Ma
r-2
1
21
-Apr-
21
26
-Ma
y-2
1
Weekly loan fund flows ($m)
Loan Flow 4-Week Moving Avg (US$m) HY Bond Flow 4-Week Moving Avg (US$m)
Refinitiv LPC’s survey respondents upped 2021 CLO
issuance estimates from US$90-100bn to
>US$100bn

11
Refinitiv LPC Special Report - June 2021
82% of CLO portfolio assets were marked at 98 or higher by the end of May, up from December’s 68%
Source: Refinitiv LPC
0%
10%
20%
30%
40%
50%
60%
0
<1
1 t
o <
2
2 t
o <
3
3 t
o <
4
4 t
o <
5
5 t
o <
10
10 t
o <
15
15 t
o <
20
>=
20
Share of US CLO universe / Percent of assets in default
Feb-20 Mar-20 Jun-20 Sep-20
Dec-20 Mar-21 Apr-21 May-21
0%
10%
20%
30%
40%
50%
60%
Share of US CLO Loan Holdings / Avg. bid (% of Par)
May-20 Dec-20 Mar-21 Apr-21 May-21
0%
10%
20%
30%
40%
50%
60%
70%
80%
90%
Share of US CLOs / Weighted avg. bid (% of Par)
Feb-20 Mar-20 Jun-20 Dec-20
Mar-21 Apr-21 May-21
*excludes CLOs less than $50 million in size.
At the height of the pandemic, last May, the share of highly bid assets was just 6%
22% of US CLOs had a weighted average bid between 99-99.9 in May compared with 0% during February through December 2020

12
US broadly syndicated CLO AAA spreads have flattened in recent months after tightening near to post-pandemic lows back in March due to strong investor demand
80
100
120
140
160
180
200
220
240
260
280
Jan-1
6
Mar-
16
Mar-
16
Apr-
16
May-1
6
Jun-1
6
Jul-16
Aug-1
6
Sep-1
6
Oct
-16
Nov-1
6
Dec-
16
Jan-1
7
Feb-1
7
Mar-
17
Apr-
17
May-1
7
Jun-1
7
Jul-17
Aug-1
7
Sep-1
7
Oct
-17
Nov-1
7
Dec-
17
Jan-1
8
Feb-1
8
Mar-
18
Apr-
18
May-1
8
Jun-1
8
Jul-18
Aug-1
8
Sep-1
8
Oct
-18
Nov-1
8
Dec-
18
Jan-1
9
Feb-1
9
Mar-
19
Apr-
19
May-1
9
Jun-1
9
Jul-19
Aug-1
9
Sep-1
9
Oct
-19
Nov-1
9
Dec-
19
Jan-2
0
Feb-2
0
Mar-
20
Apr-
20
May-2
0
Jun-2
0
Jul-20
Aug-2
0
Sep-2
0
Oct
-20
Nov-2
0
Dec-
20
Jan-2
1
Feb-2
1
Mar-
21
Apr-
21
May-2
1
AAA Discount Margin (bp)
Source: Refinitiv LPC
*based on deals where discount margin is available
Refinitiv LPC Special Report - June 2021
The record supply seen earlier this year put pressure on spreads which has caused the leveling off

13
Refinitiv LPC Special Report - June 2021
US secondary loan bids have been stable most of this year, while lower rated loans make up for lost ground, gaining 5.6%
Source: ICE BAML, Refinitiv LPC/LSTA Mark to Market Pricing
The LPC 100 has increased 0.76% YTD, but most of that gain came in early January; meanwhile loans rated down the risk scale (<B3), have increased 5.6% YTD
The share of US secondary loans bid at par or better has increased to an 18% share of actively traded loans in recent weeks
76.0
78.0
80.0
82.0
84.0
86.0
88.0
90.0
92.0
94.0
96.0
98.0
100.0
102.0
104.0
106.0
2-J
an-1
8
8-A
pr-
18
13
-Jul-
18
17
-Oct-
18
21
-Jan
-19
27
-Apr-
19
1-A
ug-1
9
5-N
ov-1
9
9-F
eb
-20
15
-May-2
0
19
-Aug
-20
23
-Nov-2
0
27
-Fe
b-2
1
3-J
un-2
1
Avg. secondary bids: high yield bonds vs. US leveraged loans (% of par)
LPC 100 ML HY Bond Index
86.0
87.0
88.0
89.0
90.0
91.0
92.0
93.0
94.0
95.0
96.0
97.0
98.0
99.0
100.0
1-J
an-2
1
15
-Jan
-21
29
-Jan
-21
12
-Fe
b-2
1
26
-Fe
b-2
1
12
-Mar-
21
26
-Mar-
21
9-A
pr-
21
23
-Apr-
21
7-M
ay-2
1
21
-May-2
1
4-J
un-2
1
Average US secondary loan bids by ratings
Ba1/Ba2 Ba3 B1
B2/B3 < B3 Not Rated
< B3+5.6%
0%
10%
20%
30%
40%
50%
60%
70%
80%
90%
100%
1-J
an-2
0
1-F
eb-2
0
1-M
ar-
20
1-A
pr-
20
1-M
ay-2
0
1-J
un-2
0
1-J
ul-20
1-A
ug-2
0
1-S
ep-2
0
1-O
ct-2
0
1-N
ov-2
0
1-D
ec-
20
1-J
an-2
1
1-F
eb-2
11-M
ar-
21
1-A
pr-
21
1-M
ay-2
1
1-J
un-2
1
Secondary loan bid levels (share of loans)
x < 70 70-<90 90-<95
95-<98 98-<100 >=100

14
Oil and gas secondary bid levels are up roughly 24bp from pandemic lows as oil prices reach levels not seen since October 2018
-60
-40
-20
0
20
40
60
80
100
50
60
70
80
90
100
110
2-J
an-1
8
2-F
eb-1
8
2-M
ar-
18
2-A
pr-
18
2-M
ay-1
8
2-J
un-1
8
2-J
ul-18
2-A
ug-1
8
2-S
ep-1
8
2-O
ct-1
8
2-N
ov-1
8
2-D
ec-
18
2-J
an-1
9
2-F
eb-1
9
2-M
ar-
19
2-A
pr-
19
2-M
ay-1
9
2-J
un-1
9
2-J
ul-19
2-A
ug-1
9
2-S
ep-1
9
2-O
ct-1
9
2-N
ov-1
9
2-D
ec-
19
2-J
an-2
0
2-F
eb-2
0
2-M
ar-
20
2-A
pr-
20
2-M
ay-2
0
2-J
un-2
0
2-J
ul-20
2-A
ug-2
0
2-S
ep-2
0
2-O
ct-2
0
2-N
ov-2
0
2-D
ec-
20
2-J
an-2
1
2-F
eb-2
1
2-M
ar-
21
2-A
pr-
21
2-M
ay-2
1
2-J
un-2
1
Oil and Gas (North America) - Avg. Bid
Oil and Gas (North America) - Avg. Bid WTI (NYMEX)
NYMEX WTI (US$ per barrel)
Source: Refinitiv LPC/LSTA Mark to Market Pricing, Refinitiv Eikon
Refinitiv LPC Special Report - June 2021
As COVID-19 restrictions have eased, demand for gas and jet fuel has been on the rise. Meanwhile, OPEC and allies have agreed on supply restraints
through July. US West Texas Intermediate crude oil futures hit $70 per barrel for the first time since October 2018 the week starting June 7. As the
pandemic took hold and lockdowns were enforced around the world, oil prices went on a downward spiral, plummeting into negative territory for the
first time on April 20, 2020. Oil and gas bids followed, tumbling to a pandemic low of 71.95. The sector faced many challenges and defaults soared. But
as oil prices have recovered, so have oil and gas bids which are currently at the 95.7 level

15
Refinitiv LPC Special Report - June 2021
Behind strong demand from investors, US leveraged loan volume has flourished so far this yearCompleted US leveraged volume totaled US$569bn through June 3, 57% above the year-ago level and 86% ahead of 2019’s level through the same period
LBO volume totals around US$50bn so far in 2Q21, on pace for its best year since 2018
Source: Refinitiv LPC
-
20
40
60
80
100
120
140
160
180
Jan-1
8
Mar-
18
May-1
8
Jul-18
Sep-1
8
Nov-1
8
Jan-1
9
Mar-
19
May-1
9
Jul-19
Sep-1
9
Nov-1
9
Jan-2
0
Mar-
20
May-2
0
Jul-20
Sep-2
0
Nov-2
0
Jan-2
1
Mar-
21
May-2
1
US Leveraged Loan Volume (US$bn)
Pro rata Institutional
-
10
20
30
40
50
60
Jan-1
8
Mar-
18
May-1
8
Jul-18
Sep-1
8
Nov-1
8
Jan-1
9
Mar-
19
May-1
9
Jul-19
Sep-1
9
Nov-1
9
Jan-2
0
Mar-
20
May-2
0
Jul-20
Sep-2
0
Nov-2
0
Jan-2
1
Mar-
21
May-2
1
US Leveraged Loan M&A Volume (US$bn)
Non-LBO LBOs
16
Refinitiv LPC Special Report - June 2021
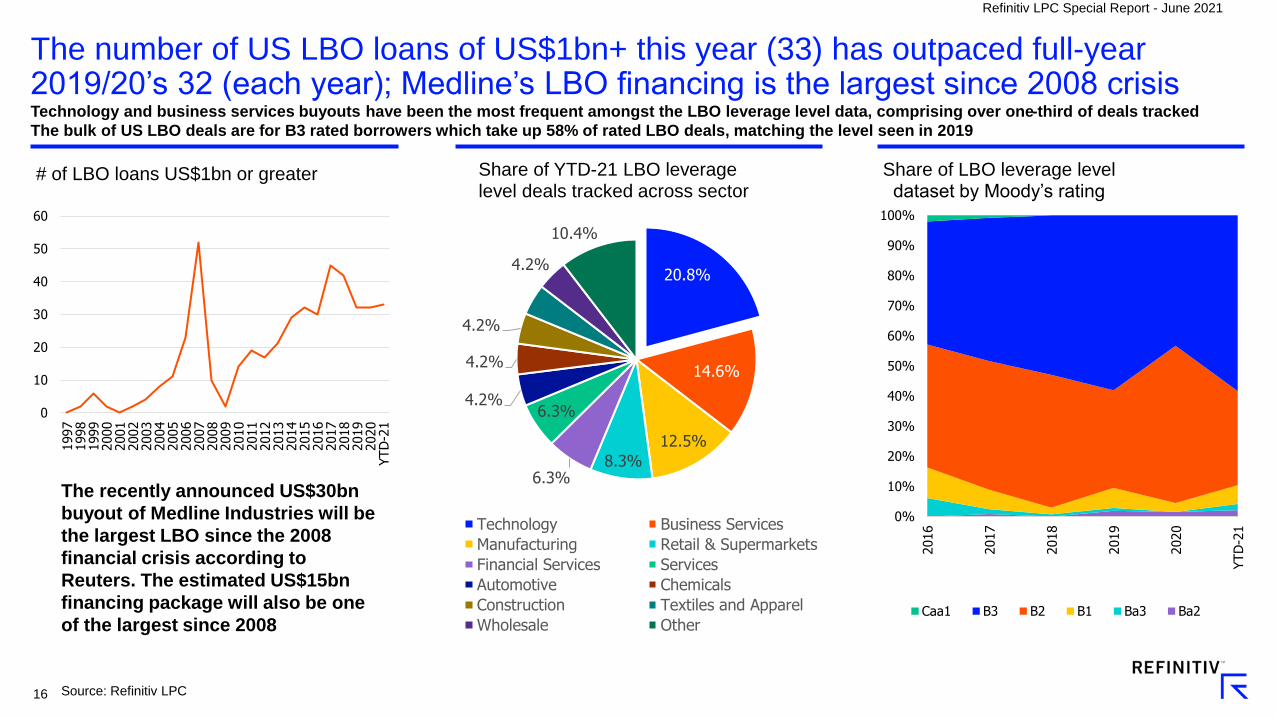
The number of US LBO loans of US$1bn+ this year (33) has outpaced full-year 2019/20’s 32 (each year); Medline’s LBO financing is the largest since 2008 crisisTechnology and business services buyouts have been the most frequent amongst the LBO leverage level data, comprising over one-third of deals tracked
The bulk of US LBO deals are for B3 rated borrowers which take up 58% of rated LBO deals, matching the level seen in 2019
Source: Refinitiv LPC
0
10
20
30
40
50
60
1997
1998
1999
2000
2001
2002
2003
2004
2005
2006
2007
2008
2009
2010
2011
2012
2013
2014
2015
2016
2017
2018
2019
2020
YTD
-21
# of LBO loans US$1bn or greater
0%
10%
20%
30%
40%
50%
60%
70%
80%
90%
100%
2016
2017
2018
2019
2020
YTD
-21
Share of LBO leverage level dataset by Moody’s rating
Caa1 B3 B2 B1 Ba3 Ba2
20.8%
14.6%
12.5%
8.3%6.3%
6.3%4.2%
4.2%
4.2%
4.2%
4.2%
10.4%
Share of YTD-21 LBO leverage level deals tracked across sector
Technology Business Services
Manufacturing Retail & Supermarkets
Financial Services Services
Automotive Chemicals
Construction Textiles and Apparel
Wholesale Other
The recently announced US$30bn
buyout of Medline Industries will be
the largest LBO since the 2008
financial crisis according to
Reuters. The estimated US$15bn
financing package will also be one
of the largest since 2008

17
Refinitiv LPC Special Report - June 2021
Stiff competition for good targets has allowed leverage and purchase price multiples to remain elevated for large corporate US LBO deals60% of US LBO deals tracked have had total leverage 7x or greater so far this year, while purchase price multiples remain in the 13x area
Equity contributions have come down from 2019-20 levels but remain above 40%
Source: Refinitiv LPC
0%
10%
20%
30%
40%
50%
60%
70%
80%
90%
2003
2004
2005
2006
2007
2008
2009
2010
2011
2012
2013
2014
2015
2016
2017
2018
2019
2020
YTD
-21
Share (%) of large corporate LBOs levered >= 6.0x, 7.0x
>= 6x >=7x
6.0x
7.0x
8.0x
9.0x
10.0x
11.0x
12.0x
13.0x
14.0x
0
1,000
2,000
3,000
4,000
5,000
6,000
2003
2004
2005
2006
2007
2008
2009
2010
2011
2012
2013
2014
2015
2016
2017
2018
2019
2020
YTD
-21
Large Corp LBOs: Purchase Price (US$M) & Multiple (x:1)
Avg. Purchase Price PP Multiple
20%
25%
30%
35%
40%
45%
50%
55%
60%
2003
2004
2005
2006
2007
2008
2009
2010
2011
2012
2013
2014
2015
2016
2017
2018
2019
2020
YTD
-21
Large Corp LBO Avg. Equity Check Share (%)

18
Refinitiv LPC Special Report - June 2021
Strong institutional appetite led to a drop in institutional yields to 17-year lows in 1Q21; despite slight widening in 2Q21, yields remain at historically low levels
Source: Refinitiv LPC
3.0%
4.0%
5.0%
6.0%
7.0%
8.0%
9.0%
10.0%
11.0%
12.0%
13.0%
1Q
02
3Q
02
1Q
03
3Q
03
1Q
04
3Q
04
1Q
05
3Q
05
1Q
06
3Q
06
1Q
07
3Q
07
1H
08
1H
09
4Q
09
2Q
10
4Q
10
2Q
11
4Q
11
2Q
12
4Q
12
2Q
13
4Q
13
2Q
14
4Q
14
2Q
15
4Q
15
2Q
16
4Q
16
2Q
17
4Q
17
2Q
18
4Q
18
2Q
19
4Q
19
2Q
20
4Q
20
2Q
21TD
Middle market and large corporate quarterly average first-lien institutional primary term loan yields (3-year)
Large Corp MM
LIBOR+ Spread+OID (3-year)LIBOR+ Spread
*Due to lack of activity, 2Q20 MM yield level is an estimate assuming a 1.21% MM yield premium (avg. MM premium from 2009-1Q20)
Issuers took advantage of lower yields in 1Q21 to reprice their deals; so far this quarter, yields have widened as more M&A deals have entered the mix
At 4.62% for large corporate issuers and 5.99% in the middle market, 2Q21 primary yields are much lower than pre-pandemic levels
19
Refinitiv LPC Special Report - June 2021
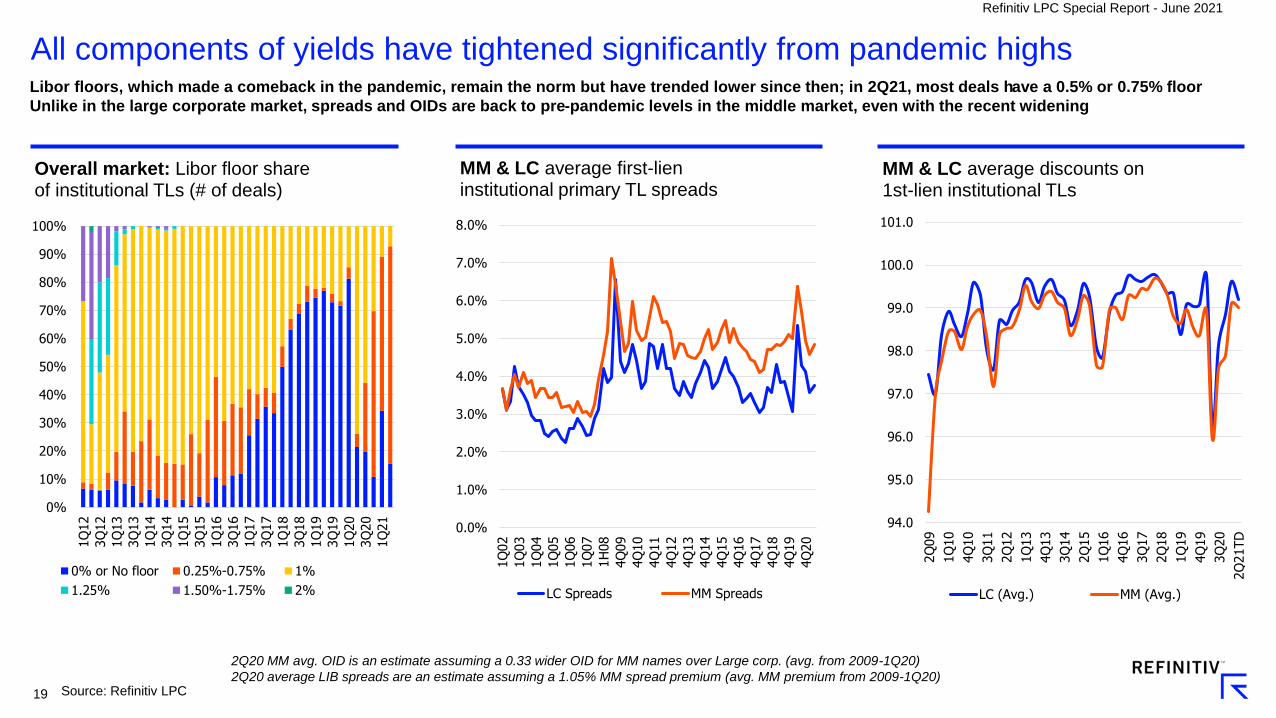
All components of yields have tightened significantly from pandemic highsLibor floors, which made a comeback in the pandemic, remain the norm but have trended lower since then; in 2Q21, most deals have a 0.5% or 0.75% floor
Unlike in the large corporate market, spreads and OIDs are back to pre-pandemic levels in the middle market, even with the recent widening
Source: Refinitiv LPC
0%
10%
20%
30%
40%
50%
60%
70%
80%
90%
100%
1Q
12
3Q
12
1Q
13
3Q
13
1Q
14
3Q
14
1Q
15
3Q
15
1Q
16
3Q
16
1Q
17
3Q
17
1Q
18
3Q
18
1Q
19
3Q
19
1Q
20
3Q
20
1Q
21
Overall market: Libor floor share of institutional TLs (# of deals)
0% or No floor 0.25%-0.75% 1%
1.25% 1.50%-1.75% 2%
0.0%
1.0%
2.0%
3.0%
4.0%
5.0%
6.0%
7.0%
8.0%
1Q
02
1Q
03
1Q
04
1Q
05
1Q
06
1Q
07
1H
08
4Q
09
4Q
10
4Q
11
4Q
12
4Q
13
4Q
14
4Q
15
4Q
16
4Q
17
4Q
18
4Q
19
4Q
20
MM & LC average first-lien institutional primary TL spreads
LC Spreads MM Spreads
94.0
95.0
96.0
97.0
98.0
99.0
100.0
101.0
2Q
09
1Q
10
4Q
10
3Q
11
2Q
12
1Q
13
4Q
13
3Q
14
2Q
15
1Q
16
4Q
16
3Q
17
2Q
18
1Q
19
4Q
19
3Q
20
2Q
21TD
MM & LC average discounts on 1st-lien institutional TLs
LC (Avg.) MM (Avg.)
2Q20 MM avg. OID is an estimate assuming a 0.33 wider OID for MM names over Large corp. (avg. from 2009-1Q20)
2Q20 average LIB spreads are an estimate assuming a 1.05% MM spread premium (avg. MM premium from 2009-1Q20)

20
Refinitiv LPC Special Report - June 2021
There has been only $4.6bn of defaulted institutional loan volume in 2021, down 87% year over year, with just 3 defaults recorded since the end of FebruaryOf the 28 loans downgraded by Moody's, Fitch, S&P and/or DBRS in May, utilities, beverage food and tobacco and REITs were the top sectors
By contrast, May 2020 saw 169 loans downgraded with business services, retail/supermarkets, and automotive as the top 3 sectors
Source: Source: Fitch U.S. Leveraged Loan Default Index, Refinitiv LPC
0%
2%
4%
6%
8%
10%
12%
14%
16%
-
0.5
1.0
1.5
2.0
2.5
3.0
3.5
4.0
4.5
Utilit
ies
Bevera
ge/F
ood
REIT
S
Tech
nolo
gy
Leis
ure
/Ente
rtain
Busi
ness
Serv
ices
Reta
il/Superm
ark
ets
Serv
ices
Tele
com
Whole
sale
Fin
anci
al Serv
ices
Manufa
cturing
Media
May 2021: Top Sectors of Downgraded Loans*, U.S. Issuers by count & share
No. of downgradedloans within each sector
Share (%)
0.0%
0.5%
1.0%
1.5%
2.0%
2.5%
3.0%
3.5%
4.0%
4.5%
5.0%
-
2.0
4.0
6.0
8.0
10.0
12.0
14.0
16.0
Jan-1
9
Feb-1
9
Mar-
19
Apr-
19
May-1
9
Jun-1
9
Jul-19
Aug-1
9
Sep-1
9
Oct
-19
Nov-1
9
Dec-
19
Jan-2
0
Feb-2
0
Mar-
20
Apr-
20
May-2
0
Jun-2
0
Jul-20
Aug-2
0
Sep-2
0
Oct
-20
Nov-2
0
Dec-
20
Jan-2
1
Feb-2
1
Mar-
21
Apr-
21
May-2
1
Institutional Leveraged Loan Defaults: Defaulted Par Value (US$bn) and TTM default rate (%)
Par Value of Defaulted Inst Loans TTM Default Rate
*prior 30 days from May 31, 2021

21
Refinitiv LPC Special Report - June 2021
In the US investment grade loan market, activity has been strong all yearHigh-grade lenders were optimistic that 2021 could be a big year, and so far, they were right; YTD volume of US$460bn is 34% higher YOY and 17% ahead of
2019’s pace
Activity in the BBB space, the most suppressed in the IG market during the pandemic, has increased substantially, comprising a high 65% of overall IG volume
Source: Refinitiv LPC
0%
10%
20%
30%
40%
50%
60%
70%
80%
90%
100%
2003
2004
2005
2006
2007
2008
2009
2010
2011
2012
2013
2014
2015
2016
2017
2018
2019
2020
YTD
-21
Investment grade market share by issuer rating
AAA AA A BBB
$0.0
$25.0
$50.0
$75.0
$100.0
$125.0
$150.0
$175.0
$200.0
$225.0
$250.0
$275.0
$300.0
$325.0
$350.0
1Q
03
4Q
03
3Q
04
2Q
05
1Q
06
4Q
06
3Q
07
2Q
08
1Q
09
4Q
09
3Q
10
2Q
11
1Q
12
4Q
12
3Q
13
2Q
14
1Q
15
4Q
15
3Q
16
2Q
17
1Q
18
4Q
18
3Q
19
2Q
20
1Q
21
Quarterly IG volume (US$bn)

22
Refinitiv LPC Special Report - June 2021
High-grade M&A financings, including jumbo deals, return to the foldThe WarnerMedia/Discovery deal totals US$47.5bn in loans, including a US$31.5bn bridge loan, the 8th highest in the US all-time
That deal will push US investment grade M&A volume to over US$100bn this year, on pace for the levels seen in the years before the pandemic
Source: Refinitiv LPC
$0.0
$10.0
$20.0
$30.0
$40.0
$50.0
$60.0
$70.0
$80.0
$90.0
1Q
03
4Q
03
3Q
04
2Q
05
1Q
06
4Q
06
3Q
07
2Q
08
1Q
09
4Q
09
3Q
10
2Q
11
1Q
12
4Q
12
3Q
13
2Q
14
1Q
15
4Q
15
3Q
16
2Q
17
1Q
18
4Q
18
3Q
19
2Q
20
1Q
21
Quarterly IG M&A volume (US$bn)
WarnerMedia/Discovery IG M&A issuance ($bn)
Rank BorrowerBridge Loan
Size ($bn)Year
1 Verizon Communications $61.00 2013
2 CVS $49.00 2017
3 AT&T $40.00 2016
4 Abbvie $38.00 2019
5 Walt Disney Co* $35.70 2018
6 Allergan Plc/Actavis Plc $35.60 2014
7 Bristol Myers Squibb $33.50 2019
8 WarnerMedia/Discovery $31.50 2021
9 Cigna Corp $23.70 2018
10 Anthem Inc $22.50 2015
Largest US IG bridge loans

23
Refinitiv LPC Special Report - June 2021
Investment grade tenors and pricing are back to or nearing pre-pandemic levelsThe five-year tenor market has returned, comprising an over 50% share of revolver volume after 364-day terms became the popular go-to in 2020
Spreads for A-rated names have returned to the 95bp area on average while BBB spread averages have come down considerably compared to last year
Source: Refinitiv LPC
70.0
80.0
90.0
100.0
110.0
120.0
130.0
140.0
150.0
160.0
170.0
180.0
1Q
12
3Q
12
1Q
13
3Q
13
1Q
14
3Q
14
1Q
15
3Q
15
1Q
16
3Q
16
1Q
17
3Q
17
1Q
18
3Q
18
1Q
19
3Q
19
1Q
20
3Q
20
1Q
21
Average drawn investment grade spreads (bps)
A BBB
0%
10%
20%
30%
40%
50%
60%
70%
80%
1Q
12
3Q
12
1Q
13
3Q
13
1Q
14
3Q
14
1Q
15
3Q
15
1Q
16
3Q
16
1Q
17
3Q
17
1Q
18
3Q
18
1Q
19
3Q
19
1Q
20
3Q
20
1Q
21
Share of IG revolver volume across tenor
364-Day Facility 3-year 4-year 5-year

24
Refinitiv LPC Special Report - June 2021
Americas green & ESG loan activity officially takes off, jumping over 4.5x year-over-year; YTD global green & ESG loan volume already exceeds full year 2020 totals; Over US$22bn of ESG linked institutional loan volume has hit the global loan mart so far this year
0
50
100
150
200
250
300
350
0.0
25.0
50.0
75.0
100.0
125.0
150.0
175.0
200.0
225.0
250.0
2017
2018
2019
2020
YTD
2021
Global Green & ESG loan volume (US$bn)
Americas APAC EMEA Deal Count
Source: Refinitiv, Refinitiv LPC
0.0
0.5
1.0
1.5
2.0
2.5
Fle
nder
Sta
rk
Asd
a
Klo
ckner
Ple
nta
pla
st
Els
an
Quantu
m B
idco
Euro
Eth
nic
Foods
Bid
co S
AS
Ahls
ell
AB
Ahls
ell
AB
Gro
upe G
org
e S
A
Belron I
nte
rnational Ltd
Belron I
nte
rnational Ltd
EW
T H
old
ings
III
Corp
Cere
lia S
AS
UPC B
roadband H
old
ing B
V
UPC B
roadband H
old
ing B
V
Logopla
ste C
onsu
ltore
s…
Logopla
ste C
onsu
ltore
s…
Ram
say G
enera
le D
e S
ante
SA
Cerb
a H
ealthCare
SAS
Mehila
inen O
y
Sante
Cie
SASU
ESG Linked Institutional loan volume(US$bn)

25
Refinitiv LPC Special Report - June 2021
Syndicated US middle market activity has been stronger this quarter with over $33bn of completed volume tracked through early June
0.0
10.0
20.0
30.0
40.0
50.0
60.0
70.0
1Q
10
3Q
10
1Q
11
3Q
11
1Q
12
3Q
12
1Q
13
3Q
13
1Q
14
3Q
14
1Q
15
3Q
15
1Q
16
3Q
16
1Q
17
3Q
17
1Q
18
3Q
18
1Q
19
3Q
19
1Q
20
3Q
20
1Q
21
US syndicated middle market loan issuance (US$bn)
Source: Refinitiv LPC
Middle market definition: issuers with revenues of $500M and below and a total loan package of $500M and below* Syndicated: facilities syndicated to at least one participant up to $500M in deal size or clubbed up to $150M in deal size
2Q21 volume is on pace to be the highest level since the onset of the pandemic
There has been more institutional middle market volume as well, over US$8bn so far this quarter, which is on pace for the highest level since 3Q19
-
2.0
4.0
6.0
8.0
10.0
12.0
14.0
16.0
18.0
20.0
1Q
10
3Q
10
1Q
11
3Q
11
1Q
12
3Q
12
1Q
13
3Q
13
1Q
14
3Q
14
1Q
15
3Q
15
1Q
16
3Q
16
1Q
17
3Q
17
1Q
18
3Q
18
1Q
19
3Q
19
1Q
20
3Q
20
1Q
21
US syndicated middle market institutional Issuance (US$bn)

26
Refinitiv LPC Special Report - June 2021
Syndicated middle market M&A activity has been a driver of loan volume, with over US$9bn used for M&A purposes so far this quarter
Source: Refinitiv LPC
2021 middle market M&A loan activity has been more focused on business services and technology issuers compared with pre-pandemic
0%
5%
10%
15%
20%
25%
30%
35%
Healthca
re
Busi
ness
Serv
ices
Serv
ices
Tech
nolo
gy
Manufa
cturing
Whole
sale
Oil/
Gas
Busi
ness
Serv
ices
Healthca
re
Tech
nolo
gy
Serv
ices
Whole
sale
Manufa
cturing
Chem
icals
/Pla
stic
s
Busi
ness
Serv
ices
Tech
nolo
gy
Healthca
re
Manufa
cturing
Serv
ices
Whole
sale
Bevera
ge/F
ood
Top Sectors: Share of Syndicated Middle Market M&A Volume
Share of MM M&A volume
2020 YTD-212019
0.0
2.0
4.0
6.0
8.0
10.0
12.0
14.0
16.0
18.0
1Q
10
3Q
10
1Q
11
3Q
11
1Q
12
3Q
12
1Q
13
3Q
13
1Q
14
3Q
14
1Q
15
3Q
15
1Q
16
3Q
16
1Q
17
3Q
17
1Q
18
3Q
18
1Q
19
3Q
19
1Q
20
3Q
20
1Q
21
Middle market M&A loan volume (US$bn)

27
Refinitiv LPC Special Report - June 2021
Middle market loan fundraising remains consistently strongRefinitiv LPC has tracked roughly $43bn in YTD US middle market fundraising through the end of May, after over US$100bn was raised in 2020
More sponsors have found the ease of execution in the direct lending market more favorable, leading that market to see around two times more volume
compared to the syndicated market over the last six quarters
Source: Refinitiv LPC
0.0
5.0
10.0
15.0
20.0
25.0
30.0
35.0
40.0
45.0
50.0
1Q
14
2Q
14
3Q
14
4Q
14
1Q
15
2Q
15
3Q
15
4Q
15
1Q
16
2Q
16
3Q
16
4Q
16
1Q
17
2Q
17
3Q
17
4Q
17
1Q
18
2Q
18
3Q
18
4Q
18
1Q
19
2Q
19
3Q
19
4Q
19
1Q
20
2Q
20
3Q
20
4Q
20
1Q
21
2Q
21-T
D
Quarterly: Middle market loan fundraising (US$bn)
MM CLO BDC Public Equity Private Debt Funds Mezzanine
0.0x
0.5x
1.0x
1.5x
2.0x
2.5x
3.0x
1Q
15
2Q
15
3Q
15
4Q
15
1Q
16
2Q
16
3Q
16
4Q
16
1Q
17
2Q
17
3Q
17
4Q
17
1Q
18
2Q
18
3Q
18
4Q
18
1Q
19
2Q
19
3Q
19
4Q
19
1Q
20
2Q
20
3Q
20
4Q
20
1Q
21
MM Direct Lending Sponsored Volume relative to Syndicated MM Sponsored volume (x:1)
Direct Lending MM Sponsored Issuance/ Syndicated MM SponsoredIssuance

28
Refinitiv LPC Special Report - June 2021
US unitranche volume scored a record in 1Q21 as larger uni deals returnLarge corporate unitranche deals bounced back in 1Q21, and in April, Calypso Technology obtained a US$2.3bn unitranche loan as part of its LBO financing
Delay-draw term loans have become more popular to include in direct lending loan structures, sometimes for a specific acquisition in mind, or to back an
overall strategy that includes potential tack-on acquisitions
Source: Refinitiv LPC
*Includes both large corp. and middle market unitranches Refinitiv LPC relies on lenders to flag deals as unitranchesRefinitiv LPC also looks at a combination of spread (in conjunction with EBITDA size), leverage and loan-to-value (LTV) to flag unitranchesMiddle market is for issuers with a deal size and revenue size of $500M and below. Large corp. is either deal size or revenue size > $500M
0%
2%
4%
6%
8%
10%
12%
14%
16%
0.0
1.0
2.0
3.0
4.0
5.0
6.0
1Q
14
2Q
14
3Q
14
4Q
14
1Q
15
2Q
15
3Q
15
4Q
15
1Q
16
2Q
16
3Q
16
4Q
16
1Q
17
2Q
17
3Q
17
4Q
17
1Q
18
2Q
18
3Q
18
4Q
18
1Q
19
2Q
19
3Q
19
4Q
19
1Q
20
2Q
20
3Q
20
4Q
20
1Q
21
MM Delay Draw Term Loan Volume (US$bn)
Direct DDTL Syndicated DDTL % of volume
% of issuance
0
50
100
150
200
250
300
350
0.0
2.0
4.0
6.0
8.0
10.0
12.0
14.0
16.0
18.0
20.0
1H
14
3Q
14
4Q
14
1Q
15
2Q
15
3Q
15
4Q
15
1Q
16
2Q
16
3Q
16
4Q
16
1Q
17
2Q
17
3Q
17
4Q
17
1Q
18
2Q
18
3Q
18
4Q
18
1Q
19
2Q
19
3Q
19
4Q
19
1Q
20
2Q
20
3Q
20
4Q
20
1Q
21
2Q
21-T
D
Avg. Loan D
eal Siz
e (
$M
ils.)
Unitra
nch
e V
olu
me (
$B.)
Quarterly US Unitranche Volume (US$bn)*
Middle Market Large. Corp. Avg. Deal Size

29
BDC originations saw the two highest levels on record in 4Q20 and 1Q21
Refinitiv LPC Special Report - June 2021
Source: Refinitiv’s BDC Collateral & Wells Fargo Securities, LLC
Note: Origination analysis includes bulk of the public BDCs and a few of the bigger private BDCs, roughly 45 names in the cohort
0.30
0.35
0.40
0.45
0.50
0.55
0.60
0.65
0.70
0.75
0.80
0.85
0.90
0.95
1.00
1.05
1.10
1.15
1.20
5/1
1/2
011
5/1
1/2
012
5/1
1/2
013
5/1
1/2
014
5/1
1/2
015
5/1
1/2
016
5/1
1/2
017
5/1
1/2
018
5/1
1/2
019
5/1
1/2
020
5/1
1/2
021
BDC share price to Net Asset Value (per share)*
-60%
-40%
-20%
0%
20%
40%
60%
2005
2006
2007
2008
2009
2010
2011
2012
2013
2014
2015
2016
2017
2018
2019
2020
YTD
2021
Cross asset returns %
Wells Fargo BDC Index S&P/LSTA Index S&P500
-
2.0
4.0
6.0
8.0
10.0
12.0
14.0
16.0
18.0
4Q
13
2Q
14
4Q
14
2Q
15
4Q
15
2Q
16
4Q
16
2Q
17
4Q
17
2Q
18
4Q
18
2Q
19
4Q
19
2Q
20
4Q
20
Quarterly BDC origination volume (US$bn)
Originations
BDC share price to NAV recently rose above 1x for the first time since 2017; by contrast, that average bottomed out at 0.39x in March 2020
Looking at cross asset returns shows the Wells Fargo BDC Index is returning over 30% so far this year, well above the S&P/LSTA Index and S&P500 returns

30
Why choose BDC Collateral?BDC Collateral provides a standardized view of the BDC asset
class, arming CFOs within BDC managers, research analysts,
investors, and valuation firms with news, data and analytical insights on nearly 100 public and private BDCs.
That data is enhanced with exclusive analysis from across the
universe of Refinitiv and LPC offerings, including Refinitiv™ Loan
Connector®, DealScan, LPC Collateral, Eikon and the LSTA/Refinitiv Mark-to-Market Pricing Service.
Use BDC Collateral to view the underlying assets of BDCs and
track exposures by many different metrics.
BDC Collateral is your one-stop source for critical analysis and
insights including:
• BDC-level news
• Links to Investor earnings calls and special events
• Institutional equity ownership for each BDC
• Web links to borrower and manager sites and BDC filings
• Current/historical industry and financial product concentrations
• Market-level news
• Asset-level secondary loan pricing (where available)
• Historical and special dividends
• Broker recommendations and reports
• Competitor/peer comparison analysis
BDC COLLATERALThe one-stop resource for analyzing BDCs, holdings and performance
For more information
loanpricing.com
bdccollateral.com
View an introductory BDC Collateral video here!

31
Refinitiv LPC’s US Analyst Team
David Puchowski
Director of Market Analysis
Diana Diquez
Contributor Relations Manager
Hugo Pereira
Director of Market Analysis
Elizabeth Han
Director of Market Analysis
Ioana Barza
Head of Market Analysis
Maria C. Dikeos
Head of Global Loans
Contributions
Jordan Ruck
Market Analyst
Alp Zavaro
Market Analyst
David Miao
Contributor Relations Manager
Bryan Diaz
Deals Contribution Analyst

32
Refinitiv Copyright Notice
©2021 Refinitiv. All rights reserved. The Refinitiv content received through
this service is the intellectual property of Refinitiv or its third-party
suppliers. Republication or redistribution of content provided by Refinitiv is
expressly prohibited without the prior written consent of Refinitiv, except
where permitted by the terms of the relevant Refinitiv service agreement.
Neither Refinitiv nor its third-party suppliers shall be liable for any errors,
omissions or delays in content, or for any actions taken in reliance
thereon. Contact Refinitiv at [email protected]