u.s. international trade commission · united states international trade commission washington, dc...
TRANSCRIPT

Address all communications toSecretary to the Commission
United States International Trade CommissionWashington, DC 20436
U.S. International Trade Commission
COMMISSIONERS
David B. Rohr
Peter S. Watson, Chairman
Janet A. Nuzum, Vice Chairman
Carol T. CrawfordDon E. Newquist
Robert A. RogowskyDirector of Operations
Lynn M. Bragg

U.S. International Trade Commission
Washington, DC 20436
Publication 2927 September 1995
Caribbean Basin Economic Recovery Act:Impact on U.S. Industries and Consumers
Tenth Report1994
Investigation No. 332–227

Acting Director of Economics
This report was prepared principally by
Project Leader
Thomas F. Jennings
Assistant Project Leader
James E. Stamps
Paul R. Gibson
Constance Hamilton
Magdolna Kornis
Walker Pollard
Sandra A. Rivera
Dean M. Moore, Information Specialist
Office of Industries
Joan Gallagher
Lee E. Frankel
Andrew Malison
Gregory J. Schneider
Office of Information Services
Statistical and Editorial Services Division
Steven K. Hudgens, Statistician
H. Clifford Brown, Editor
Supporting assistance was provided by
Paula R. Wells, Secretarial services
Acting Chief, Trade Reports Division
Chief, Major Trading Nations Branch
Kim S. Frankena
Robert A. Rogowsky

i
PREFACE
The submission of this study to the Congress and to the President continues a series of annualreports by the U.S. International Trade Commission (Commission) on the impact of the CaribbeanBasin Economic Recovery Act (CBERA) on U.S. industries and consumers. Under section 215(a) ofthe act, the Commission must report annually on the operation of the program. The present studyfulfills the requirement for calendar year 1994, the 11th year of program operation.
The CBERA, enacted on August 5, 1983 (Public Law 98–67, title II), authorized the President toproclaim duty–free treatment for eligible articles from designated Caribbean Basin countries.Duty–free treatment became effective January 1, 1984. Section 215 of the act requires theCommission to assess actual and probable future effects of CBERA on the U.S. economy generally, onU.S. industries producing like products or products directly competitive with those imported frombeneficiary countries, and on U.S. consumers. It requires the Commission to submit its report to thePresident and the Congress by September 30 of each year.
The Commission is an independent factfinding agency. Statements made in this report do notnecessarily reflect the views of executive branch agencies and, unless cited as such, should not betaken as official statements of U.S. trade policy. Because this report was completed independently ofany other work conducted by the Commission, nothing in it should be construed to indicate what theCommission’s determination would be, should an investigation be conducted under another statutoryauthority.

ii

iii
TABLE OF CONTENTS
����
Preface i. . . . . . . . . . . . . . . . . . . . . . . . . . . . . . . . . . . . . . . . . . . . . . . . . . . . . . . . . . . . . . . . . . . . . . . . . . . . .
Executive Summary v. . . . . . . . . . . . . . . . . . . . . . . . . . . . . . . . . . . . . . . . . . . . . . . . . . . . . . . . . . . . . . . .
Chapter 1. Introduction 1. . . . . . . . . . . . . . . . . . . . . . . . . . . . . . . . . . . . . . . . . . . . . . . . . . . . . . . . . . . . Approach 1. . . . . . . . . . . . . . . . . . . . . . . . . . . . . . . . . . . . . . . . . . . . . . . . . . . . . . . . . . . . . . . . . . . . . . . . . . Organization 2. . . . . . . . . . . . . . . . . . . . . . . . . . . . . . . . . . . . . . . . . . . . . . . . . . . . . . . . . . . . . . . . . . . . . . . Overview of the CBERA program 2. . . . . . . . . . . . . . . . . . . . . . . . . . . . . . . . . . . . . . . . . . . . . . . . . . . . . .
Beneficiaries 2. . . . . . . . . . . . . . . . . . . . . . . . . . . . . . . . . . . . . . . . . . . . . . . . . . . . . . . . . . . . . . . . . . . Trade benefits under CBERA 2. . . . . . . . . . . . . . . . . . . . . . . . . . . . . . . . . . . . . . . . . . . . . . . . . . . . . . Qualifying rules 3. . . . . . . . . . . . . . . . . . . . . . . . . . . . . . . . . . . . . . . . . . . . . . . . . . . . . . . . . . . . . . . . . CBERA and GSP 5. . . . . . . . . . . . . . . . . . . . . . . . . . . . . . . . . . . . . . . . . . . . . . . . . . . . . . . . . . . . . . . .
Chapter 2. U.S. Trade with the Caribbean Basin 7. . . . . . . . . . . . . . . . . . . . . . . . . . . . . . . . . . . Two-way trade 7. . . . . . . . . . . . . . . . . . . . . . . . . . . . . . . . . . . . . . . . . . . . . . . . . . . . . . . . . . . . . . . . . . . . . Imports 8. . . . . . . . . . . . . . . . . . . . . . . . . . . . . . . . . . . . . . . . . . . . . . . . . . . . . . . . . . . . . . . . . . . . . . . . . . .
Imports from CBERA-country groups 8. . . . . . . . . . . . . . . . . . . . . . . . . . . . . . . . . . . . . . . . . . . . . . . Product composition of total imports 10. . . . . . . . . . . . . . . . . . . . . . . . . . . . . . . . . . . . . . . . . . . . . . . .
Dutiable and special-duty imports 10. . . . . . . . . . . . . . . . . . . . . . . . . . . . . . . . . . . . . . . . . . . . . . . . . . . Dutiable imports 12. . . . . . . . . . . . . . . . . . . . . . . . . . . . . . . . . . . . . . . . . . . . . . . . . . . . . . . . . . . . . Textiles and apparel 13. . . . . . . . . . . . . . . . . . . . . . . . . . . . . . . . . . . . . . . . . . . . . . . . . . . . . . . . . .
Duty-free imports 15. . . . . . . . . . . . . . . . . . . . . . . . . . . . . . . . . . . . . . . . . . . . . . . . . . . . . . . . . . . . . . . Imports under CBERA 15. . . . . . . . . . . . . . . . . . . . . . . . . . . . . . . . . . . . . . . . . . . . . . . . . . . . . . . . CBERA imports by source 16. . . . . . . . . . . . . . . . . . . . . . . . . . . . . . . . . . . . . . . . . . . . . . . . . . . . .
Chapter 3. Impact of CBERA on the United States in 1994 27. . . . . . . . . . . . . . . . . . . . . . . . Products that benefited exclusively from CBERA in 1994 27. . . . . . . . . . . . . . . . . . . . . . . . . . . . . . . . . . . Welfare effects of CBERA on U.S. industries and consumers in 1994 29. . . . . . . . . . . . . . . . . . . . . . . . . .
Analytical approach 29. . . . . . . . . . . . . . . . . . . . . . . . . . . . . . . . . . . . . . . . . . . . . . . . . . . . . . . . . . . . . . Items analyzed 30. . . . . . . . . . . . . . . . . . . . . . . . . . . . . . . . . . . . . . . . . . . . . . . . . . . . . . . . . . . . . . . . . . Welfare effects and the displacement of domestic output 32. . . . . . . . . . . . . . . . . . . . . . . . . . . . . . . . .
Highlights of U.S. industries most affected by CBERA in 1994 32. . . . . . . . . . . . . . . . . . . . . . . . . . . . . . Cigars, cheroots, and cigarillos 32. . . . . . . . . . . . . . . . . . . . . . . . . . . . . . . . . . . . . . . . . . . . . . . . . . . . . Electrical wirewound variable resistors for a power-handling capacity not exceeding 20 watts 34. . . . . . . . . . . . . . . . . . . . . . . . . . . . . . . . . . . . . . . . . . . . . . . . . . Fresh pineapples 35. . . . . . . . . . . . . . . . . . . . . . . . . . . . . . . . . . . . . . . . . . . . . . . . . . . . . . . . . . . . . . . .
Chapter 4. Probable Future Effects of CBERA 37. . . . . . . . . . . . . . . . . . . . . . . . . . . . . . . . . . . . Summary of investment activities and trends 37. . . . . . . . . . . . . . . . . . . . . . . . . . . . . . . . . . . . . . . . . . . . . .
Methodology 38. . . . . . . . . . . . . . . . . . . . . . . . . . . . . . . . . . . . . . . . . . . . . . . . . . . . . . . . . . . . . . . . . . . New CBERA-related investment in 1994 39. . . . . . . . . . . . . . . . . . . . . . . . . . . . . . . . . . . . . . . . . . . . .
Costa Rica 40. . . . . . . . . . . . . . . . . . . . . . . . . . . . . . . . . . . . . . . . . . . . . . . . . . . . . . . . . . . . . . . . . Guatemala 40. . . . . . . . . . . . . . . . . . . . . . . . . . . . . . . . . . . . . . . . . . . . . . . . . . . . . . . . . . . . . . . . . . Honduras 40. . . . . . . . . . . . . . . . . . . . . . . . . . . . . . . . . . . . . . . . . . . . . . . . . . . . . . . . . . . . . . . . . . Jamaica 40. . . . . . . . . . . . . . . . . . . . . . . . . . . . . . . . . . . . . . . . . . . . . . . . . . . . . . . . . . . . . . . . . . . . The Bahamas 41. . . . . . . . . . . . . . . . . . . . . . . . . . . . . . . . . . . . . . . . . . . . . . . . . . . . . . . . . . . . . . . El Salvador 41. . . . . . . . . . . . . . . . . . . . . . . . . . . . . . . . . . . . . . . . . . . . . . . . . . . . . . . . . . . . . . . . . Panama 41. . . . . . . . . . . . . . . . . . . . . . . . . . . . . . . . . . . . . . . . . . . . . . . . . . . . . . . . . . . . . . . . . . . . Belize 41. . . . . . . . . . . . . . . . . . . . . . . . . . . . . . . . . . . . . . . . . . . . . . . . . . . . . . . . . . . . . . . . . . . . .
Effect of NAFTA on CBERA-country trade and investment in 1994 41. . . . . . . . . . . . . . . . . . . . . . . .
iv
TABLE OF CONTENTS —Continued
����
Chapter 4. Probable Future Effects of CBERA—Cont.Country profile: Trinidad and Tobago 42. . . . . . . . . . . . . . . . . . . . . . . . . . . . . . . . . . . . . . . . . . . . . . . . . . .
Economic and trade performance 43. . . . . . . . . . . . . . . . . . . . . . . . . . . . . . . . . . . . . . . . . . . . . . . . Investment climate 44. . . . . . . . . . . . . . . . . . . . . . . . . . . . . . . . . . . . . . . . . . . . . . . . . . . . . . . . . . . Investment activity 44. . . . . . . . . . . . . . . . . . . . . . . . . . . . . . . . . . . . . . . . . . . . . . . . . . . . . . . . . . .
AppendicesA. List of submissions in response to Federal Register notice A-1. . . . . . . . . . . . . . . . . . . . . . . . . . . . . . . . B. Technical notes to chapter 3 B-1. . . . . . . . . . . . . . . . . . . . . . . . . . . . . . . . . . . . . . . . . . . . . . . . . . . . . . .
Figures2-1. Composition of leading CBERA duty-free imports, 1994 18. . . . . . . . . . . . . . . . . . . . . . . . . . . . . . . . B-1. Partial equilibrium analysis of the effects of CBERA duty provisions on U.S. imports B-3. . . . . . . . .
Tables1-1. Summary of CBERA trade provisions 4. . . . . . . . . . . . . . . . . . . . . . . . . . . . . . . . . . . . . . . . . . . . . . . 2-1. U.S. trade with CBERA countries, 1984-94 7. . . . . . . . . . . . . . . . . . . . . . . . . . . . . . . . . . . . . . . . . . . 2-2. U.S. imports for consumption from CBERA countries, by major groups, 1990-94 9. . . . . . . . . . . . . 2-3. Leading U.S. imports for consumption from CBERA countries, 1990-94 11. . . . . . . . . . . . . . . . . . . . 2-4. U.S. imports for consumption from CBERA countries: Dutiable value, calculated
duties, and average duty, 1984 and 1992-94 12. . . . . . . . . . . . . . . . . . . . . . . . . . . . . . . . . . . . . . . 2-5. U.S. imports for consumption from CBERA countries of specific goods not
eligible for CBERA duty–free entry, 1990-94 12. . . . . . . . . . . . . . . . . . . . . . . . . . . . . . . . . . . . . . 2-6. U.S. imports for consumption from CBERA countries of goods not eligible
for CBERA duty–free entry, 1984-94 13. . . . . . . . . . . . . . . . . . . . . . . . . . . . . . . . . . . . . . . . . . . . 2-7. U.S. imports for consumption from CBERA countries, by duty treatment, 1992-94 14. . . . . . . . . . . . 2-8. Leading U.S. imports for consumption under CBERA provisions, 1992-94 17. . . . . . . . . . . . . . . . . . 2-9. U.S. imports for consumption: CBERA eligibility and utilization, 1990-94 18. . . . . . . . . . . . . . . . . . 2-10. U.S. imports for consumption under CBERA provisions, by sources, 1990-94 19. . . . . . . . . . . . . . . . 2-11. Leading U.S. imports for consumption entering under CBERA provisions,
by sources, 1994 20. . . . . . . . . . . . . . . . . . . . . . . . . . . . . . . . . . . . . . . . . . . . . . . . . . . . . . . . . . . . . 3-1. Customs value of products that benefited from CBERA duty elimination and reduced
duties, 1992-94 28. . . . . . . . . . . . . . . . . . . . . . . . . . . . . . . . . . . . . . . . . . . . . . . . . . . . . . . . . . . . . . 3-2. Value of leading imports that benefited exclusively from CBERA duty
provisions in 1994 29. . . . . . . . . . . . . . . . . . . . . . . . . . . . . . . . . . . . . . . . . . . . . . . . . . . . . . . . . . . 3-3. Leading imports that benefited exclusively from CBERA, apparent U.S. consumption,
and market shares, by HTS items, 1994 31. . . . . . . . . . . . . . . . . . . . . . . . . . . . . . . . . . . . . . . . . . . 3-4. Estimated net welfare impact on the United States of leading
imports that benefited exclusively from CBERA, 1994 33. . . . . . . . . . . . . . . . . . . . . . . . . . . . . . 4-1. Reported investment projects in CBERA countries, 1994 39. . . . . . . . . . . . . . . . . . . . . . . . . . . . . . . . 4-2. Reported investment activity in CBERA countries, 1994 39. . . . . . . . . . . . . . . . . . . . . . . . . . . . . . . . .

v
EXECUTIVE SUMMARY
The Caribbean Basin Economic Recovery Act (CBERA) has been operative since January 1,1984. CBERA eliminates, or in some cases reduces, tariffs on eligible products of designatedCaribbean, Central American, and South American countries. The primary goal of CBERA is topromote export–oriented growth in the Caribbean Basin countries and to diversify their economiesaway from traditional agricultural products and raw materials such as aluminum, bananas, coffee,petroleum, and sugar. CBERA applies to the same tariff categories covered by the more restrictiveU.S. Generalized System of Preferences (GSP) program. CBERA benefits extend beyond those ofGSP by applying to additional products and by establishing more liberal product qualifying rules.
Section 215 of the statute requires the U.S. International Trade Commission (the Commission) toprepare an annual report reviewing actual and probable future effects of CBERA on the U.S. economygenerally, on U.S. industries, and on U.S. consumers. Highlights of the Commission’s 10th annualreport on CBERA for the year 1994 follow:
� U.S. merchandise imports from the 24 countries designated as beneficiaries of CBERA (referredto herein as CBERA countries) totaled $11.2 billion in 1994, or 1.7 percent of U.S. importsworldwide. Although apparel articles are generally not eligible for duty–free or reduced–dutytreatment, they continued to lead the list of all imports from CBERA countries in 1994. Thisseries of reports has documented the shift in the product mix of U.S. imports from the CaribbeanBasin countries during the CBERA years from lower–duty items such as petroleum products infavor of more higher–duty light manufactures such as apparel and other textile products.Reflecting this shift in product mix is the increase in U.S. tariff revenue from imports fromCBERA countries (as indicated by “calculated duties”) to $429.5 million in 1994 compared with$378.9 million in 1993 and only $75.3 million in 1984.
� Imports entered duty–free and at reduced duties under CBERA in 1994 totaled just over $2.0billion, or 18.3 percent of imports from the CBERA countries. CBERA duty–free imports in 1994were a record high $2.0 billion and CBERA reduced–duty imports were $32 million. Incomparison, GSP duty–free imports from the CBERA countries were just $376 million in 1994.
� Two countries, the Dominican Republic and Costa Rica, continued to lead all countries in takingadvantage of CBERA. These two countries combined have accounted for more than one–half ofoverall annual U.S. imports under CBERA since 1989. The Dominican Republic was the topsupplier of leather footwear uppers and jewelry of precious metal—the leading CBERA imports.The leading imports from Costa Rica were jewelry of precious metal and frozen beef.
� Of the $2.0 billion worth of U.S. imports that entered under CBERA in 1994, only $943 million ofthose imports could not have received tariff preferences under any other program. The fiveleading import items benefiting exclusively from CBERA in 1994 were leather footwear uppers,beef, medical and surgical instruments, hot–rolled bars and rods, and ethyl alcohol.
� The overall effect of CBERA-exclusive imports on the U.S. economy and consumers continued tobe negligible in 1994, although a few U.S. industries were measurably affected. The Commissionused a partial–equilibrium analysis to produce “upper bound” estimates of these effects. Importsof the 20 leading items, except sugar, (measured at 8–digit subheadings of the Harmonized TariffSchedule of the United States) benefiting exclusively from CBERA in 1994 produced net welfare

vi
gains for U.S. consumers. Ethyl alcohol yielded the largest such net gain, valued at $14.2 million,followed by leather footwear uppers, medical and surgical instruments, frozen beef, and frozenconcentrated orange juice. Displacement of U.S. output by CBERA imports also was measuredusing upper bound estimates. Industries that may have experienced displacement of more than anestimated 5 percent of the value of U.S. production were: higher–priced cigars (9.9 percent ofdomestic shipments displaced, valued at $2.5 million); variable resistors (9.4 percentdisplacement, valued at $581,000); and fresh pineapples (8.2 percent displacement, valued at $4.3million).
� Drawing largely on direct observation and reports from U.S. embassies, the Commissionidentified 14 new projects and 24 expansion projects for CBERA–related export–orientedproduction in 1994 involving capital outlays totaling $42.6 million. Several individualscontacted during the course of this investigation expressed concern that U.S. trade with andinvestment in CBERA countries would decline as a result of increased trade between the UnitedStates and Mexico under the North American Free Trade Agreement (NAFTA). Through stafftravel to Trinidad and Tobago, the Commission identified significant new foreign directinvestment in that country during 1994 including confirmed CBERA–related projects valued at$4 million. Industries identified as having the most CBERA–related export opportunities inTrinidad and Tobago included tropical cut flowers, spices, furniture, and products made fromnative fruits.

1
CHAPTER 1Introduction
The United States launched the Caribbean BasinInitiative (CBI) in 1982 to promote political andsocial stability in the Caribbean (including CentralAmerican) region.1 The CBI encompasses a numberof public- and private-sector programs that aim topromote increased foreign and domestic investment innontraditional sectors of the Caribbean Basincountries,2 to diversify their economies, and to expandtheir exports.
The CBI included the bill enacted as theCaribbean Basin Economic Recovery Act (CBERA).The CBERA contains provisions for the United Statesto extend nonreciprocal duty-free treatment to mostproducts of designated Caribbean countries. TheCBERA was enacted on August 5, 1983, and enteredinto force on January 1, 1984.3 As of yearend 1994,24 countries were designated CBERA beneficiaries(CBERA countries).4
This report fulfills a statutory mandate under theCBERA, which requires the U.S. International TradeCommission (the Commission) to report annually onthe operation of the CBERA program and its impact
1 President, “Address Before the Permanent Councilof the Organization of American States,” WeeklyCompilation of Presidential Documents: Administration ofRonald Reagan, vol. 18, No. 8 (Mar. 1, 1982), pp. 217-223.
2 Traditional products of the Caribbean Basincountries include bananas, bauxite and aluminum ores,coffee, and rum. Nontraditional products include suchproducts as apparel, seafood, winter vegetables, and woodfurniture.
3 Public Law 98-67, Title II, 97 Stat. 384, 19 U.S.C.2701 et seq. Relatively minor amendments to the CBERAwere made by Public Laws 98-573, 99-514, 99-570, and100-418.
4 Those countries were: Antigua and Barbuda, Aruba,The Bahamas, Barbados, Belize, British Virgin Islands,Costa Rica, Dominica, the Dominican Republic, ElSalvador, Grenada, Guatemala, Guyana, Haiti, Honduras,Jamaica, Montserrat, Netherlands Antilles, Nicaragua,Panama, St. Kitts and Nevis, St. Lucia, St. Vincent andthe Grenadines, and Trinidad and Tobago.
on U.S. industry, consumers, and the economy ingeneral. The report, the 10th in the series, coverscalendar year 1994. It focuses on U.S. imports underthe CBERA program from the 24 beneficiarycountries.
As of September 26, 1995, legislation waspending in the House of Representatives that wouldrepeal the Commission’s reporting requirement. Thebill, H.R. 1887, was reported out of the Committee onWays and Means on June 27, 1995, and sent to theHouse floor. Also as of September 26, 1995, nocompanion legislation had been introduced in theSenate.5
ApproachThe actual effects of CBERA on the U.S.
economy and industries are assessed through ananalysis of imports under the act and trends in U.S.consumption of these imports. General economic,trade, and investment data come from standardreference sources such as Census trade files,investment and other data developed by Federalagencies that administer and monitor the program, andmaterials developed by commodity and industryanalysts of the Commission. Because availableinvestment data tend to be very limited, staff relied onState Department cables and fieldwork in selectedbeneficiary countries to obtain the necessaryinformation. The report includes comments frompersons interested as a result of the Federal Registernotice.
A quantitative assessment of the effects ofCBERA is made through measurement of the welfareeffect, using a method developed for these reports. Asimilar method has been employed in the first ninereports of the series. The welfare effect has twocomponents: the gain to consumers6 from lower-
5 That reporting requirement is enumerated in section215(a) (19 U.S.C. 2704(a)).
6 Depending on the competitive situation and marketstructure of the particular industry in the United States, allor some portion of the gain will be passed on to endusers, or to intermediate, downstream industries.

2
priced imports and the loss in tariff revenues to theU.S. Treasury.7 A measurement of the potentialdisplacement in domestic shipments as a result ofCBERA imports is also included. The discussion ofprobable future effects of the CBERA is based onanalyses of economic trends and investment patternsin CBERA beneficiaries. This work dependedprincipally on fieldwork by Commission staff and oninformation received from U.S. embassies inbeneficiary countries.
OrganizationThe present chapter provides an overview of the
CBERA program. Chapter 2 presents tables anddescriptions of U.S. trade with CBERA-eligiblecountries during 1994. Chapter 3 addresses the effectsof CBERA in 1994 on the economy, industries, andconsumers of the United States. Chapter 4 examinesthe probable future effects of CBERA throughdiscussions of investment activity in the region and ofthe products most likely to be exported to the UnitedStates in the near future under the CBERA program.Appendix A contains a list of submissions received inresponse to the Commission’s Federal Register noticeof May 25, 1995 by which public comments for thisinvestigation were solicited. Appendix B explains theeconomic model used to derive the findings presentedin chapter 3.
Overview of the CBERAProgram
The CBERA was initially scheduled to remain ineffect for 12 years, through September 30, 1995.However, the Caribbean Basin Economic RecoveryExpansion Act of 1990 (hereinafter “1990 CBERA”)8
repealed this termination date, making the benefitspermanent. Signed into law on August 20, 1990, aspart of the Customs and Trade Act of 1990, the 1990CBERA also expanded the program in manyrespects.9 The following sections summarize CBERAprovisions on beneficiaries and qualifying rules.
7 Losses to producers are not estimated in this report.This is explained further in ch. 3.
8 The Caribbean Basin Economic Recovery ExpansionAct also is commonly referred to as CBEREA, CBERAII, or CBI II.
9 Customs and Trade Act of 1990, Public Law101-382, title II, 104 Stat. 629, 19 U.S.C. 2101 note.
Beneficiaries Section 212(b) of CBERA lists 27 Caribbean,
Central American, and South American countries andterritories as potentially eligible for CBERA benefits,but gives the President the authority to designateeligible beneficiaries, to terminate beneficiary status,and to suspend or limit a country’s CBERA benefitsin certain respects.10 When Aruba gainedindependence from the Netherlands Antilles in 1986,the number of potentially eligible CBERA countriesand territories increased to 28.11 CBERAbeneficiaries are required to afford internationallyrecognized worker rights as defined under the U.S.Generalized System of Preferences (GSP) program.12
To date, CBERA benefits have not been withheldfrom any country on the basis of worker rightsviolations.
Trade Benefits Under CBERAAs a result of the two CBERA acts and of
administrative or legislative enhancements, CBERAcurrently affords preferential rates of duty below themost-favored-nation (MFN) rates13 to most products
10 For specific provisions pertaining to the designationof countries and territories as eligible for CBERAbenefits, see sec. 212(a) of the CBERA. For a moredetailed discussion of these provisions, see U.S.International Trade Commission, Impact of the CaribbeanBasin Economic Recovery Act on U.S. Industries andConsumers, Seventh Report, 1991, (investigation No.332-227), USITC publication 2553, Sept. 1992, p. 1-2.
11 Presidential Proclamation 5458, “To DesignateAruba As a Beneficiary Country for Purposes of theGeneralized System of Preferences and the CaribbeanBasin Economic Recovery Act,” Presidential Documents,Apr. 11, 1986, p. 471.
12 The President may waive this condition if hedetermines that the designation of a particular countrywould be in the economic or security interest of theUnited States, and so reports to Congress. Sec. 212(b),CBERA, as amended. Under the GSP program,internationally recognized worker rights include the rightof association, the right to organize and bargaincollectively, a prohibition on the use of forced orcompulsory labor, a minimum age for the employment ofchildren, and acceptable working conditions regardingminimum wages, hours of work, and occupational safetyand health. Sec. 502(a)(4), Trade Act of 1974, title V(Public Law 93-618, 88 Stat. 2066 and following).
13 The United States affords MFN tariff treatment toall CBERA countries under U.S. domestic law inaccordance with U.S. international obligations under theGeneral Agreement on Tariffs and Trade (GATT) or otheragreements. MFN tariff rates are set forth in column 1 ofthe Harmonized Tariff Schedule of the United States(HTS). The column 1—general duty rates are, for the

3
of Caribbean Basin countries by reducing the tariffrate to free or, for a small group of products, byestablishing tariff rates below the MFN rate.14 Inthe case of apparel, eligible CBERA countries mayqualify for liberal import quotas for apparelassembled in the beneficiary country from fabricformed and cut in the United States. Thesepreferential quotas, known as guaranteed accesslevels (GALs), permit CBERA countries virtuallyunlimited access to the U.S. market for qualifyingapparel.15
For some products, duty-free entry is subject tocertain conditions, under either the original CBERAor subsequent regulations. Sugar (including syrupsand molasses) and beef (including veal) are eligiblefor duty-free entry only if the exporting CBERAcountry submits a “Stable Food Production Plan” tothe United States, assuring that its agricultural exportsdo not interfere with its domestic food supply andwith use and ownership of land.16 Imports of sugarand beef, like those of other agricultural products, arealso subject to any applicable and generally imposedU.S. quotas and food safety requirements.17
Qualifying RulesCBERA provides generally that eligible products
must either be wholly grown, produced, or
13—Continuedmost part, concessional and have been set through stagedreductions of full statutory rates in negotiations with othercountries. For some products, the MFN tariff rate is free.The basic statute currently in force with respect to MFNtreatment is sec. 126(a) of the Trade Act of 1974 (19U.S.C. 2136).
14 General note 3(c) to the HTS reflects special tarifftreatment for eligible products of designated countriesunder various U.S. trade programs, including CBERA.General note 7 covers CBERA. For a discussion ofproducts originally excluded from CBERA and subsequentmodifications to the list of excluded products, see USITC,Impact of the Caribbean Basin Economic Recovery Act onU.S. Industries and Consumers: The First Ten Years ofCBERA, Ninth Report, 1993, (investigation No. 332-227),USITC publication 2813, Sept. 1994, pp. 2-9.
15 The United States currently has bilateral agreementsthat provide for GALs with Costa Rica, the DominicanRepublic, El Salvador, Guatemala, Honduras, and Jamaica.The agreement with Haiti expired on December 31, 1994,and it has not been renewed as of August 1995.
16 Sec. 213(c)(1)(B), CBERA, as amended.17 For a more detailed discussion of special conditions
affecting certain products, see “Products Eligible UnderSpecial Conditions and Excluded Products,” USITC,CBERA, Seventh Report, 1991, pp. 1-5 to 1-7.
manufactured in a CBERA country or be “new ordifferent” articles from substantially transformednon-CBERA inputs used in their manufacture inorder to receive duty-free entry into the UnitedStates.18 CBERA requires that the cost or value ofthe materials produced and the direct cost ofprocessing operations in one or more CBERAcountries total at least 35 percent of the U.S.customs value of the product at the time of entry.These rules-of-preference provisions allow CBERAcountries to pool their resources to meet valuecontent requirements and also permit inputs fromPuerto Rico and the U.S. Virgin Islands to count infull toward the value threshold. Also, CBERAproducts can meet the 35-percent minimum valuecontent requirement if CBERA value represents 20percent of the U.S. customs value of the product andthe additional 15 percent is attributable to U.S.-made(excluding Puerto Rican) materials or components.19
Duty benefits currently applicable under CBERA inview of the program’s rules-of-preference provisionsare summarized in table 1-1.
The 1990 CBERA liberalized the originalCBERA’s rules of preference regarding Puerto Ricaninputs used in CBERA exports. The act stipulates thatarticles produced in Puerto Rico that are “by anymeans advanced in value or improved in condition bya beneficiary country” are eligible for duty-free entryinto the United States. To take advantage of thisprovision, the law requires that any materials added tosuch Puerto Rican articles must be of U.S. orCBERA-country origin and that the final product mustbe imported directly into the customs territory of theUnited States from the CBERA country.20 Thismeasure has encouraged production sharing betweenPuerto Rico and CBERA countries.
Section 222 of the 1990 CBERA also effectivelymodifies the original CBERA’s rules of origin byextending duty-free entry into the United States forproducts—other than textiles and apparel andpetroleum and petroleum products—that are“assembled or processed” in CBERA countries whollyfrom components or materials originating in theUnited States.21 This provision effectively extends
18 Products undergoing the following operations donot qualify: simple combining or packaging operations,dilution with water, or dilution with another substance thatdoes not materially alter the characteristics of the article. Sec. 213(a)(2), CBERA, as amended.
19 Sec. 213(a)(1), CBERA, as amended.20 Sec. 213(a)(5), CBERA, as amended.21 This amended note 2 to subch. II, ch. 98 of the
HTS, by adding new language.

4
Table 1-1Summary of CBERA trade provisions 1
Duty-free entry
Applies to all products unless specifically excluded. Products generally must be grown, produced, or manufactured in aCBERA country2 or must be “new or different” from any foreign materials or components used in their manufacture. Thecosts of local materials and processing generally must total at least 35 percent of the customs value of the product (inputsfrom Puerto Rico, the U.S. Virgin Islands, and the United States are allowed to account for a portion of this 35-percentminimum local content). Certain articles assembled or processed in CBERA countries wholly from components ormaterials originating in the United States also may enter the United States free of duty.3 The following conditions,restrictions, or exemptions apply:
� Certain agricultural products, including sugar, dairy products, cotton, peanuts, and beef, are subject to U.S.quotas and/or health requirements. Duty-free imports of sugar and beef are allowed only from countries thatsubmit a “Stable Food Production Plan” to the United States to ensure that food production and the nutritionallevel of the population in the beneficiary country will not be adversely affected by export production.4
� Ethyl alcohol produced from agricultural feedstock grown in a CBERA country is admitted duty-free. Alcoholproduced from non-CBERA agricultural feedstock is restricted to 60 million gallons (227.1 million liters) or 7percent of the U.S. domestic ethanol market, whichever is greater.5
� Excluded from duty-free entry are: canned tuna; petroleum and petroleum derivatives; footwear (exceptdisposable items and footwear parts such as uppers that are not covered by the Multifiber Arrangement)6;watches and watch parts7; sugar from any Communist country in the Caribbean Basin or in Central America,most textiles and apparel,8 and the products (listed immediately below) eligible for reduced duty treatment.
Reduced duties for certain products
Duties on handbags, luggage, flat goods, work gloves and leather wearing apparel are being reduced by a total of 20percent beginning January 1, 1992, in five equal annual installments.9
1 These provisions are discussed in greater detail in USITC, CBERA, Seventh Report, 1991, pp. 1-2 to 1-7. 2 Also applies to articles grown, produced, or manufactured in Puerto Rico, advanced in value or improved in
condition in a CBERA country, and exported directly to the United States. 3 This provision was added by sec. 222 of the 1990 CBERA, which amended note 2 to subchapter II of chapter
98 of the HTS. Textiles and apparel and petroleum products and derivatives are excluded. 4 Sec. 213(c)(1)(B), CBERA, as amended. 5 Sec. 213(a)(1), CBERA, as amended. See also sec. 423 of the Tax Reform Act of 1986, as amended by sec.
7 of the Steel Trade Liberalization Program Implementation Act of 1989 (19 U.S.C. 203 nt; Public Law 99-514 asamended by Public Law 101-221).
6 Applies to footwear not eligible for duty-free entry under the U.S. Generalized System of Preferences (GSP)program as of Aug. 5, 1983, that is assembled in a CBERA country of U.S.-origin components. Restrictions onimports of such completed footwear were lifted by sec. 222 of the 1990 CBERA.
7 The United States eliminated certain content restrictions on wrist watches in Oct. 1991. 8 Textile and apparel articles that were subject to textile agreements when CBERA was enacted are not eligible
for CBERA duty-free benefits. Textiles and apparel not subject in 1983 to the Arrangement Regarding InternationalTrade in Textiles (the so-called Multifiber Arrangement, which has controlled much of world trade in textiles andapparel since 1974) and made of silk blends or vegetable fibers other than cotton are eligible for duty-free entry asare those chiefly of silk and other textile products not of cotton, wool, or manmade fibers. Bilateral agreements canbe negotiated for duty-free entry of traditional hand-loomed, hand-sewn textile articles. For more information, seegeneral note 7(d)(iii) to the HTS.
9 Sec. 213(h), CBERA, as amended.

5
the production-sharing provisions of HTSsubheadings 9802.00.60 and 9802.00.8022 byextending special duty treatment to importedproducts containing U.S.-made components orparts.23 Duty-free entry to the Caribbean value-addedportion of a product, and to the portion of reenteringU.S. inputs, is granted and the products fromCBERA countries are effectively treated as U.S.articles.
The 1990 modifications also afford duty-free entryinto the United States for certain articles thatotherwise might not meet the substantialtransformation and minimum value contributionrequirements specified under the original CBERA.Merchandise likely to benefit includes articlesproduced through operations such as enameling,simple assembly or finishing, and certain repairs oralterations that were not significant enough to create a“new and different article of commerce” requiredunder section 213 of the CBERA.24
CBERA and GSPThe 24 CBERA beneficiaries also are GSP
beneficiaries.25 CBERA and GSP share manysimilarities. Both programs share the goal of offeringincreased access to the U.S. market. Many productsmay enter the United States duty-free under eitherprogram. Like CBERA, GSP requires that
22 Note 2(b) to subch. II, ch. 98 of the HTS.23 For further information, see USITC, Production
Sharing: U.S. Imports Under Harmonized Tariff ScheduleProvisions 9802.00.60 and 9802.00.80, 1989-1992, USITCpublication 2729, Feb. 1994.
24 For a more detailed discussion of this issue, seeU.S. Department of Commerce, International TradeAdministration, Latin American/Caribbean BusinessDevelopment Center (LA/C Center), 1991 Guidebook:Caribbean Basin Initiative, (Nov. 1990), p. 58.
25 The U.S. GSP program was originally enactedpursuant to title V of the Trade Act of 1974 (Public Law93-618, 88 Stat. 2066 and following) and was renewed foran additional 10 years pursuant to title V of the Trade andTariff Act of 1984 (Public Law 98-573, 98 Stat. 3018 andfollowing), as amended (19 U.S.C. 2461 and following).The GSP program formally expired at midnight July 4,1993 but was extended until Sept. 30, 1994 as part of theOmnibus Budget Reconciliation Act of 1993 (H.R. 2264)on Aug. 4, 1993; it was again renewed retroactivelythrough July 31, 1995 by the Uruguay Round AgreementsAct. As of this writing, Congress is considering legislationto further extend the GSP program.
eligible imports—(1) be imported directly frombeneficiaries into the customs territory of the UnitedStates; (2) meet the substantial transformationrequirement for any foreign parts or components;and (3) contain a minimum of 35 percent localvalue-added.26
The two programs differ in several ways that tendto make Caribbean Basin producers prefer CBERA toGSP. CBERA covers over 6,000 products, whereasGSP applies to only about 4,300 products. GSPbenefits on any goods may be restricted or terminatedduring the annual GSP review. Beneficiaries may loseGSP duty-free entry privileges for products thatachieve a specified market penetration in the UnitedStates (the “competitive need” limit), or may lose allGSP privileges if their national income grows toexceed a specified amount.27 CBERA has none ofthese restrictions or provisions to terminate benefits.Moreover, CBERA imports suspended from GSPeligibility on the basis of U.S. market penetration (i.e.,that exceed the competitive need limit) may continueto enter free of duty under CBERA.28
CBERA also has more liberal rules of origin thanGSP. GSP requires that 35 percent of the value of theproduct be added in a single beneficiary or in aspecified association of eligible countries.29 Incontrast, under CBERA the 35 percent local valueadded can include materials and processing from otherCBERA beneficiaries, Puerto Rico, or the U.S. VirginIslands. CBERA also requires as little as 20 percentlocal value added from CBERA beneficiaries, PuertoRico, or the U.S. Virgin Islands when at least 15percent of the value includes inputs from the UnitedStates.30
26 The documentation requirements necessary to claimeither CBERA or GSP duty-free entry are identical. ACertificate of Origin Form A is to be presented at thetime the qualifying products enter the United States.
27 19 U.S.C. 2464(c)-(f).28 For example, in 1994 imports of leather footwear
uppers and medical instruments from the DominicanRepublic, aromatic drugs from The Bahamas, raw canesugar from Guatemala and Nicaragua, cigars from theDominican Republic and Nicaragua, and rope, curb, etc.,of precious metal from Nicaragua exceeded thecompetitive need limit and were not eligible for GSPduty-free entry. However, these imports were eligible forduty-free entry under CBERA. These imports arediscussed in greater detail in ch. 2.
29 19 U.S.C. 2463(b)(1)(B).30 19 U.S.C. 2703(a)(1).

6

7
CHAPTER 2U.S. Trade With The Caribbean Basin
This chapter analyzes U.S. trade with the 24designated CBERA beneficiaries (hereafter CBERAcountries) during 1994.1 The analysis begins with anoverview of two-way trade with these countries, butfocuses on U.S. imports. Because duty-free andreduced-duty entries under CBERA provisionsaccount for only a small portion of total U.S. importsfrom CBERA countries, 18.3 percent in 1994, adiscussion of U.S. imports from the CBERAcommunity entering under provisions other thanCBERA is also presented.
Following a discussion of total U.S. imports fromCBERA countries—first the dutiable and then thefree-of-duty portion—the $2 billion U.S. importsentering the United States in 1994 under CBERAprovisions are analyzed as a subsection of allduty-free imports from CBERA countries.
1 The 24 designated CBERA countries are listed byregional groupings in table 2–2.
Two-Way TradeThe United States consistently has had a collective
surplus in merchandise trade with the CBERAcountries since 1987.2 In 1994, the surplus amountedto $1.6 billion, down $226 million from 1993, as therate of U.S. exports slowed and the rate of U.S.imports accelerated (table 2-1). The generally steadyrise in U.S. exports to CBERA countries during1984-94 mirrored the increase in U.S. exportsworldwide over this period.
U.S. exports to CBERA countries totaled $12.8billion in 1994, rising 7.4 percent over 1993 levels.Accounting for 2.7 percent of total U.S. exports in
2 Statistical information in this report focusesgenerally on merchandise trade. Data on trade in servicesis not presented.
Table 2-1U.S. trade with CBERA countries, 1984-94
U.S. exports 1 U.S. imports 2
Percent of Percent oftotal U.S. total U.S. U.S. trade
Year Value exports Value imports balance
Million dollars Million dollars Million dollars
1984 5,952.9 2.8 8,649.2 2.7 -2,696.4. . . . . . . . . . . . . . . . . 1985 5,743.0 2.8 6,687.2 1.9 -944.2. . . . . . . . . . . . . . . . . 1986 6,064.6 2.8 6,064.7 1.6 -0.1. . . . . . . . . . . . . . . . . 1987 6,668.3 2.7 6,039.0 1.5 629.3. . . . . . . . . . . . . . . . . 1988 7,421.8 2.4 6,061.1 1.4 1,360.7. . . . . . . . . . . . . . . . . 1989 8,105.0 2.3 6,637.4 1.4 1,467.6. . . . . . . . . . . . . . . . . 1990 9,307.1 2.5 7,525.2 1.5 1,781.9. . . . . . . . . . . . . . . . . 1991 9,885.5 2.5 8,229.4 1.7 1,656.1. . . . . . . . . . . . . . . . . 1992 10,901.7 2.6 9,425.6 1.8 1,476.1. . . . . . . . . . . . . . . . . 1993 11,941.9 2.7 10,094.0 1.8 1,847.9. . . . . . . . . . . . . . . . . 1994 12,822.0 2.7 11,200.3 1.7 1,621.7. . . . . . . . . . . . . . . . .
1 Domestic exports, f.a.s. basis.2 Imports for consumption, customs value.
Source: Compiled from official statistics of the U.S. Department of Commerce.

8
1994, CBERA countries combined ranked 9th as anexport market for the United States, ahead of suchmarkets as Singapore and France but behind theNetherlands and South Korea. With the exception of1985, U.S. exports to CBERA countries haveincreased each year since CBERA was implementedin 1984.3
Meanwhile, U.S. imports from the region first rancounter to the overall trend of rising U.S. importsfrom all countries, as they initially declined from $8.6billion in 1984 to around $6.0 billion in 1986. Importsfrom the CBERA countries remained stagnant in 1987and 1988, before growing each year thereafter.Despite the increase of U.S. imports from CBERAcountries after 1988, the 1.7-percent CBERA-countryshare of total U.S. imports in 1994 was much lowerthan the 2.7-percent share of the total accounted forby CBERA countries in 1984.4
Total U.S. imports from CBERA countries (boththe CBERA preferential portion and all other imports)amounted to $11.2 billion in 1994, up 11.0 percentover 1993 levels. This was the seventh consecutiveyear to show an increase. The 1.7 percent combinedshare of CBERA countries in total U.S. imports in1994 established these countries collectively as the13th largest U.S. supplier for the year—ahead ofThailand and Hong Kong, but behind Italy andMalaysia.
Imports
Imports from CBERA-countryGroups
Since CBERA became effective in 1984, therelative positions of the four Caribbean subregional
3 U.S. exports to CBERA countries are not discussedin the remainder of this report. For a discussion of thissubject covering the years 1984-93, see U.S. InternationalTrade Commission, Impact of the Caribbean BasinEconomic Recovery Act on U.S. Industries andConsumers: The First Ten Years of CBERA, NinthReport, 1993, (investigation No. 332-227), USITCpublication 2813, Sept. 1994, ch. 1, pp. 20-34.
4 For provisions of the original CBERA, subsequentprovisions pertaining to CBERA, and statisticalinformation for 1984-93, see ibid., chapter 1. See p. 9 ofthat report for an explanation of why U.S. exports toCBERA countries outperformed U.S. imports from thesecountries, even though CBERA is a program designed toprovide preferential access to CBERA-country exports tothe U.S. market.
groupings—Central America, Eastern Caribbean,Central Caribbean, and oil-producing countries—asU.S. suppliers have changed markedly (table 2-2).The decline in the volume and prices of imports ofCaribbean petroleum products depressed thecollective share of the oil-producing countries from52.5 percent of all U.S. imports from CBERAcountries in 1984 to 17.9 percent in 1994.5 Theshare of U.S. imports from the Eastern Caribbeanalso declined during the CBERA decade, probablybecause the region’s economies depend more ontourism than on export-oriented industry. In 1994,the Eastern Caribbean group accounted for only 1.9percent of all U.S. imports from CBERA countriescompared with 3.4 percent in 1984.
By contrast, the importance of the CentralAmerican and the Central Caribbean regions hasgrown rapidly since 1984. The former’s share of totalU.S. imports from CBERA countries increased from23.6 percent in 1984 to 44.8 percent in 1993 and 45.5percent in 1994. The latter’s share increased from20.5 percent in 1984 to 35.0 percent in 1993,dropping slightly to 34.6 percent in 1994, due to theU.S.-led economic embargo of Haiti.6
The growing significance over the CBERA periodof the Central American and Central Caribbeanregions of the CBERA community is explained byU.S.-Caribbean production sharing (i.e., value addedto U.S. materials exported, or further processed inCBERA countries, and reimported by the UnitedStates)—particularly in the area of apparel production,but also in the area of other miscellaneousmanufactures that were eligible for duty-free entryunder CBERA. Production sharing is concentrated inthe Central American and the Central Caribbeanregions.7
5 See ibid., ch. 1, p. 11 and p. 13.6 Imports from Haiti plummeted by 62 percent from
their 1993 level to $58.8 million in 1994. U.S. trade withHaiti was severely affected by the embargo that theUnited States imposed in October 1991. Following therestoration of the democratically elected Government inHaiti in October 1994, President Clinton revoked theembargo among other Executive orders that pertained tothe national emergency that had been declared withrespect to that country.
7 See also section on textiles and apparel later in thischapter.

9
Table 2-2U.S. imports for consumption from CBERA countries, by major groups, 1984 and 1991-94
(1,000 dollars, customs value)
Group 1984 1991 1992 1993 1994
Non-oil-producing countries:Central America:
Belize 42,843 35,622 58,510 48,984 49,392. . . . . . . . . . . . . . . . . . . . . . . . . Costa Rica 468,633 1,143,982 1,402,042 1,542,098 1,645,382. . . . . . . . . . . . . . . . . . . . El Salvador 381,391 302,449 383,245 481,342 607,541. . . . . . . . . . . . . . . . . . . . Guatemala 446,267 892,280 1,072,697 1,178,094 1,283,596. . . . . . . . . . . . . . . . . . . . Honduras 393,769 552,238 780,638 914,380 1,091,688. . . . . . . . . . . . . . . . . . . . . Nicaragua (1) 59,528 68,609 124,543 167,397. . . . . . . . . . . . . . . . . . . . . Panama 311,627 242,580 218,232 233,131 252,465. . . . . . . . . . . . . . . . . . . . . . .
Subtotal 2,044,530 3,228,682 3,983,972 4,522,572 5,097,460. . . . . . . . . . . . . . . . . . . . . Eastern Caribbean:
Antigua 7,898 3,895 5,414 14,806 5,435. . . . . . . . . . . . . . . . . . . . . . . Barbados 252,595 31,457 30,528 34,027 34,250. . . . . . . . . . . . . . . . . . . . . . British Virgin Islands 1,335 2,567 3,235 14,143 14,604. . . . . . . . . . . . Dominica 86 5,877 4,506 5,833 6,957. . . . . . . . . . . . . . . . . . . . . . Grenada 766 8,086 7,476 7,940 7,247. . . . . . . . . . . . . . . . . . . . . . Guyana (2) 73,733 87,064 87,870 94,555. . . . . . . . . . . . . . . . . . . . . . . Montserrat 989 2,179 1,095 1,513 1,032. . . . . . . . . . . . . . . . . . . . . St. Kitts and Nevis3 23,135 15,553 22,857 23,775 21,716. . . . . . . . . . . . . St. Lucia 7,397 21,731 28,065 31,285 26,497. . . . . . . . . . . . . . . . . . . . . . St. Vincent and Grenadines 2,958 7,507 4,530 4,855 5,430. . . . . .
Subtotal 297,161 172,586 194,771 226,049 217,723. . . . . . . . . . . . . . . . . . . . . Central Caribbean:
Dominican Republic 994,427 1,976,624 2,366,509 2,667,202 3,076,519. . . . . . . . . . . . Haiti 377,413 284,264 107,170 154,335 58,764. . . . . . . . . . . . . . . . . . . . . . . . . . Jamaica 396,949 561,205 593,361 710,260 739,552. . . . . . . . . . . . . . . . . . . . . . .
Subtotal 1,768,790 2,822,095 3,067,040 3,531,797 3,874,835. . . . . . . . . . . . . . . . . . . . .
Total non-oil-producingcountries 4,110,481 6,223,360 7,245,783 8,280,419 9,190,017. . . . . . . . . . . . . . . . . .
Oil-producing countries:
Aruba (4) 100,246 189,656 306,578 318,941. . . . . . . . . . . . . . . . . . . . . . . . . . . Bahamas 1,154,282 465,324 580,699 341,547 192,890. . . . . . . . . . . . . . . . . . . . . . . . Netherlands Antilles 2,024,367 620,783 569,689 381,776 412,652. . . . . . . . . . . . . . Trinidad and Tobago 1,360,106 819,653 839,787 783,714 1,085,781. . . . . . . . . . . . . .
Total oil-producing countries 4,538,754 2,006,007 2,179,833 1,813,615 2,010,264. . . . .
Grand total 8,649,235 8,229,366 9,425,616 10,094,033 11,200,280. . . . . . . . . . . . . . . . . . . . 1 Nicaragua was designated a CBERA beneficiary effective Nov. 8, 1990.2 Guyana was designated a CBERA beneficiary effective Nov. 24, 1988.3 Data for St. Kitts and Nevis included data for Anguilla (a nondesignated country) through 1985. After 1985, data
for Anguilla were excluded.4 Aruba was designated a CBERA beneficiary effective Jan. 1, 1986. For statistical purposes, Aruba was treated
as part of the Netherlands Antilles until 1986.Note.—Because of rounding, figures may not add to the totals shown.
Source: Compiled from official statistics of the U.S. Department of Commerce.

10
Product Composition of TotalImports
U.S. imports from CBERA countries traditionallyhave consisted of agricultural products and rawmaterials—namely, petroleum products, sugar cane,coffee, bananas, and aluminum ores and concentrates.The deterioration in the terms of trade for these exportitems and a quest for economic growth promptedCBERA countries to seek diversification in theirexport profile. Encouraging such diversification of theCaribbean Basin economies was one of the intendedgoals of the United States in implementing CBERA.
Light manufactures, principally apparel, but alsofootwear, medical, surgical and electrical instruments,sporting goods, and jewelry now account for anincreasing share of U.S. imports from the region andconstitute the fastest-growing sectors for newinvestment in CBERA countries. However, traditionalagricultural and raw material products continue toplay a significant role in the region’s economies.
Table 2-3 shows the 35 leading U.S. imports fromCBERA countries during 1990-94 on an 8-digitHarmonized Tariff Schedule of the United States(HTS) subheading basis, ranked by their import valuein 1994.8 Altogether these goods, which are eitherdutiable or free of duty under CBERA or some otherprovisions, accounted for almost two-thirds of totalU.S. imports from CBERA countries in 1994. Many,including the top item (men’s or boys’ cotton trousers,breeches and shorts), were apparel articles.9 Thetraditional products of bananas, coffee, and petroleumoils were the second, third, and fourth leading items,respectively.10 Other leading imports included
8 Some of these products, provided they are leadingimport items entering fully, or in part, under CBERAprovisions, will also appear in table 2-8 and will bediscussed later in this chapter or in chapter 3.
9 Apparel from CBERA countries will be discussedseparately in this chapter.
10 U.S. imports of crude petroleum and petroleumproducts from CBERA countries decreased steadilybetween 1984 and 1989, reflecting plummeting globalpetroleum prices and a major reduction ofpetroleum-refining operations in the Caribbean Basinregion. In all, imports of Caribbean petroleum andpetroleum products shrank from $4.2 billion in 1984 to$1.2 billion in 1994, or 28.9 percent of their 1984 value.For statistical information for 1984-93, see USITC,CBERA, Ninth Report, 1993, ch. 1, pp. 11 and 13. Datafor 1994 are compiled from official statistics of the U.S.Department of Commerce, based on SITC 2-digitclassification.
footwear uppers, shrimps and prawns, anhydrousammonia, other petroleum products, medical andsurgical instruments, articles of jewelry, cane sugar,aluminum ore and concentrates, methanol (methylalcohol), and frozen, fresh or chilled beef.
Imports of coffee were up in value in 1994, butonly because of sharp increases in coffee prices. WithU.S. imports shifting away from CBERA countries toMexico, Vietnam, and other sources, the volume ofcoffee imports was actually down during the year.
Imports of bananas increased in 1994. On July 1,1993, the European Union (EU) set quotas as part ofits new import regime on bananas, and subsequentlyreached “Framework Agreements” between the EUand four nations, including two CBERA countries,Costa Rica and Nicaragua.11 This limited Caribbeanexports of bananas to Europe, and as a result, aportion of the CBERA-country supply available forexport to Europe was diverted to the United States.
Imports by value of most of the other leadingitems in table 2-3 rose in 1994, especially imports ofanhydrous ammonia from Trinidad and Tobago, whichenter free of duty on a most-favored-nation (MFN)basis. Imports of this item more than doubled to$218.1 million in 1994 compared with 1993 imports.The U.S. ammonia industry was reportedly unable tomeet demand, which surged in response to higherdomestic consumption of nitrogenous fertilizers and alarger Chinese market for nitrogenous and phosphaticfertilizers, which require ammonia as an input.
Dutiable and Special-DutyImports
Table 2-4 shows that U.S. tariff revenues fromimports from CBERA countries, as indicated by“calculated duties,” amounted to $429.5 million in1994, compared with $378.9 million in 1993 but only$75.3 million in 1984, the first CBERA year. The
11 On Sept. 2, 1994, Chiquita Brands International,Inc. and the Hawaii Banana Industry Association filed apetition alleging that various practices of the EU,Colombia, Costa Rica, Nicaragua, and Venezuelaconcerning trade in bananas are discriminatory,unreasonable, and burden or restrict U.S. commerce. OnOct. 17, 1994, the United States Trade Representativeinstituted an investigation of the EU banana regime underSection 301 of the Trade Act of 1974, followed on Jan. 9,1995, by an investigation of the banana policies andpractices of Costa Rica and Colombia. Caribbeanproducers, concerned that the U.S. investigation couldthreaten their banana industry, are currently seeking amutually beneficial solution to their differences with theUnited States.

Table 2-3Leading U.S. imports for consumption from CBERA countries, 1 1990-94
(1,000 dollars, customs value)
HTSItem Description 1990 1991 1992 1993 1994
6203.42.40 Men’s or boys’ trousers, breeches and shorts, not knitted, of cotton 314,361 399,701 515,322 606,688 721,338. . . . . . . . . 0803.00.20 Bananas, fresh or dried 441,861 443,179 521,421 517,146 543,023. . . . . . . . . . . . . . . . . . . . . . . . . . . . . . . . . . . . . . . . . . . . . . . 0901.11.00 Coffee, not roasted, not decaffeinated 401,969 368,251 372,211 332,915 405,154. . . . . . . . . . . . . . . . . . . . . . . . . . . . . . . . . . 2709.00.20 Petroleum oils and oils from bituminous minerals, crude 649,365 516,764 502,123 373,985 384,828. . . . . . . . . . . . . . . . . . 2710.00.05 Distillate and residual fuel oils (including blends), under 25 degrees API 426,916 405,628 382,688 351,275 364,705. . . . 6205.20.20 Men’s or boys’ shirts, not knitted or crocheted, of cotton 111,463 120,118 216,687 317,219 355,513. . . . . . . . . . . . . . . . . . . 6204.62.40 Women’s or girls’ trousers, breeches and shorts, of cotton 150,722 197,797 238,615 310,346 315,317. . . . . . . . . . . . . . . . 9801.00.10 U.S. goods returned without having been advanced in value 183,228 183,027 228,134 237,258 314,229. . . . . . . . . . . . . . . 6109.10.00 T-shirts, singlets, tank tops and similar garments, of cotton 84,042 128,228 180,363 247,656 305,018. . . . . . . . . . . . . . . . 6212.10.20 Brassieres, other than containing lace, net or embroidery 133,442 152,509 202,162 248,691 291,577. . . . . . . . . . . . . . . . . 6406.10.65 Footwear uppers, other than formed, of leather 116,656 121,305 151,764 199,773 246,557. . . . . . . . . . . . . . . . . . . . . . . . . . 6110.20.20 Sweaters, pullovers and similar articles, knitted, of cotton 82,323 137,350 185,406 212,101 243,491. . . . . . . . . . . . . . . . . 0306.13.00 Shrimps and prawns, cooked in shell or uncooked, frozen 115,268 144,131 154,644 195,637 242,259. . . . . . . . . . . . . . . . . 2814.10.00 Anhydrous ammonia 71,235 107,644 89,971 105,110 218,124. . . . . . . . . . . . . . . . . . . . . . . . . . . . . . . . . . . . . . . . . . . . . . . . . 2710.00.10 Distillate and residual fuel oils (including blends), over 25 degrees API 56,740 132,267 189,601 214,713 213,807. . . . . . 9018.90.80 Medical and surgical instruments and appliances 83,451 107,601 113,952 143,329 180,972. . . . . . . . . . . . . . . . . . . . . . . . 6108.21.00 Women’s or girls’ briefs and panties, knitted or crocheted, of cotton 45,851 77,014 97,495 124,203 149,593. . . . . . . . . 7113.19.50 Jewelry and jewelry parts of precious metal 54,346 41,883 57,418 90,196 146,808. . . . . . . . . . . . . . . . . . . . . . . . . . . . . 2710.00.25 Naphthas (except motor fuel or motor fuel blending stock) 41,647 113,696 150,468 142,335 135,604. . . . . . . . . . . . . . . . . 1701.11.01 Cane sugar entered pursuant to its provisions 20,988 142,186 174,085 177,448 133,459. . . . . . . . . . . . . . . . . . . . . . . . . . . 6203.43.40 Men’s or boys’ trousers, breeches and shorts, not knitted, of
synthetic fibers 53,001 86,886 106,748 111,664 133,288. . . . . . . . . . . . . . . . . . . . . . . . . . . . . . . . . . . . . . . . . . . . . . . . . . . . 2606.00.00 Aluminum ores and concentrates 138,182 152,505 176,143 163,915 131,033. . . . . . . . . . . . . . . . . . . . . . . . . . . . . . . . . . . . . . 2905.11.20 Methanol (methyl alcohol), nesi 22,248 24,783 14,092 18,298 120,976. . . . . . . . . . . . . . . . . . . . . . . . . . . . . . . . . . . . . . . . 0202.30.60 Frozen boneless beef, except processed 85,376 82,604 73,059 126,667 106,506. . . . . . . . . . . . . . . . . . . . . . . . . . . . . . . 6115.11.00 Panty hose and tights, knitted or crocheted 10,004 13,215 19,145 84,157 102,704. . . . . . . . . . . . . . . . . . . . . . . . . . . . . . 6108.22.00 Women’s or girls’ briefs and panties, knitted or crocheted, of
manmade fibers 42,497 54,165 61,246 82,182 99,704. . . . . . . . . . . . . . . . . . . . . . . . . . . . . . . . . . . . . . . . . . . . . . . . . . . 2710.00.15 Motor fuel derived from bituminous minerals 126,757 117,536 153,707 151,414 98,550. . . . . . . . . . . . . . . . . . . . . . . . . . . . . 1701.11.02 Other sugar to be used for the production (other than by distillation)
of polyhydric alcohols 3,204 79,384 84,808 71,360 95,955. . . . . . . . . . . . . . . . . . . . . . . . . . . . . . . . . . . . . . . . . . . . . . 6105.10.00 Men’s or boys’ shirts, knitted or crocheted, of cotton 59,084 58,708 86,463 86,991 92,567. . . . . . . . . . . . . . . . . . . . . . 0306.11.00 Rock lobster and other sea crawfish, cooked in shell, frozen 70,882 93,581 100,125 72,627 89,541. . . . . . . . . . . . . . . 6204.31.20 Women’s or girls’ suit type jackets and blazers, of wool 16,004 31,470 51,954 81,126 75,410. . . . . . . . . . . . . . . . . . . 6104.62.20 Women’s or girls’ trousers, breeches and shorts, knitted, of cotton 24,319 35,408 59,211 63,439 74,522. . . . . . . . . . 6107.11.00 Men’s or boys’ underpants and briefs, knitted or crocheted, of cotton 5,751 20,702 39,228 52,228 70,082. . . . . . . 0201.30.60 Fresh or chilled boneless beef, except processed 45,657 51,127 55,259 64,969 62,994. . . . . . . . . . . . . . . . . . . . . . . . 2818.20.00 Aluminum oxide, except artificial corundum 100,762 106,884 82,589 65,548 60,950. . . . . . . . . . . . . . . . . . . . . . . . . . . . .
Total of items shown 4,389,604 5,049,239 5,888,306 6,444,612 7,326,158. . . . . . . . . . . . . . . . . . . . . . . . . . . . . . . . . . . . . . . . . . . . .
Total all commodities 7,525,208 8,229,366 9,425,616 10,094,033 11,200,280. . . . . . . . . . . . . . . . . . . . . . . . . . . . . . . . . . . . . . . . . . . . . 1 Data reflect current designated countries under CBERA for all years.
Note.—Because of rounding, figures may not add to totals given.
Source: Compiled from official statistics of the U.S. Department of Commerce.

12
Table 2-4U.S. imports for consumption from CBERA countries: Dutiable value, calculated duties, andaverage duty, 1984 and 1992-94
Item 1984 1992 1993 1994
Dutiable value (1,000 dollars)1 4,567,416 3,269,148 3,467,856 3,730,777. . . . . . . . . . . . . . . . . . . Dutiable as a share of total imports (percent) 52.8 34.7 34.4 33.3. . . . . . . Calculated duties (1,000 dollars)1 75,293 322,434 378,933 429,491. . . . . . . . . . . . . . . . . Average duty (percent)2 1.6 9.9 10.9 11.5. . . . . . . . . . . . . . . . . . . . . . . . .
1 Dutiable value and calculated duty exclude the U.S. content entering under HTS subheading 9802.00.80 andmisreported imports. Data based on product eligibility corresponding to each year.
2 Average duty = (calculated duty/dutiable value) x 100.
Source: Compiled from official statistics of the U.S. Department of Commerce.
average rate of duty applied to imports fromCBERA countries was 11.5 percent in 1994,compared with 10.9 percent in 1993 but only 1.6percent in 1984. The steady increase in U.S. tariffrevenue from CBERA-country imports and the risein the average rate of duty reflect the shift in theproduct mix of dutiable U.S. imports fromlower-duty items such as petroleum products towardshigher-duty goods, generally wearing apparel, mostof which are dutiable at relatively high rates.Apparel, along with textiles accounted for about 95percent of the duties paid in 1994 and petroleumproducts accounted for most of the remainder.
Dutiable ImportsTable 2-5 shows U.S. imports of selected product
categories that, by statute,12 are not eligible for
12 Sec. 213(b), CBERA, as amended.
CBERA duty-free entry. These imports, whichconsist almost entirely of apparel and petroleumproducts, account for nearly one-half of the totalvalue of U.S. imports from CBERA countries (table2-6). Nevertheless, a major portion of the apparelimports from the region enter at reduced dutiesunder the 9802 production-sharing provision.
Imports of CBERA-ineligible products declinedfrom $4.7 billion in 1984 to a low of $2.2 billion in1986. This initial contraction of the ineligible portionof imports was caused by the shrinking value ofpetroleum-related imports, which once dominated thisgroup. Ineligible imports subsequently rose to $5.0billion in 1993 and $5.4 billion in 1994, largely as aresult of the rapid increase of imports ofCBERA-ineligible apparel (discussed in more detailbelow) and footwear. Imports of dutiable Caribbeanfootwear reached a record high $69.6 million in 1994,surging by 86.5 percent over 1993 levels (table 2-5).
Table 2-5U.S. imports for consumption from CBERA countries of specific goods not eligible for CBERAduty-free entry, 1990-94
(1,000 dollars, customs value)
Product category 1990 1991 1992 1993 1994
Textiles and apparel1 2,006,348 2,558,240 2,995,699 3,633,136 4,131,500. . . . . . . . . . . . . . . Petroleum and petroleum products 1,340,317 1,399,607 1,467,580 1,288,605 1,234,429. . . . Footwear 35,806 38,700 45,884 37,330 69,621. . . . . . . . . . . . . . . . . . . . . . . . . . Certain handbags, luggage, and
flat goods2 18,264 26,651 (1) (1) (1). . . . . . . . . . . . . . . . . . . . . . . Certain leather apparel2 15,194 14,064 (1) (1) (1). . . . . . . . . . . . . Work gloves2 4,360 4,415 127 (1) (1). . . . . . . . . . . . . . . . . . . . . . Tuna 111 0 34 205 0. . . . . . . . . . . . . . . . . . . . . . . . . . . . . .
Total 3,420,400 4,041,677 4,509,324 4,959,276 5,435,550. . . . . . . . . . . . . . . . . . . . . . . . . . 1 The data for textiles and apparel were compiled at the 8-digit, tariff rate-line level of the Harmonized Tariff
Schedule of the United States.2 These products became eligible for a 20-percent duty reduction under CBERA beginning in 1992.
Note.—Because of rounding, figures may not add to the totals shown.
Source: Compiled from official statistics of the U.S. Department of Commerce.

13
Table 2-6U.S. imports for consumption from CBERA countries of goods not eligible for CBERA duty-freeentry, 1984-94
Year Noneligible imports Percent of total imports
Billion dollars
1984 4.7 54.9. . . . . . . . . . . . . . . . . . . . . . . . . . . . . . . . . 1985 3.1 45.8. . . . . . . . . . . . . . . . . . . . . . . . . . . . . . . . . 1986 2.2 37.1. . . . . . . . . . . . . . . . . . . . . . . . . . . . . . . . . 1987 2.6 42.7. . . . . . . . . . . . . . . . . . . . . . . . . . . . . . . . . 1988 2.6 43.1. . . . . . . . . . . . . . . . . . . . . . . . . . . . . . . . . 1989 2.9 43.3. . . . . . . . . . . . . . . . . . . . . . . . . . . . . . . . . 1990 3.4 45.4. . . . . . . . . . . . . . . . . . . . . . . . . . . . . . . . . 1991 4.0 49.1. . . . . . . . . . . . . . . . . . . . . . . . . . . . . . . . . 1992 4.5 47.8. . . . . . . . . . . . . . . . . . . . . . . . . . . . . . . . . 1993 5.0 49.2. . . . . . . . . . . . . . . . . . . . . . . . . . . . . . . . . 1994 5.4 48.5. . . . . . . . . . . . . . . . . . . . . . . . . . . . . . . . .
Source: Compiled from official statistics of the U.S. Department of Commerce.
Three of the products listed in table 2-5—certainhandbags, luggage and flat goods; certain leatherwearing apparel; and work gloves—were not eligiblefor CBERA duty-free entry under the originalCBERA legislation, but became eligible for dutyreductions as a result of a legislative amendmenteffective in 1992.13 The share of all U.S. importsfrom CBERA countries that were entered in 1994under the gradual CBERA duty reductions wasnegligible (0.3 percent).
Table 2-7 breaks down total U.S. imports fromCBERA countries between 1992 and 1994 into theirdutiable and duty-free portions. Since 1986, thedutiable share of annual U.S. imports from CBERAcountries has been about one-third of the total.14 In1994, at 33.3 percent, the dutiable share wassomewhat lower than in 1993 and 1992. An increasingcomponent of dutiable imports from CBERAcountries is the dutiable portion of imports involvingU.S.-Caribbean production sharing shipments.
Textiles and ApparelTextile and apparel (henceforth apparel)
constituted only 5.5 percent of overall U.S. importsfrom the region in 1984, but accounted for 39.8percent of the total in 1993 and 40.5 percent in1994.15 Apparel has exceeded the value of petroleum
13 Duties on handbags, luggage and flat goods, workgloves, and leather wearing apparel from CBERAcountries are being reduced by 20 percent in five equalannual stages beginning in 1992. For more detail, seeUSITC, CBERA, Ninth Report, 1993, p. 5.
14 Ibid., table 1-6, p. 16.15 Apparel accounts for almost all of the value of
U.S. textile and apparel imports from CBERA countries.For data concerning the early years of CBERA, see ibid.,pp. 11-13.
products in U.S. imports from CBERA countries bya wider margin each year since 1988, when itbecame the leading category of U.S. imports fromthe region, displacing petroleum products. In 1994,imports of CBERA-country apparel at $4.6 billionamounted to almost four times the import value ofpetroleum and related products.16
The rapid growth of Caribbean apparel shipmentsto the United States followed the institution of theSpecial Access Program (SAP) announced byPresident Reagan in 1986. This program, not a part ofCBERA, provides for “guaranteed access levels”(GALs) to the U.S. market for qualifying apparel fromCBERA countries.17
The growth in apparel shipments to the U.S.market made Caribbean countries collectively thefastest-growing U.S. supplier between 1987-93, withMexico the second-fastest.18 During this period, theannual increase for CBERA apparel shipments to theU.S. market was 21 percent, and for Mexican
16 These data, not shown in tabular form, arecompiled from official statistics of the U.S. Department ofCommerce. The data are based on SIC 2-digitclassification.
17 For more information on the Special AccessProgram, see USITC, CBERA, Second Annual Report,1986, p. 9; and CBERA, Third Annual Report, 1987, p.1-9. SAP is also discussed in more detail in USITC,Potential Effects of a North American Free-TradeAgreement on Apparel Investment in CBERA Countries,USITC publication 2541, July 1992, p. 2.
18 For more information on sources of U.S. imports ofapparel, see USITC, U.S. Imports of Textiles and ApparelUnder the Multifiber Arrangement: Annual Report for1994, USITC publication 2884, Apr. 1995.

14
Table 2-7U.S. imports for consumption from CBERA countries, by duty treatment, 1992-94
(1,000 dollars, customs value)
Item 1992 1993 1994
Total imports 9,425,616 10,094,033 11,200,280. . . . . . . . . . . . . . . . . . . . . . . . . . . . . . . . . . . . . . . . . . . .
Dutiable value1 3,269,148 3,467,856 3,730,777. . . . . . . . . . . . . . . . . . . . . . . . . . . . . . . . . . . . . . . . . . . . . . . Production sharing2 863,225 1,108,532 1,347,019. . . . . . . . . . . . . . . . . . . . . . . . . . . . . . . . . . . . . . . . CBERA reduced duty3 29,418 38,069 31,938. . . . . . . . . . . . . . . . . . . . . . . . . . . . . . . . . . . . . . Other dutiable 2,376,505 2,321,255 2,351,820. . . . . . . . . . . . . . . . . . . . . . . . . . . . . . . . . . . . . . . . . . . . .
Duty-free value4 6,156,467 6,626,177 7,469,503. . . . . . . . . . . . . . . . . . . . . . . . . . . . . . . . . . . . . . . . . . . . . . MFN5 2,097,079 2,101,160 2,514,726. . . . . . . . . . . . . . . . . . . . . . . . . . . . . . . . . . . . . . . . . . . . . . . . . . . . CBERA6 1,498,556 1,865,544 2,018,220. . . . . . . . . . . . . . . . . . . . . . . . . . . . . . . . . . . . . . . . . . . . . . . . . . Production sharing7 1,777,260 2,144,210 2,391,420. . . . . . . . . . . . . . . . . . . . . . . . . . . . . . . . . . . . . . . . GSP8 340,666 354,836 375,686. . . . . . . . . . . . . . . . . . . . . . . . . . . . . . . . . . . . . . . . . . . . . . . . . . . . . Other duty free9 442,904 160,427 169,451. . . . . . . . . . . . . . . . . . . . . . . . . . . . . . . . . . . . . . . . . . . .
Percent of total
Total imports 100.0 100.0 100.0. . . . . . . . . . . . . . . . . . . . . . . . . . . . . . . . . . . . . . . . . . . . Dutiable value1 34.7 34.4 33.3. . . . . . . . . . . . . . . . . . . . . . . . . . . . . . . . . . . . . . . . . . . . . . .
Production sharing2 9.2 11.0 12.0. . . . . . . . . . . . . . . . . . . . . . . . . . . . . . . . . . . . . . . . CBERA reduced duty3 0.3 0.4 0.3. . . . . . . . . . . . . . . . . . . . . . . . . . . . . . . . . . . . . . Other dutiable 25.2 23.0 21.3. . . . . . . . . . . . . . . . . . . . . . . . . . . . . . . . . . . . . . . . . . . . .
Duty-free value4 65.3 65.6 66.7. . . . . . . . . . . . . . . . . . . . . . . . . . . . . . . . . . . . . . . . . . . . . . MFN5 22.2 20.8 22.4. . . . . . . . . . . . . . . . . . . . . . . . . . . . . . . . . . . . . . . . . . . . . . . . . . . . CBERA6 15.9 18.5 18.0. . . . . . . . . . . . . . . . . . . . . . . . . . . . . . . . . . . . . . . . . . . . . . . . . . Production sharing7 18.9 21.2 21.0. . . . . . . . . . . . . . . . . . . . . . . . . . . . . . . . . . . . . . . . GSP8 3.6 3.5 3.4. . . . . . . . . . . . . . . . . . . . . . . . . . . . . . . . . . . . . . . . . . . . . . . . . . . . . Other duty free9 4.7 1.6 1.5. . . . . . . . . . . . . . . . . . . . . . . . . . . . . . . . . . . . . . . . . . . . 1 Dutiable value excludes the U.S. content entering under HTS subheadings 9802.00.60, 9802.00.80, and
misreported imports. 2 Value of Caribbean Basin-origin value added, under HTS 9802.00.60 and 9802.00.80.3 Value of imports of handbags, luggage, flat goods, work gloves, and leather wearing apparel subject to
20-percent duty reductions under the CBERA between 1992 and 1996.4 Calculated as total imports less dutiable value.5 Value of imports which have a col. 1-general duty rate of zero.6 Reduced by the value of MFN duty-free imports and ineligible items that were misreported as entering under the
CBERA program and the value of reduced-duty items (handbags, luggage, flat goods, work gloves, and leatherwearing apparel) reported separately above as dutiable.
7 Value of nondutiable exported and returned U.S.-origin products or components, under HTS 9802.00.60 and9802.00.80.
8 Reduced by the value of MFN duty-free imports and ineligible items that were misreported as entering under theGSP program.
9 Calculated as a remainder, and represents imports entering free of duty under special rate provisions.Note.—Because of rounding, figures may not add to the totals shown.Source: Compiled from official statistics of the U.S. Department of Commerce.
shipments 16 percent.19 In 1994, the first year inwhich the North American Free Trade Agreement(NAFTA) was in force, growth of apparel shipmentsby CBERA countries to the United States slowed;such shipments increased by 15 percent in volumecompared with 50 percent for Mexico.
Industry and trade officials attribute this reversalto the preferential tariffs accorded to Mexican goodsunder NAFTA. Over four-fifths of U.S. imports ofapparel from Mexico entered free of duty in 1994under NAFTA, because the garments were assembledfrom U.S.-formed and cut fabric. By contrast, imports
19 U.S. apparel imports by volume from all othercountries grew by 3 percent annually in the same period.
of such apparel from CBERA countries weredutiable at an effective rate of about 6 percent advalorem.20
The penetration of the U.S. market by Caribbeanapparel largely reflected the expansion ofproduction-sharing operations in the Caribbean region(as in Mexico) by U.S. producers to avail themselvesof low-cost labor in close proximity to the UnitedStates. Production sharing in both CBERA countries
20 The average trade-weighted duty rate on apparel is19 percent ad valorem. However, under HTS heading9802.00.80, duty is assessed only on the foreign valueadded. Since the CBERA value added accounts for onlyone-third of the total import value of apparel originatingin CBERA countries, the effective rate is about 6 percent.

15
and Mexico is highly efficient in assembling highvolumes of basic garments. These operations arecharacterized by standardized runs, low-skilled tasks,few styling changes, and reasonably predictableconsumer demand. The principal garments assembledare trousers and shorts, shirts and blouses,foundation garments, underwear, and coats andjackets (mainly sports coats and blazers).
Even before NAFTA was implemented, CBERAcountries expressed concern about their future accessto the markets of NAFTA partners and the threat ofinvestment being diverted from the Caribbean toMexico. Bills were introduced in the U.S. Congressduring 1993 that were designed to provide NAFTAparity for textiles and apparel, as well as certain otherarticles, presently not eligible for preferentialtreatment under CBERA.21
In 1994, the Clinton administration proposed an“Interim Trade Program” (ITP) for the CaribbeanBasin for inclusion in the Uruguay Roundimplementation legislation, which would have givenalmost NAFTA-equivalent tariff and quota treatmentto qualifying textile and apparel imports from CBERAcountries, on the condition that they meet certainreciprocal obligations regarding foreign investmentand protecting intellectual property rights. However,the ITP was not included in the Uruguay Roundimplementing bill.
On January 18, 1995, Representative Philip M.Crane (R-IL) introduced H.R. 553, the CaribbeanBasin Trade Security Act, which would makeavailable NAFTA-like treatment to qualifying textilesand apparel and all other products now exemptedfrom duty-free treatment under CBERA. If at the endof a 10-year period a CBERA country does not accedeto NAFTA or negotiate a free-trade agreement withthe United States, the normal MFN tariff treatmentwould again apply. This bill was favorably reportedby the House Ways and Means Trade Subcommitteein March. Senator Bob Graham (D-Fla.) introducedsimilar legislation, S. 529, in the Senate on March 10,1995.22
21 For more on NAFTA parity, see USITC, CBERA,Ninth Report, 1993, pp. 37-38.
22 The Commission received a submission containingcomments in support of H.R. 553 and S. 529 dated July13, 1995 from Richard L. Bernal, Ambassador of Jamaicato the United States.
Consideration of H.R. 553 was delayed and notincluded in an omnibus budget reconciliation billconsidered by the House Ways and Means Committee onSept. 13, 1995.
Duty-Free ImportsAs table 2-7 shows, some two-thirds of total U.S.
shipments from CBERA countries enter free of dutyunder one, or more than one, duty-free HTSprovision. In 1994, entries were free of duty underone of the following provisions: (1) unconditionallyunder MFN or column 1-general tariff rates (22.4percent of total imports), (2) conditionally under theGeneralized System of Preferences or GSP (3.4percent),23 (3) conditionally under chapter 98 of theHTS, i.e. under production sharing (21.4 percent), (4)conditionally under CBERA (18.0 percent), or (5)under other provisions (1.5 percent).
MFN duty-free imports have made up a decliningportion of total imports from CBERA countriesbetween 1986-92, settling slightly above one-fifth ofthe total since then. The 3.4-percent GSP share in1994 was the lowest since CBERA became effectivebecause importers of products eligible for duty-freetreatment under both GSP and CBERA haveincreasingly shifted to CBERA treatment. This hasoccurred partly because most rule-of-origin criteria forU.S. duty preferences, as well as paperworkrequirements, are less stringent under CBERA thanunder GSP. Also, CBERA now has no statutorydeadline, whereas the GSP program has lapsed twiceand was last renewed retroactively through July 31,1995, by the Uruguay Round Agreements Act.24
By contrast, the share of U.S. products reenteringthe United States duty-free under production-sharingprovisions rose. The other fast-rising, duty-freecategory was CBERA itself, which accounted for only6.7 percent of all imports from CBERA countries inthe first year of the program compared with 18.0percent in 1994.25
Imports Under CBERAU.S. imports afforded duty-free entry under
CBERA amounted to $2.0 billion in 1994 (table2-7).26 In 1994, duty-free CBERA imports accountedfor an 18.0-percent share of total imports from
23 GSP is discussed in some detail in USITC, CBERA,Eighth Report, 1992, p. 1-3.
24 GSP lapsed again on July 31, 1995. Anotherrenewal, which is supported by the administration, awaitsaction in Congress.
25 USITC, CBERA, Ninth Report, 1993, p. 18.26 Data in this chapter on entries under CBERA
provisions show the value of products entered free of dutyless MFN duty-free imports. However, some of theseimports also were eligible for duty-free entry under GSP.The data are broken down further in chapter 3.

16
CBERA countries, compared with 18.5 percent in1993; this is a slight relative decline for the firsttime since the beginning of the program.27
Table 2-8 shows the 20 leading items affordedduty-free entry under CBERA between 1992-94. Theproducts are ranked in terms of their 1994 value.28
While the list contains some traditional Caribbeanexports, the dominance of miscellaneousmanufactured products and nontraditional agriculturalitems on the list mostly reflects the success ofCaribbean nations in diversifying their exports inaccordance with the objectives of CBERA. Theimport values of some items on the list, including thetop-ranking leather footwear uppers, thesecond-ranking jewelry and jewelry parts, medical andsurgical instruments,29 hot-rolled bars and bar rods,and methanol posted significant gains in 1994.30
Figure 2-1 shows the composition of the leadingCBERA imports in 1994. Imports of leather footwearuppers grew by 34.8 percent, following a similar rateof increase in 1993 (table 2-8). The DominicanRepublic was by far the largest supplier.31 Combinedimports of fresh and frozen beef, the second largestcategory of CBERA imports, declined in 1994following a significant increase in 1993 when supplyfrom Australia was reduced.32 These CBERAimports were supplied mainly by Costa Rica andNicaragua. Imports of jewelry and jewelry parts,mostly from the Dominican Republic, were up by64.3 percent in 1994 due to increased U.S. demandfor the unique design of some of these low-cost items.Sugar imports under CBERA provisions declined in1994, apparently because of more restrictive U.S.quota levels.33 Notable in 1994 is the steep decline ofaromatic drugs imports, as the producer of this
27 For data concerning the early years of CBERA, seeUSITC, CBERA, Ninth Report, 1993, table 1-6, p. 16.
28 Total imports for some of these products alsoappear in table 2-3.
29 For a detailed discussion on CBERA imports ofmiscellaneous medical and surgical instruments andappliances and their impact on the U.S. industry, seeUSITC, CBERA, Ninth Report, 1993, pp. 49-50.
30 Those leading items shown in table 2-8 thatbenefited exclusively from CBERA duty-free treatment in1994 also appear on table 3-2 of this report.
31 For a detailed discussion on CBERA imports ofleather footwear uppers and their impact on the U.S.industry, see USITC, CBERA, Ninth Report, 1993, p. 46.
32 For a detailed discussion of CBERA imports ofbeef and their impact on the U.S. industry, see ibid., p. 47.
analgesic shifted parts of operations from Bahamianfacilities to Mexico.34 Other leading import itemsunder CBERA provisions shown on table 2-8 werecigars, pineapples, and electrical resistors.35
The CBERA utilization ratio, calculated as theratio of duty-free imports entered under CBERA tothe CBERA-eligible portion of total imports (i.e.,imports not excluded from CBERA benefits oralready eligible for MFN duty-free entry), provides anestimate of the extent to which the CBERA provisionshave been used. This ratio was 62.1 percent in 1994(table 2-9).
CBERA Imports by SourcesIn 1994, the Dominican Republic and Costa Rica
continued to lead all countries in taking advantage ofCBERA, as they have done virtually each year sincethe program became effective in 1984. These twocountries combined have been responsible for morethan one-half of overall annual U.S. imports underCBERA since 1989;36 in 1994 they provided 60.0percent of the total (table 2-10). Guatemala ranked asthe third major CBERA beneficiary in 1994 as it haseach year since 1989.37 In 1994, U.S. imports fromTrinidad and Tobago under CBERA more than tripled,making this country the fourth-ranking CBERAbeneficiary and displacing The Bahamas, which hadbeen the fourth-ranking country in 1993.38 Honduraswas fifth in 1993 and 1994.
Imports from the Dominican Republic were up by14.2 percent from 1993 to $751.0 million in 1994 asimports of the three leading items increased: leatherfootwear uppers, precious jewelry and parts, andmiscellaneous medical and surgical instruments. Table2-11 lists the leading items the United States importedunder CBERA from each of the beneficiaries in1994.39 By contrast, imports of raw cane sugar fromthe Dominican Republic declined during the year.
33 For a detailed discussion on CBERA imports ofraw cane sugar and their impact on the U.S. industry, seeibid., pp. 48-49.
34 For a detailed discussion of CBERA imports ofaromatic drugs and their impact on the U.S. industry, seeibid., pp. 46-47.
35 These three items and the impact of such importson the U.S. industry are discussed in chapter 3 of thisreport.
36 See USITC, CBERA, Ninth Report, 1993, table1-14, p. 27.
37 Ibid.38 The previously mentioned shift of aromatic drug
production to Mexico pushed The Bahamas as CBERAbeneficiary to eighth rank in 1994 from fourth rank in1993.
39 For the same data in 1993, see appendix table B-2in USITC, CBERA, Ninth Report, 1993, pp. B-4 to B-8.

Table 2-8Leading U.S. imports for consumption under CBERA provisions, 1992-94
1992 1993 1994
Percent Percent PercentHTS CBERA of total CBERA of total CBERA of total Leadingsubheading Description imports imports 1 imports imports 1 imports imports 1 source 2
1,000 1,000 1,000dollars dollars dollars
6406.10.6 Footwear uppers, other than formed, of leather 132,127 87.1 162,740 81.4 219,360 88.9 Dominican Republic. . . . . . . . 7113.19.50 Jewelry and jewelry parts of precious metal 40,038 69.7 84,682 93.9 139,224 94.8 Dominican Republic. . . . . . . . . . . 0202.30.60 Frozen boneless beef, except processed 68,581 93.8 113,250 89.4 101,758 95.5 Nicaragua. . . . . . . . . . . . . . 9018.90.8 Medical and surgical instruments and appliances 42,656 37.4 53,104 37.0 92,555 51.1 Dominican Republic. . . . . 0201.30.60 Fresh or chilled boneless beef, except processed 55,125 99.7 64,556 99.3 62,837 99.7 Costa Rica. . . . . . 1701.11.02 Other sugar to be used for the production
(other than by distillation) of polyhydric alcohols3 54,603 64.4 54,743 76.7 59,142 61.6 Guatemala. . . . . 7213.31.30 Bars and rods, hot-rolled, < 14mm in diameter, not
tempered, not treated and not partly manufactured 15,422 100.0 21,679 99.6 56,032 100.0 Trinidad and Tobago. . . 2905.11.20 Methanol (methyl alcohol), nesi 7,416 52.6 6,392 34.9 54,617 45.1 Trinidad and Tobago. . . . . . . . . . . . . . . . . . . . . . 1701.11.01 Cane sugar entered pursuant to its provisions3 139,026 79.9 76,231 42.9 52,156 39.0 Dominican Republic. . . . . . . . 2402.10.80 Cigars, cheroots, and cigarillos, over $0.23 each 32,721 96.3 38,539 96.1 50,073 97.9 Dominican Republic. . . . . . . 2207.10.60 Undenatured ethyl alcohol for nonbeverage use 23,830 90.6 40,690 99.2 47,450 93.4 Jamaica. . . . . . . . 0807.10.20 Cantaloupes, fresh, entered between 9/16-7/31 35,693 95.5 44,844 92.2 43,963 86.1 Costa Rica. . . . . . . . 0804.30.40 Pineapples, fresh or dried, not reduced in size,
in crates 33,742 80.2 35,431 82.7 35,884 94.0 Costa Rica. . . . . . . . . . . . . . . . . . . . . . . . . . . . . . . . . . . . . . . . 0302.69.40 Fish, nesi, excl. fillets, livers and roes, fresh or
chilled 20,128 71.3 28,138 84.5 34,989 91.5 Costa Rica. . . . . . . . . . . . . . . . . . . . . . . . . . . . . . . . . . . . . . . . . . 8538.90.804 Parts nesi for use with electrical apparatus 0 0.0 0 0.0 31,085 86.7 Dominican Republic. . . . . . . . . . . . 8516.31.00 Electrothermic hair dryers 20,213 66.7 26,992 69.9 28,938 72.6 Costa Rica. . . . . . . . . . . . . . . . . . . . . . . . . . . 8536.50.804 Electrical apparatus for switching or protecting
electrical circuits nesi 0 0.0 0 0.0 23,916 93.5 St. Kitts-Nevis. . . . . . . . . . . . . . . . . . . . . . . . . . . . . 2918.90.30 Aromatic drugs derived from carboxylic acids 78,594 21.4 152,260 88.6 23,261 91.6 Bahamas. . . . . . . . . . 9506.69.20 Baseballs and softballs 21,610 86.6 22,532 91.9 22,100 95.0 Costa Rica. . . . . . . . . . . . . . . . . . . . . . . . . . . . . 0807.10.70 Melons, nesi, fresh 20,057 98.3 24,227 98.6 21,122 91.4 Costa Rica. . . . . . . . . . . . . . . . . . . . . . . . . . . . . . . . .
Total of above items 841,588 8.9 1,051,035 10.4 1,200,467 10.7. . . . . . . . . . . . . . . . . . . . . . . . . . . . . .
Total, all items entering under CBERA 1,527,974 16.2 1,903,613 18.9 2,050,158 18.3. . . . . . . . . . . . . . 1 Indicates CBERA duty-free imports as a percent of total U.S. imports from CBERA countries. Leading U.S. imports from CBERA countries are shown
in table 2-3.2 Indicates leading CBERA source based on total U.S. imports for consumption during 1994.3 HTS subheadings 1701.11.01 and 1701.11.02 (along with 1701.11.03) were created on Oct. 1, 1990 from former subheading 1701.11.00; combined
CBERA sugar imports under these subheadings totaled $193.6 million in 1992, $130.9 million in 1993 and $111.3 million in 1994.4 HTS subheadings 8536.50.80 and 8538.90.80 became effective Jan. 1994.
Note.-Because of rounding, figures may not add to the totals shown.Source: Compiled from official statistics of the U.S. Department of Commerce.

18
Footwear uppers 10.9%
Other 41.6%
Aromatic drugs 1.2%
Fresh/frozen beef 8.2%
Figure 2-1Composition of leading CBERA duty-free imports, 1994
Jewelry 6.9%
Sugars 5.5%
Medical/surgical instruments 4.6%
Cantaloupes/melons 3.2%
Hot-rolled bars/rods 2.8%Electrical apparatus and parts 2.7%
Methanol 2.7%
Cigars 2.5%
Hair dryers 1.4%Fresh/chilled fish 1.7%
Fresh/dried pineapples 1.8%
Ethyl alcohol 2.3%
ÇÇÇÇÇÇÇÇÇÇÇÇÇÇÇÇÇÇÇÇÇÇÇÇÇÇÇÇÇÇÇÇÇÇÇÇÇÇÇÇÇÇÇÇÇÇÇÇÇÇÇÇÇÇ
ÁÁÁÁÁÁÁÁÁÁÁÁÁÁÁÁÁÁÁÁÁÁÁÁÁÁÁÁÁÁÁÁÁÁÁÁÁÁÁÁÊÊÊÊÊÊÊÊÊÊÊÊÊÊÊÊÊÊÊÊÊÊÊÊÊÊÊÊÊÊÊÊ
ÂÂÂÂÂÂÂÂÂÂÂÂÂÂÂÂÂÂÂÂÂÂÂÂÂÂÂÂÂÂÂÂÂÂÂÂÂÂÂÂÂÂÂÂÂÂÂÂ
ËËËËËËËËËËËËËËËËËËËËËËËËËËËËËËËËËËËËËËËËËËËËËËËËË
ÉÉÉÉÉÉÉÉÉÉÉÉÉÉÉÉÉÉÉÉÉÉÉÉÉÉÉÉÉÉÉÉÉÉÉÉÉÉÉÉ
ÀÀÀÀÀÀÀÀÀÀÀÀÀÀÀÀÀÀÀÀÀÀÀÀÀÀÀÀÀÀÀÀ
ÊÊÊÊÊÊÊÊÊÊÊÊÊÊÊÊÊÊÊÊÊÊÊÊÊÊÊ
ÅÅÅÅÅÅÅÅÅÅÅÅÅÅÅÅÅÅÅÅÅÅÅÅÅÅÅ
ÈÈÈÈÈÈÈÈÈÈÈÈÈÈÈÈÈÈÈÈÈÈÈÈÈÈÈÈÈÈÈÈÈÈÈÈ
ËËËËËËËËËËËËËËËËËËËËËËËËËËËËËËËËËËËËËËËË
ÂÂÂÂÂÂÂÂÂÂÂÂÂÂÂÂÂÂÂÂÂÂÂÂÂÂÂÂÂÂÂÂÂÂÂÂÂÂÂÂ
Source: Compiled from official statistics of the U.S. Department of Commerce.
Table 2-9U.S. imports for consumption: CBERA eligibility and utilization, 1990-94
Item 1990 1991 1992 1993 1994
Eligible duty-free under CBERA (1,000 dollars)1 2,136,701 2,272,420 2,819,213 3,033,597 3,250,004. . . . . . . . . . . . . . . . . .
Duty-free under CBERA(1,000 dollars)2 1,022,686 1,120,697 1,498,556 1,865,544 2,018,220. . . . . . . . . . . . . . . . . .
CBERA utilization ratio(percent)3 47.86 49.32 53.15 61.49 62.09. . . . . . . . . . . . . . . . . . . . . . .
1 Calculated as total imports from CBERA countries (table 2-7) minus imports not eligible for CBERA duty-freeentry (table 2-5) minus MFN duty-free imports (table 2-7).
2 From table 2-7.3 Utilization ratio = (entered duty-free entries/eligible entries) * 100.
Source: Calculated from official statistics of the U.S. Department of Commerce.

19
Table 2-10U.S. imports for consumption under CBERA provisions, by sources, 1990-94
(1,000 dollars)
Rank Country 1990 1991 1992 1993 1994
1 Dominican Republic 311,075 402,507 567,022 657,673 751,028. . . . . . . . . . . . 2 Costa Rica 218,380 249,553 294,937 388,251 478,109. . . . . . . . . . . . . . . . . . . . 3 Guatemala 154,205 137,157 192,955 208,262 171,381. . . . . . . . . . . . . . . . . . . . 4 Trinidad and Tobago 38,274 26,542 44,695 44,602 142,901. . . . . . . . . . . . 5 Honduras 67,891 80,464 112,512 127,399 139,838. . . . . . . . . . . . . . . . . . . . . 6 Nicaragua 174 16,849 40,018 74,408 80,554. . . . . . . . . . . . . . . . . . . . . 7 Jamaica 60,689 60,080 48,156 76,496 69,316. . . . . . . . . . . . . . . . . . . . . . . 8 Bahamas 8,578 10,652 93,324 167,110 45,062. . . . . . . . . . . . . . . . . . . . . . 9 El Salvador 28,313 30,041 27,249 26,530 41,126. . . . . . . . . . . . . . . . . . . . 10 Panama 12,344 17,417 23,753 38,523 35,141. . . . . . . . . . . . . . . . . . . . . . . 11 Barbados 15,198 15,728 15,478 20,176 21,313. . . . . . . . . . . . . . . . . . . . . . 12 St. Kitts and Nevis 10,136 5,857 14,172 15,985 17,220. . . . . . . . . . . . . . 13 Haiti 63,793 50,053 19,151 33,378 15,770. . . . . . . . . . . . . . . . . . . . . . . . . . 14 Belize 18,566 5,445 23,733 12,526 13,112. . . . . . . . . . . . . . . . . . . . . . . . . 15 Guyana 521 506 1,202 1,246 13,100. . . . . . . . . . . . . . . . . . . . . . . 16 St. Lucia 3,552 3,195 3,957 4,463 6,077. . . . . . . . . . . . . . . . . . . . . . 17 Netherlands Antilles 4,518 5,241 2,964 3,489 3,214. . . . . . . . . . . . 18 Dominica 1,330 1,365 1,008 1,293 2,112. . . . . . . . . . . . . . . . . . . . . . 19 St. Vincent and Grenadines 1,517 140 165 233 1,299. . . . . . 20 Montserrat 0 0 41 271 886. . . . . . . . . . . . . . . . . . . . . 21 Antigua 675 548 324 1,110 809. . . . . . . . . . . . . . . . . . . . . . . 22 Grenada 2,809 1,307 1,081 144 768. . . . . . . . . . . . . . . . . . . . . . 23 Aruba 4 0 10 21 12. . . . . . . . . . . . . . . . . . . . . . . . . 24 British Virgin Islands 157 52 68 17 11. . . . . . . . . . . .
Total 1,022,699 1,120,697 1,527,974 1,903,606 2,050,158. . . . . . . . . . . . . . . . . . . . . . . .
Note.—Figures may not add to the totals given due to rounding. Data include both CBERA duty free andreduced-duty eligible items.
Source: Compiled from official statistics of the U.S. Department of Commerce.
Imports under CBERA from Costa Rica were alsoup in 1994, rising by 23.2 percent from 1993 to$478.1 million. Imports of precious jewelry and partsmore than doubled, making these products the leadingimport item from Costa Rica under CBERA. Frozenbeef and pineapples also continued to be leading itemsunder CBERA.40
Imports under CBERA from Guatemala declinedby 17.8 percent in 1994 to $171.4 million, owing tosharp drops in imports of sugar, the leading item, andof cigarette leaf tobacco and frozen beef. The triplingof CBERA imports during the year from Trinidad andTobago is attributable to two items: hot-rolled steeland iron rod, and methanol. Imports of the top item,hot-rolled steel and iron rod, more than doubledcompared with 1993 imports; they were responsiblefor 39.2 percent of all CBERA imports from thatcountry. Imports of methanol soared to 10 times their1993 value in 1994, to account for 38.2 percent of all1994 imports under CBERA from Trinidad and
40 See chapter 3 for additional information onpineapple imports and their impact on the U.S. industry.
Tobago. This development reflected, in part, Trinidadand Tobago’s enhanced supply capacity as thecountry began to produce methanol from reformednatural gas.41 The larger imports were alsoattributable to greater U.S. demand for end uses ofmethanol, including for gasoline oxygenate additivesand octane enhancers.42
Owing to large duty-free shipments under CBERAof certain aromatic drugs, The Bahamas ranked fourthamong CBERA beneficiaries in 1993. As previouslynoted, shipments of this analgesic in 1994 dropped toonly 15.3 percent of their 1993 value as productionwas shifted to Mexico, pushing The Bahamas toeighth rank as a CBERA beneficiary. CBERA importsfrom Honduras, led by imports of beef, were up 9.7percent in 1994, amounting to $139.8 million.
41 Reformed natural gas results from the catalyticconversion of natural gas from methane.
42 Although methanol enters under CBERA, it couldalso enter under GSP. Because methanol is therefore notan item benefiting exclusively from CBERA, the effect ofits imports from CBERA countries on the U.S. industryhas not been discussed in this series of reports.

20
Table 2-11Leading U.S. imports for consumption entering under CBERA provisions, by sources, 1994
Percent of1994 total 1994CBERA CBERA
Source HTS No. Description imports imports
(1,000 dollars)
Antigua 8534.00.00 Printed circuits, without elements 356 44.0. . . . . . . . . . . . . . . . . . . . . . . . . . . 0302.69.40 Fish, nesoi, excl. fillets, livers and roes, fresh 348 43.0. . . . . . . . . . . . . . 9114.90.30 Assemblies and subassemblies for clock movements 48 5.9. . . . . . . 8207.30.60 Interchangeable tools for pressing, stamping 34 4.2. . . . . . . . . . . . . .
Total 786 97.1. . . . . . . . . . . . . . . . . . . . . . . . . . . . . . . . . . . . . . . . .
Aruba 9030.10.00 Parts of pumps 4 33.3. . . . . . . . . . . . . . . . . . . . . . . . . . . . . . . . . . . . . . . . . . . . . 7113.19.50 Jewelry and jewelry parts of precious metal 3 25.0. . . . . . . . . . . . . . . 6204.69.90 Women’s or girls’ trousers, bib & brace . . . .
overalls, nesi 3 25.0. . . . . . . . . . . . . . . . . . . . . . . . . . . . . . . . . . . . 8207.90.75 Interchangeable tools nesi, not suitable for cutting 2 16.7. . . . . . . . . .
Total 12 100.0. . . . . . . . . . . . . . . . . . . . . . . . . . . . . . . . . . . . . . . . .
Bahamas 2918.90.30 Aromatic drugs derived from carboxylic acids 23,261 51.6. . . . . . . . . . . . . . . 3812.30.40 Antioxidizing preparations & other compound . . . .
stabilizers 5,654 12.5. . . . . . . . . . . . . . . . . . . . . . . . . . . . . . . . . . . . . . 2937.22.00 Halogenated derivatives of adrenalcortical . . . .
hormones 5,297 11.7. . . . . . . . . . . . . . . . . . . . . . . . . . . . . . . . . . . . . . 2922.19.50 Nonaromatic alcohols, their ethers and esters 4,200 9.3. . . . . . . . . . . . . 0509.00.00 Natural sponges of animal origin 1,185 2.6. . . . . . . . . . . . . . . . . . . . . . . . . 2916.39.70 Aromatic monocarboxylic acids, nesi 1,163 2.6. . . . . . . . . . . . . . . . . . . . .
Total 40,760 90.4. . . . . . . . . . . . . . . . . . . . . . . . . . . . . . . . . . . . . . . . .
Barbados 8533.31.00 Electrical wirewound variable resistors 9,375 44.0. . . . . . . . . . . . . . . . . . . . . 9032.89.60 Automatic regulating or controlling instruments 4,807 22.6. . . . . . . . . . . . 2208.40.00 Rum and tafia 1,922 9.0. . . . . . . . . . . . . . . . . . . . . . . . . . . . . . . . . . . . . . . . . 8533.39.00 Electrical wirewound variable resistors 1,134 5.3. . . . . . . . . . . . . . . . . . . . 8533.21.00 Fixed electrical resistors 857 4.0. . . . . . . . . . . . . . . . . . . . . . . . . . . . . . . .
Total 18,095 84.9. . . . . . . . . . . . . . . . . . . . . . . . . . . . . . . . . . . . . . . . .
Belize 2009.11.00 Orange juice, frozen, unfermented 8,826 67.3. . . . . . . . . . . . . . . . . . . . . . . . . . . . 1702.90.40 Other cane/beet syrups nesi 1,008 7.7. . . . . . . . . . . . . . . . . . . . . . . . . . . . 1702.90.35 Invert molasses 991 7.6. . . . . . . . . . . . . . . . . . . . . . . . . . . . . . . . . . . . . . . 0807.20.00 Papayas (papaws), fresh 775 5.9. . . . . . . . . . . . . . . . . . . . . . . . . . . . . . . 2009.20.40 Grapefruit juice, unfermented, frozen 547 4.1. . . . . . . . . . . . . . . . . . . . . 1703.10.50 Cane molasses nesi 296 2.3. . . . . . . . . . . . . . . . . . . . . . . . . . . . . . . . . . .
Total 12,443 94.9. . . . . . . . . . . . . . . . . . . . . . . . . . . . . . . . . . . . . . . . .
British VirginIslands 4911.91.40 Pictures, designs, and photographs 7 63.6. . . . . . . . . . . . . . . . . . . . . . . . . .
8413.81.00 Pumps for liquids, not fitted with a measuring device 3 27.3. . . . . . . 3924.10.50 Tableware and kitchenware articles, nesi of plastic 1 9.1. . . . . . . . .
Total 11 100.0. . . . . . . . . . . . . . . . . . . . . . . . . . . . . . . . . . . . . . . . .
Costa 7113.19.50 Jewelry and jewelry parts of precious metal 45,070 9.4. . . . . . . . . . . . . . . . . . . . Rica 0202.30.60 Frozen boneless beef, except processed 31,929 6.7. . . . . . . . . . . . . . . . .
8516.31.00 Electrothermic hair dryers 28,939 6.1. . . . . . . . . . . . . . . . . . . . . . . . . . . . . . . 0804.30.40 Pineapples, fresh or dried, not reduced in size 28,534 6.0. . . . . . . . . . . . 9018.90.80 Medical and surgical instruments and appliances 21,683 4.5. . . . . . . . . . 0201.30.60 Fresh or chilled boneless beef, except processed 19,521 4.1. . . . . . . . . . 0807.10.20 Cantaloupes, fresh, entered between 9/16-7/31 18,500 3.9. . . . . . . . . . . 1701.11.02 Sugar used in production of polyhydric alcohols 16,675 3.5. . . . . . . . . . . 4016.93.50 Articles of vulcanized rubber other than hard rubber 16,198 3.4. . . . . . . . 0302.69.40 Fish, nesi, excl. fillets, livers and roes, fresh 14,555 3.0. . . . . . . . . . . . . . 9506.69.20 Baseballs and softballs 13,075 2.7. . . . . . . . . . . . . . . . . . . . . . . . . . . . . . . . .
See footnotes at end of table.

21
Table 2-11—ContinuedLeading U.S. imports for consumption entering under CBERA provisions, by sources, 1994
Percent of1994 total 1994CBERA CBERA
Source HTS No. Description imports imports
(1,000 dollars)
Costa 8533.40.80 Variable resistors, incl. rheostats, . . . . Rica potentiometers nesi 12,625 2.6. . . . . . . . . . . . . . . . . . . . . . . . . . . . . . Cont. 2207.10.60 Undenatured ethyl alcohol, for nonbeverage use 11,346 2.4. . . . . . . . . .
0807.10.70 Melons, nesi, fresh 11,288 2.4. . . . . . . . . . . . . . . . . . . . . . . . . . . . . . . . . . . . . 0714.10.00 Cassava (manioc), fresh or dried 10,046 2.1. . . . . . . . . . . . . . . . . . . . . . . . 3926.90.95 Articles of plastics of heading 3901, 3904, nesi 7,932 1.7. . . . . . . . . . . . 9018.39.00 Medical and dental instruments and appliances nesi 7,805 1.6. . . . . . . . 0714.90.10 Fresh dasheens, whether or not sliced 7,343 1.5. . . . . . . . . . . . . . . . . . . . 4418.20.80 Wooden doors and their frames and thresholds, nesi 7,237 1.5. . . . . . . 0603.10.80 Cut flowers and flower buds 6,997 1.5. . . . . . . . . . . . . . . . . . . . . . . . . . . . . 0603.10.70 Chrysanthemums, standard carnations, anthuriums 6,670 1.4. . . . . . . . 0709.90.10 Chayote, fresh or chilled 6,594 1.4. . . . . . . . . . . . . . . . . . . . . . . . . . . . . . . . 4016.93.10 Gaskets, washers, seals used in chapter 87 5,858 1.2. . . . . . . . . . . . . . . 8505.19.00 Permanent magnets nesi 5,632 1.2. . . . . . . . . . . . . . . . . . . . . . . . . . . . . . . 8536.50.80 Electrical apparatus for switching or protecting . . . .
circuits 5,022 1.1. . . . . . . . . . . . . . . . . . . . . . . . . . . . . . . . . . . . . . . . . 2008.99.13 Banana pulp, otherwise prepared or preserved 4,921 1.0. . . . . . . . . . . . 0714.90.20 Fresh yams, whether or not sliced 4,703 1.0. . . . . . . . . . . . . . . . . . . . . . . 9403.70.40 Furniture of reinforced or laminated plastics 4,579 1.0. . . . . . . . . . . . . . .
Total 381,277 79.7. . . . . . . . . . . . . . . . . . . . . . . . . . . . . . . . . . . . . . . . .
Dominica 3401.11.50 Soap, nesoi, organic surface active products 1,903 90.1. . . . . . . . . . . . . . . . 2103.90.60 Mixed condiments and mixed seasonings 43 2.0. . . . . . . . . . . . . . . . . 3301.90.10 Extracted oleoresins 29 1.4. . . . . . . . . . . . . . . . . . . . . . . . . . . . . . . . . . . 2009.30.60 Concentrated juice of any single citrus fruit 19 0.9. . . . . . . . . . . . . . . 0709.60.00 Fruits of the genus capsicum (peppers) 17 0.8. . . . . . . . . . . . . . . . . . .
Total 2,011 95.2. . . . . . . . . . . . . . . . . . . . . . . . . . . . . . . . . . . . . . . . .
DominicanRepublic 6406.10.65 Footwear uppers, other than formed, of leather 205,959 27.4. . . . . . . . . . . . . .
7113.19.50 Jewelry and jewelry parts of precious metal 90,086 12.0. . . . . . . . . . . . . . . 9018.90.80 Medical and surgical instruments and appliances 70,433 9.4. . . . . . . . . . 2402.10.80 Cigars, cheroots, and cigarillos 34,610 4.6. . . . . . . . . . . . . . . . . . . . . . . . . . 1701.11.01 Raw cane sugar, no flavoring/coloring, quota 32,283 4.3. . . . . . . . . . . . . . 8538.90.80 Molded parts nesi 29,439 3.9. . . . . . . . . . . . . . . . . . . . . . . . . . . . . . . . . . . . . . 4202.12.801 Trunks, suitcases, occupational luggage 12,617 1.7. . . . . . . . . . . . . . . . . 8535.40.00 Lightning arrestors,voltage limiters & surge . . . .
suppressors 10,265 1.4. . . . . . . . . . . . . . . . . . . . . . . . . . . . . . . . . . . . 8536.90.00 Electrical apparatus, nesoi, for switching 10,212 1.4. . . . . . . . . . . . . . . . . 7113.19.21 Rope necklaces and neck chains of gold 9,832 1.3. . . . . . . . . . . . . . . . . . 0202.30.60 Frozen boneless beef, except processed 9,041 1.2. . . . . . . . . . . . . . . . . 8536.50.80 Electrical apparatus for switching or protecting . . . .
circuits 8,845 1.2. . . . . . . . . . . . . . . . . . . . . . . . . . . . . . . . . . . . . . . . . 8305.20.00 Staples in strips 8,228 1.1. . . . . . . . . . . . . . . . . . . . . . . . . . . . . . . . . . . . . . . 8517.10.00 Telephone sets 7,991 1.1. . . . . . . . . . . . . . . . . . . . . . . . . . . . . . . . . . . . . . . . 8531.90.80 Parts for electric sound or visual signaling apparatus 7,918 1.1. . . . . . . 9615.90.60 Hair accessories, and parts thereof, nesi 7,500 1.0. . . . . . . . . . . . . . . . . . 8511.90.60 Parts nesi of electrical ignition or starting equipment 7,043 0.9. . . . . . . . 1703.10.50 Cane molasses 7,043 0.9. . . . . . . . . . . . . . . . . . . . . . . . . . . . . . . . . . . . . . . .
Total 569,345 75.8. . . . . . . . . . . . . . . . . . . . . . . . . . . . . . . . . . . . . . . . .
El Salvador 2207.10.60 Undenatured ethyl alcohol, for nonbeverage use 10,875 26.4. . . . . . . . . . 8532.24.00 Ceramic dielectric fixed capacitors, multilayer 6,368 15.5. . . . . . . . . . . . . 1701.11.02 Sugar used in production of polyhydric alcohols 3,400 8.3. . . . . . . . . . . 4819.40.00 Sacks and bags, nesoi, including cones, of paper 1,937 4.7. . . . . . . . . . 6203.39.40 Men’s or boys’ suit-type jackets and blazers 1,847 4.5. . . . . . . . . . . . . . 0807.10.70 Melons, nesoi, fresh 1,656 4.0. . . . . . . . . . . . . . . . . . . . . . . . . . . . . . . . . . .
See footnotes at end of table.

22
Table 2-11—ContinuedLeading U.S. imports for consumption entering under CBERA provisions, by sources, 1994
Percent of1994 total 1994CBERA CBERA
Source HTS No. Description imports imports
(1,000 dollars)
El Salvador 6204.69.90 Women’s or girls’ trousers, bib and brace overalls 1,566 3.8. . . . . . . . . . Cont. 7615.10.70 Aluminum cooking and kitchenware, not enameled 1,215 3.0. . . . . . . . .
3923.10.00 Boxes, cases, crates and similar articles 1,127 2.7. . . . . . . . . . . . . . . . . . 1703.10.50 Cane molasses 917 2.2. . . . . . . . . . . . . . . . . . . . . . . . . . . . . . . . . . . . . . . .
Total 30,908 75.2. . . . . . . . . . . . . . . . . . . . . . . . . . . . . . . . . . . . . . . . .
Grenada 8409.99.99 Parts nesi, used solely or principally with . . . . . . compressors 261 34.0. . . . . . . . . . . . . . . . . . . . . . . . . . . . . . . . . . . .
9018.90.80 Medical and surgical instruments and appliances 235 30.6. . . . . . . . . . 0809.40.40 Plums, prunes and sloes, fresh 80 10.4. . . . . . . . . . . . . . . . . . . . . . . . . .
Total 576 75.0. . . . . . . . . . . . . . . . . . . . . . . . . . . . . . . . . . . . . . . . .
Guatemala 1701.11.02 Sugar used in production of polyhydric alcohols 23,988 14.0. . . . . . . . . . . 0710.80.97 Other frozen vegetables reduced in size 11,823 6.9. . . . . . . . . . . . . . . . . . 0807.10.20 Cantaloupes, fresh, entered between 9/16-7/31 10,210 6.0. . . . . . . . . . . 0201.30.60 Fresh or chilled boneless beef, except processed 7,450 4.3. . . . . . . . . . 0710.80.93 Okra 7,062 4.1. . . . . . . . . . . . . . . . . . . . . . . . . . . . . . . . . . . . . . . . . . . . . . . . . 0202.30.60 Frozen boneless beef, except processed 6,566 3.8. . . . . . . . . . . . . . . . . 2401.20.80 Tobacco, partly or wholly stemmed 6,417 3.7. . . . . . . . . . . . . . . . . . . . . . . 0603.10.60 Roses, fresh cut 6,336 3.7. . . . . . . . . . . . . . . . . . . . . . . . . . . . . . . . . . . . . . . 1701.11.01 Raw cane sugar, no flavoring/coloring, quota 4,912 2.9. . . . . . . . . . . . . . 0708.10.40 Peas, fresh or chilled, shelled or unshelled 4,716 2.8. . . . . . . . . . . . . . . 6204.69.90 Women’s or girls’ trousers, bib and brace . . . .
overalls, nesi 4,492 2.6. . . . . . . . . . . . . . . . . . . . . . . . . . . . . . . . . . . 2924.29.19 Aromatic pesticides of cyclic amides 4,419 2.6. . . . . . . . . . . . . . . . . . . . . 0710.80.70 Other frozen vegetables not reduced in size 3,863 2.3. . . . . . . . . . . . . . 6910.10.00 Ceramic sanitary fixtures, of porcelain or china 3,843 2.2. . . . . . . . . . . . 2401.10.60 Cigarette leaf, not stemmed, not oriental 3,456 2.0. . . . . . . . . . . . . . . . . . 0807.10.70 Melons, nesi, fresh 3,392 2.0. . . . . . . . . . . . . . . . . . . . . . . . . . . . . . . . . . . . . 0802.90.90 Nuts nesi, shelled, fresh or dried 2,939 1.7. . . . . . . . . . . . . . . . . . . . . . . . . 6204.39.80 Women’s or girls’ ensembles of artificial . . . .
fibers nesi 2,680 1.6. . . . . . . . . . . . . . . . . . . . . . . . . . . . . . . . . . . . . . 0710.21.40 Peas, uncooked, cooked by steaming, . . . .
boiling in water 2,278 1.3. . . . . . . . . . . . . . . . . . . . . . . . . . . . . . . . . . 9505.10.25 Christmas ornaments, other than of glass or wood 2,025 1.2. . . . . . . . . 1703.10.50 Cane molasses nesi 1,689 1.0. . . . . . . . . . . . . . . . . . . . . . . . . . . . . . . . . . . 3923.21.00 Sacks and bags (including cones) 1,672 1.0. . . . . . . . . . . . . . . . . . . . . . . . 4015.19.10 Seamless gloves of vulcanized rubber, . . . .
not surgical 1,666 1.0. . . . . . . . . . . . . . . . . . . . . . . . . . . . . . . . . . . . . 4203.30.00 Belts and bandoliers with or without buckles, . . . .
of leather 1,657 1.0. . . . . . . . . . . . . . . . . . . . . . . . . . . . . . . . . . . . . . .
Total 129,551 75.6. . . . . . . . . . . . . . . . . . . . . . . . . . . . . . . . . . . . . . . . .
Guyana 1701.11.01 Raw cane sugar, no flavoring/coloring, quota 9,314 71.1. . . . . . . . . . . . . . . . . 4412.12.20 Plywood of wood sheets of nonconiferous wood 1,482 11.3. . . . . . . . . . . 4412.11.20 Plywood of wood sheets of tropical wood 986 7.5. . . . . . . . . . . . . . . . .
Total 11,782 89.9. . . . . . . . . . . . . . . . . . . . . . . . . . . . . . . . . . . . . . . . .
Haiti 9506.69.20 Baseballs and softballs 2,549 16.2. . . . . . . . . . . . . . . . . . . . . . . . . . . . . . . . . . . . . . . 6116.10.451 Gloves, mittens & mitts (excl. ski/snowmobile) 1,639 10.4. . . . . . . . . . . 0804.50.40 Guavas, and mangosteens, fresh 1,559 9.9. . . . . . . . . . . . . . . . . . . . . . . . 0811.90.52 Mangoes 1,153 7.3. . . . . . . . . . . . . . . . . . . . . . . . . . . . . . . . . . . . . . . . . . . . . 8544.51.80 Insulated electric conductors nesi 592 3.8. . . . . . . . . . . . . . . . . . . . . . . . 7326.90.90 Articles of iron or steel, nesi 575 3.6. . . . . . . . . . . . . . . . . . . . . . . . . . . . . 8504.90.90 Parts for electric transformers, static converters nesi 570 3.6. . . . . . . 8536.69.00 Plugs and sockets for making connections 455 2.9. . . . . . . . . . . . . . . .
See footnotes at end of table.

23
Table 2-11—ContinuedLeading U.S. imports for consumption entering under CBERA provisions, by sources, 1994
Percent of1994 total 1994CBERA CBERA
Source HTS No. Description imports imports
(1,000 dollars)
Haiti 6210.10.40 Garments, not knitted or crocheted, made up of fabric 453 2.9. . . . . . Cont. 8538.90.80 Molded parts nesi 374 2.4. . . . . . . . . . . . . . . . . . . . . . . . . . . . . . . . . . . . . .
4818.50.00 Articles of apparel and clothing accessories 303 1.9. . . . . . . . . . . . . . . 4106.19.20 Goat or kidskin leather, wet blues 297 1.9. . . . . . . . . . . . . . . . . . . . . . . . 4105.19.10 Sheep or lamb skin, wet blues 269 1.7. . . . . . . . . . . . . . . . . . . . . . . . . . . 8504.50.00 Inductors nesi 269 1.7. . . . . . . . . . . . . . . . . . . . . . . . . . . . . . . . . . . . . . . . . 4016.99.35 Vibration control goods of natural rubber 259 1.6. . . . . . . . . . . . . . . . . . 6116.10.13 Gloves, mittens and mitts of vegetable fibers 247 1.6. . . . . . . . . . . . . . 8903.10.00 Inflatable vessels, row boats and canoes . . . .
for pleasure 244 1.5. . . . . . . . . . . . . . . . . . . . . . . . . . . . . . . . . . . . . 8533.90.80 Parts for subheading 8533.40, ceramic or . . . .
metallic nesi 222 1.4. . . . . . . . . . . . . . . . . . . . . . . . . . . . . . . . . . . .
Total 12,029 76.2. . . . . . . . . . . . . . . . . . . . . . . . . . . . . . . . . . . . . . . . .
Honduras 0202.30.60 Frozen boneless beef, except processed 21,613 15.5. . . . . . . . . . . . . . . . . . 0201.30.60 Fresh or chilled boneless beef, except processed 17,032 12.2. . . . . . . . . . 0807.10.20 Cantaloupes, fresh, entered between 9/16-7/31 11,096 7.9. . . . . . . . . . . 2402.10.80 Cigars, cheroots, and cigarillos 9,845 7.0. . . . . . . . . . . . . . . . . . . . . . . . . . 6406.10.65 Footwear uppers, other than formed, of leather 9,765 7.0. . . . . . . . . . . . 9506.69.20 Baseballs and softballs 6,303 4.5. . . . . . . . . . . . . . . . . . . . . . . . . . . . . . . . . 0804.30.40 Pineapples, fresh or dried, not reduced in size 5,704 4.1. . . . . . . . . . . . 9603.90.80 Brooms and brushes nesi, mops, hand-operated 4,966 3.6. . . . . . . . . . 3923.21.00 Sacks and bags (including cones) 4,857 3.5. . . . . . . . . . . . . . . . . . . . . . . . 6210.10.40 Garments, not knitted or crocheted, made up . . . .
of fabric 3,550 2.5. . . . . . . . . . . . . . . . . . . . . . . . . . . . . . . . . . . . . . . . 9403.50.90 Wooden furniture other than seats 3,289 2.4. . . . . . . . . . . . . . . . . . . . . . . 2402.10.60 Cigars, cheroots and cigarillos containing . . . .
tobacco 2,649 1.9. . . . . . . . . . . . . . . . . . . . . . . . . . . . . . . . . . . . . . . . 9403.60.80 Wooden (except bent-wood) furniture other . . . .
than seats 2,469 1.8. . . . . . . . . . . . . . . . . . . . . . . . . . . . . . . . . . . . . . 2401.10.60 Cigarette leaf, not stemmed, not oriental 2,416 1.7. . . . . . . . . . . . . . . . . .
Total 105,554 75.5. . . . . . . . . . . . . . . . . . . . . . . . . . . . . . . . . . . . . . . . .
Jamaica 2207.10.60 Undenatured ethyl alcohol, for nonbeverage use 25,229 36.4. . . . . . . . . . . . . . 0714.90.20 Fresh yams, whether or not sliced 6,693 9.7. . . . . . . . . . . . . . . . . . . . . . . 2208.40.00 Rum and tafia 6,658 9.6. . . . . . . . . . . . . . . . . . . . . . . . . . . . . . . . . . . . . . . . . 2402.10.80 Cigars, cheroots, and cigarillos 5,444 7.9. . . . . . . . . . . . . . . . . . . . . . . . . . 2203.00.00 Beer made from malt 2,835 4.1. . . . . . . . . . . . . . . . . . . . . . . . . . . . . . . . . . . 2208.90.45 Cordials, liqueurs, kirschwasser and ratafia 2,763 4.0. . . . . . . . . . . . . . . 8536.90.00 Electrical apparatus nesi, for switching 1,841 2.7. . . . . . . . . . . . . . . . . . . 2103.90.60 Mixed condiments and mixed seasonings 1,583 2.3. . . . . . . . . . . . . . . . . 0807.20.00 Papayas (papaws), fresh 1,532 2.2. . . . . . . . . . . . . . . . . . . . . . . . . . . . . . .
Total 54,578 78.7. . . . . . . . . . . . . . . . . . . . . . . . . . . . . . . . . . . . . . . . .
Montserrat 8535.90.80 Terminals, electrical splices and couplings 469 52.9. . . . . . . . . . . . . . . . . 8538.90.80 Molded parts nesi 413 46.6. . . . . . . . . . . . . . . . . . . . . . . . . . . . . . . . . . . . . .
Total 882 99.5. . . . . . . . . . . . . . . . . . . . . . . . . . . . . . . . . . . . . . . . .
NetherlandsAntilles 4818.10.00 Toilet paper 744 23.1. . . . . . . . . . . . . . . . . . . . . . . . . . . . . . . . . . . . . . . . . . . . . .
7326.20.00 Articles of iron or steel wire, nesi 304 9.5. . . . . . . . . . . . . . . . . . . . . . . . . 8504.31.40 Electrical transformers, nesi 225 7.0. . . . . . . . . . . . . . . . . . . . . . . . . . . . . 8544.60.20 Electric conductors voltage > 1000 with connectors 225 7.0. . . . . . . . 8524.21.30 Pre-recorded magnetic tapes, of certain width 224 7.0. . . . . . . . . . . . . 8544.41.00 Electric conductors, volt >80 <1000 with connectors 201 6.3. . . . . . . 3823.20.00 Naphthenic acids, their water-insoluble salts 120 3.7. . . . . . . . . . . . . .
See footnotes at end of table.
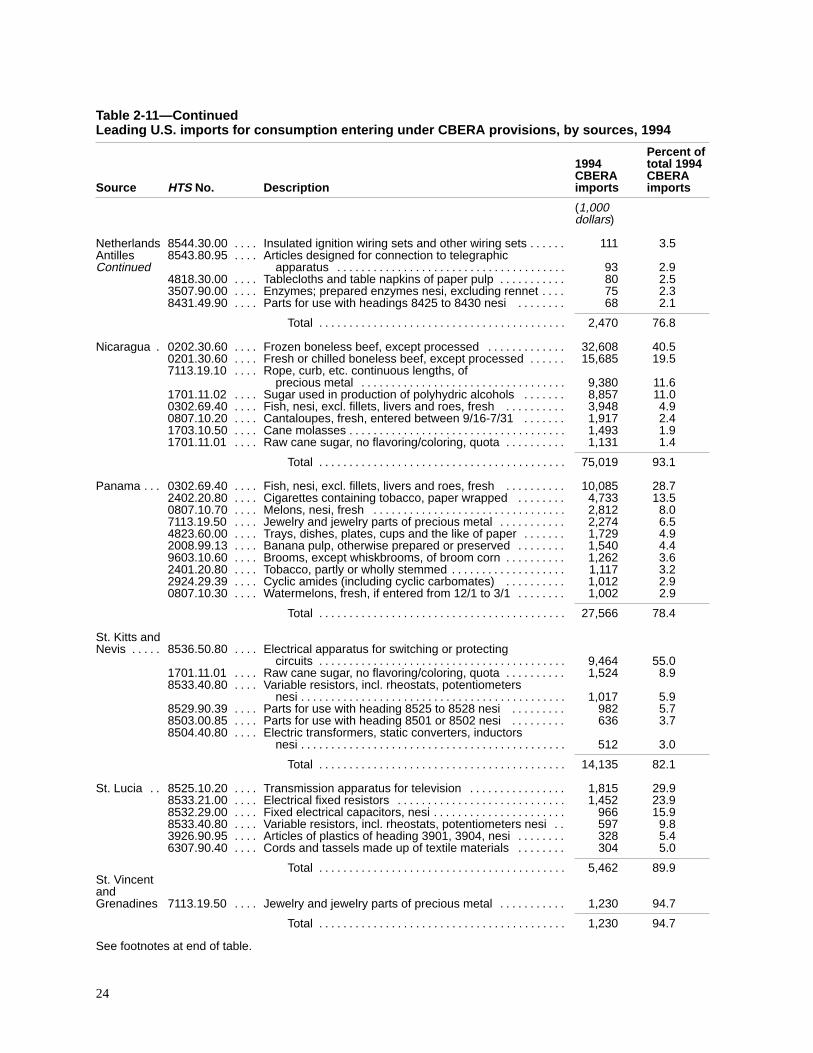
24
Table 2-11—ContinuedLeading U.S. imports for consumption entering under CBERA provisions, by sources, 1994
Percent of1994 total 1994CBERA CBERA
Source HTS No. Description imports imports
(1,000 dollars)
Netherlands 8544.30.00 Insulated ignition wiring sets and other wiring sets 111 3.5. . . . . . . . . . Antilles 8543.80.95 Articles designed for connection to telegraphic . . . . Continued apparatus 93 2.9. . . . . . . . . . . . . . . . . . . . . . . . . . . . . . . . . . . . . .
4818.30.00 Tablecloths and table napkins of paper pulp 80 2.5. . . . . . . . . . . . . . . 3507.90.00 Enzymes; prepared enzymes nesi, excluding rennet 75 2.3. . . . . . . . 8431.49.90 Parts for use with headings 8425 to 8430 nesi 68 2.1. . . . . . . . . . . .
Total 2,470 76.8. . . . . . . . . . . . . . . . . . . . . . . . . . . . . . . . . . . . . . . . .
Nicaragua 0202.30.60 Frozen boneless beef, except processed 32,608 40.5. . . . . . . . . . . . . . . . . . 0201.30.60 Fresh or chilled boneless beef, except processed 15,685 19.5. . . . . . . . . . 7113.19.10 Rope, curb, etc. continuous lengths, of . . . .
precious metal 9,380 11.6. . . . . . . . . . . . . . . . . . . . . . . . . . . . . . . . . . 1701.11.02 Sugar used in production of polyhydric alcohols 8,857 11.0. . . . . . . . . . . 0302.69.40 Fish, nesi, excl. fillets, livers and roes, fresh 3,948 4.9. . . . . . . . . . . . . . 0807.10.20 Cantaloupes, fresh, entered between 9/16-7/31 1,917 2.4. . . . . . . . . . . 1703.10.50 Cane molasses 1,493 1.9. . . . . . . . . . . . . . . . . . . . . . . . . . . . . . . . . . . . . . . . 1701.11.01 Raw cane sugar, no flavoring/coloring, quota 1,131 1.4. . . . . . . . . . . . . .
Total 75,019 93.1. . . . . . . . . . . . . . . . . . . . . . . . . . . . . . . . . . . . . . . . .
Panama 0302.69.40 Fish, nesi, excl. fillets, livers and roes, fresh 10,085 28.7. . . . . . . . . . . . . . . . . 2402.20.80 Cigarettes containing tobacco, paper wrapped 4,733 13.5. . . . . . . . . . . . 0807.10.70 Melons, nesi, fresh 2,812 8.0. . . . . . . . . . . . . . . . . . . . . . . . . . . . . . . . . . . . 7113.19.50 Jewelry and jewelry parts of precious metal 2,274 6.5. . . . . . . . . . . . . . . 4823.60.00 Trays, dishes, plates, cups and the like of paper 1,729 4.9. . . . . . . . . . . 2008.99.13 Banana pulp, otherwise prepared or preserved 1,540 4.4. . . . . . . . . . . . 9603.10.60 Brooms, except whiskbrooms, of broom corn 1,262 3.6. . . . . . . . . . . . . . 2401.20.80 Tobacco, partly or wholly stemmed 1,117 3.2. . . . . . . . . . . . . . . . . . . . . . . 2924.29.39 Cyclic amides (including cyclic carbomates) 1,012 2.9. . . . . . . . . . . . . . 0807.10.30 Watermelons, fresh, if entered from 12/1 to 3/1 1,002 2.9. . . . . . . . . . . .
Total 27,566 78.4. . . . . . . . . . . . . . . . . . . . . . . . . . . . . . . . . . . . . . . . .
St. Kitts andNevis 8536.50.80 Electrical apparatus for switching or protecting . . . . . . . . .
circuits 9,464 55.0. . . . . . . . . . . . . . . . . . . . . . . . . . . . . . . . . . . . . . . . . 1701.11.01 Raw cane sugar, no flavoring/coloring, quota 1,524 8.9. . . . . . . . . . . . . . 8533.40.80 Variable resistors, incl. rheostats, potentiometers . . . .
nesi 1,017 5.9. . . . . . . . . . . . . . . . . . . . . . . . . . . . . . . . . . . . . . . . . . . . 8529.90.39 Parts for use with heading 8525 to 8528 nesi 982 5.7. . . . . . . . . . . . . 8503.00.85 Parts for use with heading 8501 or 8502 nesi 636 3.7. . . . . . . . . . . . . 8504.40.80 Electric transformers, static converters, inductors . . . .
nesi 512 3.0. . . . . . . . . . . . . . . . . . . . . . . . . . . . . . . . . . . . . . . . . . . .
Total 14,135 82.1. . . . . . . . . . . . . . . . . . . . . . . . . . . . . . . . . . . . . . . . .
St. Lucia 8525.10.20 Transmission apparatus for television 1,815 29.9. . . . . . . . . . . . . . . . . . . . . . 8533.21.00 Electrical fixed resistors 1,452 23.9. . . . . . . . . . . . . . . . . . . . . . . . . . . . . . . . 8532.29.00 Fixed electrical capacitors, nesi 966 15.9. . . . . . . . . . . . . . . . . . . . . . . . . . 8533.40.80 Variable resistors, incl. rheostats, potentiometers nesi 597 9.8. . . . . . 3926.90.95 Articles of plastics of heading 3901, 3904, nesi 328 5.4. . . . . . . . . . . . 6307.90.40 Cords and tassels made up of textile materials 304 5.0. . . . . . . . . . . .
Total 5,462 89.9. . . . . . . . . . . . . . . . . . . . . . . . . . . . . . . . . . . . . . . . . St. VincentandGrenadines 7113.19.50 Jewelry and jewelry parts of precious metal 1,230 94.7. . . . . . . . . . . . . . .
Total 1,230 94.7. . . . . . . . . . . . . . . . . . . . . . . . . . . . . . . . . . . . . . . . .
See footnotes at end of table.

25
Table 2-11—ContinuedLeading U.S. imports for consumption entering under CBERA provisions, by sources, 1994
Percent of1994 total 1994CBERA CBERA
Source HTS No. Description imports imports
(1,000 dollars)
Trinidad andTobago 7213.31.30 Bars & rods, hot-rolled, of iron or n/alloy steel 56,032 39.2. . . . . . . . . . . . . . . . .
2905.11.20 Methanol (methyl alcohol) 54,617 38.2. . . . . . . . . . . . . . . . . . . . . . . . . . . . . . . 0302.69.40 Fish, nesi, excl. fillets, livers and roes, fresh 3,811 2.7. . . . . . . . . . . . . . 1701.11.01 Raw cane sugar, no flavoring/coloring, quota 2,994 2.1. . . . . . . . . . . . . . 7214.40.00 Bars and rods of iron or nonalloy steel 2,752 1.9. . . . . . . . . . . . . . . . . . . . 7213.39.00 Bars and rods, hot-rolled, of iron or nonalloy steel 2,703 1.9. . . . . . . . . .
Total 122,909 86.0. . . . . . . . . . . . . . . . . . . . . . . . . . . . . . . . . . . . . . . . . 1 Indicated articles are subject to the CBERA 20-percent duty reduction.
Note.—Because of rounding figures may not add to the totals shown.
Source: Compiled from official statistics of the U.S. Department of Commerce. Commodities sorted by imports forconsumption, customs value in 1994.

26

27
CHAPTER 3Impact Of CBERA on the
United States in 1994
This chapter presents estimates of the welfareeffects of CBERA on the U.S. economy in 1994. Thechapter discusses the analytical approach used tomeasure quantitatively the impact of CBERA on U.S.consumers, the U.S. Treasury, and on U.S. industrieswhose goods compete with CBERA imports, anddescribes the U.S. imports that benefited exclusivelyfrom CBERA in 1994 and had the largest potentialimpact on competing U.S. industries.
Products That BenefitedExclusively From CBERA
in 1994U.S. imports of products benefiting exclusively
from CBERA are defined as those that enter undereither CBERA duty-free or CBERA reduced-dutyprovisions that are not eligible to enter free of dutyunder MFN rates or other provisions such as GSP.Consistent with this definition, GSP-eligible itemsimported from CBERA countries that entered underCBERA provisions are considered to benefitexclusively from CBERA only if they originated in acountry that is not currently a designated GSPbeneficiary or if imports of the item from a certaincountry exceeded GSP competitive-need limits.1
1 In 1994, Nicaragua was the only CBERA countrythat was not a designated GSP-beneficiary country.
A beneficiary developing country loses GSP benefitsfor an eligible product when U.S. imports of the productexceed either a specific annually adjusted value or 50percent of the value of total U.S. imports of the productin the preceding calendar year—the so-called“competitive-need” limits. Sec. 504(c)(1) of the Trade Actof 1974, as amended.
CBERA has no competitive-need limits. Thus, eligibleproducts that are excluded from duty-free entry underGSP because their competitive-need limits have beenexceeded can still receive duty-free entry under CBERA.
Since the inception of the CBERA program, U.S.imports that benefit exclusively from CBERA haveaccounted for a relatively small portion of total U.S.imports from CBERA countries, but this portion rosesubstantially in recent years before decreasing in1994.
The value of U.S. imports that benefitedexclusively from CBERA decreased by 7.2 percentfrom $1.0 billion in 1993 to $943 million in 1994(table 3-1). Such imports made up 8.4 percent of totalU.S. imports from CBERA countries in 1994, adecrease from 10.1 percent in 1993. Seven itemsexperienced large changes in exclusive CBERAduty-free imports from 1993 to 1994, accounting forabout $71 million of the $73 million net change. Theitem having the largest impact on the net change wasHarmonized Tariff Schedule of the United States(HTS) subheading 2918.90.30, aromatic drugs derivedfrom carboxylic acids, which experienced a decreaseof $129 million in CBERA duty-free imports. Thiswas largely due to an ongoing shift in production ofthese drugs from The Bahamas to Mexico. Largeincreases in imports benefiting exclusively fromCBERA occurred for leather footwear uppers (HTSsubheading 6406.10.65) from the DominicanRepublic, medical instruments (HTS subheading9018.90.80) from the Dominican Republic, and wirerod (HTS subheading 7213.31.30). Other largedecreases occurred for two tobacco subheadings (HTSsubheadings 2401.10.60 and 2401.20.80)2 and rawcane sugar used to produce polyhydric alcohols or forre-export (HTS subheading 1701.11.02) fromGuatemala and Nicaragua. Leading products thatwere identified in previous annual CBERA reports as
2 Imports of tobacco under HTS subheading2401.10.60 fell from the ninth leading item benefitingexclusively from CBERA in 1993 to the 22nd leadingitem in 1994. The value of exclusive CBERA importsunder this tobacco subheading fell from $25.9 million in1993 to $5.9 million in 1994.

28
Table 3-1 Customs value of products that benefited from CBERA duty elimination and reduced duties,1992-94
(Million dollars)
Item 1992 1993 1994
Total CBERA country imports:Value 9,426 10,094 11,200. . . . . . . . . . . . . . . . . . . . . . . . . . . . . . . . . . . . . . . . . . . . . . . . . . . . . . . . . Percent of total 100 100 100. . . . . . . . . . . . . . . . . . . . . . . . . . . . . . . . . . . . . . . . . . . . . . . . .
Items entered under CBERA:1Value 1,528 1,904 2,050. . . . . . . . . . . . . . . . . . . . . . . . . . . . . . . . . . . . . . . . . . . . . . . . . . . . . . . . . Percent of total 16.2 18.9 18.3. . . . . . . . . . . . . . . . . . . . . . . . . . . . . . . . . . . . . . . . . . . . . . . . .
Items benefiting exclusively from CBERA:2Value 671 1,016 943. . . . . . . . . . . . . . . . . . . . . . . . . . . . . . . . . . . . . . . . . . . . . . . . . . . . . . . . . Percent of total 7.1 10.1 8.4. . . . . . . . . . . . . . . . . . . . . . . . . . . . . . . . . . . . . . . . . . . . . . . . . 1 CBERA duty-free and reduced-duty imports excluding items that are MFN duty-free imports and ineligible items
misreported as entering under CBERA.2 CBERA duty-free and reduced-duty imports, excluding items that are MFN duty-free and eligible for GSP
duty-free treatment (except imports that exceeded GSP competitive-need limits and were eligible for duty-free entryunder CBERA). Includes items from Nicaragua that would ordinarily be eligible for GSP duty-free treatment becauseNicaragua does not qualify for GSP benefits.Source: Estimated by the staff of the U.S. International Trade Commission from official statistics of the U.S.Department of Commerce.
benefiting exclusively from CBERA between 1984and 1993 continued to rank among the leading U.S.imports in 1994. These are beef, pineapples, frozenconcentrated orange juice,3 tobacco leaf, and rum,which have consistently ranked among the leadingitems benefiting exclusively from CBERA since theinception of the program. Ethyl alcohol has rankedas one of the leading items benefiting exclusivelyfrom CBERA since 1985. Table 3-2 presents theleading 20 import items (ranked by c.i.f. value),4 on
3 The Commission received a submission from theTropicana Products subsidiary of Joseph E. Seagram &Sons, Inc. in response to its formal request for comments.In regard to orange juice, it states, in part, that “Tropicanafavors the CBERA, but Tropicana also believes that theCBERA would have a more beneficial impact if countriesthat benefit from U.S. tariff preferences reduced their owntrade barriers, which are very high by global andhemispheric standards.” Submission of Joseph E.Seagram & Sons, Inc., July 14, 1995, by NancyLevenson, Director of Federal Affairs for Seagram.
4 The analysis presented below uses U.S. marketexpenditure shares in computing estimated welfare andU.S. production displacement effects. Since U.S.expenditures on imports necessarily include freight andinsurance charges, and duties, when applicable, theanalysis uses c.i.f. values for CBERA duty-free items, andlanded, duty-paid values for non-CBERA imports andCBERA reduced-duty imports. (Technically, landed,duty-paid values are equal to c.i.f. values for itemsentering free of duty.) Import values reported in theremainder of this chapter are c.i.f. values unless otherwisespecified.
an 8-digit HTS subheading basis, that benefitedexclusively from CBERA in 1994.
Imports of five GSP-eligible products from TheBahamas, the Dominican Republic, and Guatemalawere included in the list of leadingCBERA-beneficiary products in table 3-2 becauseimports of the items from these countries exceededGSP competitive-need limits and could continue toenter free of duty only under CBERA. OneGSP-eligible item was included in the list of leadingCBERA-beneficiary products in table 3-2 on the basisof imports from Nicaragua, which is not a designatedGSP-beneficiary country. Imports from Nicaraguawere also included in two of the five GSP-eligibleitems mentioned above.5
5 The products in question were leather footwearuppers and medical instruments from the DominicanRepublic, aromatic drugs from The Bahamas, raw canesugar from Guatemala and Nicaragua, cigars from theDominican Republic and Nicaragua, and rope, curb, etc.,of precious metal from Nicaragua. Raw cane sugarimports entered under HTS subheading 1701.11.02 fromGuatemala and Nicaragua may not have benefitedexclusively from CBERA duty-free entry because, underthe U.S. sugar re-export program, importers may claim aduty drawback upon re-export of the sugar after it hasbeen refined or after it has been included in asugar-containing product that is exported. An unknownportion entered under HTS subheading 1701.11.02 mayhave been re-exported. Therefore, the value for this itemin table 3-2 probably overstates the amount that benefitedexclusively from CBERA.

29
Table 3-2Value of leading imports that benefited exclusively from CBERA duty provisions in 1994
(1,000 dollars)
HTS Customs C.i.f.subheading Description value value
6406.10.651 Footwear uppers, other than formed, of leather 205,959 210,219. . . . . . . . . . . . . . . . . . . . 0202.30.60 Frozen boneless beef, except processed 101,758 107,714. . . . . . . . . . . . . . . . . . . . . . . . . 9018.90.801 Medical and surgical instruments and appliances 70,433 71,140. . . . . . . . . . . . . . . . . . 0201.30.60 Fresh or chilled boneless beef, except processed 62,837 66,928. . . . . . . . . . . . . . . . . . 7213.31.30 Bars & rods, hot-rolled < 14mm in diameter, not tempered,
not treated and not partly manufactured 56,032 60,910. . . . . . . . . . . . . . . . . . . . . . . . 2207.10.60 Undenatured ethyl alcohol for nonbeverage use 47,450 51,344. . . . . . . . . . . . . . . . . . . 0804.30.40 Pineapples, fresh or dried, not reduced in size, in crates 35,885 41,734. . . . . . . . . . . . 1701.11.022 Cane sugar used to produce polyhydric alcohols 32,845 36,331. . . . . . . . . . . . . . . . . . . 2402.10.803 Cigars, cheroots and cigarillos 34,647 35,273. . . . . . . . . . . . . . . . . . . . . . . . . . . . . . . . . . . 2918.90.304 Aromatic drugs derived from carboxylic acids 23,261 23,385. . . . . . . . . . . . . . . . . . . . . . 2009.11.00 Frozen concentrated orange juice 14,483 15,502. . . . . . . . . . . . . . . . . . . . . . . . . . . . . . . . 0710.80.97 Frozen vegetables (asparagus, broccoli, and other),
reduced in size 12,803 15,385. . . . . . . . . . . . . . . . . . . . . . . . . . . . . . . . . . . . . . . . . . . . . 8533.40.80 Electrical variable resistors 14,376 14,507. . . . . . . . . . . . . . . . . . . . . . . . . . . . . . . . . . . . . . 4202.12.805 Luggage with outer surface of textile material 12,639 13,351. . . . . . . . . . . . . . . . . . . . . . 2208.40.00 Rum and tafia 9,519 10,225. . . . . . . . . . . . . . . . . . . . . . . . . . . . . . . . . . . . . . . . . . . . . . . . . 2401.20.80 Tobacco, partly or wholly stemmed 9,653 9,971. . . . . . . . . . . . . . . . . . . . . . . . . . . . . . . 8533.31.00 Electrical wirewound variable resistors 9,375 9,640. . . . . . . . . . . . . . . . . . . . . . . . . . . 7113.19.106 Rope, curb; and similar articles of precious metal 9,380 9,398. . . . . . . . . . . . . . . . . . 0603.10.60 Roses, fresh cut 7,647 8,827. . . . . . . . . . . . . . . . . . . . . . . . . . . . . . . . . . . . . . . . . . . . . . . 6204.69.90 Women’s or girls’ trousers, overalls, and shorts 7,126 7,407. . . . . . . . . . . . . . . . . . . .
1 These HTS subheadings were items from the Dominican Republic that were not GSP eligible during 1994.2 This HTS subheading included imports from Guatemala and Nicaragua that were not GSP eligible during 1994.
Value for sugar may overstate actual sugar imports benefiting from CBERA duty provisions because of sugarre-exported under the U.S. sugar re-export program.
3 This HTS subheading was an item that included imports from the Dominican Republic and Nicaragua that werenot GSP eligible during 1994.
4 This HTS subheading was an item from the Bahamas that was not GSP eligible during 1994.5 Items subject to 20-percent duty reductions under the CBERA between 1992 and 1996.6 This HTS subheading was an item from Nicaragua that was not GSP eligible during 1994.
Source: Estimated by the staff of the U.S. International Trade Commission from official statistics of the U.S.Department of Commerce.
Since it was implemented in 1984, CBERA hashad a minimal economic effect on the overalleconomy of the United States. In each year from 1984through 1994, the value of CBERA duty-free U.S.imports has been around 0.03 percent or less of U.S.gross domestic product (GDP).6 As pointed out inchapter 2, the total value of U.S. imports fromCBERA countries remained small—amounting to 1.7percent of total U.S. imports in 1994.
Welfare Effects of CBERAon U.S. Industries and
Consumers in 1994
Analytical ApproachThe following discussion briefly describes the
approach that was used to analyze the welfare effects
6 See previous reports in this series.
of duty-free and reduced-duty status under CBERAin 1994 on U.S. consumers, the U.S. Treasury andon U.S. industries whose goods compete withCBERA imports. Specifically, a computable partialequilibrium model was used to estimate the welfareeffects and industry displacement effects of CBERAfor each commodity.7,8 A more detailed explanationof the approach can be found in appendix B.
7 For Commissioner Bragg’s views on economicmodelling, please see, The Economic Effects ofAntidumping and Countervailing Duty Orders andSuspension Agreements, (investigation No. 332-344),USITC publication 2900, p. xiii, June 1995.
8 Commissioner Newquist notes that in the context ofthis investigation, economic modelling provides only“estimates” regarding the impact of any event or series ofevents. In his view, economic models rely on themanipulation of a number of assumptions and variables,all of which differ according to the information soughtand the judgment and prejudices of the modeler. Thus,models measuring the impact of a single event can and doproduce widely divergent “results.”

30
The estimation of the welfare effects of CBERAduty reduction9 for 1994 is made using a standardeconomic methodology for measuring the welfareimpact of a change in the prices of one or moregoods. Without the duty reduction, full tariffs wouldhave been in place in 1994 for CBERA imports noteligible for other duty-reduction programs. SinceCBERA has been in effect, therefore, U.S. consumershave benefited from lower prices and higherconsumption; competing U.S. producers have hadlower sales; and tariff revenues to the U.S. Treasuryhave been lower.
In this report, the net welfare effect is measuredby adding two components: (1) the gain in consumersurplus and (2) the decrease in tariff revenues to theU.S. Treasury resulting from the CBERA dutyreduction.10
8—Continued
For purposes of this investigation, therefore,Commissioner Newquist considers economic modelling tobe but one of many tools available to the Commission toanalyze and assess the effects of the Caribbean BasinEconomic Recovery Act.
For further discussion of Commissioner Newquist’sviews on the limitations of economic modelling, see,Lamb Meat: Competitive Conditions Affecting the U.S.and Foreign Lamb Industries, (investigation No. 332-357),USITC publication 2915, p. 5-36, fn. 73, Aug. 1995; TheEconomic Effects of Antidumping and Countervailing DutyOrders and Suspension Agreements, (investigation No.332-344), USITC publication 2900, p. xi, (“Views ofCommissioner Don Newquist”), June 1995; see also,Potential Impact on the U.S. Economy and Industries ofthe GATT Uruguay Round Agreements, Volume I,(investigation No. 332-353), USITC publication 2790, p. I-7, fn. 17, June 1994; Potential Impact on the U.S.Economy and Selected Industries of the North AmericanFree-Trade Agreement, (investigation No. 332-337),USITC publication 2597, p. 1-6, fn. 9, Jan. 1993.
9 For simplicity of exposition, the remainingdiscussion focuses on the welfare effects of reduced dutiesunder CBERA. However, the same analysis applies toboth duty-free and reduced-duty treatment under CBERA.
10 Consumer surplus is a dollar measure of the totalnet gain to U.S. consumers from lower prices.Conceptually, it is defined as the “difference between thetotal value consumers receive from the consumption of aparticular good and the total amount they pay for thegood.”
Net welfare effects typically also include changes inproducer surplus. Because the model used in this analysisassumes that the supply of U.S. domestic production isperfectly elastic, that is, that the U.S. domestic price doesnot fall in response to CBERA, decreases in U.S.producer surplus are not captured in this analysis.However, it is expected that the effects of CBERA dutyreductions on most U.S. industries are small.
Two assumptions have been made that tend toproduce “upper bound” estimates of U.S. productionthat might be displaced. The first assumption is thatthe substitutability of competing U.S. and CBERAproducts is high. This is reflected in the high elasticityof substitution (that is, a substitution elasticity of 5)used in the analysis to estimate the potentialdisplacement effect. The second assumption is that thesupply prices of imports and U.S. production are notaffected by CBERA (that is, that supply is perfectlyelastic over the relevant range for CBERA imports,non-CBERA imports, and U.S. production). Theseassumptions ensure the identification of items thatcould be most affected by CBERA. In many cases thereported displacement effects may overstate the actualdisplacement that occurred because of lowsubstitutability between Caribbean products and U.S.products, or upward-sloping supply curves.
The analysis was conducted on the 20 leadingitems that benefited exclusively from CBERA shownin table 3-2.11 Estimates of welfare and U.S. potentialindustry displacement effects were made andindustries that experienced potential displacement ofover 5 percent of the value of U.S. production wereselected for further analysis.
Items AnalyzedThe effects of CBERA were calculated for the top
20 items that benefited exclusively from CBERA dutyelimination and reduced duties in 1994 (table 3-3).These items accounted for 82.5 percent of the totalcustoms value of imports that meet the exclusiveCBERA specification, as defined above. For anyparticular item, the size of the market share ofCBERA imports (value of imports benefitingexclusively from CBERA relative to apparentconsumption) is a major factor in determining theestimated impact on competing domestic producers.12
10—ContinuedProducer surplus is a dollar measure of the total net lossto competing U.S. producers from increased competitionwith imports. Conceptually, it is defined as the returns toentrepreneurs and owners of capital over and above whatthey would have earned in their next-best opportunities.See Walter Nicholson, Microeconomic Theory: BasicPrinciples and Extensions (New York: The Dryden Press,1989) for further discussion of consumer and producersurplus.
Also, the welfare effects do not include short-runadjustment costs to the economy from reallocatingresources between different industries.
11 USITC industry analysts provided estimates of U.S.production and exports for the 20 leading items thatbenefited exclusively from CBERA.
12 Other factors include the ad valorem equivalenttariff rate, the substitutability among beneficiary imports,

Table 3-3Leading imports that benefited exclusively from CBERA, apparent U.S. consumption, and market shares, by HTS items, 1994
CBERAbeneficiary U.S.
HTS imports apparent Marketsubheading Description (c.i.f value) consumption 1 share
1,000 dollars Percent6406.10.65 Footwear uppers, other than formed, of leather 210,219 1,592,219 13.20. . . . . . . . . . . . . . . . . . . . . . . . . . . . . . . . . . 0202.30.602 Frozen boneless beef, except processed 107,714 5,790,692 3.02. . . . . . . . . . . . . . . . . . . . . . . . . . . . . . . . . . . . . . . 9018.90.80 Medical and surgical instruments and appliances 71,140 4,404,976 1.61. . . . . . . . . . . . . . . . . . . . . . . . . . . . . . . . 0201.30.602 Fresh or chilled boneless beef, except processed 66,928 - -. . . . . . . . . . . . . . . . . . . . . . . . . . . . . . . . 7213.31.30 Bars & rods, hot-rolled, < 14 mm in diameter, not tempered, not
treated and not partly manufactured 60,910 1,580,562 3.85. . . . . . . . . . . . . . . . . . . . . . . . . . . . . . . . . . . . . . . . . . 2207.10.60 Undenatured ethyl alcohol for nonbeverage use 51,344 1,430,782 3.59. . . . . . . . . . . . . . . . . . . . . . . . . . . . . . . . . 0804.30.40 Pineapples, fresh or dried, not reduced in size, in crates 41,734 99,030 42.14. . . . . . . . . . . . . . . . . . . . . . . . . . 1701.11.02 Cane sugar used to produce polyhydric alcohols 36,331 3,497,315 1.04. . . . . . . . . . . . . . . . . . . . . . . . . . . . . . . . . 2402.10.80 Cigars, cheroots and cigarillos 35,273 82,091 42.97. . . . . . . . . . . . . . . . . . . . . . . . . . . . . . . . . . . . . . . . . . . . . . . . . 2918.90.303 Aromatic drugs derived from carboxylic acids 23,385 - -. . . . . . . . . . . . . . . . . . . . . . . . . . . . . . . . . . . . 2009.11.00 Frozen concentrated orange juice 15,502 2,479,299 0.63. . . . . . . . . . . . . . . . . . . . . . . . . . . . . . . . . . . . . . . . . . . . . 0710.80.97 Frozen vegetables (asparagus, broccoli, and other), reduced in size 15,385 639,189 2.41. . . . . . . . . . . . . . . . 8533.40.80 Electrical variable resistors 14,507 324,687 4.47. . . . . . . . . . . . . . . . . . . . . . . . . . . . . . . . . . . . . . . . . . . . . . . . . . . . 4202.12.80 Luggage with outer surface of textile material 13,351 341,385 44.60. . . . . . . . . . . . . . . . . . . . . . . . . . . . . . . . . . . . 2208.40.00 Rum and tafia 10,225 104,956 9.74. . . . . . . . . . . . . . . . . . . . . . . . . . . . . . . . . . . . . . . . . . . . . . . . . . . . . . . . . . . . . . . 2401.20.80 Tobacco, partly or wholly stemmed 9,971 1,797,251 0.55. . . . . . . . . . . . . . . . . . . . . . . . . . . . . . . . . . . . . . . . . . . . . 8533.31.00 Electrical wirewound variable resistors 9,640 24,154 39.91. . . . . . . . . . . . . . . . . . . . . . . . . . . . . . . . . . . . . . . . . 7113.19.10 Rope, curb; and similar articles of precious metal 9,398 520,581 1.81. . . . . . . . . . . . . . . . . . . . . . . . . . . . . . . . 0603.10.60 Roses, fresh cut 8,827 300,854 2.93. . . . . . . . . . . . . . . . . . . . . . . . . . . . . . . . . . . . . . . . . . . . . . . . . . . . . . . . . . . . . 6204.69.90 Women’s or girls’ trousers, overalls, and shorts 7,407 8,071,855 0.09. . . . . . . . . . . . . . . . . . . . . . . . . . . . . . . . . .
1 U.S. apparent consumption defined as U.S. production plus total imports (landed, duty-paid basis) minus exports.2 Apparent consumption for HTS subheadings 0201.30.60 and 0202.30.60 were aggregated into one category and reported under HTS subheading
0202.30.60.3 Value of U.S. domestic production not available.4 Market share based on landed, duty-paid value.
Source: Estimated by the staff of the U.S. International Trade Commission from official statistics of the U.S. Department of Commerce, U.S.Department ofAgriculture, and U.S. Department of the Treasury.

32
The value of these imports relative to U.S. apparentconsumption varied considerably in magnitude (table3-3). For instance, in 1994, the value of U.S.imports of women’s or girls’ trousers, overalls, andshorts benefiting exclusively from CBERA was lessthan 0.1 percent of the value of apparentconsumption. Conversely, the value of CBERAimports of higher priced cigars was approximately43 percent of the value of apparent consumption.
Welfare Effects and the Dis-placement of Domestic Output
This section presents dollar estimates of theeconomic effects of duty elimination and reducedduties for the leading 20 products that benefitedexclusively from CBERA in 1994. These effects aresummarized in table 3-4, which presents dollarestimates of the consumer surplus that was generated,the tariff revenue from CBERA imports that wasforegone, and the resulting net welfare effect. It alsopresents the value of U.S. domestic shipments, dollarestimates of U.S. shipments displaced by CBERAimports, and the ratio of shipments displaced todomestic shipments.13
The net welfare effects shown in table 3-4 wererelatively small in magnitude. Except for sugar, thegain in consumer surplus (column A) was greater thanthe corresponding decline in tariff revenue (column B)for all of the items analyzed.14 Ethyl alcohol was theitem with the largest net welfare gain resulting fromCBERA duty-free entry. Five other items with highnet welfare gains, in value terms, were frozenconcentrated orange juice, medical instruments,leather footwear uppers, frozen vegetables, andstemmed tobacco.
12—Continuednonbeneficiary imports, and domestic production, and theoverall demand elasticity for the product category.
13 See appendix B for a more complete discussion ofthe data used to estimate the effects shown in table 3-4.
14 Imports of sugar under HTS subheading 1701.11.02from Guatemala and Nicaragua are believed to bere-exported after being refined and/or included in otherproducts for export. These imports have no direct effecton U.S. consumers, and there is no revenue loss to theTreasury, given U.S. law on sugar imported for re-export.The U.S. refining industry benefits from these importsbecause it allows the use of excess refinery capacity, andU.S. consumers may benefit indirectly because of theadded efficiency in the refining industry. Sugar importedunder other provisions that is refined and re-exportedqualifies for duty drawbacks—i.e. most duties paid arerefunded.
The six products with the largest potentialdisplacement effects (column D), in value terms, wereethyl alcohol, medical instruments, leather footwearuppers, beef, frozen concentrated orange juice, andfrozen vegetables.15 In percentage terms, the largestpotential displacement of domestic shipmentsoccurred for higher priced cigars, variable resistors,and fresh pineapples. The three largest potentialdisplacement effects reported were just under 10percent, the remainder were under 4 percent, with halfof the total number being under 1 percent.
Estimates of net welfare and industrydisplacement effects were also made using anassumption of lower substitutability (that is, asubstitution elasticity of 2). The three industries withthe largest displacement of U.S. production were thesame as when higher substitutability was assumed(higher priced cigars, variable resistors, and freshpineapples), although the ordering of the three wasaltered. Displacement for these three industries waslower and estimated to be between 2 and 4 percent ofproduction in the respective industries.16
Further analysis of these three industries ispresented below.
Highlights of U.S.Industries Most LikelyAffected by CBERA
in 1994
Cigars, Cheroots, and CigarillosU.S. imports of cigars, cheroots, and cigarillos
with a unit value of $0.23 or more (HTS subheading2402.10.80) benefiting exclusively from CBERA in1994 increased in value by 29 percent over the 1993level to $35.3 million and by 17 percent in quantity to57.6 million cigars in 1994.17 Only those imports
15 Imports of aromatic drugs from The Bahamas werea leading item that benefited exclusively from CBERAduty-free entry in 1994 (table 3-2). However, because ofthe lack of data for competing U.S. domestic productionof this item, no net-welfare or displacement effects arereported in table 3-4.
16 Estimates of potential industry displacement usingthe assumption of lower substitutability producedestimated displacement percentages as follows: cigars,3.58 percent; pineapples, 2.95 percent; and resistors, 2.28percent.
17 Henceforth in the text, “cigars” will refer to cigars,cheroots, and cigarillos under HTS subheading 2402.10.80.

Table 3-4Estimated welfare and displacement effects on the U.S. of leading imports that benefited exclusively from CBERA, 1994
Welfare effects Displacement effects
Reduction indomestic
Gain in Loss in Net U.S. shipmentsconsumer tariff welfare domestic
HTS surplus revenue effect shipments Value Sharesubheading Description (A) (B) (A-B) (C) (D) (D/C)
1,000 dollars Percent6406.10.65 Footwear uppers, other than formed, of leather 6,981 6,431 550 1,213,234 17,115 1.41. . . . . . . . . . . . . 0202.30.601 Frozen boneless beef, except processed 3,170 3,028 142 4,298,900 10,702 0.25. . . . . . . . . . . . . . . . . . . 9018.90.80 Medical and surgical instruments and appliances 4,577 3,799 778 3,704,998 17,886 0.48. . . . . . . . . . . . 0201.30.601 Fresh or chilled boneless beef, except processed - - - - - -. . . . . . . . . . . 7213.31.30 Bars & rods, hot-rolled, < 14mm in diameter, no
tempered, not treated and not partly manufactured 994 954 40 1,259,436 3,433 0.27. . . . . . . . 2207.10.60 Undenatured ethyl alcohol for nonbeverage use 14,161 7,826 6,335 1,379,438 40,504 2.94. . . . . . . . . . . . . 0804.30.40 Pineapples, fresh or dried, not reduced in size, in crates 1,574 1,484 90 53,119 4,348 8.19. . . . . 1701.11.022 Cane sugar used to produce polyhydric alcohols - - - 3,374,979 - -. . . . . . . . . . . . 2402.10.80 Cigars, cheroots and cigarillos 1,550 1,448 102 25,465 2,519 9.89. . . . . . . . . . . . . . . . . . . . . . . . . . . . 2918.90.30 Aromatic drugs derived from carboxylic acids (3) (3) (3) (3) (3) (3). . . . . . . . . . . . . . 2009.11.00 Frozen concentrated orange juice 3,071 1,064 2,007 951,000 9,656 1.02. . . . . . . . . . . . . . . . . . . . . . . . . 0710.80.97 Frozen vegetables (asparagus, broccoli, and other),
reduced in size 1,628 1,154 474 481,500 7,625 1.58. . . . . . . . . . . . . . . . . . . . . . . . . . . . . . . . . . . . . . . 8533.40.80 Electrical variable resistors 747 649 98 128,300 1,321 1.03. . . . . . . . . . . . . . . . . . . . . . . . . . . . . . . 4202.12.80 Luggage with outer surface of textile material 181 175 6 160,000 402 0.25. . . . . . . . . . . . . . 2208.40.00 Rum and tafia 638 542 96 92,272 3,078 3.34. . . . . . . . . . . . . . . . . . . . . . . . . . . . . . . . . . . . . . . . . . 2401.20.80 Tobacco, partly or wholly stemmed 1,183 781 402 1,400,000 5,968 0.43. . . . . . . . . . . . . . . . . . . . . . . . 8533.31.00 Electrical wirewound variable resistors 508 461 47 6,174 581 9.42. . . . . . . . . . . . . . . . . . . . 7113.19.10 Rope, curb; and similar articles of precious metal 558 471 87 360,000 1,366 0.38. . . . . . . . . . . 0603.10.60 Roses, fresh cut 519 440 79 151,715 1,268 0.84. . . . . . . . . . . . . . . . . . . . . . . . . . . . . . . . . . . . . . . . 6204.69.90 Women’s or girls’ trousers, overalls, and shorts 200 186 14 4,936,258 574 0.01. . . . . . . . . . . . .
1 Analysis for HTS subheadings 0201.30.60 and 0202.30.60 is combined under HTS 0202.30.60.2 Most sugar imported under HTS subheading 1701.11.02 is believed to be re-exported either as refined sugar or in sugar-containing products, which
would qualify for a duty drawback under other HTS subheadings. Therefore, there is no effect on U.S. consumers and no loss of tariff revenues.3 Not available.
Source: Estimated by the staff of the U.S. International Trade Commission from official statistics of the U.S. Department of Commerce, U.S. Department ofAgriculture, and U.S. Department of the Treasury.

34
from the Dominican Republic and Nicaragua qualifyas benefiting exclusively from CBERA during1993-94.18 U.S. cigar imports from the DominicanRepublic represented nearly 58 percent of total cigarimports (quantity basis), and 64 percent and 62percent of cigar imports from CBERA countries in1993 and 1994, respectively.19 CBERA duty-freeimports represented over 98 percent of the totalvalue of U.S. cigar imports from the DominicanRepublic and Nicaragua in 1994.
U.S. imports of these cigars from the DominicanRepublic, and the CBERA countries generally, differmarkedly from those typically produced in the UnitedStates. The overwhelming majority of large cigarsmanufactured in the United States—including class Hcigars20—are made by machine. Class H cigarsmanufactured in the United States use short-fillertobacco, may include a manufactured binder and/orwrapper, and retail for between $0.35 and $0.85 each.Conversely, almost all of the cigars benefitingexclusively from CBERA are hand-made,premium-priced cigars, consist of all natural tobacco,and generally retail for between $1 to $20 each.21
U.S. imports of cigars benefiting exclusively fromCBERA are not directly competitive withdomestically produced cigars and are often, in fact,used to complement a distributor’s portfolio ofpopularly priced U.S. cigars. Therefore, the impact onthe U.S. industry is probably small.
18 The Dominican Republic did not have GSP benefitsin 1994 because U.S. imports under HTS subheading2402.10.80 from the Dominican Republic exceeded 50percent of the value of total U.S. imports of that productin the preceding year—the competitive need limit.Nicaragua is not currently a designated GSP beneficiarycountry.
19 Nicaraguan imports for these years representedmuch less than 1 percent of total imports under CBERA.
20 Class H cigars are defined for statistical purposesby the Bureau of Alcohol, Tobacco and Firearms as largecigars with a value of $235 or more per 1000 cigars. TheCigar Association of America, Inc. uses the aggregatetotal of imports in HTS 2402.10.30.90 and 2402.10.80.00to determine U.S. imports of class H cigars. Certainimports under 2402.10.30.90 may not be valued at $.23 orover, but because the importer plans to sell them as ClassH cigars, he will report them as such and pay the $30 per1,000 cigars Federal excise tax accordingly. Over 72percent of the 146 million cigars imported into the UnitedStates in 1994 were class H cigars.
21 Honduras is the only major CBERA-countryproducer that exports more popularly priced cigars, thoughthey are still hand-rolled.
Firms now producing cigars in the DominicanRepublic are of two main types. Some firms aresubsidiaries of U.S. firms that shifted their premiumcigar production to the Caribbean, prior to theenactment of CBERA, because of the low-cost laborin the region and GSP eligibility for most cigars.Other firms are descendants of Cuban firms that leftCuba after the U.S. market was closed to Cubancigars in 1962.
Electrical Wirewound VariableResistors for a Power-HandlingCapacity Not Exceeding 20Watts
U.S. imports of wirewound variable resistorsunder HTS subheading 8533.31.00 came primarilyfrom Barbados (54 percent by value), Mexico (27percent), and Japan (10 percent) in 1994. Costa Rica,which accounted for only 2 percent of the value ofthese U.S. imports, was the only CBERA countryother than Barbados that supplied such imports in1994. U.S. imports of these resistors are not eligiblefor GSP treatment. Ninety-seven percent of the valueof U.S. imports from CBERA countries under thissubheading entered free of duty under CBERA in1994.
U.S. imports of wirewound variable resistors fromBarbados are solely produced for export to the UnitedStates by a single manufacturer that employs about400 workers.22 This manufacturer is owned by a firmbased in the United Kingdom that also has operationsin the United States. Besides being eligible forCBERA benefits, Barbados has favorabletransportation links with the United States, attractivefree-trade-zone policies, and relatively low wage rates.
In 1994, the value of U.S. consumption ofelectrical wirewound variable resistors for apower-handling capacity not exceeding 20 watts wasabout $24 million. Consumption of these products, asof most other electronic components, increasedsignificantly in 1994, and was driven by a surge in theproduction of electronic systems, particularly thoseused in automobiles. In 1994, auto and truck sales inthe United States rose by 8.6 percent to 15.2 millionunits and, in general, the use of electronic devices inautomobiles rose.23
These imports are primarily mature products thatcompete with U.S. imports from Mexico rather than
22 U.S. industry representative, interview byCommission staff, May 1995.
23 Vanessa Craft, “Slowing Auto Sales Won’t BrakeElectronic Sales,” Electronic Business Buyer, Jan. 1995,pp. 15-16.

35
U.S. production. U.S. resistor production consistsprimarily of products whose designs andmanufacturing requirements change frequently.CBERA countries and other developing countrieslack the infrastructure needed for competitiveproduction of these types of resistors. Most notably,these countries lack skilled workforces, sophisticatedcommunications infrastructures, and proximity toclients and suppliers. Therefore, the estimated impactof U.S. imports from CBERA countries of resistorsunder HTS subheading 8533.31.00 on the U.S.industry is most likely small.
Fresh PineapplesU.S. imports of fresh pineapples in crates and
packages (HTS subheading 0804.30.40) from CBERAcountries increased by 4.6 percent in quantity whiledeclining 8.1 percent in value from 1993 to 1994.Total imports from CBERA countries rose from116,142 metric tons (mt) in 1993 to 121,528 mt in1994, valued at $48.0 million and $44.1 million,respectively. Imports of fresh pineapples thatbenefited exclusively from CBERA increased from$40.0 million in 1993 to $41.7 million in 1994.
The rise in the quantity of U.S. fresh pineappleimports reflects a gain in imports from Costa Rica andHonduras that offset the decline in shipments from theDominican Republic. Most of the fresh pineappleimports are grown on plantations operated by large,multinational corporations. These plantations wereestablished in locations that took advantage of theinfrastructure of the firms’ existing banana operationsand that approximated the soil and climate ofHawaiian production areas. In recent years, pineappleproduction in Costa Rica has expanded as more firmshave entered the business to meet growing U.S.consumption. Imports of fresh pineapples from theDominican Republic have declined in recent years asthe result of agronomic problems that limitedproduction suitable for export to the United States.Increased shipments from Honduras have helped tooffset much of this decline.
The overall increased import supply has led to adecline in unit values from $0.41 per kilogram in1993 to $0.36 per kilogram in 1994 for CBERAsuppliers. This lower unit value is reflected in the
decline of the value of total imports from CBERAcountries.
Hawaii is the main source of U.S. domesticproduction of fresh pineapples, although there isminor cultivation of this crop in Puerto Rico.According to industry sources, transportation costs forfresh pineapples from the Western United States to theEastern United States made Hawaiian pineapples moreexpensive in the eastern half of the country. As aresult, firms began to produce fresh pineapples inCBERA countries to serve eastern markets.Nonetheless, Hawaiian product is perceived to be ofhigher quality by some consumers, as evidenced bysales of Hawaiian fresh pineapples at premium pricesin eastern markets. In addition, there has been anincrease in supplies of “jet-fresh” pineapples fromHawaii, which are shipped by air instead of thetraditional ocean vessel/truck combination. On theother hand, there are very few CBERA-producedpineapples sold in western markets. Most of the directcompetition between imports of fresh pineapples anddomestically produced fresh pineapples occurs in theMidwest region of the country.
Overall, the CBERA countries’ import marketshare of all imports of fresh pineapples (includingfresh pineapples in bulk, HTS subheading 0804.30.20)increased from 93 percent in 1993 to 95 percent in1994. Fresh pineapple imports from CBERA countriessupplied about 48 percent (quantity basis) of U.S.domestic consumption in 1994, up from 46 percent in1993.24 U.S. domestic production of pineapples forthe fresh market declined by 4 percent fromapproximately 130,000 mt in 1993 to 125,000 mt in1994; however, higher U.S. producer prices offset thedecline in production to a large extent.25
Notwithstanding the large CBERA market share, theestimated impact of U.S. imports of fresh pineapplesfrom CBERA countries on the U.S. industry isprobably not large because of a relatively low degreeof substitutability between CBERA-country anddomestically produced fresh pineapple.
24 Compiled from official statistics of the U.S.Department of Commerce, the Hawaiian AgriculturalStatistics Service, and the Agricultural Marketing Serviceof the U.S. Department of Agriculture.
25 Compiled from official statistics of the HawaiianAgricultural Statistics Service and the AgriculturalMarketing Service of the U.S. Department of Agriculture.

36

37
CHAPTER 4Probable Future Effects of CBERA
The chapter describes the probable future effectsof CBERA on the U.S. economy, providing a surveyof overall investment activity and trends in theCBERA countries during 1994. Information wasobtained from various published sources and fieldinterviews conducted during March 1995; additionalinvestment data were obtained from U.S. embassies inseveral of the relevant countries. The chapter assessesthe effect CBERA-related investments1 may have onU.S. imports in the near term and discusses theinvestment climate in Trinidad and Tobago, includingits recent experience exporting to the United Statesunder CBERA.
Previous reports in this series found that most ofthe effects on the U.S. economy and consumers of theone-time elimination of import duties under CBERAoccurred within 2 years of the program’s inception in1984. Other effects were expected to occur over timeas a result of an increase in export-orientedinvestment in the region. Such an investment increasemay occur in response to diminution of tariffs forcertain CBERA products. Since CBERA-relatedinvestment expenditures are assumed to be abarometer for future trade flows under the program,increased investment in a certain CBERA sector couldlead to increased exports to the United States fromthat sector. Therefore, the report continues to monitorCBERA-related investment, assuming investmentexpenditures are a proxy for future trade effects on theUnited States.
Summary of InvestmentActivities and Trends
CBERA was designed to encourage an expansionin investment activity in nontraditional sectors. Asignificant amount of new, export-oriented investmentin CBERA countries is directed toward the productionof goods covered by U.S. trade provisions other than
1 The term is meant to refer to investmentexpenditures motivated by the preferences extended underCBERA.
CBERA. Many of these investment projects are infree-trade zones (FTZs),2 where U.S.-origincomponents are assembled for return to the UnitedStates under HTS heading 9802.00.80.3 Otherinvestment occurring in nonexport industries, such astourism, is still consistent with the CBERA goals.4
A number of trade-related and non-trade-relatedinvestment projects received section 936 financing.5
Despite noted progress by some CBERA countriesin attracting and expanding foreign direct investment(FDI), a few have experienced difficulty in achieving
2 Each country typically has its own rules governingmanufacturing or assembly activities in FTZs, also calledexport processing zones or industrial free zones. The FTZsare restricted-access areas for industrial, commercial andservice facilities that operate independent of commercialregulations otherwise applicable in the host country.In-bond operations in FTZs are allowed to importduty-free inputs used as components for furthertransformation or assembly within the zone. Duty-freeadmission is temporary, enabling inputs to be furtherprocessed and subsequently re-exported for final sale.Apparel and electronics assembly operations are theprincipal sectors involved in Caribbean FTZs.
3 See chapter 2 for a discussion on HTS heading9802.00.80.
4 Section 232 of the 1990 CBERA states that“appropriate agencies of the United States Governmentshould assign a high priority to projects that promote thetourism industry in the Caribbean Basin.”
5 As originally enacted, section 936 grants a tax creditequal to the Federal tax liability on certain income earnedin U.S. possessions. A 1986 modification enable 936funds to qualify as tax-exempt funds on deposit withPuerto Rican financial institutions available to financeprojects in CBERA countries. The 1986 amendmentprovided a major incentive for investing in the CaribbeanBasin because Puerto Rican financial institutions wereable to lend the tax-exempt section 936 funds atbelow-market interest rates. For more detail, see USITC,CBERA, Ninth Annual Report 1993, pp. 38-40. Previousreports also contain project types eligible for section 936financing. See USITC, CBERA, Seventh Annual Report1991, pp. 1-9 to 1-10.

38
their desired investment goals. Political instability,insufficient investment incentives, restrictions onforeign exchange and profit repatriation, inadequateinfrastructure, and lack of intellectual property rightsenforcement may all contribute to lower investmentlevels. The smaller Eastern Caribbean islands havebeen particularly slow to diversify their economies,mainly due to the lack of natural resources. Thesmaller countries are dependent on a limited varietyof exports, such as sugar and bananas, and areadversely affected when there is a fall in eitherdomestic production or world prices. Moreover,regional investment may suffer as potential investorsevaluate the implementation and effects of the NorthAmerican Free-Trade Agreement (NAFTA),discussed later in this chapter.
MethodologyA number of resources were used by the USITC
to research and gather information for this chapter.They included the U.S. Department of Statediplomatic posts, Embassies of CBERA countries inthe United States, and published sources.6 Fourpublic responses were received by the Commissionincluding comments from Joseph E. Seagrams andSons, Inc., the International Intellectual PropertyAlliance, Nintendo of America, Inc.,7 and theEmbassy of Jamaica.8 In addition, USITC stafftraveled to Trinidad and Tobago to investigate whatwas perceived to be the “high-growth” CBERA
6 Initial efforts began with meeting the Caribbean andCentral American regional desk officers of the Departmentof State in Washington, DC. At each discussion, assistanceand expertise were requested to develop a survey to sendto diplomatic posts. With the officers’ input, a formsurvey was sent to each post in conjunction with anofficial cable request, pursuing more consistent investmentinformation from each CBERA country.
7 In response to a Federal Register notice requestingpublic comments, the Commission received twosubmissions concerning intellectual property rights. TheInternational Intellectual Property Alliance (IIPA),representing more than 1,500 companies that produce anddistribute computers and computer software, motionpictures, television programs, home video cassetterecordings, textbooks, trade books, references, professionalpublications and journals, outlined what it has perceivedas blatant disregard for the protection of intellectualproperty rights (Letter to the Commission by MariaStrong, Associate General Counsel, IIPA, received July 14,1995). The IIPA pointed out that “like the GeneralizedSystem of Preference Program, under the CBI thePresident makes his determinations regarding countries’beneficiary status based on mandatory and discretionarycriteria. Importantly, intellectual property provisions are
beneficiary country in terms of new investment.Investment on the islands has increased dramaticallyover the past few years.
A survey form was sent to each U.S. diplomaticpost in CBERA countries. Nine out of the 24diplomatic posts responded to the USITC investmentsurvey, including those in 8 of the top 10 beneficiarycountries.9
7—Continuedincluded in both the mandatory and discretionary criteria.”IIPA believes that most of the countries in the CBERAregion have not met their IPR obligations. IIPA ispetitioning to have El Salvador and Nicaragua—the mostserious offenders in its opinion—removed from CBERAeligibility for program benefits.
Another set of comments was filed on behalf ofNintendo of America, Inc.; Reflection Technology Inc.;Acclaim Entertainment, Inc; Electronic Arts; Lucas ArtsEntertainment; Mirage Studios; and Viacom New Media.Comments were submitted by David I. Wilson andElizabeth R.P. Bowen, Arter & Hadden, on behalf of thelisted firms, July 14, 1995. All filers are U.S. publishersand developers who create, market, and sell video games.They address the negative impact of granting CBERAbenefits to Panama on U.S. industries and customers as aresult of Panama’s failure to provide adequate andeffective protection and enforcement of U.S. intellectualproperty rights. The submission asserts that Panama’sfailure to curtail the transshipment of counterfeit goods tothe countries throughout Latin America and its failure toprovide adequate enforcement to deter the distribution andassembly of counterfeit goods within the FTZs, cause theU.S. Nintendo video game industry “irreparable harm inlost sales and market share in Panama and throughoutLatin America.” For that reason, filers believe that theU.S. Government should take action against Panama, andmake it ineligible for CBERA benefits.
8 Ambassador Richard L. Bernal, Ambassador ofJamaica, expressed enthusiastic support for the CBERAprogram in his comments, calling the program “anunqualified success” (Statement by Ambassador RichardL. Bernal from the Embassy of Jamaica, submitted byStephen Lamar, Director of Jefferson WatermanInternational, July 14, 1995). He extended support to theCaribbean Basin Trade Security Act (S. 529/H.R. 553). Inthe statement, the Ambassador outlined the benefits of theact, as well as many of the trade distortions that are beingfelt due to the imbalance between Mexico’s NAFTApreferences and the Caribbean’s CBERA Program.Ambassador Bernal emphasized the importance ofcontinuing the U.S./Caribbean partnership in trade.
9 Of the nine posts, seven reported specific investmentdata. Countries that responded to the Commission’srequest for 1994 CBERA-related investment data were:The Bahamas, Costa Rica, Honduras, Jamaica, Panama, ElSalvador and Belize. One post, Guatemala, reported thatthere was no CBERA-related investment. One post, theDominican Republic, reported that the survey was beyondtheir resources.

39
New CBERA-related Investmentin 1994
The information obtained from U.S. diplomaticposts in CBERA countries and published sourcesidentify 14 new investment projects in CBERA-related goods and 24 projects enlarging existingfacilities, for a total of 38 reported investments in1994. Table 4-1 identifies how many projects wereundertaken in each country by sector. The bulk ofinvestments in 1994 CBERA countries were in theagricultural sector, with 19 investments. Themanufacturing sector reported just over half of thatnumber of projects with 10 projects; fisheries had fiveprojects, most of which were in The Bahamas. The
magnitude of reported CBERA-related new andexpansionary investments in the six countries isshown in table 4-2. The largest concentration ofreported investment by value is in themanufacturing/electronics sector, with agriculturalproducts ranking second. Information from postreports indicates that the leading sector of investmentis apparel assembly.10
10 Although apparel assembly does not comply withour definition of CBERA-related investment, postsreported investment in seven new enterprises and eightexpansionary investments in Costa Rica, El Salvador andHonduras for a total of $43.2 million. The apparelassembly investment is greater than all the 1994 reportedCBERA-related investment, and is not included in table 4-2.
Table 4-1Reported investment projects in CBERA countries, 1994
Agricultural Manufacturing/ FisheryCountry products 1 Electronics 2 products 3 Other 4 Total
Costa Rica 1 7 1 9. . . . . . . . . . . . . . . . . . Jamaica 10 1 11. . . . . . . . . . . . . . . . . . . . . Panama 3 1 4. . . . . . . . . . . . . . . . . . . . . Bahamas 2 3 3 8. . . . . . . . . . . . . . . . . . . . Belize 1 1 2. . . . . . . . . . . . . . . . . . . . . . . El Salvador 2 2 4. . . . . . . . . . . . . . . . . .
Total 19 10 5 4 38. . . . . . . . . . . . . . . . . . . 1 Includes aloe vera products, fresh herbs, orchard crops, coffee, cut flowers, vegetables, melons, chocolate,
peanut butter, and luffa/vegetable bathing sponges.2 Includes jewelry, sensors, binders, packaging, filters, electric products, identification equipment, soldering
equipment, transformers, electronic capacitors, and cartons.3 Includes frozen shrimp, shrimp, tropical fish, crawfish, conch, sponges, and lobster tails.4 Includes suncare products and fragrances, specialty chemicals, cleaning detergents, and pharmaceuticals.
Source: Derived from information reported to the USITC by seven U.S. embassies in CBERA countries and inpublished sources indicated in footnotes throughout the chapter.
Table 4-2Reported investment activity in CBERA countries, 1994
(Millions of dollars)
Agricultural Manufacturing/ FisheryCountry products Electronics products Other Total
Costa Rica 7.10 10.90 - 3.50 21.50. . . . . . . . . . . . . . . . . . Jamaica 3.97 4.06 - - 8.03. . . . . . . . . . . . . . . . . . . . . Panama 1.50 - 0.50 - 2.00. . . . . . . . . . . . . . . . . . . . . Bahamas 0.85 - 3.06 1.84 5.75. . . . . . . . . . . . . . . . . . . . Belize 0.25 - 3.00 - 3.25. . . . . . . . . . . . . . . . . . . . . . . El Salvador 0.98 1.10 - - 2.08. . . . . . . . . . . . . . . . . .
Total 14.65 16.06 6.56 5.34 42.61. . . . . . . . . . . . . . . . . . . .
Source: Derived from information reported to the USITC by seven U.S. embassies in CBERA countries and inpublished sources indicated in footnotes throughout the chapter.

40
Costa RicaAccording to the Costa Rican Coalition of
Development Initiatives (CINDE),11 six newcompanies in Costa Rica are expected to beginexporting CBERA goods as a result of $3.9 million inCBERA-related investment in 1994. The six newfirms produce aloe vera goods, medical sensors forincubators, binders, filters, product identificationequipment and packaging.12 Another three firms thatproduce pharmaceuticals, soldering equipment, andtransformers, are expected to increase exports due toexpansionary investment of $17.6 million.13 Officialsof CINDE and the Government of Costa Rica believethat the CBERA program has been instrumental inattracting FDI to many sectors. However, a number ofeconomic factors also have decreased theattractiveness of Costa Rica as a locus of FDI. Forexample, the combination of rising labor and utilitycosts, proposed tax hikes, and high interest rates havehelped to keep the investment rate of growth at a lowsingle-digit level.
GuatemalaAccording to the Guatemalan-American Chamber
of Commerce, no CBERA-related investmentactivities occurred in Guatemala in 1994. Guatemalantrade officials maintain that the implementation ofNAFTA, and the advantages now available for foreigninvestors in Mexico, may have had little to do withthe lack of FDI in Guatemala.14 Rather, officials citegeneral political instability, a high crime rate, andpoor infrastructure as the chief reasons for lack ofinvestment last year.
HondurasThere were no reported investment expenditures
in CBERA-related sectors during 1994. Five firmsthat did report expansionary investment were in
11 CINDE stands for the “Coalicion Costarricense deIniciativas de Desarrollo.”
12 U.S. Department of State telegram, “USITC AnnualCaribbean Basin Investment Survey,” message referenceNo. 003047, prepared by U.S. Embassy, San Jose,May 11, 1995.
13 Ibid.14 U.S. Department of State telegram, “USITC Annual
Caribbean Basin Investment Survey,” message referenceNo. 004080, prepared by U.S. Embassy, Guatemala City,May 22, 1995.
apparel assembly, and qualify for HTS heading9802.00.80 of production sharing.15
In 1994, three-fourths of Honduras’ world exportswere in the nontraditional sectors of melon andshrimp. The increase in the value of shrimp exportedfrom Honduras may have been due to an increase inworld prices. The estimated supply of cultivatedHonduran shrimp, in tonnage, shows a significantreduction for 1994. Honduran farm shrimp decreased14.5 percent, from 11,700 metric tons on a heads-onbasis to an estimated 10,000 metric tons.16 Thereason for the decline is the shrimp plague known as“Toura Syndrome,” which attacks shrimp larva andresults in decreased production. The plague wasconfirmed in Honduras as of March of last year.17
U.S. technical assistance has been provided toHonduras to help combat the disease.
JamaicaJamaica is one of the leading CBERA country
exporters to the United States. Eleven new firms inJamaica are expected to begin exporting to the UnitedStates because of investments made in 1994,accounting for $8.03 million.18 The reported newfirms accounted for 71.6 percent of the reportedcapital investment expenditures in Jamaica.19 Of thenew CBERA-related firms, seven produce orchardcrops; the others produce cut flowers, vegetables,fresh herbs, and fiberglass tanks.
The USITC survey encouraged exporters toexpress their concerns with the CBERA program.Some Jamaican exporters stated that they face
15 Four export-oriented firms were established inHonduras in 1994, according to the Honduran Foundationfor Industrial Development and Export Promotion (FIDE).A fifth firm moved to Honduras from Haiti during theyear. Reported investment by these five firms, whichassemble apparel or produce thread and yarn, totalled$23.8 million in 1994. U.S. Department of State telegram,“USITC Annual Caribbean Basin Investment Survey,”message reference No. 003102, prepared by U.S.Embassy, Tegucigalpa, May 19, 1995.
16 Calculated from data obtained from the UnitedNations Food and Agricultural Organization.
17 Caribbean Update, Feb. 1995, p. 12.18 U.S. Department of State telegram, “USITC Annual
Caribbean Basin Investment,” message reference No.003107, prepared by U.S. Embassy, Kingston, May 11,1995.
19 Ibid. In addition, five investment projects in apparelassembly were reported, all of which qualify forproduction-sharing preferences. For more information, seethe USITC Production Sharing: U.S. Imports underHarmonized Tariff Schedule provisions 9802.00.60 and9802.00.80., USITC publication 2886, May 1995.

41
difficulties with regulatory constraints when enteringthe United States. According to the JamaicanGovernment Investment Promotion Agency(JAMPRO), “the main problems faced by the[CBERA] exporters are the non-tariff barriers onagriculture produce and processed food items.”20
JAMPRO also maintains that getting through theU.S. customs process is a difficult and expensiveproposition, especially for smaller exporters withoutexpertise.
The BahamasThree new firms were established as a result of
CBERA-related investment during 1994, and fiveprojects expanded through investments, totaling justover $5.75 million.21 Three newly established firmsproduce and process tropical fish, and should beginexporting to the United States. Five firms expandedtheir investment and should be increasing theirexports to the United States; two of which produceagricultural products; the remaining three firmsproduce suncare products, specialty chemicals, andcleaning detergents.
El SalvadorFour CBERA-related investment projects were
completed in 1994, totaling $2 million.22 Of the fourexpansionary investments, two firms produceagricultural products: honeydew melon and luffa, avegetable bath sponge; one produces electroniccapacitors and one cartons. Exports should increase tothe United States under these product lines.
PanamaFour new firms were established in Panama in
1994 for the purpose of exporting to the United Statesunder CBERA. Total 1994 investment in these firms
20 U.S. Department of State telegram, “USITC AnnualCaribbean Basin Investment,” message reference No. 003107, prepared by U.S. Embassy, Kingston, May 11, 1995.
21 U.S. Department of State telegram, “USITC AnnualCaribbean Basin Investment Survey,” message referenceNo. 001620, prepared by U.S. Embassy, Nassau, June 9,1995.
22 Sarah Bradley, Economic/Commercial Assistant,U.S. Embassy, San Salvador, letter to USITC staff, datedJune 29, 1995, “USITC Annual Caribbean BasinInvestment Survey.”
amounted to $2 million.23 Three firms will beginexporting melon and the other, frozen shrimp.
BelizeTwo CBERA-related investment projects in
shrimp and processed food were identified as havingover $3.25 million in new and expansionaryinvestment expenditures in Belize.24 The BelizeGovernment recently approved the implementation ofa value-added tax for those imports entered intoBelize for further processing. The tax replaces thecurrent 14 percent stamp duty levied on nearly allimported goods. The tax process is perceived to beeasier administratively than the stamp duty, possiblymaking the process run more smoothly.
To increase future investment, the Government ofBelize aims to liberalize its trade regime throughpolicy reforms, including the removal of quantitativerestrictions and the phasing out of import surcharges.In 1994, 27 FDI concessions were given, mostly inthe manufacturing sector. Examples of concessionsinclude the ability to bring in capital or machineryduty-free, repatriation of profits for foreigncorporations, and tax holidays, ranging from 3 to 15years.25
Effect of NAFTA on CBERACountry Trade and Investmentin 1994
Since NAFTA was implemented on January 1,1994, CBERA countries have expressed concernregarding the added competition from Mexico. Thissection addresses concerns exporters have expressedin response to the USITC investment survey sent toeach post in CBERA countries. Without some form ofNAFTA parity, some fear U.S. companies will shiftproduction to Mexico and exacerbate already highunemployment in the Caribbean.26 Tariff-free and
23 U.S. Department of State telegram, “USInternational Trade Commission Annual Caribbean BasinInvestment Survey: Panama,” message reference No.002629, prepared by U.S. Embassy, Panama City, May 12,1995.
24 Robert Merrigan, Economic and CommercialOfficer, U.S. Embassy, Belize City, letter to USITC staff,dated May 19, 1995.
25 Efrain Novello, Economic and Commercial Officer,U.S. Embassy, Belize City, telephone interview, July 6,1995.
26 Caribbean Update, Mar. 1995, p. 1.

42
liberal quota access under NAFTA and lower laborcosts due to the recent peso devaluation makeMexico an even more competitive base forexport-driven manufacturing.
The Caribbean Basin has already felt the impactof NAFTA in one of the most important sectors of thearea, apparel. There is some divergence regarding theextent of the NAFTA impact on Costa Rica.According to the Costa Rican Textile Chamber [ofCommerce], “while textile exports increased 33.6percent in 1992 and 10.6 percent in 1993, growth oftextile exports in 1994 was a scant 3.6 percent,” adramatic fall over the course of the last few years.27
U.S. Embassy officials note that there may be otherfactors for the slowdown in the Costa Ricaninvestment growth rate.28 Among those factors notedare rising labor and utility costs, the highest interestrates in Central America, and proposed tax hikes, allof which increase uncertainty for the investor.
Investors from Jamaica are also very interested inpassage of NAFTA parity legislation. “According toreports, the potential adverse impact of NAFTA ispresently identified only in the apparel sector.However, in order to reinforce the confidence offoreign aid and domestic investors in the economicfuture of the country, the Jamaican Government isactively involved in promoting the passage of theCaribbean Basin Trade Security Act.”29
In Guatemala, NAFTA is widely portrayed by thepress and other officials as having a strong negativeimpact on Guatemalan exports to the United States,especially in apparel. This concern was most apparentin the fall of 1994 when the government interim tradeprogram faltered and headlines predicted that theapparel assembly industry would pack up and head toMexico. The question arose again with the recentclosing of a large apparel assembly plant inGuatemala, where production was rumored to havebeen moved to Mexico.
An agriculture producer in Belize believes thatNAFTA does not directly affect the firm’s product,but that “the region may suffer economically as
27 U.S. Department of State telegram, “USITC AnnualCaribbean Basin Investment Survey,” message referenceNo. 003047, prepared by U.S. Embassy, San Jose, May 11, 1995.
28 Ibid.29 U.S. Department of State telegram, “USITC Annual
Caribbean Basin Investment,” message reference No.003107, prepared by U.S. Embassy, Kingston, May 11, 1995.
Mexico seeks to export ... [to] the United States,products which have been traditionally exported byCARICOM countries.”30
A large investor in Honduras expressed “aconcern with the possible impact of the FTA betweenCanada, U.S.A. and Mexico. ... [M]any companieswill study the possibility of shifting their operationsup north, especially to Mexico where [there] is plentyof labor at very competitive [prices] with [CBERA]countries.”31 The proximity of Mexico to the UnitedStates and the resulting decreases in transportationcosts was identified as a possible benefit to movingoperations to that country. On the other hand, someHonduran investors expressed optimism, emphasizingthat should NAFTA parity be enacted, it will benefittheir operations, enabling them to export many othergoods.32
The debate in Congress on NAFTA parity isbelieved to have affected investment. The uncertaintyassociated with the enactment of a parity bill mayhave delayed investment in CBERA countries.According to the U.S. Embassy’s economic officer inCosta Rica, “many investors appear reluctant to makesubstantial new investments in sectors benefiting fromCBERA trade preferences until the expected passageof a CBI-enhancement program granting NAFTA-liketreatment to textiles, apparel, etc.”33
Country Profile:Trinidad and Tobago
This section contains an analysis of the climate forTrinidad and Tobago’s CBERA exports, includingnew and expansionary investment. The selection ofTrinidad and Tobago results from staff conclusionsafter the December 1994 Miami conference on theCBERA program. There, the USITC staff learned thatTrinidad and Tobago was successful in attractingsignificant amounts of FDI. Unlike some otherCBERA beneficiaries, Trinidad and Tobago has
30 Robert Merrigan, Economic and CommercialOfficer, U.S. Embassy, Belize City, letter to USITC staff,dated May 19, 1995, p. 5.
31 U.S. Department of State telegram, “USITC AnnualCaribbean Basin Investment Survey,” message referenceNo. 003102, prepared by U.S. Embassy, Tegucigalpa,May 19, 1995.
32 Ibid.33 U.S. Department of State telegram, “USITC Annual
Caribbean Basin Investment Survey,” message referenceNo. 003047, prepared by U.S. Embassy, San Jose, May 11, 1995.

43
expressed a willingness to assume reciprocalobligations as part of future trade agreements.Trinidad and Tobago had not been visited byCommission staff since 1990. The purpose of thisyear’s investigative travel was to gather informationabout the extent to which the product of theseinvestments is likely to return to the United States inthe form of imports under CBERA. USITC stafftraveled to Trinidad and Tobago in March 1995 todiscuss CBERA-related issues with public- andprivate-sector officials.
Economic and TradePerformance
Trinidad and Tobago’s petroleum-based economyenjoys a relatively high per capita income by LatinAmerican standards,34 even though output and livingstandards are substantially below their 1973-82 boomperiod levels. After the Dominican Republic, Trinidadand Tobago is the second-largest economy in theCaribbean and is part of the Caribbean CommonMarket (CARICOM).35 Widespread unemployment,large foreign-debt payments, and low petroleum pricesare currently the islands’ most pressing difficulties.Inflation in Trinidad and Tobago hovered around 9percent in 1994, a two-percentage point improvementover inflation in 1993.36
Despite its economic difficulties, the country hasbeen relatively stable in the last 30 years, aftergaining independence in August 1962 from the UnitedKingdom. Trinidad and Tobago does not receive anyaid from the United States, a fact that is referred towith pride.37
Over the past few years, there has been aconscious effort by the Trinidad and TobagoGovernment to lay the groundwork for privatizationand export-led growth, in order to move from a
34 1994 GDP per capita is $3,650. Taken from data inU.S. Department of State, Country Reports on EconomicPolicy and Trade Practices, Feb. 1995, p. 419.
35 The Dominican Republic had a GDP of $9.17billion in 1994, compared to Trinidad and Tobago’s $4.75billion. (Source: Ibid, p. 360.) Members of CARICOMinclude: Antigua and Barbuda, Barbados, Belize,Dominica, Grenada, Guyana, Jamaica, Montserrat, St.Kitts and Nevis, St. Lucia, St. Vincent and Grenadines,and Trinidad and Tobago. Contrary to the name,CARICOM is a customs union and not a common market.
36 U.S. Department of State, Country Reports onEconomic Policy and Trade Practices, Feb. 1995, p. 420.
37 USITC staff interview with the U.S. Ambassadorand Deputy Chief of Mission, Embassy of the UnitedStates in Port-of-Spain, Trinidad, Mar. 23, 1995.
state-controlled to a market-oriented economy. Forexample, in 1992 the government undertook a largescale divestment program and has since divestedseveral previously state-owned companies. In 1994,BIWA, the national airline for Trinidad and Tobago,was privatized through a partial divestment of theGovernment of Trinidad and Tobago.38 The Fertrinammonia plant and the Trinidad and Tobago ureacompany were divested to a U.S. company, calledArcadia Partners, in March 1993. The $175 millionsale is the largest divestment in the Caribbean todate.39 The government also sold 55 percent of theTrinidad and Tobago methanol company to twoGerman firms, who have agreed to construct a newplant by 1996.40
From 1988 to 1991, the government negotiatedInternational Monetary Fund standby agreements,rescheduled Paris Club debt,41 and concluded anagreement for a World Bank structural-adjustmentloan. During 1992-94, Trinidad and Tobago’sdebt-service payments averaged about $600 millionper year, considered relatively high. The governmenthas successfully met debt payments through issuingbonds, increasing income from divestiture of state-runenterprises, thus offsetting the effects of substantialloans from the Inter-American Development Bank. In1995, debt-service payments are expected to decreaseby 25 percent.42
38 A group of investors purchased controlling interestof BIWA for $20 million and its 1500 employees are nowowner-partners. Upon completion of the 3-year divestitureprogram, the employees will own 24 percent of BIWA.
39 U.S. Department of Commerce, “Economic Trendsand Outlooks: Trinidad and Tobago,” Document 5155,Jan. 1995, p. 3.
40 Ibid. The two German firms, who have agreed toinvest $235 million in construction of a new methanolplant, are Ferrostaal AC and Helm AG.
41 Created in 1956, the Paris Club is a forum fornegotiations on countries’ debt to government creditors.The club has no set membership. Instead, participants inany Paris Club negotiations are the debtor government andits creditors, who traditionally meet under thechairmanship of a senior French Treasury official. Onedistinguishing principle of the Club is that in reschedulingnegotiations, systematic treatment of creditors is the rule.Typically, debtor countries approaching the Paris Club areusually required to conclude an agreement with the IMFproviding for a loan along with an IMF-approved programof economic-policy measures. For more information, see P.Krugman and M. Obstfeld, International Economics (NY,NY: Harper Collins Publishers, 1991).
42 U.S. Department of State, Country Reports onEconomic Policy and Trade Practices, Feb. 1995, p. 421.

44
Merchandise trade exports of Trinidad and Tobagoincreased by 18.4 percent from $1.62 billion in 1993to $1.93 billion in 1994. In contrast, merchandisetrade imports fell from $1.39 billion in 1993 to $997million in 1994, a fall of 28 percent. External publicdebt has steadily decreased from $2.095 billion to $2billion in 1994. Now, debt as a percentage of GDP is42 percent, down from 59 percent in 1988.43 In 1994,Trinidad and Tobago enjoyed a positive trade balanceof $512.6 million with the United States, largely fromoil and petroleum products and not CBERA-relatedgoods.
Investment ClimateThe Government of Trinidad and Tobago
aggressively courts foreign investors. Generally, thereare no actual or de facto restrictions on investment.FDI is screened by the government to assess whetherfirms are eligible for incentives and to determine theenvironmental impact of FDI projects. Foreigninvestors are eligible for concessions, such as taxholidays, and non-tax incentives, negotiated typicallyin the manufacturing, tourism, and energy sectors. Inaddition, there is repatriation of capital dividends,interest and other distributions, and investment gainsmay be freely transacted.
On September 26, 1994, the Government signed abilateral investment treaty with the United States thatprovides for repatriation of profits, repatriation ofcapital flows, national treatment/MFN, a disputesettlement mechanism, and GATT-consistent rules oforigin for U.S. investors. 44
Few Trinidadian resources are currently beingdevoted to intellectual property rights (IPR)protection, a situation that is expected to changeduring the 2-year phase-in period for theU.S.-Trinidad and Tobago IPR agreement also signedlast September. Copyright protection is governed bythe Copyright Act of 1985, in which a copyright isvalid for 50 years. Although it is still in effect, theCopyright Act reportedly is not currently enforced.45
Patents and trademarks are valid for 14 years. Patentscan be extended for a maximum of 7 years whiletrademarks are renewable indefinitely for 14-yearperiods.
43 Ibid.44 The bilateral investment treaty was sent to the U.S.
Senate for ratification in July 1995 and is awaiting Senateaction.
45 U.S. Department of State, Country Reports onEconomic Policy and Trade Practices, Feb. 1995, p. 424.
Investment ActivityTrinidad and Tobago reported a significant amount
of FDI in 1994, with preliminary estimates hoveringaround $1.2 billion. The tremendous increase from$800 million in 199346 represents a 50-percentincrease in investment inflows. New U.S. investmentin Trinidad and Tobago increased by over 40 percentfrom $428 million in 1993 to nearly $600 million in1994. Of that amount, only $4 million was confirmedto be CBERA-related.47 Most of the FDI for 1994was in the oil sector, the main income-generatingindustry in Trinidad and Tobago for several decades.However, petroleum products are not eligible forCBERA.
Trinidad and Tobago has been the focus of anumber of multinational corporations’ investmentinterest, since recently returning to the economicstability that was common during the oil boom yearsin the early 1970s. Over 90 percent of FDI is in theenergy sector. The dominant gas producer in Trinidadis Amoco, which in June 1994 discovered a new1-trillion-cubic-foot natural gas field off the island’ssoutheast coast. Enron is a major U.S. energy firmthat came to Trinidad in 1992 to develop natural gasfields belonging to the government’s Trintomar gasventure. In addition, British Gas and Texaco haveformed a joint venture to exploit gas reserves in thedolphin field off Trinidad’s north coast.48
All petroleum products are excluded fromduty-free treatment under the CBERA program.49
Although the economy primarily focuses on oilproduction and derivative industries, there are anumber of very small enterprises that take advantageof the CBERA and other trade preference programs.The areas identified as having the most CBERAopportunities for Trinidad and Tobago are exotictropical cut flowers, spices (such as local curries andpepper sauce), furniture, and goods made of nativefruits (ice creams, juices, and jams).50
One corporate example is the Sutton Farm, whichproduces and markets anthuriums, which are exotic
46 USITC staff interview with Frank Mouttet,President, and Carmena Baird, General Manager, of theTrinidad and Tobago Chamber of Industry and Commerce,Port-of-Spain, Trinidad, Mar. 23, 1995.
47 USITC staff interview with the First Secretary, U.S.Embassy, Port-of-Spain, Trinidad, Mar. 20, 1995.
48 Ibid.49 The average U.S. rate of duty for energy and
related products is just under 1 percent ad valorem.50 USITC staff interview with Wayne Yip Choy,
President, Anthony Guiseppi and Clive Teelucksingh,General Managers, Trinidad and Tobago ManufacturersAssociation, Port-of-Spain, Trinidad, Mar. 21, 1995.

45
tropical flowers in over 10 color combinations, forexport to the United States. In addition toproduction, Sutton Farms uses its marketing channelsto distribute exotic flowers for several other islandproducers. Although no new investments wereundertaken in 1994, Sutton Farm owners expect toexpand in 1995.51
A few products were cited as areas where theCBERA benefits will be exploited more in the future,by firms that are currently looking into the exportprocess. Those firms include Pete’s Air Conditioning,Casey Confectionery (candy), Solo (soft drinks) andCarib Distillery (beer).52
During staff field work, a frequently reiteratedconcern of Trinidadian exporters was the difficultyassociated with the customs process in Trinidad andTobago, especially in the apparel assembly sector.Some exporters claim that export goods are delayed incustoms for weeks, which makes meeting productiondeadlines extremely difficult.53
Although officially started in 1983, FTZs haveexperienced a particularly slow start on the islandsdue to insufficient funding.54 Light manufacturingand assembly are the primary beneficiaries, but thenumber of firms is small. The FTZ program usersprimarily target the domestic and CARICOM markets.Some of the largest users are Nestle CaribbeanInternational (distribution and international trade),Matuc International (distribution and internationaltrading), Nucor Iron Carbide (iron carbide), OceanHarvest Processing (fish and shrimp), and CaribbeanTire (tires).
One of the largest FTZs on the islands is PointLisas Industrial Port and Free Zone. The largest FTZtenant is Nucor Iron Carbide. Arcadia recentlypurchased an existing ammonia plant. Most of the
51 USITC staff interview with Pete Sutton, of SuttonFarms, Santa Cruz, and Trinidad, Mar. 21, 1995.
52 USITC staff interview with Frank Mouttet,President, and Carmena Baird, General Manager, of theTrinidad and Tobago Chamber of Industry and Commerce,Port-of-Spain, Trinidad, Mar. 23, 1995.
53 Often, assembly sharing deadlines are tight:turnaround is expected typically within 4 to 5 weeks ofthe time materials are shipped to the processors. USITCstaff interview with Michele E. Chan, Director ofManufacturing Contractors Export Services, Ltd., Europe,Trinidad, Mar. 22, 1995.
54 The FTZ program is an export program with theadded goal of increasing investment on the islands.USITC staff interviews with Michael Leschaloupe, CEOof the Trinidad and Tobago Free Zones Company Limited,Port-of-Spain, Trinidad, Mar. 21, 1995.
FTZ’s tenants are related to the oil sector, by eitherproduction or use of petroleum by-products. No PortLisas tenants are producing goods that are currentlyexported under the CBERA program, although FTZmarketing that increases CBERA and other programawareness has recently begun.55
Most foreign investors in Trinidad and Tobago donot appear to be interested in trade preferences thatare available to them; that is, investment decisionsseem to be independent of currently available tradepreferences.56
Another prevalent discussion topic during fieldinterviews was Trinidad and Tobago’s path towardacceding to the NAFTA. The Government of Trinidadand Tobago uses NAFTA as a rallying cry forliberalization. NAFTA is seen as a mark ofrecognition regarding sound fiscal management and aninvestment-friendly environment.57 The AmericanChamber of Commerce of Trinidad and Tobagoexplained that educating islanders regarding NAFTAissues is critical. There are significantmisunderstandings about what accession wouldrealistically include. Considerable debate exists onwhether acceding to NAFTA is preferable toNAFTA-parity for important sectors.
One contingent believes that NAFTA explicitlyspells out the rules for trading, thus making the tradeprocess more predictable, transparent and difficult tochange. Some firms on the islands believe thatNAFTA accession would be preferable because thereare no duties on value-added.58 Other firms are veryreluctant to support NAFTA accession, primarilybecause they do not want to lose one-waypreferences.59 Furthermore, NAFTA-parity may havethe flexibility to be easily withdrawn, so uncertaintyof the preferences’ time horizon can be important.60
55 USITC staff interview with Niel Rolingson, CEO,Point Lisas Industrial Port Development Corporation,Trinidad, Mar. 23, 1995.
56 USITC staff interview with Michael Leschaloupe,CEO of the Trinidad and Tobago Free Zones CompanyLimited, Port-of-Spain, Trinidad, Mar. 21, 1995.
57 USITC staff interview with the President and theExecutive Director of the American Chamber ofCommerce of Trinidad and Tobago, Port-of-Spain,Trinidad, Mar. 22, 1995.
58 USITC staff interview with Manager of CaribbeanSafety Products, LTD., Point Lisas Industrial Estate,Trinidad, Mar. 22, 1995.
59 USITC staff interview with the President of theSouth Trinidad Chamber of Industry and Commerce, SanFernando, Trinidad, Mar. 23, 1995.
60 USITC staff interview with Clyde Alleyne,President, American Chamber of Commerce of Trinidad,Port-of-Spain, Trinidad, Mar. 27, 1995.

46
Some government officials are concerned aboutNAFTA, primarily because they do not wantdumping from other countries.61 In general, theprivate sector agrees with the process ofliberalization, but not on whether NAFTA is thenecessary goal. They are concerned about allowingreciprocity without phase-in periods and withouttariffs and quotas. Observers maintain that mosttrade agreements have some degree of nonreciprocalconcessions for sensitive industries and thatsafeguards are integral in trade agreements.62
61 USITC staff interview with the Ambassador,Ministry of Trade and Industry, Port-of-Spain, Trinidad,Mar. 22, 1995.
62 USITC staff interview with the President andExecutive Director of the American Chamber ofCommerce of Trinidad and Tobago, Port-of-Spain,Trinidad, Mar. 22, 1995.

APPENDIX A
LIST OF SUBMISSIONSIN RESPONSE TO FEDERAL REGISTER
NOTICE

A-2
SUBMISSIONS FOR THE RECORDINVESTIGATION NO. 332-227
Nancy Levenson, Director of Federal Affairs, on behalf of Joseph E. Seagram & Sons, Inc.
Dr. Richard L. Bernal, Ambassador from Jamaica to the United States
David I. Wilson, on behalf of Nintendo of America, Inc.
Maria Strong, Associate General Counsel, on behalf of International Intellectual Property Alliance

APPENDIX B
TECHNICAL NOTES TO CHAPTER 3

B-2
The following discussion presents the methodologyfor estimating the welfare effects and the level ofdomestic output displaced by the duty-free andreduced-duty status granted to Caribbean importsunder CBERA. The effects of CBERA are measuredusing a comparative static analysis. Because theCBERA duty changes were already in place in 1994,this analysis compares current market conditions withan estimate of what market conditions might have beenhad full tariffs been in place for CBERA imports toobtain net welfare and domestic output effects.1
Welfare and domestic output changes due toduty-free and reduced-duty treatment under CBERAare analyzed using a computable partial equilibrium(CPE) model for each of the selected industries.Imports from CBERA beneficiary countries, importsfrom non-CBERA countries, and competing domesticoutput are assumed to be imperfect substitutes for eachother. Each of the three products is characterized by aseparate market where differing equilibrium prices canexist. The three markets are depicted in panels a, b,and c of figure B-1.
It is assumed that the CBERA import supply curveto the U.S. market, the non-CBERA import supplycurve, and the domestic industry supply curve arehorizontal. This is shown by the curves Sc, Sn, and Sd.The subscripts c, n, and d refer to CBERA imports,non-CBERA imports, and U.S. output, respectively.Because CBERA imports account for a very smallshare of total domestic consumption, this assumption ismade intentionally to obtain the maximumdisplacement effects to domestic production byCBERA imports. The CBERA and non-CBERAimport demand curves, Dc and Dn, and the demandcurve for domestic output, Dd, are all assumed to bedownward sloping.
The change from full tariffs to duty-free treatmentfor imports under CBERA causes the import supplycurve, Sc, in panel a to shift down to Sc� by the amount
1 The methodological presentation in the sectionentitled “Analytical Approach” in ch. 2 and thepresentation in this appendix discuss the net welfareeffects of the CBERA duty provisions in terms of a dutyreduction or elimination. This is because it is common todiscuss welfare and domestic output effects in terms ofthe results of a duty reduction, that is, to speak of thewelfare gain to consumers, the loss of tariff revenues tothe government, and the displacement of domesticproduction that result from a duty reduction. The actualanalysis is done in terms of a comparison of the statusquo with an estimate of what conditions might have beenwith MFN duty rates in place, the equivalent of analysisof an increase in duties. The welfare and domestic outputeffects are symmetrical in a comparative static analysis.For example, the gain to consumers from a duty reductionis the same as the loss to consumers from a duty increaseof the same amount. (This is technically true only ifincome effects are negligible. Given the small U.S.expenditures on goods from CBERA countries, incomeeffects are likely to be negligible for these products. SeeR. Willig, “Consumer’s Surplus without Apology,”American Economic Review, 66: 589-597.)
of the ad valorem tariff change, t. Therefore, theequilibrium price in the U.S. market for CBERAimports decreases from Pc to Pc� while the quantityimported increases from Qc to Qc�. The relationbetween the tariff-ridden and tariff-free price is Pc =Pc�(1 + t).
With a decrease in the price of CBERA imports,the demand curves for both non-CBERA imports anddomestic output, Dn and Dd, shift back to Dn� and Dd�,respectively. Since the supply curves in both of thesemarkets are assumed to be perfectly elastic, theequilibrium prices do not change. The equilibriumquantity supplied in each market decreases from Qnand Qd to Qn� and Qd�, respectively.
The decrease in the tariff for CBERA imports leadsto an increase in consumer surplus for these products.This is measured by the trapezoid PcabPc� in panel a.There is also an accompanying decrease in the tariffrevenue collected from CBERA imports. This ismeasured by the area of the rectangle PcacPc� in panela.
The net welfare effect of CBERA imports is theincrease in consumer surplus less the decrease in tariffrevenue—the trapezoid PcabPc� minus the rectanglePcacPc� in panel a. That is to say, triangle abc. Thedollar amount by which CBERA imports displace U.S.output is measured by the rectangle Qd�deQd in panelc.2
Given the above assumptions and the additionalassumption of constant elasticity demand curves, themarkets for all three goods are described by thefollowing three equations: (1) (Qc /Qc�) = (Pc /Pc�)εcc
(2) (Qn /Qn�) = (Pc /Pc�)εnc
(3) (Qd /Qd�) = (Pc /Pc�)εdc
Given Pc = Pc�(1+t), these can be restated as
(1�) (Qc /Qc�) = (1+t)εcc
(2�) (Qn /Qn�) = (1+t)εnc
(3�) (Qd /Qd�) = (1+t)εdc
2 Non-CBERA imports are also displaced by CBERAimports. The displacement value can be measured by thearea beneath the supply curve, Sn, and between quantitiesQn and Q�n in panel b. The impact of CBERA importson non-CBERA imports is not discussed in this report.

B-3
Figure B-1Partial equilibrium analysis of the effects of CBERA duty provisions on U.S. imports
P
Pc′
Pc
c b
a
Sc′
Sc
Dc
Qc′Qc Q
a. CBERA imports
b. non-CBERA imports
c. U.S. domestic output
DnDn′
SnPn
P
QnQn′ Q
P
Pd d e
QdQd′ Q
DdDd′
Sd
t

B-4
The εij is the uncompensated elasticity of demand forgood i with respect to price j. The values for the εcc,εnc, and εdc are derived from the following relations:
(4) εcc = Vcη - Vnσcn - Vdσcd
(5) εnc = Vc (σnc + η)
(6) εdc = Vc (σdc + η)
where the Vi’s are market shares for CBERA andnon-CBERA imports and domestic output, η is theaggregate demand elasticity, and the σij ’s are theelasticities of substitution between the ith and jthproducts.3 Estimates of the aggregate demandelasticities were taken from the literature.4 To obtainthe maximum displacement effects on domesticproduction, it is assumed that all of the elasticities ofsubstitution are identical and high, in this case, 5.5
3 Equations (4) - (6) are derived from P.R.G. Layardand A. A. Walters, Microeconomic Theory (New York:McGraw-Hill, 1978).
4 The aggregate elasticities were taken from sourcesreferenced in USITC, Potential Impact on the U.S.Economy and Selected Industries of the North AmericanFree-Trade Agreement, USITC pub. 2596, January 1993.
5 The elasticity of substitution (EOS) for ethyl alcoholwas set equal to 3 rather than to 5. Because of therelatively small market share for CBERA imports and thehigh tariff rate, an EOS of 3 or more implies that CBERAimports of ethyl alcohol fully displace domestic output ona dollar for dollar basis.
Given equations (1�) - (3�), we can derive thefollowing measurements for changes in consumersurplus, tariff revenue, and domestic output:6
Consumer surplus: (where k is a constant)
trapezoid PcabPc� = ∫Pc� kPc
εcc dPc
area of
Pc
= [1/(1+εcc)][(1+t)(1+εcc) - 1 ]Pc
�Qc� if εcc ≠ -1
= k ln(1+t) if εcc = -1
Tariff revenue from CBERA imports:
area ofrectangle PcacPc
� = tPc�Qc
= tP�Qc
� (1+t)εcc
Domestic output:
area ofrectangle Q�ddeQd = Pd(Qd - Qd
�)
= PdQd� [(1+t)εdc - 1]
6 A similar equation for the changes in non-CBERAimports can be derived; however, this effect is notdiscussed in this report.