u.s. history and modern world history courses for english...
TRANSCRIPT

U.S. History and Modern World History Courses for English
Speakers of Other Languages in Montgomery County
Public Schools
Office of Shared Accountability
February 2014
Huafang Zhao, Ph.D. & Julie Wade, M.S.

OFFICE OF SHARED ACCOUNTABILITY
Mr. Geoffrey T. Sanderson, Associate Superintendent
850 Hungerford Drive
Rockville, Maryland 20850
301-279-3553
Dr. Joshua P. Starr Dr. Kimberly A. Statham Superintendent of Schools Deputy Superintendent
of Teaching, Learning, and Programs
Montgomery County Public Schools Office of Shared Accountability
Program Evaluation Unit i ESOL Social Studies Practices and Outcomes
Table of Contents
Executive Summary .........................................................................................................................v
Background ..................................................................................................................................v
Major Findings .............................................................................................................................v
Recommendations ...................................................................................................................... vi
Background ......................................................................................................................................1
Course Sequence of ESOL Social Studies in Montgomery County Public Schools ...................1
ESOL Program in MCPS High Schools ......................................................................................1
Literature Review.............................................................................................................................4
Age Effect on Second Language Acquisition ..............................................................................4
Language Transfer .......................................................................................................................4
Academic English ........................................................................................................................5
Sheltered Instruction ....................................................................................................................6
Social Studies Instruction for ELL students ................................................................................6
Methodology ....................................................................................................................................7
Purpose of the Study ....................................................................................................................7
Study Design ................................................................................................................................7
Study Samples ..............................................................................................................................7
Measures and Data Sources .........................................................................................................8
Analytical Procedures ................................................................................................................10
Results ............................................................................................................................................12
Conclusion .....................................................................................................................................32
Limitations .................................................................................................................................33
Recommendations ......................................................................................................................34
Acknowledgements ........................................................................................................................34
References ......................................................................................................................................35
Appendix A ....................................................................................................................................38
Appendix B ....................................................................................................................................39
Appendix C ....................................................................................................................................40
Appendix D ....................................................................................................................................43
Appendix E ....................................................................................................................................47

Montgomery County Public Schools Office of Shared Accountability
Program Evaluation Unit ii ESOL Social Studies Practices and Outcomes

Montgomery County Public Schools Office of Shared Accountability
Program Evaluation Unit iii ESOL Social Studies Practices and Outcomes
List of Tables
Table 1 Characteristics of MCPS High School ESOL Students, 2012–2013 (N = 2,315) .............2
Table 2 Demographic Characteristics of Students Who Took ESOL U.S. History in
2012–2013 by Semester .....................................................................................................12
Table 3 Demographic Characteristics of Students Who Took ESOL Modern World in
2012–2013 by Semester .....................................................................................................14
Table 4 Test Specifications of ESOL Social Studies Final Exams in 2012–2013.......................15
Table 5 Students Who Passed ESOL U.S. History Final Exams in 2012–2013 ...........................17
Table 6 Students Who Passed ESOL U.S. History Semester Courses in 2012–2013 ..................18
Table 7 Students Who Passed ESOL Modern World History Final Exams in 2012–2013 ..........19
Table 8 Students Who Passed ESOL Modern World History Semester Courses in 2012–
2013....................................................................................................................................20
Table 9 Probability of Students Passing ESOL U.S History as Predicted by 2013
ACCESS Overall Scale Score and Having Taken ESOL Modern World History
Course Prior to 2012–2013 ................................................................................................21
Table 10 Probability of Students Passing ESOL Modern World History as Predicted by
2013 ACCESS Overall Scale Score and Having Taken ESOL U.S. History Course
Prior to 2012–2013 ............................................................................................................22
Table 11 Sequence of Social Studies Courses for ESOL Students in 20 MCPS High
Schools Completing School-Level ESOL Social Studies Questionnaire, Spring
2013....................................................................................................................................23
Table 12 Reasons Reported for Social Studies Course Sequence in 20 MCPS High
Schools Completing School-Level ESOL Social Studies Questionnaire, Spring
2013....................................................................................................................................23
Table 13 Ratings of Factors Considered in Deciding ESOL Students’ Social Studies
Course Sequence ................................................................................................................24
Table 14 Optimal Sequence of Social Studies Courses for Level 1 and 2 ESOL Students
Named by Respondents from 20 MCPS High Schools Completing School-Level
ESOL Social Studies Questionnaire, Spring 2013 (N = 20) .............................................25
Table 15 Optimal Sequence of Social Studies Courses for Level 3 ESOL Students
Named by Respondents from 20 MCPS High Schools Completing School-Level
ESOL Social Studies Questionnaire, Spring 2013 (N = 20) .............................................25
Table 16 Characteristics of 31 MCPS Teachers Completing ESOL Social Studies
Survey, Spring 2013 (N = 31) ...........................................................................................26
Table 17 Optimal Sequence of Social Studies Courses for Level 1 and 2 ESOL Students
Named by Teachers Completing ESOL Social Studies Survey, Spring 2013 (N =
31) ......................................................................................................................................27
Table 18 Optimal Sequence of Social Studies Courses for Level 3 ESOL Students
Named by Teachers Completing ESOL Social Studies Survey, Spring 2013 ...................27

Montgomery County Public Schools Office of Shared Accountability
Program Evaluation Unit iv ESOL Social Studies Practices and Outcomes
Table 19 Ratings of the Impact of Social Studies Course Sequence on ESOL Students’
Course Experience .............................................................................................................28
Table 20 Response to Survey Questions about ESOL U.S. History and ESOL Modern
World History Courses ......................................................................................................29
Table 21 Greatest Challenges in Social Studies Instruction for ESOL Students Named by
Teachers Completing ESOL Social Studies Survey, Spring 2013 (N = 28) .....................30
Table 22 Ways to Optimize ESOL Students’ Social Studies Learning Named by
Teachers Completing ESOL Social Studies Survey, Spring 2013 ....................................31
Table A1 Guidelines for the High School ESOL Instructional Pathways–Operational
Version ...............................................................................................................................38
Table C1 2013 ACCESS Overall English Proficiency Level for Students Who Took
ESOL U.S. History Semester 1 Course in 2012–2013 by Their MCPS ESOL
Levels .................................................................................................................................40
Table C2 2013 ACCESS Overall English Proficiency Level for Students Who Took
ESOL U.S. History Semester 2 Course in 2012–2013 by Their MCPS ESOL
Levels .................................................................................................................................40
Table C3 2013 ACCESS Overall English Proficiency Level for Students Who Took
ESOL Modern World History Semester 1 Course in 2012–2013 by Their MCPS
ESOL Levels ......................................................................................................................41
Table C4 2013 ACCESS Overall English Proficiency Level for Students Who Took
ESOL Modern World History Semester 2 Course in 2012–2013 by Their MCPS
ESOL Levels ......................................................................................................................41
Table C5 2013 ACCESS Scale Scores for Students Taking ESOL U.S. History and
Modern World History by Semester ..................................................................................42
Table D1 Test Reliability of ESOL Social Studies Final Exams Based on Multiple
Choice Questions ...............................................................................................................43
Table D2 Item Difficulties and Discrimination for ESOL U.S. History Final Exams .................44
Table D4 Scoring Guidelines for Written Responses on ESOL Social Studies Final
Exams .................................................................................................................................46
Table E1 Probability of Obtaining a Course Grade of C or higher in ESOL U.S. History
with 2013 ACCESS Overall Scale Score and ESOL Modern World History
Experience Prior to 2012–2013 .........................................................................................47
Table E2 Probability of Obtaining a Course Grade of C or Higher in ESOL Modern
World History with 2013 ACCESS Overall Scale Score and ESOL U.S. History
Experience Prior to 2012–2013 .........................................................................................47

Montgomery County Public Schools Office of Shared Accountability
Program Evaluation Unit v ESOL Social Studies Practices and Outcomes
Executive Summary
Background
The Office of Shared Accountability (OSA) in Montgomery County Public Schools (MCPS)
examined academic performance of English for Speakers of Other Languages (ESOL) students
in U.S. History and Modern World History courses, as well as the course sequence in ESOL
U.S. History and Modern World History. In MCPS, students who are not ESOL take U.S.
History in Grade 9 and Modern World History in Grade 11. The ESOL social studies course
sequence may be different. Since ESOL students come from different parts of the world, it is
assumed that they are more familiar with world history than with history of the United States
(U.S.). For this reason, the Division of ESOL/Bilingual Programs recommends that lower-level
ESOL students take ESOL Modern World History first in their sequence of social studies
courses, and higher-level ESOL students take ESOL U.S. History first (Appendix A).
In MCPS, three social studies courses are required for graduation and must be taken by ESOL
and non-ESOL students: U.S. History; Modern World History; and National, State, and Local
(NSL) Government. This study investigated how the course sequence impacted academic
performance in the ESOL U.S. History and ESOL Modern World History courses so the optimal
course sequence could be suggested. The focus of this study is the ESOL U.S. History and ESOL
Modern World History courses because there is currently no NSL Government course designed
for ESOL students in MCPS.
Major Findings
The major findings for the study are described below.
1. In the 2012–2013 school year, 508 students took ESOL U.S. History in Semester 1, while
512 students took the ESOL U.S. History in Semester 2. Across two semesters, the majority
of students who took ESOL U.S. History were in Grades 9 and 10. Most of these students
were at ESOL Levels 3 and 4. Almost half of them were Hispanic/Latino, and more than
60% of them received Free and Reduced-price Meals System (FARMS) services.
2. In the 2012–2013 school year, 231 students took ESOL Modern World History in
Semester 1, while 213 students took the course in Semester 2. In Semester 1, the majority of
students who took ESOL Modern World History were in Grades 9 and 10. Over half of them
were at ESOL Levels 2 and 3. Over 61% were Hispanic/Latino, and nearly 60% received
FARMS services. In Semester 2, the majority of students who took ESOL Modern World
History were also in Grades 9 and 10. Most of the students were at ESOL Levels 3 and 4,
about 61% were Hispanic/Latino, and 74% received FARMS services.
3. The test reliability of the final exams was reasonably high, ranging from .82 for ESOL
Modern World History A to .88 for ESOL U.S. History B. However, some test items had
questionable psychometric properties and may require further examination and revision.
Teachers recorded final exam scores of student written responses in an inconsistent manner,
so analysis of written responses across classes could not be conducted.
Montgomery County Public Schools Office of Shared Accountability
Program Evaluation Unit vi ESOL Social Studies Practices and Outcomes
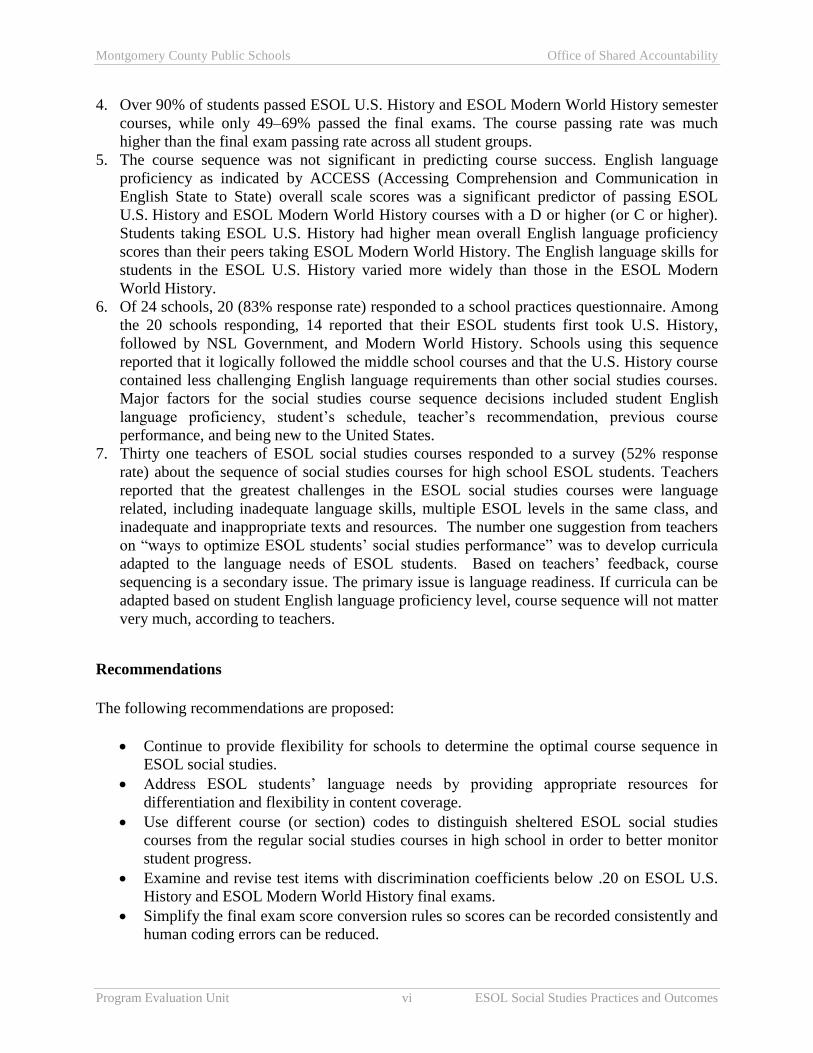
4. Over 90% of students passed ESOL U.S. History and ESOL Modern World History semester
courses, while only 49–69% passed the final exams. The course passing rate was much
higher than the final exam passing rate across all student groups.
5. The course sequence was not significant in predicting course success. English language
proficiency as indicated by ACCESS (Accessing Comprehension and Communication in
English State to State) overall scale scores was a significant predictor of passing ESOL
U.S. History and ESOL Modern World History courses with a D or higher (or C or higher).
Students taking ESOL U.S. History had higher mean overall English language proficiency
scores than their peers taking ESOL Modern World History. The English language skills for
students in the ESOL U.S. History varied more widely than those in the ESOL Modern
World History.
6. Of 24 schools, 20 (83% response rate) responded to a school practices questionnaire. Among
the 20 schools responding, 14 reported that their ESOL students first took U.S. History,
followed by NSL Government, and Modern World History. Schools using this sequence
reported that it logically followed the middle school courses and that the U.S. History course
contained less challenging English language requirements than other social studies courses.
Major factors for the social studies course sequence decisions included student English
language proficiency, student’s schedule, teacher’s recommendation, previous course
performance, and being new to the United States.
7. Thirty one teachers of ESOL social studies courses responded to a survey (52% response
rate) about the sequence of social studies courses for high school ESOL students. Teachers
reported that the greatest challenges in the ESOL social studies courses were language
related, including inadequate language skills, multiple ESOL levels in the same class, and
inadequate and inappropriate texts and resources. The number one suggestion from teachers
on “ways to optimize ESOL students’ social studies performance” was to develop curricula
adapted to the language needs of ESOL students. Based on teachers’ feedback, course
sequencing is a secondary issue. The primary issue is language readiness. If curricula can be
adapted based on student English language proficiency level, course sequence will not matter
very much, according to teachers.
Recommendations
The following recommendations are proposed:
Continue to provide flexibility for schools to determine the optimal course sequence in
ESOL social studies.
Address ESOL students’ language needs by providing appropriate resources for
differentiation and flexibility in content coverage.
Use different course (or section) codes to distinguish sheltered ESOL social studies
courses from the regular social studies courses in high school in order to better monitor
student progress.
Examine and revise test items with discrimination coefficients below .20 on ESOL U.S.
History and ESOL Modern World History final exams.
Simplify the final exam score conversion rules so scores can be recorded consistently and
human coding errors can be reduced.
Montgomery County Public Schools Office of Shared Accountability
Program Evaluation Unit 1 ESOL Social Studies Practices and Outcomes
U.S. History and Modern World History Courses for English Speakers of Other
Languages in Montgomery County Public Schools
Huafang Zhao, Ph.D. & Julie Wade, M.S.
Background
U.S. History; Modern World History; and National, State, and Local (NSL) Government are
required courses for high school graduation in Maryland. High school students usually take U.S.
History in Grade 9 and Modern World History in Grade 11. However, the course sequence may be
different for students of English for Speakers of Other Languages (ESOL). Since high school
ESOL students come from different parts of the world, it is assumed that they are more familiar
with world history than with U.S. history. For this reason, the Division of ESOL/Bilingual
Programs recommends that lower-level ESOL students take Modern World History first in their
sequence of social studies courses, and higher-level ESOL students take U.S. History first. The
guidelines for the high school ESOL instructional pathways are provided in Appendix A.
Course Sequence of ESOL Social Studies in Montgomery County Public Schools
Despite the recommended instructional pathways, Montgomery County Public Schools (MCPS)
high schools used different course sequences in 2012–2013. In some high schools, ESOL students
took U.S. History first, while in others ESOL students took Modern World History first regardless
of their English proficiency levels. According to the program staff, this might be due to the fact that
Modern World History has become more rigorous after its curriculum revision in 2008–2009.
Furthermore, students enrolled in 2012–2013 U.S. History and Modern World History courses were
required to take countywide final exams, which accounted for 25% of their final course grade.
Some ESOL and social studies teachers believed that the curriculum revision of the Modern World
History course actually makes it inappropriate for lower-level ESOL students.
To address teachers’ concerns, the MCPS Office of Shared Accountability (OSA) was asked to
investigate how the course sequence impacted academic performance in the ESOL U.S. History and
ESOL Modern World History courses so the optimal course sequence could be suggested. This
study focused on ESOL U.S. History and ESOL Modern World History because there was no NSL
Government course designed for ESOL students in MCPS in 2012–2013.
ESOL Program in MCPS High Schools
In this study, “ESOL students” refers to students receiving ESOL services in MCPS, and the term
“English Language Learner (ELL)” refers to students whose native language is not English, but
who are not necessarily receiving ESOL services due to various reasons including parent’s request.
The ESOL program in MCPS high schools “enrolls linguistically and culturally diverse secondary
students who require intensive English language instruction and orientation to a new cultural and
Montgomery County Public Schools Office of Shared Accountability
Program Evaluation Unit 2 ESOL Social Studies Practices and Outcomes
academic environment” (MCPS, 2012a). A description of high school ESOL courses is provided in
Appendix B.
The amount of daily ESOL instruction varies according to the level of English language proficiency
(MCPS, 2012a). Students at the lowest English proficiency level receive the most intervention.
Beginning students (ESOL Levels 1 and 2) receive two ESOL classes daily, while intermediate
(Levels 3 and 4) and Advanced (Level 5) students receive one ESOL class daily. The ESOL classes
provide structured instruction in the acquisition of the English language with specific emphasis on
the listening, speaking, reading, and writing skills that are prerequisite for success in a rigorous
academic environment. More detailed descriptions of high school ESOL courses may be found in
Appendix B. In addition to ESOL classes, students may be enrolled in sheltered content courses,
such as sheltered courses in math, science, or social studies, according to need. The ESOL U.S.
History and the ESOL Modern World History courses that are the focus of this study are sheltered
content courses where students are taught the content material of the regular unsheltered course but
with additional language support.
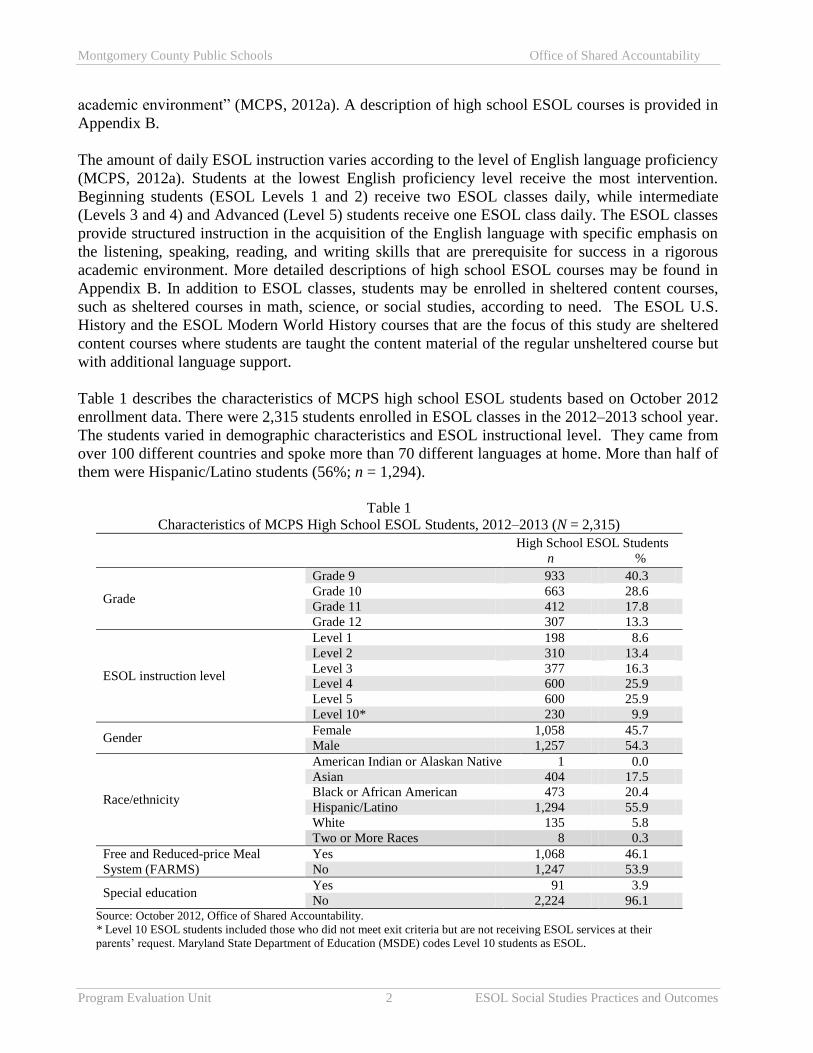
Table 1 describes the characteristics of MCPS high school ESOL students based on October 2012
enrollment data. There were 2,315 students enrolled in ESOL classes in the 2012–2013 school year.
The students varied in demographic characteristics and ESOL instructional level. They came from
over 100 different countries and spoke more than 70 different languages at home. More than half of
them were Hispanic/Latino students (56%; n = 1,294).
Table 1
Characteristics of MCPS High School ESOL Students, 2012–2013 (N = 2,315) High School ESOL Students
n %
Grade
Grade 9 933 40.3
Grade 10 663 28.6
Grade 11 412 17.8
Grade 12 307 13.3
ESOL instruction level
Level 1 198 8.6
Level 2 310 13.4
Level 3 377 16.3
Level 4 600 25.9
Level 5 600 25.9
Level 10* 230 9.9
Gender Female 1,058 45.7
Male 1,257 54.3
Race/ethnicity
American Indian or Alaskan Native 1 0.0
Asian 404 17.5
Black or African American 473 20.4
Hispanic/Latino 1,294 55.9
White 135 5.8
Two or More Races 8 0.3
Free and Reduced-price Meal
System (FARMS)
Yes 1,068 46.1
No 1,247 53.9
Special education Yes 91 3.9
No 2,224 96.1 Source: October 2012, Office of Shared Accountability.
* Level 10 ESOL students included those who did not meet exit criteria but are not receiving ESOL services at their
parents’ request. Maryland State Department of Education (MSDE) codes Level 10 students as ESOL.

Montgomery County Public Schools Office of Shared Accountability
Program Evaluation Unit 3 ESOL Social Studies Practices and Outcomes
ESOL U.S. History
In the ESOL U.S. History course, students study economic, political, social, and geographic
developments in American history from 1877 to the present. Topics include the effects of the
Industrial Revolution and immigration, the United States in world affairs through World War I,
major developments of the 1920s and 1930s, World War II and its impact on American society,
domestic policies during the period of 1945–1970, the impact of the cold war, and cultural change
in post-war America (MCPS, 2012b).
ESOL Modern World History
In this course, students examine past world history and draw connections to similar concepts
and forces at work today. Using historical thinking skills to access primary and secondary sources,
students build their understanding of key trends, patterns, and turning points of modern world
history. Key areas of investigation include global trade and interactions of the 17th and 18th
century, political revolutions, global effects of industrialization, imperialism and global
interactions, the World Wars, political and economic globalization, and the promise and challenge
of modern technology (MCPS, 2012b).
High School Assessment Requirements
All Maryland students who graduated in 2012 and beyond and who entered Grade 9 in fall 2005
and later must meet the High School Assessment (HSA) graduation requirements by passing all
three HSA tests (Algebra/Data Analysis, Biology, and English) with a combined score on the three
tests of 1208 or higher, or completing the required Bridge Plan projects (MCPS, 2012c). Due to a
state budget cut, the administration of the Government HSA was eliminated after 2011, and the
graduating class of 2011 was the last class that needed the Government HSA for graduation
(Maryland State Department of Education [MSDE], 2012). However, the Government HSA was
reinstated in 2012. With the reinstatement of the Government HSA, schools must also consider
what course sequence will best prepare students for success on this high stakes state assessment.
Montgomery County Public Schools Office of Shared Accountability
Program Evaluation Unit 4 ESOL Social Studies Practices and Outcomes
Literature Review
ELL students are a rapidly growing student population in American schools. More than 5 million
ELL students enrolled in the public schools by 2009, equivalent to 11% of the total Pre-K–12
school enrollment (National Clearinghouse for English Language Acquisition & Language
Instruction Educational Programs [NCELA], 2011). As the ELL population increases, the
achievement gap between ELL students and their English proficient peers has become a great
concern for educators. The gap begins early and persists through middle and high schools.
According to the nation’s report card, only 29% of Grade 8 ELLs performed at or above basic on
National Assessment of Educational Progress, compared to 77% of their non-ELL peers
(NCELA, 2011). This section of the report discusses literature related to English language
acquisition, academic English, sheltered instruction, and social studies instruction for ELLs.
Age Effect on Second Language Acquisition
Based on their review of the past literature, Nejadansari and Nasrollahzadeh (2011) summarized the
age effect on second language acquisition. First, there was a period up to a certain age during which
learners could achieve native-speaker-like competency in a second language (Patkowski, 1980).
Birdsong (1992, 2006) believed that the cut-off age to acquire the native-like competency was at
puberty or at 12 years old, while others postulated a younger age such as six years old (Long,
1990). Learners who were exposed to a second language early in life were more likely to attain a
native accent than older starters. Second, the critical period for grammar may be later than
pronunciation—at around the age of 15 (Bialystok & Hakuta, 1999). Older learners may perform
better in writing and reading (Cummins & Nakajima, 1987). Adult learners can reach grammatical
accuracy or full linguistic competency (Nejadasari & Nasrollahzadeh, 2011). Third, the rate for
learning a second language varies for students of different ages. According to Collier (1987), ELL
students who entered ESOL at ages 8–11 were the fastest achievers, requiring two to five years to
reach the 50th percentile on national norms in all the subject areas tested. The ELL students who
entered the program at ages 5–7 were one to three years behind the performance level of their ELL
peers who entered the program at ages 8–11, when both groups had the same length of residence.
Students who arrived at ages 12–15 experienced the greatest difficulty and required 6–8 years to
reach grade-level norms in academic achievement when schooled all in the second language.
Whereas some groups might reach proficiency in some subjects in as little as two years, it was
projected that at least four to eight years might be required for all ages of ELL students to reach
national grade-level norms of native speakers in all subject areas of language and academic
achievement (Collier & Thomas, 1997). As DeKeyser (2000) noted, “the decline of language
learning ability does not suddenly occur around puberty but seems to take place gradually from
ages 6 or 7 to 16 or 17 and beyond” (p. 500).
Language Transfer
ELL high school students can bring a variety of literacy skills with them based on their past
educational experience. For those who are literate in their first language, their skills in their native
language can be applied to the second language with appropriate instruction (Francis, Rivera,
Montgomery County Public Schools Office of Shared Accountability
Program Evaluation Unit 5 ESOL Social Studies Practices and Outcomes
Lesaux, Kieffer, & Rivera, 2006). Cummins and Nakajima (1987) examined English reading and
writing skills of 273 Japanese students in Grades 2–8. They found older students were more likely
to have strong reading skills and better writing skills. The explanation they offered was that the
older learners benefited from the prior academic experience in reading and writing in Japanese. The
‘interdependence principle’ formulated by Cummins (1981) suggested that cognitive academic
language proficiency is common across languages and can easily be transferred from the first
language to a second language by learners. In other words, ELL students with a solid background in
their first language can benefit from their prior education during their second language
development.
Some English learners have had quality schooling in their country so their content knowledge is at
grade level or above. For those students, transferring their educational knowledge may come easily
through a well-planned program of English development. For other students, whose schooling has
been sporadic and who have had little opportunity to develop academic skills in their home country,
English may require more intensive and targeted instruction (Dutro, Achieve, & Kinsella, 2008).
Academic English
Academic language is different from everyday conversation. It refers to language of text, academic
discussion, and formal writing. For ELL students, academic English proficiency is crucial to
academic success. Deficiency in academic English can prevent ELL students from learning grade-
level curriculum (Genesee, Lindholm-Leary, Saunders, & Christian, 2006). Academic English
includes, but is not limited to, vocabulary, ability to handle world complexity, and understanding
complex sentence structures and syntax of English language. Academic English is commonly used
in professional books and characterized by the specific linguistic features associated with academic
disciplines such as sciences, economics, and mathematics. It is also used in business and legal
settings (Scarcella, 2003).
Academic English entails multiple dimensions and fits into a theoretical model of academic literacy
proposed by Kern (2002). Based on Kern’s model, Scarcella (2003) suggested that academic
English has three different dimensions: linguistic, cognitive, and sociocultural/psychological. The
linguistic dimension consists of phonological, lexical, grammatical, sociolinguistic, and discourse
components. The cognitive dimension includes components of knowledge, higher order thinking,
cognitive, and metalinguistic strategies. The sociocultural dimension is made up of social and
cultural norms, values, beliefs, attitudes, motivations, interests, behaviors, practices, and habits.
According to Dutro, et al. (2008), sufficient background knowledge needs to be applied to words
differently across content areas in academic English. It takes four to seven years for most ELL
students to learn adequate academic English skills in order to handle grade-level content demands
(Cook, Linquanti, Chinen, & Jung, 2012; Hakuta, Butler, & Witt, 2000). However, high school
ELL students cannot afford to wait until they have mastered academic English before they access
grade-level curriculum.

Montgomery County Public Schools Office of Shared Accountability
Program Evaluation Unit 6 ESOL Social Studies Practices and Outcomes
Sheltered Instruction
Sheltered instruction is an approach to teaching that extends the time students have for receiving
English language support while learning content subjects. The Sheltered Instruction Observation
Protocol (SIOP) model was developed based on a seven-year research project by the Institute of
Education Sciences (Echevarria, Vogt, & Short, 2008). The SIOP model is a validated model of
sheltered instruction. Professional development in the SIOP model helps teachers plan and deliver
lessons that allow English learners to acquire academic knowledge as they develop English
language proficiency.
The SIOP model consists of eight interrelated components: lesson preparation, building
background, comprehensible input, strategies, interaction, practice/application, lesson delivery, and
review/assessment (Echevarria, et al., 2008). Using instructional strategies connected to each of
these components, teachers are able to design and deliver lessons that address the academic and
linguistic needs of English learners. The ultimate goal is accessibility for ELL students to grade-
level content standards and concepts while continuing to improve their English language
proficiency. The SIOP model is adopted in MCPS classrooms.
The ELL high school students face a double challenge of learning a new language while mastering
the same academic content as their English proficient peers. Their English language development
depends on literacy in their primary languages, previous and present experience in American
schools, and English language knowledge.
Social Studies Instruction for ELL Students
Learning social studies content presents a wide range of challenges for ELL students, particularly in
secondary school (Pahl, 2007). Many ELL students have not had prior exposure to a U.S.-based
social studies curriculum and lack an understanding of the cultural context in which the social
studies curriculum is presented. In addition, social studies lessons require literacy skills, including
reading, writing, speaking, listening, interpreting tables, charts, and maps, and synthesizing
information (Szpara & Ahmad, 2007).
Szpara and Ahmad (2007) proposed a multi-tiered approach to meeting the needs of ELL students
in the social studies classroom. They outlined best practices in three broad areas: 1) creating a
socially supportive classroom, 2) providing explicit instruction in academic strategies necessary for
successful comprehension of complex content, and 3) increasing the accessibility of complex
content knowledge by reducing cognitive load without reducing content.
As educators try to meet the challenges ELL students bring to the classroom and provide effective
instruction, it is important to remember the unique role that social studies lessons play in students’
education. In a study of high school social studies teachers, O’Brien (2011) concluded: “Of all the
secondary classrooms across the United States, social studies classes are the one place where ELLs
have the unique opportunity to learn important citizenship skills which can help them become
effective participants in a democratic society…. If [their educational needs] are not met, as a nation
Montgomery County Public Schools Office of Shared Accountability
Program Evaluation Unit 7 ESOL Social Studies Practices and Outcomes
we risk losing out on the future contributions of ELLs who are not educated as well as their
English-speaking counterparts” (p. 33).
Methodology
Purpose of the Study
This study addressed the following questions:
1. What were the characteristics of students who took ESOL U.S. History in 2012–2013?
2. What were the characteristics of students who took ESOL Modern World History in
2012–2013?
3. What were the psychometric characteristics of the final exams for the ESOL U.S. History
and ESOL Modern World History courses?
4. How did students perform in ESOL U.S. History in 2012–2013?
5. How did students perform in ESOL Modern World History in 2012–2013?
6. Did the course sequence contribute to student performance in ESOL U.S. History and ESOL
Modern World History?
7. What was the process and criteria for placing ESOL students in required social studies
courses in 2012–2013?
8. What were teachers’ views on the sequencing of the required social studies courses for
ESOL students, and factors that might affect ESOL student performance?
Study Design
A non-experimental design was employed, utilizing a variety of data collection methods. The data
collection methods included document review, the use of student performance on the final exam and on
the courses, as well as surveys. A survey of teachers who taught ESOL U.S. History and ESOL
Modern World History was administered in the spring of 2013. In addition, a brief school-level
questionnaire collected information about the process and criteria used for placement of ESOL
students in social studies courses. The teacher survey examined experiences and perspectives of
teachers who taught social studies to ESOL students and also investigated their views on the
sequencing of the two social studies courses for ESOL students as well as other factors that would
promote achievement of ESOL students in social studies.
Study Samples
Students
The student sample included MCPS students who enrolled in ESOL U.S. History or in ESOL
Modern World History in 2012–2013. Even though both were year-long courses, students who took
one semester course also were included. Since MCPS ESOL U.S. History and ESOL Modern
World History have the same course codes as the regular U.S. History and Modern World History,

Montgomery County Public Schools Office of Shared Accountability
Program Evaluation Unit 8 ESOL Social Studies Practices and Outcomes
and some ESOL students took regular history courses, the only way to accurately identify students
taking the two ESOL history courses was to use information collected on the final exams via a
specially designed Scantron sheet. Only students who took the ESOL U.S. and Modern World
History final exams were included in the analyses. Student ESOL level was based on January
enrollment for Semester 1 and June enrollment for Semester 2.
Teachers
Social studies teachers or ESOL teachers who taught ESOL U.S. History or ESOL Modern World
History from 2009 to 2012 were asked to complete a survey. These teachers were identified by
program staff in the Office of Curriculum and Instruction Programs (OCIP), the Division of
ESOL/Bilingual Programs, and MCPS databases. Sixty surveys were e-mailed to teachers who had
taught ESOL U.S. History, ESOL Modern World History, or both, during the last four years.
Thirty-one surveys were completed and returned, yielding a response rate of 52%.
School-Level Questionnaire Respondents
The school-level questionnaire was sent to a staff member at each high school who facilitated the
sequencing of social studies courses for ESOL students. The questionnaire of school practices was
sent to 24 of the 25 high schools; one principal had informed the OSA that their school had no
current or previous ESOL social studies courses, and the principal did not identify a contact person
for the study. Of the 24 surveys that were sent out, 20 were completed and returned, reflecting an
83% response rate. Staff members from 3 of the 24 schools indicated that there were no ESOL
social studies courses at their school; one school did not respond to the survey request and
reminder. Thus, responses to the survey of school practices were received from 20 schools,
representing all but one of the schools that have ESOL social studies courses.
Measures and Data Sources
The measures used included final exams and semester course grades, proficiency level on English
proficiency tests, and teacher survey responses.
Final ESOL U.S. History and ESOL Modern World History Exam Grades
Final exam grades were used as an outcome measure to report student performance on the final
exams. Final exam items were examined for psychometric characteristics. The percentage of
students passing the final exam (grade of D or higher) was used as an outcome measure and
reported for each exam.
Course Grade
Since the final exam only accounts for 25% of the course grade, the semester course grade was used
as another outcome measure. The percentage of students passing the courses (grade of D or higher)
was reported for each course.
Montgomery County Public Schools Office of Shared Accountability
Program Evaluation Unit 9 ESOL Social Studies Practices and Outcomes
English Language Proficiency: ACCESS for ELLs
In Maryland, ACCESS for ELLs is currently the standard assessment for language development of
ELL students. ACCESS for ELLs is a large-scale test measuring the English language development
standards developed by World-class Instructional Design and Assessment (WIDA), 2012. Maryland
has joined the WIDA Consortium and has adopted the WIDA English Language Development
Standards, which describe the expectations educators have for ELL students in five different
content areas: social and instructional language, English language arts, math, science, and social
studies. Maryland school systems use the WIDA standards as a basis for developing their own
curriculum for their ELL students.
On ACCESS, student English language development is characterized with six English language
proficiency levels in listening, speaking, reading, and writing, including Level 1 (Entering), Level 2
(Beginning), Level 3 (Developing), Level 4 (Expending), Level 5 (Bridging), Level 6 (Reaching).
The six levels describe the spectrum of a learner's progression from knowing little or no English to
acquiring the English skills necessary to be successful in an English-only mainstream classroom
without extra support (WIDA, 2012).
For this study, students’ ACCESS overall scale score, an indicator of English language proficiency,
was used as a control variable when studying course sequence impact.
Survey and Questionnaire
The experiences and perspectives of ESOL social studies teachers were obtained through a teacher
survey, and school-level information was collected with a questionnaire completed by school
personnel involved in placement of ESOL students in social studies courses.
1. The survey of social studies teachers aimed to elicit information on: 1) teachers’ views of
the impact of ESOL social studies course sequence on student success in the courses, and
2) other factors that contribute to or hinder ESOL students’ success in social studies courses.
2. The school-level questionnaire asked respondents to describe the criteria and process that
their schools use to place ESOL students in required social studies courses.
The survey and questionnaire were administered electronically in spring 2013. Follow-up reminders
were sent approximately two weeks later in an effort to increase the response rates.
Demographic Information
Student demographic information and ESOL level designation were obtained from the MCPS end-
of-year enrollment file and the ESOL file.

Montgomery County Public Schools Office of Shared Accountability
Program Evaluation Unit 10 ESOL Social Studies Practices and Outcomes
Analytical Procedures
The analytical procedures for the study included: 1) psychometric analyses for the final exams,
2) descriptive analyses of students and their performance by demographics and ESOL levels,
3) logistic regression for sequence impact, and 4) survey data analyses.
Psychometric Analyses for the Final Exams
Psychometric analyses were conducted for the final exams of the ESOL U.S. History and ESOL
Modern World History courses in 2012–2013. The analyses were intended to examine test
reliability, item difficulty, discrimination index, distractor, and written response analyses.
Reliability. Reliability refers to the consistency of a test (or measure). A test is considered
reliable if similar results can be obtained across test administrations. However, it is impossible to
calculate reliability exactly. Test-retest, inter-rater, parallel-form, and internal consistency reliability
are different ways to estimate reliability. In this study, final exam data for ESOL social studies were
available only for one form in one administration (with sufficient sample size), and one teacher
scored his/her own students. Therefore, it only is possible to estimate internal consistency which
judges the consistency across items on the same test. Cronbach’s alpha is often used to measure
internal consistency when a test includes both multiple choice and open-ended questions
(Cronbach, 1951).
The theoretical value of Cronbach’s alpha varies from zero to 1, including negative values,
although only positive values make sense (Ritter, 2010). Higher values of alpha are more desirable.
A common rule of thumb requires a reliability of 0.70 or higher when used with an instrument
(Kline,1999; Nunnally, 1978). Factors that contribute to higher reliability include less homogeneous
test takers, longer test, objectively scored items, and high quality of test items, so this rule of thumb
should be used with caution (Cortina, 1993).
Item Difficulty. For multiple choice items, item difficulty (also called p value) is measured
by the proportion of students who selected the correct response (p values range from zero to +1.0).
For example, an item with a p value of .95 is easy, because 95% of the examinees selected the
correct responses. Items either too easy or too difficult are unable to distinguish high performing
students from low performing ones. It is important to keep in mind that repeated administration of
the same test item will increase the p values and make items appear to be less difficult.
Discrimination Index (point-biserial). The discrimination index measures a test item’s
effectiveness at discriminating those who know the content from those who do not. Discrimination
index is based on point-biserial correlation between a correct response and overall points on a test.
The index ranges from -1.0 to 1.0. A positive correlation suggests that students who perform better
on the entire test have a higher probability of getting a test item right. The higher the discrimination
value, the better the test item.
A discrimination index of 0.2 or higher is regarded as acceptable because the test item is able to
differentiate between the low and high performing students (Ebel & Frisbie, 1991). A negative
value is questionable. When a discrimination index is negative, it suggests that overall the most

Montgomery County Public Schools Office of Shared Accountability
Program Evaluation Unit 11 ESOL Social Studies Practices and Outcomes
knowledgeable examinees are getting the item wrong and the least knowledgeable examinees are
getting the item right. A negative discrimination index may indicate that the item is measuring
something other than what the rest of the test is measuring. Items with negative indices should be
examined to determine whether the item was flawed or mis-keyed.
Distracter Analyses. Choices other than the correct answer are called distracters. If a test
item has four choices, students will have a 25% chance of guessing the correct response. With four
possible choices for an item, three distracters should attract some students in order to reduce
probability of guessing. The correct answer should attract more students than any distracters. If
correct answers attract fewer students than distractors, it may indicate potential issues such as
multiple correct answers or a wrong answer key.
Open-ended Items. For open-ended test items, mean scores can be used to judge item
difficulty. For example, an item with a mean of 3 out of 6 points is moderately difficult (3 out of
6 = 50%).
Descriptive Analyses of Students and Their Performance Data
Descriptive statistics were used to summarize information on the characteristics and performance
levels of MCPS high school ESOL students who took ESOL U.S. History and ESOL Modern
World History courses.
Logistic Regression for Sequence Impact
Logistic regression analyses were applied to examine whether the sequence of the courses was
related to successful completion of the courses with a grade of D or higher (or C or higher), after
controlling for student English language proficiency. Student English language proficiency, and
student previous course taking history (e.g., whether they took U.S. or Modern World History
courses before the 2012–2013 school year) were used as predictors, while passing the course was
the dependent variable.
Survey Data Analyses
Descriptive analyses of the responses to the teacher survey and school-level questionnaire were
conducted. Content analyses of responses from open-ended items were used to identify themes and
categories of common responses. Counts of responses within categories as well as examples of
representative comments were presented.

Montgomery County Public Schools Office of Shared Accountability
Program Evaluation Unit 12 ESOL Social Studies Practices and Outcomes
Results
Results are organized according to the evaluation questions. Student characteristics, item analyses
of final exams, and student performance in the courses are presented first, followed by the survey
findings. When a group has less than five students, the course performance for the group is not
reported.
1. What were the characteristics of students who took ESOL U.S. History in 2012–2013?
Table 2 displays the characteristics of students who took ESOL U.S. History in 2012–2013 by
semester. In Semester 1, 508 students took the ESOL U.S. History course, while 512 students took
the ESOL U.S. History in Semester 2. Demographic characteristics of the two groups were similar.
Table 2
Demographic Characteristics of Students Who Took ESOL U.S. History
in 2012–2013 by Semester
ESOL U.S.
History
Semester 1
N = 508
ESOL U.S.
History
Semester 2
N = 512
n % n % Grade Level
9 248 48.8 252 49.2
10 175 34.4 175 34.2
11 70 13.8 82 16.0
12 15 3.0 3 0.6
ESOL Level
No level defined 7 1.4 6 1.2
Level 1 17 3.3 19 3.7
Level 2 124 24.4 90 17.6
Level 3 161 31.7 145 28.3
Level 4 155 30.5 167 32.6
Level 5 36 7.1 65 12.7
Level 10* 8 1.6 20 3.9
Gender
Female 242 47.6 243 52.5
Male 266 52.4 269 47.5
Race/Ethnicity
Asian 104 20.5 109 21.3
Black or African American 101 19.9 121 23.6
Hispanic/Latino 268 52.8 253 49.4
White 33 6.5 27 5.3
Two or More Races 2 0.4 2 0.4
Services Received
FARMS 316 62.2 328 64.1
Special Education 4 0.8 12 2.3 * Level 10 ESOL students include those who did not meet exit criteria but are not receiving ESOL
services at the parents’ request. MSDE regards Level 10 as ESOL.
As shown in Table 2, the majority of students who took ESOL U.S. History in Semester 1 were in
Grade 9 (49%, n = 248) and Grade 10 (34%, n = 175). Most of the students were at ESOL Level 3
Montgomery County Public Schools Office of Shared Accountability
Program Evaluation Unit 13 ESOL Social Studies Practices and Outcomes
(32%, n = 161) and Level 4 (31%, n = 155). Of all 508 students, 53% (n = 268) were
Hispanic/Latino, and 62% (n = 316) received FARMS services in 2012–2013.
In Semester 2, the majority of students who took ESOL U.S. History were also in Grade 9 (49%,
n = 252) and Grade 10 (34%, n = 175). Most of the students were at ESOL Level 4 (33%, n = 167)
and Level 3 (28%, n = 145). Of all 512 students, 49% (n = 253) were Hispanic/Latino, and 64%
(n = 328) received FARMS services in 2012–2013 (Table 2).
Table C1 in Appendix C displays English proficiency levels as scored on ACCESS for students
who took the ESOL U.S. History course in Semester 1. For 493 students with valid ACCESS
scores, 1% (n = 4) were at entering level, 10% (n = 49) at emerging level, 32% (n = 158) at
developing level, 33% (n = 161) at expanding level, 16% (n = 80) at bridging level, and 8%
(n = 41) at reaching level. Similar information for Semester 2 is presented in Table C2
(Appendix C).
2. What were the characteristics of students who took ESOL Modern World History in
2012–2013?
Table 3 shows the characteristics of students who took ESOL Modern World History in
2012–2013 by semester. In Semester 1, 231 students took ESOL Modern World History, while 213
students took the course in Semester 2.
In Semester 1, the majority of students who took ESOL Modern World History were in Grade 10
(38%, n = 88) and Grade 9 (36%, n = 83). Most of the students were at ESOL Level 3 (29%,
n = 66) and Level 2 (28%, n = 65). Of all 231 students, 61% (n = 141) were Hispanic/Latino, and
59% (n = 137) received FARMS services in 2012–2013.
In Semester 2, the majority of students who took ESOL Modern World History were in Grade 9
(47%, n = 100) and Grade 10 (40%, n = 85). Most of the students were at ESOL Level 3 (37%,
n = 79) and Level 4 (23%, n = 48). Of all 213 students, 61% (n = 129) were Hispanic/Latino, and
74% (n = 158) received FARMS services in 2012–2013.

Montgomery County Public Schools Office of Shared Accountability
Program Evaluation Unit 14 ESOL Social Studies Practices and Outcomes
Table 3
Demographic Characteristics of Students Who Took ESOL Modern World
in 2012–2013 by Semester
ESOL Modern
World History
Semester 1
N = 231
ESOL Modern
World History
Semester 2
N = 213
n % n % Grade Level
9 83 35.9 100 46.9
10 88 38.1 85 39.9
11 31 13.4 26 12.2
12 29 12.6 2 0.9
ESOL Level
No level defined 4 1.7
Level 1 10 4.3 11 5.2
Level 2 65 28.1 42 19.7
Level 3 66 28.6 79 37.1
Level 4 43 18.6 48 22.5
Level 5 37 16.0 30 14.1
Level 10* 6 2.6 3 1.4
Gender
Female 98 42.4 96 45.1
Male 133 57.6 117 54.9
Race/Ethnicity
Asian 39 16.9 36 16.9
Black or African American 45 19.5 44 20.7
Hispanic/Latino 141 61.0 129 60.6
White 5 2.2 3 1.4
Two or More Races 1 0.4 1 0.5
Services
FARMS 137 59.3 158 74.2
Special Education 6 2.6 4 1.9 * Level 10 ESOL students include those who did not meet exit criteria but are not receiving ESOL
services at the parents’ request. MSDE regards Level 10 as ESOL.
Table C3 (Appendix C) presents English proficiency levels on ACCESS for students who took the
ESOL Modern World History course in Semester 1. Of 222 students with valid ACCESS scores,
most were in the developing (33%, n = 74) and expanding levels (28%, n = 62). Table C4 in
Appendix C provides similar information for Semester 2. Of 211 students, most of the students in
ESOL Modern World History Semester 2 were in developing (37%, n = 78) and expanding (28%,
n = 60) levels based on valid ACCESS scores.
In summary, about twice as many students took ESOL U.S. History as ESOL Modern World
History in the 2012–2013 school year. A majority of the students were Hispanic/Latino and
received FARMS services. Although the overall English proficiency levels of students in ESOL
U.S. History and ESOL Modern World History did not show large differences, the range (minimum
to maximum) of ACCESS scores was larger for students in ESOL U.S. History than those in ESOL
Modern World History (see Table C5 in Appendix C). This suggests that student English language
skills in ESOL U.S. History varied widely, compared to those in ESOL Modern World History.
Table C5 (Appendix C) presents average subscores for ACCESS by course and semester.
Montgomery County Public Schools Office of Shared Accountability
Program Evaluation Unit 15 ESOL Social Studies Practices and Outcomes
3. What were the psychometric characteristics of the final exams for the ESOL U.S. History
and ESOL Modern World History courses?
To study student performance on final exams, it is important first to examine the psychometric
properties of the final exams. Table 4 shows the test specification of the final exams for the ESOL
U.S. History and ESOL Modern World History courses in 2012–2013. Each final exam was given
at the end of a semester after students received instruction in the content areas. Students took final
exam A at the end of the first semester, and final exam B at the end of the second semester.
Table 4
Test Specifications of ESOL Social Studies Final Exams in 2012–2013
Test
Form
Written
Responses (WR)
Maximum
WR Score
%
Multiple Choice
(one point each)
%
Total Score
Points
ESOL U.S. History A EL 2 out of 4
10 x 2 = 20
(30.8%)
45
(69.2%) 20 + 45 = 65
ESOL U.S. History B EL
3 out of 5
8 x 3 = 24
(40.7%)
35
(59.3%) 24 + 35 = 59
ESOL Modern
World History A EL
2
15 x 2 = 30
(42.9%)
40
(57.1%) 30 + 40 = 70
ESOL Modern
World History B EL 3 out of 5
10 x 3 = 30
(46.2%)
35
(53.8%) 30 + 35 = 65 Source: Social Studies Program of OCIP in MCPS, September 2012.
For the ESOL U.S. History A exam (Table 4), students responded to two out of four writing
prompts (31% of the total score). The maximum score for writing prompts was 10 points. There
were 45 multiple choice test items, equivalent to 69% of the total score. The total score points for
both multiple choice and written responses on the ESOL U.S. History A exam ranged from 0 to 65
points.
Reliability
Based on multiple choice questions in the tests, the test reliability of the final exams ranged from
.82 for ESOL Modern World History A to .86 for ESOL U.S. History B (Table D1, Appendix D).
The test reliability is reasonably high (Nunnally, 1978). 5
Item Difficulty by Test
Table D2 (Appendix D) describes the item difficulty for ESOL U.S. History A and B final exams.
For the ESOL U.S. History A exam, the item difficulty values range from 29% for Item 34 to 82%
for Item 17. For the ESOL U.S. History B exam, the difficulty values range from 18% for Item 35
to 81% for Items 1 and 9.
Table D3 describes item difficulty for ESOL Modern World History A and B final exams. For
Exam A, the difficulty values range from 26% for Item 18 to 80% for Item 36, while for Exam B,
the difficulty values range from 25% for Item 33 to 77% for Item 4. These findings suggest that
none of the test items for either subject are too difficult or too easy.

Montgomery County Public Schools Office of Shared Accountability
Program Evaluation Unit 16 ESOL Social Studies Practices and Outcomes
Discrimination Index by Test
Table D2 shows the discrimination index for ESOL U.S. History A and B final exams. The majority
of the items are above the criteria value of .2 (Scheiser & Welch, 2006). However, two items on the
ESOL U.S. History A final exam have index values below .2 (.15 for Item 13 and .16 for Item 6).
On the ESOL U.S. History B final exam, two items also show index values below .2 (.16 for Item
19 and .17 for Item 35).
Table D3 describes the discrimination index for ESOL Modern World History A and B final exams.
Most of the discrimination index values are above .2. However, six items have values below .2
(Items 11, 13, 16, 20, 25, and 30) on the ESOL Modern World History A final exam. On the ESOL
Modern World History B final exam, Item 32 has a discrimination coefficient -.02. Items with
negative value or values below .2 need further examination or revision.
Distracter Analyses
Since final exams are secure test materials, distractor analyses are not presented here but shared
with OCIP staff due to security concerns. Results of distractor analyses can be used for test
revision.
Written Responses for Open-Ended Items
Written responses on the final exams were scored by classroom teachers. Teachers received scoring
training, used scoring rubrics to identify the response levels and converted levels to points and then
to percentage correct as shown in Appendix D4.
However, it was observed that teachers recorded student written responses in different ways on the
scantron sheets for the final exams. For instance, some teachers recorded levels, some recorded
points and others recorded percentages for the written responses. Therefore, the written response
results could not be reported due to data inconsistency. The issue of inconsistent data collection for
the written responses was shared with OCIP staff.
4. How did students perform in ESOL U.S. History in 2012–2013?
Final Exam
Since written response scores were not recorded consistently by teachers, the total points on the
final exam could not be used for analyses and reporting. However, teachers did give students their
final exam grades after score conversion. Students with a grade of D or higher passed the final
exams.
Montgomery County Public Schools Office of Shared Accountability
Program Evaluation Unit 17 ESOL Social Studies Practices and Outcomes
Table 5
Students Who Passed ESOL U.S. History Final Exams in 2012–2013
Took ESOL U.S. History
Final Exam in Semester 1
Took ESOL U.S. History
Final Exam in Semester 2
N n
passed % passed N
n
passed
%
passed
Total 508 293 57.7 512 350 68.4
Grade Level
9 248 141 56.9 252 177 70.2
10 175 90 51.4 175 103 58.9
11 70 51 72.9 82 69 84.1
12 15 11 73.3 3 NR
ESOL Level
No level defined 7 6 85.7 6 4 66.7
Level 1 17 6 35.3 19 13 68.4
Level 2 124 62 50.0 90 56 62.2
Level 3 161 85 52.8 145 97 66.9
Level 4 155 107 69.0 167 119 71.3
Level 5 36 23 63.9 65 47 72.3
Level 10* 8 4 50.0 20 14 70.0
Gender
Female 242 131 54.1 243 155 63.8
Male 266 162 60.9 269 195 72.5
Race/Ethnicity
Asian 104 77 74.0 109 89 81.7
Black or African American 101 62 61.4 121 88 72.7
Hispanic/Latino 268 126 47.0 253 146 57.7
White 33 26 78.8 27 25 92.6
Two or More Races 2 NR 2 NR
Services
FARMS 316 161 50.9 328 210 64.0
Special Education 4 NR 12 6 50.0 *Level 10 ESOL students include those who did not meet exit criteria but are not receiving ESOL services at the
parents’ request. MSDE codes Level 10 students as ESOL.
NR means not reported for a group with less than five students.
As shown in Table 5, 58% (n = 293) of the 508 students who took an ESOL U.S. History final
exam in Semester 1 passed. Among grade levels, students in Grades 11 (n = 51) and 12 (n = 11)
had the highest exam passing rates (73%). Of all ESOL levels (excluding no level defined), ESOL
Level 4 students had the highest exam passing rate (69%, n = 107). Among ethnic groups, White
students had the highest passing rate (79%, n = 26), while Hispanic/Latino students had the lowest
passing rate (47%, n = 126). About 51% of FARMS students (n = 161) passed the ESOL
U.S. History Semester 1 exam. Exam passing rates for Semester 2 are also displayed in Table 5.
Course Performance
Table 6 illustrates the course passing rates for ESOL U.S. History by semester. Of 508 students
who took an ESOL U.S. History course in Semester 1, 94% (n = 476) passed it. Among grade
levels, Grade 11 (99%, n = 69) and Grade 12 (100%, n = 15) students had the highest course
passing rates.

Montgomery County Public Schools Office of Shared Accountability
Program Evaluation Unit 18 ESOL Social Studies Practices and Outcomes
Table 6
Students Who Passed ESOL U.S. History Semester Courses in 2012–2013
Took ESOL U.S. History
Course in Semester 1
Took ESOL U.S. History
Course in Semester 2
N
n
passed
%
passed N
n
passed
%
passed
Total 508 476 93.7 512 469 91.6
Grade Level
9 248 229 92.3 252 231 91.7
10 175 163 93.1 175 154 88.0
11 70 69 98.6 82 81 98.8
12 15 15 100.0 3 NR
ESOL Level
No level defined 7 7 100.0 6 4 66.7
Level 1 17 17 100.0 19 18 94.7
Level 2 124 112 90.3 90 79 87.8
Level 3 161 146 90.7 145 128 88.3
Level 4 155 151 97.4 167 160 95.8
Level 5 36 35 97.2 65 63 96.9
Level 10* 8 8 100.0 20 17 85.0
Gender
Female 242 226 93.4 243 218 89.7
Male 266 250 94.0 269 251 93.3
Race/Ethnicity
Asian 104 102 98.1 109 106 97.2
Black or African American 101 100 99.0 121 118 97.5
Hispanic/Latino 268 242 90.3 253 217 85.8
White 33 30 90.9 27 26 96.3
Two or More Races 2 NR 2 NR
Services
FARMS 316 294 93.0 328 301 91.8
Special Education 4 NR 12 11 91.7 *Level 10 ESOL students include those who did not meet exit criteria but are not receiving ESOL services at the
parents’ request. MSDE codes Level 10 students as ESOL.
NR means not reported for a group with less than five students.
Of all ESOL levels (excluding no level defined, n = 7 and Level 10, n = 8), ESOL Level 1 students,
although the smallest number of students in a level, had the highest course passing rate
(100%, n = 17). Among ethnic groups (excluding multiple race, n = 2), Black or African American
students had the highest course passing rate (99%, n = 100), while Hispanic/Latino students had the
lowest passing rate (90%, n = 242). Over 93% of students receiving FARMS services (n = 294)
passed the ESOL U.S. History course in Semester 1. Course passing rates for Semester 2 are also
displayed in Table 6.
To summarize, more than 90% of students passed ESOL U.S. History semester courses, while only
58% to 68% of the students passed the final exams in Semester 1 and Semester 2. The course
passing rate was higher than the final exam passing rate across all student groups. Students in
Grades 11 and 12 had the highest passing rates for the final exams and the courses, compared to
students in other grades. Among ethnic groups, Hispanic/Latino students had the lowest passing
rates for the final exams. It is important to keep in mind that results should be interpreted with
caution when sample size is small.

Montgomery County Public Schools Office of Shared Accountability
Program Evaluation Unit 19 ESOL Social Studies Practices and Outcomes
5. How did students perform in ESOL Modern World History in 2012–2013?
Final Exam
Table 7 shows the final exam passing rates for ESOL Modern World History. Of 231 students who
took the ESOL Modern World History final exam in Semester 1, 49% (n = 114) passed. Of all
grade levels, Grade 9 students had the highest exam passing rate (54%, n = 45). Of all ESOL levels
(excluding no level defined, n = 4 and Level 10, n = 4), ESOL Level 4 students had the highest
exam passing rate (54%, n = 23). Among ethnic groups, Hispanic/Latino students had the lowest
passing rate (42%, n = 59). About 48% of students receiving FARMS services (n = 66) passed the
ESOL Modern World History Semester 1 exam. Passing rates on the Semester 2 final exam were
somewhat higher than Semester 1, and are also displayed in Table 7.
Table 7
Students Who Passed ESOL Modern World History Final Exams in 2012–2013
Took ESOL Modern World
History Final Exam
Semester 1
Took ESOL Modern World
History Final Exam
Semester 2
N
n
passed
%
passed N
n
passed
%
passed
Total 231 114 49.4 213 134 62.9
Grade Level
9 83 45 54.2 100 62 62.0
10 88 40 45.5 85 50 58.8
11 31 14 45.2 26 21 80.8
12 29 15 51.7 2 NR
ESOL Level
No level defined 4 NR
Level 1 10 3 30.0 11 8 72.7
Level 2 65 26 40.0 42 26 61.9
Level 3 66 35 53.0 79 43 54.4
Level 4 43 23 53.5 48 30 62.5
Level 5 37 19 51.4 30 26 86.7
Level 10* 6 4 66.7 3 NR
Gender
Female 98 40 40.8 96 58 60.4
Male 133 74 55.6 117 76 65.0
Race/Ethnicity
Asian 39 20 51.3 36 28 77.8
Black or African American 45 30 66.7 44 36 81.8
Hispanic/Latino 141 59 41.8 129 66 51.2
White 5 4 80.0 3 NR
Two or More Races 1 NR 1 NR
Services
FARMS 137 66 48.2 158 97 61.4
Special Education 6 2 33.3 4 NR *Level 10 ESOL students include those who did not meet exit criteria but are not receiving ESOL services at the
parents’ request. MSDE codes Level 10 students as ESOL.
NR means not reported for a group with less than five students.

Montgomery County Public Schools Office of Shared Accountability
Program Evaluation Unit 20 ESOL Social Studies Practices and Outcomes
Course Performance
Table 8 illustrates the course passing rates for ESOL Modern World History by semester. Of 231
students who took the ESOL Modern World History course in Semester 1, 92% (n = 212) passed.
Among grade levels, Grade 12 students had highest course passing rates (100%, n = 29). Of all
ESOL levels, ESOL Level 5 students had the highest course passing rate (100%, n = 37). Among
ethnic groups, Hispanic/Latino students had the lowest passing rate (87%, n = 123). About 93% of
students receiving FARMS services (n = 128) passed the ESOL Modern World History course in
Semester 1. Course passing rates for Semester 2 are also displayed in Table 8.
Table 8
Students Who Passed ESOL Modern World History Semester Courses in 2012–2013
Took ESOL Modern World
History Course
Semester 1
Took ESOL Modern World
History Course
Semester 2
N
n
passed
%
passed N
n
passed
%
passed
Total 231 212 91.8 213 201 94.4
Grade Level
9 83 76 91.6 100 97 97.0
10 88 77 87.5 85 76 89.4
11 31 30 96.8 26 26 100.0
12 29 29 100.0 2 NR
ESOL Level
No level defined 4 NR
Level 1 10 9 90.0 11 11 100.0
Level 2 65 57 87.7 42 42 100.0
Level 3 66 60 90.9 79 69 87.3
Level 4 43 39 90.7 48 48 100.0
Level 5 37 37 100.0 30 29 96.7
Level 10* 6 6 100.0 3 NR
Gender
Female 98 90 91.8 96 91 94.8
Male 133 122 91.7 117 110 94.0
Race/Ethnicity
Asian 39 39 100.0 36 36 100.0
Black or African American 45 44 97.8 44 44 100.0
Hispanic/Latino 141 123 87.2 129 117 90.7
White 5 5 100.0 3 NR
Two or More Races 1 NR 1 NR
Services
FARMS** 137 128 93.4 158 151 95.6
Special Education 6 6 100.0 4 NR *Level 10 ESOL students include those who did not meet exit criteria but are not receiving ESOL services
at the parents’ request. MSDE codes Level 10 students as ESOL.
NR means not reported for a group with less than five students.
Results show that over the two semesters, 49% to 63% of students who took the ESOL Modern
World History course passed the final exams, while over 90% of the students passed the semester
course. Hispanic/Latino students had the lowest passing rates for the final exams among
racial/ethnic groups.

Montgomery County Public Schools Office of Shared Accountability
Program Evaluation Unit 21 ESOL Social Studies Practices and Outcomes
6. Did the course sequence contribute to student performance in ESOL U.S. History and
ESOL Modern World History?
To examine if the course sequence is a contributing factor in predicting student success in ESOL
U.S. History and ESOL Modern World History courses, four logistic regression models were used.
The results for ESOL U.S. History are shown in Table 9, and the results for ESOL Modern World
History are shown in Table 10.
In the first two analyses (Table 9), the probability of passing ESOL U.S. History was examined.
English proficiency (2013 ACCESS overall scale scores) and whether a student previously took
ESOL Modern World History, were used as two predictors for passing the ESOL U.S. History
semester course with a grade of D or higher in Semester 1 and Semester 2. The results show that
only the ACCESS scores were significant (p ≤ .000), but the effect sizes were negligible in
predicting course success. The explained variance as represented by Nagelkerke R Square was .202
for Semester 1 and .159 in Semester 2.
For the ESOL U.S. History Semester 1 course, Nagelkerke R2 of .202 indicates that 20.2% of the
variance in passing the course with D or higher could be explained by the variance in 2013
ACCESS overall scores and whether the students took ESOL Modern World History or not before
2012–2013. However, ACCESS overall scores played a more significant role compared to whether
the students took ESOL Modern World History before 2012–2013. Further analyses showed that if
ACCESS overall scores were used as the only predictor for the Semester 1 model, R2 changed
slightly from .202 to .184. For Semester 2, R2 stayed the same with or without taking the Modern
World History course before 2012–2013.
Table 9
Probability of Students Passing ESOL U.S History as Predicted by 2013 ACCESS Overall Scale Score and
Having Taken ESOL Modern World History Course Prior to 2012–2013
Predictors for Passing Course N B S.E. Wald’s df p
Exp(B)
(Odds
Ratio)
Nagelkerke
R2
Passed U.S. History Semester 1 493 .202
2013 ACCESS Overall Scores .047 .010 23.486 1 .000 1.048
Previously took MWH -.957 .562 2.897 1 .089 .384
Constant -14.140 3.622 15.242 1 .000 .000
Passed U.S. History Semester 2 487 .159
2013 ACCESS Overall Scores .043 .008 25.247 1 .000 1.044
Previously took MWH .057 .457 .016 1 .900 1.059
Constant -13.862 3.288 17.778 1 .000 .000 Note. Passing a semester course means obtaining a course grade of D or higher. MWH = Modern World History.
In the second two analyses (Table 10), the probability of passing ESOL Modern World History was
examined. English proficiency (2013 ACCESS overall scale scores) and whether a student took
ESOL U.S. History before 2012–2013 were used as two predictors for passing the semester course
with a grade of D or higher in Semesters 1 and 2. The results show that only the ACCESS scores
were significant (p ≤ .000) in predicting course success but neither of the odds ratios represent an
effect size that would be meaningful in an educational setting. The explained variance as indicated
by Nagelkerke R2 was .241 and .308. Additional analyses showed that if ACCESS overall scores
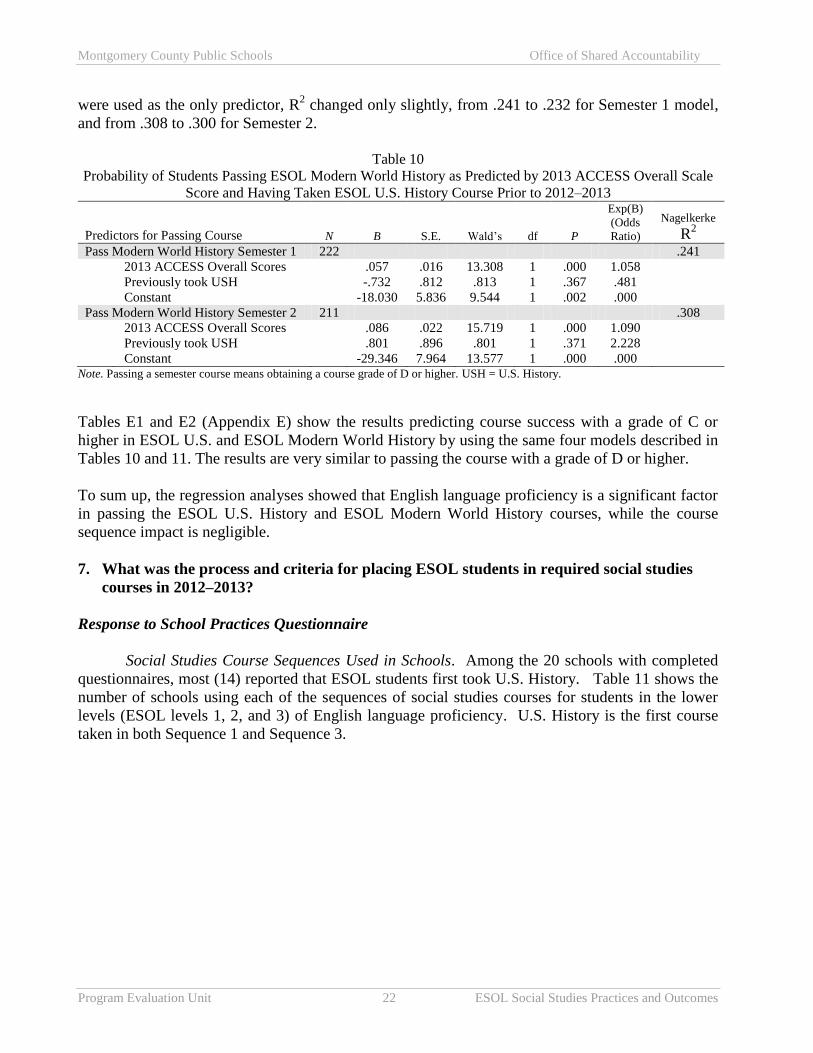
Montgomery County Public Schools Office of Shared Accountability
Program Evaluation Unit 22 ESOL Social Studies Practices and Outcomes
were used as the only predictor, R2 changed only slightly, from .241 to .232 for Semester 1 model,
and from .308 to .300 for Semester 2.
Table 10
Probability of Students Passing ESOL Modern World History as Predicted by 2013 ACCESS Overall Scale
Score and Having Taken ESOL U.S. History Course Prior to 2012–2013
Predictors for Passing Course N B S.E. Wald’s df P
Exp(B)
(Odds
Ratio)
Nagelkerke
R2
Pass Modern World History Semester 1 222 .241
2013 ACCESS Overall Scores .057 .016 13.308 1 .000 1.058
Previously took USH -.732 .812 .813 1 .367 .481
Constant -18.030 5.836 9.544 1 .002 .000
Pass Modern World History Semester 2 211 .308
2013 ACCESS Overall Scores .086 .022 15.719 1 .000 1.090
Previously took USH .801 .896 .801 1 .371 2.228
Constant -29.346 7.964 13.577 1 .000 .000 Note. Passing a semester course means obtaining a course grade of D or higher. USH = U.S. History.
Tables E1 and E2 (Appendix E) show the results predicting course success with a grade of C or
higher in ESOL U.S. and ESOL Modern World History by using the same four models described in
Tables 10 and 11. The results are very similar to passing the course with a grade of D or higher.
To sum up, the regression analyses showed that English language proficiency is a significant factor
in passing the ESOL U.S. History and ESOL Modern World History courses, while the course
sequence impact is negligible.
7. What was the process and criteria for placing ESOL students in required social studies
courses in 2012–2013?
Response to School Practices Questionnaire
Social Studies Course Sequences Used in Schools. Among the 20 schools with completed
questionnaires, most (14) reported that ESOL students first took U.S. History. Table 11 shows the
number of schools using each of the sequences of social studies courses for students in the lower
levels (ESOL levels 1, 2, and 3) of English language proficiency. U.S. History is the first course
taken in both Sequence 1 and Sequence 3.

Montgomery County Public Schools Office of Shared Accountability
Program Evaluation Unit 23 ESOL Social Studies Practices and Outcomes
Table 11
Sequence of Social Studies Courses for ESOL Students in 20 MCPS High Schools Completing
School-Level ESOL Social Studies Questionnaire, Spring 2013 Sequence of ESOL social studies courses most frequently used for ESOL
Level 1, 2, and 3 students:
Number of schools
Sequence 1: U.S. History, NSL Government, and Modern World History 13
Sequence 2: Modern World History, U.S. History, and NSL Government 6
Sequence 3: U.S. History, Modern World History, and NSL Government 1
Other responses:
First ESOL student takes U.S. Culture or Academic Language course, then one of the sequences above.
Sequence count (4) included in count above of schools.
Reasons for Course Sequence. School personnel were asked in the questionnaire to explain
the reasons that their school put this sequence of required social studies courses in place for
students with lower levels of English proficiency (Levels 1, 2, and 3). Responses varied with the
particular sequence; the main themes reported by the respondents are shown in Table 12.
Table 12
Reasons Reported for Social Studies Course Sequence in 20 MCPS High Schools Completing
School-Level ESOL Social Studies Questionnaire, Spring 2013 Usual sequence of ESOL social studies courses
for ESOL Level 1, 2, and 3 students:
Reasons reported for using course sequence (number of
respondents reported):
Sequence 1: U.S. History, NSL Government,
and Modern World History
Same as the non-ESOL social studies course sequence
(2)
Builds on the U.S. Culture course, which is provided
[in some schools] for low English proficient students
(2)
U.S. History is easiest among the social studies
courses in terms of language requirements (2)
U.S. History follows from middle school and provides
a background for NSL (3)
Sequence 2: Modern World History, U.S.
History, and NSL Government
Students will be able to draw on their background
knowledge to be successful in MWH (3)
Sequence was recommended by the ESOL Office (1)
Having NSL last gives students best chance to acquire
language and content skills for HSA (3)
Sequence 3: U.S. History, Modern World
History, and NSL Government Having NSL last gives students the best chance to
acquire language and content skills for HSA (1)
Factors Considered in Course Sequence Decisions. School personnel were asked to rate a
set of factors according to how much each would be considered in determining the sequence of
required social studies courses that students took. Table 13 shows the ratings for each of the factors
by the respondents at 20 high schools.

Montgomery County Public Schools Office of Shared Accountability
Program Evaluation Unit 24 ESOL Social Studies Practices and Outcomes
Table 13
Ratings of Factors Considered in Deciding ESOL Students’ Social Studies Course Sequence
N
Always a factor
Sometimes a
factor Rarely a factor
n % n % n %
ESOL level of student 18 11 61.1 6 33.3 1 5.6
Student’s scheduling needs 19 9 47.4 7 36.8 3 15.8
Teacher recommendation 18 8 44.4 9 50.0 1 5.6
Student performance in
previous course 18 8 44.4 8 44.4 2 11.1
New to U.S. 18 8 44.4 8 44.4 2 11.1
Grade level of student 18 6 33.3 10 55.6 2 11.1
Student preference 18 3 16.7 8 44.4 7 38.9
New to MCPS 18 2 11.1 12 66.7 4 22.2
Number of students 17 1 5.9 6 35.3 10 58.8
Country of origin 17 0 0.0 2 11.8 15 88.2
Note: N represents the number of schools with a survey response.
The factor considered more often than any others was the ESOL level of the student (61% of
respondents indicated that it was always a factor). Over 40% of respondents indicated that student’s
schedule, teacher’s recommendation, previous course performance, and being new to the United
States were always a factor in decisions about social studies course sequence for ESOL students.
Other factors that were added by the respondents (that were not included in the survey list)
included:
Age (named by 5 respondents)
Credits from home country or other state (3)
Reading level (2)
Interrupted education (1)
Special education needs (1)
Optimal Sequence of Social Studies Courses Judged by Respondents. Finally, respondents
to the school practices questionnaire were asked to name the optimal sequence of required social
studies courses that would best support the academic success of ESOL students. For ESOL students
with the lowest level of proficiency (ESOL Levels 1 and 2), respondents were split nearly evenly
between the benefit of starting with ESOL Modern World History (10 respondents—as indicated in
Sequence 2) or with ESOL U.S. History (total of 9 respondents—as indicated in Sequences 1 and
3), as shown in Table 14.

Montgomery County Public Schools Office of Shared Accountability
Program Evaluation Unit 25 ESOL Social Studies Practices and Outcomes
Table 14
Optimal Sequence of Social Studies Courses for Level 1 and 2 ESOL Students Named by
Respondents from 20 MCPS High Schools Completing School-Level ESOL
Social Studies Questionnaire, Spring 2013 (N = 20) Optimal sequence of ESOL social studies courses for
ESOL Level 1 and 2 students:
Number of schools
Sequence 1: U.S. History, NSL Government, and Modern World History 7
Sequence 2: Modern World History, U.S. History, and NSL Government 10
Sequence 3: U.S. History, Modern World History, and NSL Government 2
I don’t know 1
Additional responses:
First ESOL student takes U.S. Culture or Academic Language course, then one of the sequences above.
Sequence count (4) included in count above of schools.
For Level 3 ESOL students, the reported optimal sequence shifted a bit, with slightly more
respondents indicating that Sequence 1 (U.S. History, NSL Government, and Modern World
History) would be most beneficial. Table 15 shows the number of respondents choosing the
sequences for this group of students.
Table 15
Optimal Sequence of Social Studies Courses for Level 3 ESOL Students Named by Respondents
from 20 MCPS High Schools Completing School-Level ESOL Social Studies Questionnaire,
Spring 2013 (N = 20) Optimal sequence of ESOL social studies courses for
ESOL Level 3 students:
Number of schools
Sequence 1: U.S. History, NSL Government, and Modern World History 9
Sequence 2: Modern World History, U.S. History, and NSL Government 7
Sequence 3: U.S. History, Modern World History, and NSL Government 2
Other responses: I don’t know, or depends on student 2
Respondents were asked to indicate reasons for their choice of optimal sequences. Most frequently,
respondents answered that the sequence works best with the language skills of the students. The
reasons described by the respondents are shown below:
Best match with English proficiency (6)
Allows the best preparation for the NSL Government HSA (5)
Material from Modern World History is more recognizable (2)
Student’s grade level (2)
Major Findings from School-level Questionnaire
Most schools (13) use the sequence U.S. History, NSL Government, and Modern World History for
ESOL Levels 1, 2, or 3 students. Reasons reported for using this sequence were that this is the

Montgomery County Public Schools Office of Shared Accountability
Program Evaluation Unit 26 ESOL Social Studies Practices and Outcomes
same as the non-ESOL social studies course sequence, that it builds on the U.S. Culture course
(offered in some schools), and that U.S. History is easiest among the social studies courses in terms
of language requirement.
Schools were split when asked to report the optimal sequence for the lowest ESOL levels (Levels 1
and 2): 10 schools would start with Modern World History and 9 schools would start with
U.S. History. For Level 3 students, the response was only slightly different, but shifted to 11
schools choosing to start with U.S. History, and 7 schools indicating they would start with Modern
World History for the ESOL Level 3 students. Reasons reported by most schools for their choice of
the optimal sequence was that it provides the best match with English proficiency, and that it allows
the best preparation for the NSL Government HSA.
8. What were teachers’ views on the sequencing of the required social studies courses for
ESOL students, and other factors that might affect ESOL student performance?
Teacher Survey Response
Table 16 summarizes the characteristics of the 31 teachers who responded to the teacher survey.
Table 16
Characteristics of 31 MCPS Teachers Completing ESOL Social Studies Survey,
Spring 2013 (N = 31) n %
Number of years taught
in MCPS
1 to 5 years 2 6.5
6 to 9 years 9 29.0
10 or more years 20 64.5
Number of years taught
sheltered ESOL courses
(n = 30)
1 to 5 years 14 46.7
6 to 9 years 8 26.7
10 or more years 8 26.7
Percentage of students
designated ESOL in
school where teaching
Less than 5% ESOL 3 9.7
6% to 7% ESOL 8 25.8
7% to 9% ESOL 7 22.6
10% or more ESOL 13 41.9
Responding teachers were from 15 different high schools. Almost two thirds of the respondents
had taught 10 years or more in MCPS (65%), and about half (53%) had taught sheltered ESOL
courses for 6 years or more. Nearly two thirds of the responding teachers (65%) were teaching in
schools where 7% or more of the students were enrolled in ESOL classes.
Teachers’ Views of Optimal Sequence of Social Studies Courses. The teachers were asked to
indicate the optimal sequence of social studies courses for ESOL students with different levels of
English proficiency. Table 17 shows their responses for ESOL Levels 1 and 2 students. Of the 25
teachers who indicated an optimal sequence, most (n = 15) chose a sequence that teaches
U.S. History first (Sequence 1 and 3) for students at ESOL Levels 1 or 2.
Montgomery County Public Schools Office of Shared Accountability
Program Evaluation Unit 27 ESOL Social Studies Practices and Outcomes
Table 17
Optimal Sequence of Social Studies Courses for Level 1 and 2 ESOL Students Named by Teachers
Completing ESOL Social Studies Survey, Spring 2013 (N = 31)
Optimal sequence of social studies courses for
ESOL Level 1 and 2 students:
Number of respondents
Sequence 1: U.S. History, NSL Government, and Modern World History 6
Sequence 2: Modern World History, U.S. History, and NSL Government 10
Sequence 3: U.S. History, Modern World History, and NSL Government 9
Other responses:
First take U.S. Culture or Academic Language (then one of the sequences
above) 2
Level 1 students should not take social studies courses (but indicated
sequence for Level 2) 2
Levels 1 and 2 students do not have linguistic ability to take social studies
courses (no sequences indicated) 1
No response 5
Table 18 shows teachers’ choices of optimal sequence for students at ESOL Level 3. Again, most
of the respondents who indicated their choice of an optimal sequence (n = 26) chose sequences that
teach U.S. History first (Sequence 1 or Sequence 3; n = 17), but nine teachers chose Sequence 2,
which teachers Modern World History first.
Table 18
Optimal Sequence of Social Studies Courses for Level 3 ESOL Students Named by Teachers
Completing ESOL Social Studies Survey, Spring 2013 Optimal sequence of social studies courses for
ESOL Level 3 students:
Number of respondents
Sequence 1: U.S. History, NSL Government, and Modern World History 8
Sequence 2: Modern World History, U.S. History, and NSL Government 9
Sequence 3: U.S. History, Modern World History, and NSL Government 9
No response 5
As in the school-level survey, the teachers were asked to indicate reasons for their choice of optimal
sequences. The most frequent response from teachers was that NSL Government should come later
in the sequence so students have time to develop language and content skills that will help them
succeed on the NSL Government HSA. The reasons described by the teachers are shown below:
NSL Government needs to be later in course sequence (7 teachers)
Material from Modern World History is more familiar, students from outside U.S. have
some background knowledge (2 teachers)
Students should take U.S. Culture course before social studies sequence (2 teachers)

Montgomery County Public Schools Office of Shared Accountability
Program Evaluation Unit 28 ESOL Social Studies Practices and Outcomes
U.S. History is not as complex in concepts, content, and language as Modern World History
(2 teachers)
Starting with U.S. History is more linear and structured (1 teacher)
If an ESOL student is able to follow the original sequence they would have peer group and
build support network (1 teacher)
Teachers’ Judgments of the Impact of the Course Sequence. Teachers were asked to judge
the impact of the sequence of the social studies courses on several aspects of the ESOL students’
social studies course experiences. Table 19 shows the teachers’ responses.
Table 19
Ratings of the Impact of Social Studies Course Sequence on ESOL Students’ Course Experience
N
A major
impact
A minor
impact No impact
I don’t
know/no
answer
n % n % n % n %
Learning the content of the
course 31 12 38.7 9 29.0 4 12.9 6 19.4
Completing the assignments 31 6 19.4 13 41.9 5 16.1 7 22.6
Passing the final exam 31 12 38.7 9 29.0 3 9.7 7 22.6
Overall performance in the
course 31 12 38.7 9 29.0 4 12.9 6 19.4
Enrolling in honors and AP
social studies courses 31 5 16.1 7 22.6 5 16.1 14 45.2
Performance on NSL HSA 31 15 48.4 4 12.9 1 3.2 11 35.5
Performance on the NSL Government HSA was the aspect on which the highest percentage of
teachers judged whether the course sequence had a major impact (48%). Overall performance in
the course, learning the content, and passing the final exam were judged to be impacted to a major
degree by the sequence of courses by 39% of the responding teachers.
Teachers’ Reports of Student Experiences in Social Studies Courses. Teachers were asked
to respond to a series of items about the ESOL U.S. History course and the ESOL Modern World
History course, with their perceptions of students’ experience with the course. Table 20 shows their
responses.

Montgomery County Public Schools Office of Shared Accountability
Program Evaluation Unit 29 ESOL Social Studies Practices and Outcomes
* Calculation of percentages did not include “No experience” and no response categories.
The numbers of surveyed teachers who had taught the specific courses were small, so caution is
needed when examining response summaries. Two of the items elicited different levels of
agreement from teachers of the two courses. As shown in Table 20, teachers who had taught ESOL
U.S. History were more likely to agree that students in the course had adequate language skills to
succeed in the course than were teachers who taught ESOL Modern World History (44% compared
with 31%), and teachers who taught ESOL U.S. History were almost twice as likely as teachers
who taught ESOL Modern World History to agree that most ESOL students in the course gain the
course knowledge needed to pass the ESOL-adapted countywide final exam (60% compared with
31%). Thus, on these specific issues, teachers’ responses about students’ capacity to succeed in the
ESOL social studies courses revealed more concerns about the ESOL Modern World History
Table 20
Response to Survey Questions about ESOL U.S. History and ESOL Modern World History Courses (N = 31)
ESOL U.S. History
ESOL Modern World
History
n %* n %*
Most ESOL students in
this class have adequate
language skills to succeed
in class.
Strongly agree 0 0.0 0 0.0
Agree 7 43.8 5 31.3
Disagree 3 18.8 5 31.3
Strongly disagree 6 37.5 6 37.5
No experience in last 2
years 11 14
No response 4 1
All, or nearly all, of the
course material is new
(i.e., not previously
learned) for most ESOL
students.
Strongly agree 9 56.3 8 50.0
Agree 4 25.0 5 31.3
Disagree 3 18.8 3 18.8
Strongly disagree 0 0.0 0 0.0
No experience in last 2
years 11 13
No response 4 2
Most ESOL students in
this course gain the course
knowledge needed to pass
the ESOL-adapted
countywide final exam.
Strongly agree 0 0.0 0 0.0
Agree 9 60.0 5 31.3
Disagree 6 40.0 6 37.5
Strongly disagree 0 0.0 5 31.3
No experience in last 2
years 12 13
No response 4 2
Most ESOL students are
able to learn the course
content within the
timeframe of the course.
Strongly agree 0 0.0 0 0.0
Agree 6 37.5 6 37.5
Disagree 4 25.0 3 18.8
Strongly disagree 6 37.5 7 43.8
No experience in last 2
years 11 13
No response 4 2

Montgomery County Public Schools Office of Shared Accountability
Program Evaluation Unit 30 ESOL Social Studies Practices and Outcomes
course than the ESOL U.S. History course. Interestingly, the same percentage of teachers in the
two courses agreed (81%) that all or nearly all of the course material is new and not previously
learned in ESOL U.S. History and ESOL Modern World History.
Teachers were asked to add comments related to the questions shown in Table 20. Fifteen teachers
provided additional comments. All of the comments were concerned with the difficult content level
of the courses, and the inadequate language skills and background knowledge that the students
bring to the classes. Several teachers noted that they use modified materials and lots of scaffolding
in class so the students are able to learn the material covered in class, but they cannot cover all the
content that will be included on the final exam.
Challenges in ESOL Social Studies Instruction. The greatest challenges reported by the
teachers in ESOL social studies instruction are displayed in Table 21. Of the 31 teachers responding
to the survey, 28 named at least one challenge; many named more than one.
Table 21
Greatest Challenges in Social Studies Instruction for ESOL Students Named by Teachers
Completing ESOL Social Studies Survey, Spring 2013 (N = 28)
Challenge n %
Lack of English language skills, academic vocabulary 12 42.9
Inappropriate materials; adapted texts and resources are needed 6 21.4
Multiple ESOL levels in same class 5 17.9
Students lack background knowledge 4 14.3
Complex, difficult curricula 3 10.7
Insufficient time to cover material 3 10.7
Unfamiliar exam format 3 10.7
Note. Respondents could name multiple challenges so percentages add to more than 100.
Many of the teachers viewed the lack of language skills as the greatest challenge for instructing
ESOL students in social studies. Several teachers commented that the curriculum is complex,
vocabulary-heavy, and requires lots of reading. One teacher noted the difficulty of “encouraging
language acquisition without ‘dumbing down’ the content.”
Teachers were asked what they believed were the most pressing needs to support ESOL students’
success in social studies classes. In addition to naming the issues covered in the questions above
(language needs, background knowledge), teachers identified these needs:
Modified curricula and appropriate resources, including resources for differentiation
(5 teachers)
Flexibility in content coverage; ESOL students need more time to grasp the material and
time frame does not allow full coverage of entire curriculum (2 teachers)
Teachers’ Suggested Ways to Optimize ESOL Students’ Social Studies Learning. Similarly,
when teachers were asked what would help optimize ESOL students’ success in social studies
courses, the largest number of teachers named adapted curriculum and modified materials. Table 22
displays the suggestions provided most frequently by 25 teachers who responded.
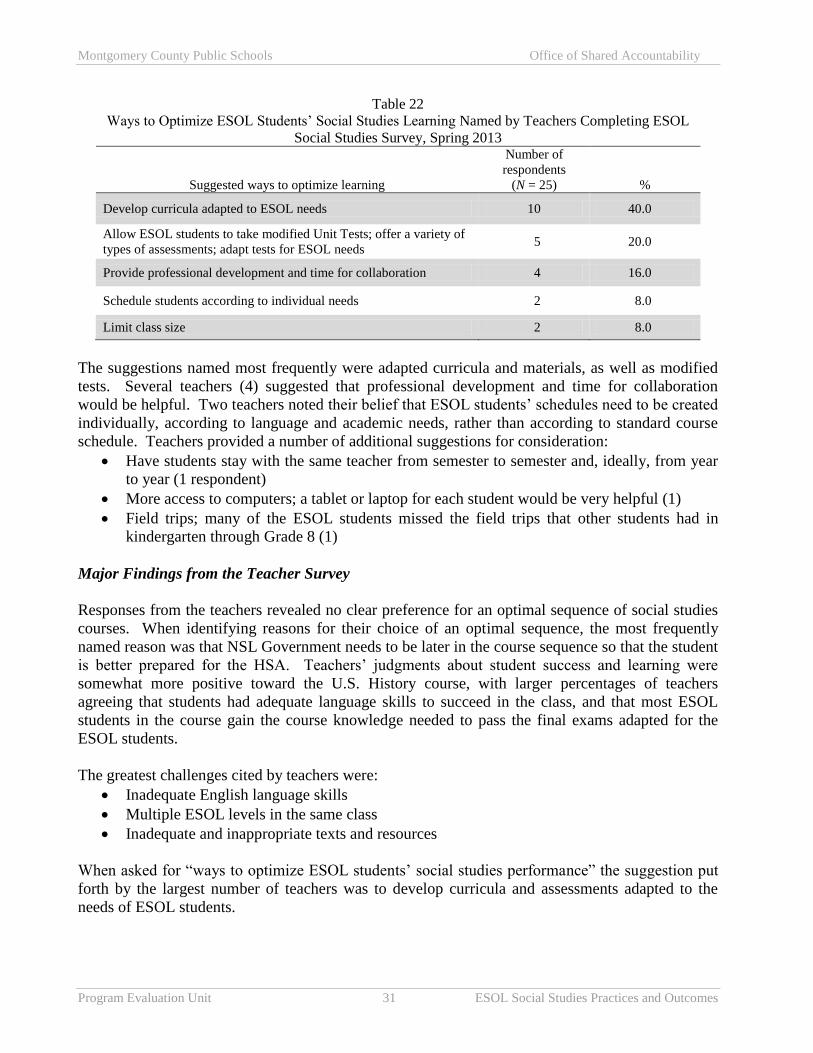
Montgomery County Public Schools Office of Shared Accountability
Program Evaluation Unit 31 ESOL Social Studies Practices and Outcomes
Table 22
Ways to Optimize ESOL Students’ Social Studies Learning Named by Teachers Completing ESOL
Social Studies Survey, Spring 2013
Suggested ways to optimize learning
Number of
respondents
(N = 25)
%
Develop curricula adapted to ESOL needs 10 40.0
Allow ESOL students to take modified Unit Tests; offer a variety of
types of assessments; adapt tests for ESOL needs 5 20.0
Provide professional development and time for collaboration 4 16.0
Schedule students according to individual needs 2 8.0
Limit class size 2 8.0
The suggestions named most frequently were adapted curricula and materials, as well as modified
tests. Several teachers (4) suggested that professional development and time for collaboration
would be helpful. Two teachers noted their belief that ESOL students’ schedules need to be created
individually, according to language and academic needs, rather than according to standard course
schedule. Teachers provided a number of additional suggestions for consideration:
Have students stay with the same teacher from semester to semester and, ideally, from year
to year (1 respondent)
More access to computers; a tablet or laptop for each student would be very helpful (1)
Field trips; many of the ESOL students missed the field trips that other students had in
kindergarten through Grade 8 (1)
Major Findings from the Teacher Survey
Responses from the teachers revealed no clear preference for an optimal sequence of social studies
courses. When identifying reasons for their choice of an optimal sequence, the most frequently
named reason was that NSL Government needs to be later in the course sequence so that the student
is better prepared for the HSA. Teachers’ judgments about student success and learning were
somewhat more positive toward the U.S. History course, with larger percentages of teachers
agreeing that students had adequate language skills to succeed in the class, and that most ESOL
students in the course gain the course knowledge needed to pass the final exams adapted for the
ESOL students.
The greatest challenges cited by teachers were:
Inadequate English language skills
Multiple ESOL levels in the same class
Inadequate and inappropriate texts and resources
When asked for “ways to optimize ESOL students’ social studies performance” the suggestion put
forth by the largest number of teachers was to develop curricula and assessments adapted to the
needs of ESOL students.

Montgomery County Public Schools Office of Shared Accountability
Program Evaluation Unit 32 ESOL Social Studies Practices and Outcomes
Conclusion
Learning social studies in secondary school is challenging for many ESOL students (Pahl, 2007).
Many of them have not had prior exposure to a U.S.-based social studies curriculum and lack an
understanding of the cultural context of the social studies curriculum. In addition, social studies
lessons require literacy skills, including reading, writing, speaking, listening, interpreting tables,
charts, and maps, and synthesizing information (Szpara & Ahmad, 2007).
Most of the students taking the two courses were in ESOL Levels 2, 3, or 4, and were assessed on
ACCESS to be at developing or expanding proficiency levels. In general, students who took ESOL
Modern World History were at lower MCPS ESOL levels than those who took ESOL U.S. History.
The results in this study show that twice as many students were enrolled in ESOL U.S. History as in
ESOL Modern World History in the 2012–2013 school year. It is possible that when ESOL students
are first enrolled in ESOL U.S. History, and take ESOL Modern World History later in their high
school careers, some of the students may have improved their English language skills enough to
enroll in the regular (non-sheltered) Modern World History course.
About 49% to 68% of students who took ESOL U.S. History and ESOL Modern World History
passed the final exams, while more than 90% of the students passed the semester courses. The final
exams only account for 25% of a student’s final course grade, so passing the course also depends on
classwork, homework, projects, and classroom participation. Among all racial/ethnic groups,
Hispanic/Latino students had the lowest passing rates for the final exams and semester courses. An
achievement gap was observed between Hispanic/Latino and White or Asian students.
Overall English language proficiency as indicated by the ACCESS scale score was a significant
predictor of course success in ESOL U.S. History and ESOL Modern World History. After
controlling for English language proficiency, the course sequence was not significant in predicting
course success. The ACCESS scale scores explained more variance of course success in ESOL
Modern World History than in ESOL U.S. History; this may mean that English language
proficiency plays a more important role in ESOL Modern World History than in ESOL U.S.
History.
The finding that English language proficiency plays a key role in ESOL students’ success in social
studies courses is consistent with the feedback received from school personnel involved in students’
course placement, as well as teachers of the ESOL social studies courses. The factor considered
more than others in determining sequence of courses was a student’s ESOL level. According to the
teacher’s survey, the sequence most frequently used for ESOL Levels 1, 2, or 3 students, was
U.S. History, NSL Government, and Modern World History. Schools using this sequence reported
that this course sequence logically followed the middle school courses and that the U.S. History
course contained less challenging English language requirements than other social studies courses.
Teachers also reported that the greatest challenges in the ESOL social studies courses were
language-related, including inadequate skills, multiple ESOL levels in the same class, and
inadequate and inappropriate texts and resources. The number one suggestion from teachers on
“ways to optimize ESOL students’ social studies performance” was to develop curricula adapted to
the language needs of ESOL students. Based on teachers’ feedback, course sequencing is a
Montgomery County Public Schools Office of Shared Accountability
Program Evaluation Unit 33 ESOL Social Studies Practices and Outcomes
secondary issue. The primary issue is language readiness. If curricula can be adapted based on
student English language proficiency level, course sequence will not matter too much, according to
teachers.
When placing students in different ESOL courses, teachers considered factors such as student’s
ESOL level and schedule, teacher’s recommendations, previous course performance, entrance time
to the U.S., student’s age, reading level and education in their home countries, as well as their
special education needs.
Some ESOL students have had quality schooling in their country, while others have had only sporadic
schooling in their home country (Dutro, et al., 2008). For ESOL students, English may require more
intensive and targeted instruction. Many MCPS teachers surveyed in the study viewed lack of
language skills as the greatest challenge for instructing ESOL students in social studies.
Szpara and Ahmad (2007) proposed best practices in ESOL social studies instruction: 1) creating a
socially supportive classroom; 2) providing explicit instruction in academic strategies necessary for
successful comprehension of complex content; and 3) increasing the accessibility of complex
content knowledge by reducing cognitive load without reducing content. MCPS teachers surveyed
in this study also believed the most pressing needs to support ESOL students’ success in social
studies classes included student language needs, background knowledge, modified curricula,
appropriate resources for differentiation, and flexibility in content coverage.
In summary, there is no conclusive evidence to support or discredit the current recommended
course sequence for ESOL social studies, in which a student takes ESOL Modern World History
before ESOL U.S. History. However, there is some evidence to show that student English
proficiency level is a more important predictor for success in the courses than the course sequence.
Limitations
Due to the non-experimental nature of the study, it is not possible to draw a causal relationship
between course sequence and student performance. Because of inconsistency of the data for the
open-ended questions, the open-ended questions were excluded from the analyses. In addition,
teacher survey results need to be interpreted with caution due to low response rate (52%).

Montgomery County Public Schools Office of Shared Accountability
Program Evaluation Unit 34 ESOL Social Studies Practices and Outcomes
Recommendations
Based on the study, the following recommendations are proposed:
Continue to provide flexibility for schools to determine the optimal course sequence in
ESOL social studies.
Address ESOL students’ language needs by providing appropriate resources for
differentiation and flexibility in content coverage.
Use different course (or section) codes to distinguish sheltered ESOL social studies courses
from the regular social studies courses in high school in order to better monitor student
progress.
Examine and revise test items with discrimination coefficients below .20 on ESOL U.S. and
Modern World History final exams.
Simplify the final exam score conversion rules so scores can be recorded consistently and
human coding errors can be reduced.
Acknowledgements
The authors would like to thank Mrs. Maria L. Tarasuk, supervisor of Pre-K–12 Social Studies,
and Ms. Sonja M. Bloetner, ESOL supervisor in the Division of ESOL/Bilingual Programs for their
program support; Dr. Shahpar Modarresi, supervisor of the Program Evaluation unit for her
oversight of the study; Dr. Nyambura Maina for her contributions to the study plan and review of
the report; Mrs. Trisha McGaughey for review of the data and report, and Mrs. Natalie Wolanin for
data support.
Montgomery County Public Schools Office of Shared Accountability
Program Evaluation Unit 35 ESOL Social Studies Practices and Outcomes
References
Birdsong, D. (1992) Ultimate attainment in second language acquisition. Language Learning, Vol.
21, pp. 235–243.
Birdsong, D. (2006). Age and second language acquisition and processing: A selective overview.
Language Learning, Vol. 56, pp. 9–49.
Bialystok, F. & Hakuta, K. (1999). In other words: The science and psychology of second language
acquisition. New York: Basic Books.
Collier, V.P. (1987). Age and rate of acquisition of second language for academic purposes. TESOL
Quarterly, 21(4), 617–641.
Collier, V.P. & Thomas, W. (1997). School effectiveness for language minority students.
Washington DC: National Clearinghouse for Bilingual Education.
Cook, G., Linquanti, R. Chinen, M. & Jung, H. (2012). National evaluation of Title III
implementation supplemental report: Exploring approaches to setting English language
proficiency performance criteria and monitoring English learner progress. Washington DC:
U.S. Department of Education.
Cortina, J.M. (1993). What is coefficient alpha? An examination of theory and applications.
Journal of Applied Psychology, 78, 98–104.
Cronbach L.J. (1951). Coefficient alpha and the internal structure of tests. Psychometrika, 16(3),
297–334.
Cummins, J. (1981). The role of primary language development in promoting educational success
for language minority students. In California State Department of Education, (Ed.),
Schooling and language minority students: A theoretical framework (pp. 3–50). Los
Angeles: California State University: Evaluation, Dissemination, and Assessment Center.
Cummins, J. & Nakajima, J. (1987). Age of arrival, length of residence and interdependence of
literacy skills among Japanese immigrant students. In B. Harley, P. Allen, J. Cummins & M.
Swain (Eds.), The development of bilingual proficiency. Toronto: Ontario Institute for
Studies in Education.
DeKeyser, R. (2000). The robustness of critical period effects in second language acquisition.
Studies in Second Language Acquisition, 22(4), 499–534.
Dutro, S., Achieve, E., & Kinsella, K. (2008) English language development: Issues and
implementation at grades six through twelve. San Francisco, CA: San Francisco State
University.
Ebel, Robert L. and Frisbie, David A. 1991, Essentials of educational measurement (5th
ed.).
Englewood Cliffs, NJ: Prentice-Hall.
Montgomery County Public Schools Office of Shared Accountability
Program Evaluation Unit 36 ESOL Social Studies Practices and Outcomes
Echevarria, J., Vogt, M., & Short, D.J. (2008). (3rd Ed.). Making content comprehensible for
English learners: The SIOP model. Columbus, Ohio: Allyn & Bacon/ Merrill.
Francis, D.J., Rivera, M., Lesaux, N., Kieffer, M., & Rivera, H. (2006). Practical guidelines for the
education of English language learners: Research-based recommendations for the use of
accommodations in large-scale assessment. Houston, TX: University of Houston for the
Center on Instruction.
Genesee, F., Lindholm-Leary, K., Saunders, W., & Christian, D. (2006). Educating English language
learners: A synthesis of research evidence. Cambridge: Cambridge University Press.
Haertel, E.H. (2006). Reliability, in Educational Measurement, by R.L Brennan (4th
ed.). Westport,
CT: Praeger Publisher.
Hakuta, K., Butler, Y. & Witt, D. (2000). How long does it take English learners to attain
proficiency: University of California Linguistic Minority Research Institute Policy Report
2000-1. Santa Barbara: UC-LMRI.
Kane, M.T. (2006). Validation, in Educational measurement by R.L Brennan (4th ed.).Westport,
CT: Praeger Publisher.
Kern, R. (2002). Notion of literacy, in R. Kern (ed.) Literacy and language teaching. New York:
Oxford University Press.
Kline, P. (1999). The handbook of psychological testing (2nd
ed.). London: Routledge.
Long, M. (1990). Maturational constraints on language development, Studies in Second Language
Acquisition, 12, 251–286.
Maryland State Department of Education. (2012). Government High School Assessment, Retrieved
from http://www.mabe.org/wp-content/uploads/2012/05/Government-High-School-
Assessment.pdf.
Montgomery County Public Schools. (2012a). ESOL curriculum and instruction: High school.
Retrieved from http://www.montgomeryschoolsmd.org/curriculum/socialstudies/high/.
Montgomery County Public Schools. (2012b). Social studies in high school. Retrieved from
http://www.montgomeryschoolsmd.org/curriculum/esol/high/index.shtm.
Montgomery County Public Schools. (2012c). High School Assessment (HSA) information.
Retrieved September 2012 from http://www.montgomeryschoolsmd.org/curriculum/hsa/.
Muñoz, C. (2011). Input and long-term effects of starting age in foreign language of learning.
International Review of Applied Linguistics in Language Teaching, 49(2), 113–133.
National Center for Educational Statistics. (2011). The nation’s report card: Reading 2011,
Washington, DC: U.S. Department of Education.

Montgomery County Public Schools Office of Shared Accountability
Program Evaluation Unit 37 ESOL Social Studies Practices and Outcomes
National Clearinghouse for English Language Acquisition & Language Instruction Educational
Programs. (2011). The growing number of English learner students: 1998/99–2008/09,
Washington DC: U.S. Department of Education.
Nejadansari, D. & Nasrollahzadeh, J. (2011). Effect of age on second language acquisition, Studies
in Literature and Language, 3, 19–24.
Nunnally, J.C. (1978). Psychometric theory. New York, NY: McGraw Hill Publishing Company.
O’Brien, J. (2011). The system is broken and it’s failing these kids: High school social studies
teachers’ attitudes towards training for ELLs. The Journal of Social Studies Research,
35(1), 22–38.
Ritter, N. (2010). "Understanding a widely misunderstood statistic: Cronbach's alpha". Paper
presented at Southwestern Educational Research Association (SERA) Conference 2010,
New Orleans, LA.
Pahl, R.H. (2007). Teaching English-language learners is a major problem in social studies. Social
Studies, September/October 2007, 179.
Patkowski, M. (1980). The sensitive period for the acquisition of syntax in a second language,
Language Learning, 30, 449–472.
Scarcella, R. (2003). Academic English: A conceptual framework, Irvine: University of California
Linguistic Minority Research Institute.
Scheiser, C.B & Welch, C.J. (2006). Test development, Educational Measurement, edited by
R.L. Brennan, Westport: CT: Praeger Publisher.
Szpara, M.Y. & Ahmad, I. (2007). Supporting English-language learners in social studies class:
Results from a study of high school teachers. Social Studies, September/October 2007,
189–195.
World Class Institutional Design and Assessment. (2012). ACCESS for ELLs®
overview: Essential
background. Retrieved September 28, 2012, from
http://www.wida.U.S./assessment/access/background.aspx.

Montgomery County Public Schools Office of Shared Accountability
Program Evaluation Unit 38 ESOL Social Studies Practices and Outcomes
Appendix A
Guidelines for the High School ESOL Instructional Pathways
Table A1
Guidelines for the High School ESOL Instructional Pathways–Operational Version
Entering as ESOL
Level 1 students
(Entering)
Entering as ESOL
Level 2 students
(Emerging)
Entering as ESOL
Level 3 students
(Developing)
Entering as ESOL
Level 4 students
(Expanding)
Entering as ESOL
Level 5 students
(Bridging)
ESOL 1 ESOL 2 ESOL 3 ESOL 4 ESOL 5
ESOL 1 ESOL 2
Sheltered Read 180
or
Read 180
Read 180
or
English 9
or
English 10
Appropriate
English course
or
TOEFL Prep
or
Other required
course
Reading Advantage
& Read About
Sheltered Read 180
or Read 180
or
Developmental
Reading
Read 180
or
ESOL Multimedia
Arts Literacy (EMAL)
Other required
course
Sheltered Algebra 1
or
appropriate math
course
Algebra 1
or
appropriate math
course
Appropriate math
course
Appropriate math
course
Appropriate math
course
Academic Language
(math, science, &
social studies based)
Sheltered Matter and
Energy
or
appropriate science
course
Biology
or
appropriate science
course
Biology
or
appropriate science
course
Appropriate
science course
Other required
course
Sheltered Modern
World
or
appropriate history
course
U.S. History
or
appropriate history
course
U.S. History
or
National, State, &
Local Government
(as appropriate)
Appropriate social
studies course
Source: February 13, 2012, by Division of ESOL/Bilingual programs, MCPS.
Note. The ESOL courses suggested in this document are recommended for the development of English language
proficiency. The table does not include all courses required for graduation. Courses that appear in bold may be taught
by ESOL teachers on an ESOL allocation as resources permit.
These pathways are for ESOL students with previous schooling. Modify these instructional pathways to adjust
for the needs of ESOL students with interrupted schooling enrolled in METS or ESOL students with special
education needs. Courses do not need to follow this sequence but ESOL 1 and 2 courses should run as a double
period.
The appropriate content course should be selected that is appropriate for the ESOL student based on the
student’s previous credits and grade level. Consider placing ESOL students in AP and Honors classes when
appropriate.
Sheltered content courses should be scheduled for ESOL 1 through ESOL 3 students when possible.

Montgomery County Public Schools Office of Shared Accountability
Program Evaluation Unit 39 ESOL Social Studies Practices and Outcomes
Appendix B
Description of High School ESOL Courses
ESOL LEVEL 1 A/B Course Code: 1201/1211 (0.5 credit)
This course is designed to teach English as a new language to ESOL students at the Entering English
language proficiency level. The language domains of reading, writing, listening, and speaking are
integrated into thematic units as students acquire and practice oral and written language in an academic
context. Instruction initially focuses on high-frequency vocabulary development and oral fluency to
facilitate the development of social language, basic literacy and writing across the curriculum. A general
introduction to American culture is provided. This course meets for a double period every day.
ESOL LEVEL 1 ELECTIVE A/B Course Code: 1217/1218 (0.5 credit)
This companion course for ESOL LEVEL 1 A/B is designed to continue teaching Entering level ESOL
students. Students continue developing listening, speaking, reading and writing skills to facilitate
acquisition of English as a new language for social and academic purposes.
ESOL LEVEL 2 A/B Course Code: 1202/1212 (0.5 credit)
This course is designed to teach English as a new language to ESOL students at the Emerging English
language proficiency level. Newly acquired vocabulary is incorporated into more complex structures, in
both oral and written language, focusing on functional and academic skills. Language structures are
presented in the context of literary and expository text, as students explore themes and concepts connected to
various content areas.
ESOL LEVEL 3 A/B Course Code: 1203/1213 (0.5 credit)
This course is designed to teach English as a new language to ESOL students at the Developing English
language proficiency level. Students review the language structures taught at level 1 and 2 with emphasis
on developing fluency, more sustained, complex oral and written communication. Students continue to
expand their vocabulary, and acquire greater precision in the use of grammatical forms. Students hone
their academic literacy skills for comprehension and effective writing, by reading and responding to
narrative and expository text.
ESOL LEVEL 4 A/B Course Code: 1204/1214 (0.5 credit)
This course is designed to teach English as a new language to ESOL students at the Expanding English
language proficiency level. Instruction focuses on the development of linguistic complexity in speaking
and writing and advanced listening comprehension. Through expanded reading, students study elements
of literary style and analyze various literary and expository texts to improve reading comprehension and
interpretation skills.
ESOL LEVEL 5 A/B Course Code: 1205/1215 (0.5 credit)
This course is designed to teach English as a new language to ESOL students at the Bridging English
language proficiency level. Students increase their language development and cultural knowledge as they
refine strategies for critical analysis by studying texts from a variety of genres and time periods. In their
essays, research papers, and discourse, students demonstrate their command of English by analyzing,
evaluating, justifying and drawing conclusions about literature and expository text.

Montgomery County Public Schools Office of Shared Accountability
Program Evaluation Unit 40 ESOL Social Studies Practices and Outcomes
Appendix C
2013 ACCESS Overall English Proficiency Level and MCPS ESOL Level
Table C1
2013 ACCESS Overall English Proficiency Level for Students Who Took ESOL U.S. History Semester 1
Course in 2012–2013 by Their MCPS ESOL Levels
MCPS ESOL
ACCESS 2013 Overall English Proficiency Levels
Semester 1 (N = 493)
Entering Emerging Developing Expanding Bridging Reaching
n % n % n % n % n % n %
Level 1 (n = 17) 1 5.9 4 23.5 11 64.7 1 5.9 0 0.0 0 0.0
Level 2 (n = 122) 2 1.6 25 20.5 48 39.3 37 30.3 10 8.2 0 0.0
Level 3 (n = 157) 1 0.6 19 12.1 74 47.1 53 33.8 10 6.4 0 0.0
Level 4 (n = 153) 0 0.0 1 0.7 23 15.0 57 37.3 45 29.4 27 17.6
Level 5 (n = 36) 0 0.0 0 0.0 1 2.8 11 30.6 12 33.3 12 33.3
Level 10 (n = 8) 0 0.0 0 0.0 1 12.5 2 25.0 3 37.5 2 25.0
Total (N = 493) 4 0.8 49 9.9 158 32.0 161 32.7 80 16.2 41 8.3
Table C2
2013 ACCESS Overall English Proficiency Level for Students Who Took ESOL U.S. History Semester 2
Course in 2012–2013 by Their MCPS ESOL Levels
MCPS ESOL
ACCESS 2013 Overall English Proficiency Levels
Semester 2 (N = 487)
Entering Emerging Developing Expanding Bridging Reaching
n % n % n % n % n % n %
Level 1 (n = 17) 1 5.9 3 17.6 11 64.7 2 11.8 0 0.0 0 0.0
Level 2 (n = 84) 1 1.2 15 17.9 28 33.3 30 35.7 10 11.9 0 0.0
Level 3 (n = 139) 1 0.7 16 11.5 59 42.4 46 33.1 15 10.8 2 1.4
Level 4 (n = 165) 0 0.0 6 3.6 38 23.0 44 26.7 49 29.7 28 17.0
Level 5 (n = 62) 0 0.0 1 1.6 4 6.5 27 43.5 16 25.8 14 22.6
Level 10 (n = 20) 0 0.0 2 10.0 2 10.0 7 35.0 8 40.0 1 5.0
Total (N = 487) 3 0.6 43 8.8 142 29.2 156 32.0 98 20.1 45 9.2
Montgomery County Public Schools Office of Shared Accountability
Program Evaluation Unit 41 ESOL Social Studies Practices and Outcomes
Table C3
2013 ACCESS Overall English Proficiency Level for Students Who Took ESOL Modern World History
Semester 1 Course in 2012–2013 by Their MCPS ESOL Levels
MCPS ESOL
ACCESS 2013 Overall English Proficiency Levels
Semester 1 (N = 222)
Entering Emerging Developing Expanding Bridging Reaching
n % n % n % n % n % n %
Level 1 (n = 10) 0 0.0 3 30.0 4 40.0 3 30.0 0 0.0 0 0.0
Level 2 (n = 63) 1 1.6 26 41.3 22 34.9 8 12.7 6 9.5 0 0.0
Level 3 (n = 65) 0 0.0 12 18.5 27 41.5 21 32.3 5 7.7 0 0.0
Level 4 (n = 42) 0 0.0 1 2.4 12 28.6 16 38.1 12 28.6 1 2.4
Level 5 (n = 36) 1 2.8 2 5.6 6 16.7 13 36.1 9 25.0 5 13.9
Level 10 (n = 6) 0 0.0 0 0.0 3 50.0 1 16.7 2 33.3 0 0.0
Total (N = 222) 2 0.9 44 19.8 74 33.3 62 27.9 34 15.3 6 2.7
Table C4
2013 ACCESS Overall English Proficiency Level for Students Who Took ESOL Modern
World History Semester 2 Course in 2012–2013 by Their MCPS ESOL Levels
MCPS ESOL
ACCESS 2013 Overall English Proficiency Levels
Semester 2 (N = 211)
Entering Emerging Developing Expanding Bridging Reaching
n % n % n % n % n % n %
Level 1 (n = 11) 0 0.0 2 18.2 6 54.5 2 18.2 1 9.1 0 0.0
Level 2 (n = 42) 0 0.0 9 21.4 17 40.5 10 23.8 6 14.3 0 0.0
Level 3 (n = 78) 1 1.3 21 26.9 35 44.9 14 17.9 7 9.0 0 0.0
Level 4 (n = 47) 0 0.0 3 6.4 16 34.0 17 36.2 9 19.1 2 4.3
Level 5 ((n = 30) 0 0.0 0 0.0 3 10.0 17 56.7 5 16.7 5 16.7
Level 10 (n = 3) 0 0.0 0 0.0 1 33.3 0 0.0 2 66.7 0 0.0
Total (N = 211) 1 0.5 35 16.6 78 37.0 60 28.4 30 14.2 7 3.3
Montgomery County Public Schools Office of Shared Accountability
Program Evaluation Unit 42 ESOL Social Studies Practices and Outcomes
Table C5
2013 ACCESS Scale Scores for Students Taking ESOL U.S. History and
Modern World History by Semester
ACCESS Scale Score N Minimum Maximum Mean Std. Deviation
U.S. History Semester 1
ListeningSS2013 494 136 487 396 39
SpeakingSS2013 493 266 428 372 37
ReadingSS2013 494 208 468 377 28
WritingSS2013 494 251 455 406 22
ComprehensionSS2013 494 186 465 383 28
OralSS2013 493 222 458 384 32
LiteracySS2013 494 230 453 391 23
OverallSS2013 493 233 446 389 23
U.S. History Semester 2
ListeningSS2013 487 136 487 397 39
SpeakingSS2013 489 182 428 376 39
ReadingSS2013 489 208 468 379 28
WritingSS2013 489 251 455 406 24
ComprehensionSS2013 487 186 468 384 28
OralSS2013 487 222 458 387 32
LiteracySS2013 489 230 457 392 23
OverallSS2013 487 233 457 391 24
Modern World History Semester 1
ListeningSS2013 222 301 487 388 33
SpeakingSS2013 222 297 428 369 40
ReadingSS2013 222 297 444 370 25
WritingSS2013 222 327 461 400 22
ComprehensionSS2013 222 313 453 376 25
OralSS2013 222 310 446 379 32
LiteracySS2013 222 324 438 385 21
OverallSS2013 222 329 438 383 23
Modern World History Semester 2
ListeningSS2013 211 282 473 386 33
SpeakingSS2013 211 183 428 364 39
ReadingSS2013 211 313 444 370 24
WritingSS2013 211 327 461 400 22
ComprehensionSS2013 211 325 453 375 24
OralSS2013 211 270 444 375 32
LiteracySS2013 211 324 439 385 21
OverallSS2013 211 329 438 382 22

Montgomery County Public Schools Office of Shared Accountability
Program Evaluation Unit 43 ESOL Social Studies Practices and Outcomes
Appendix D
Psychometric Properties of ESOL U.S. History A and Modern World History
Final Exams in Semester 1(A) and Semester 2(B)
As shown by Cronbach's Alpha (Table D1), the test reliability is 0.86 for ESOL U.S. History A
final exam based on 45 multiple-choice items, and .83 for ESOL Modern World History A final
exam based on 40 multiple choice items. The reliability of the ESOL social studies final exams
ranged from 0.82 to 0.86 which was above the acceptable standard.
Table D1
Test Reliability of ESOL Social Studies Final Exams
Based on Multiple Choice Questions
Multiple Choice
Test Items
Reliability
Cronbach's Alpha
ESOL US History A 45 .86
ESOL US History B 35 .86
ESOL Modern World History A 40 .83
ESOL Modern World History B 35 .82
Montgomery County Public Schools Office of Shared Accountability
Program Evaluation Unit 44 ESOL Social Studies Practices and Outcomes
Table D2
Item Difficulties and Discrimination for ESOL U.S. History Final Exams ESOL U.S. History A Final Exam ESOL U.S. History B Final Exam
Test Items
Difficulty
(% correct)
Discrimination
(p-biserial)
Difficulty
(% correct)
Discrimination
(p-biserial)
1 74 .36 81 .34
2 78 .26 76 .49
3 63 .29 63 .47
4 49 .44 52 .47
5 66 .55 54 .45
6 58 .16 41 .45
7 46 .33 46 .29
8 69 .46 42 .37
9 54 .54 81 .42
10 41 .37 70 .52
11 62 .38 45 .37
12 38 .21 41 .28
13 42 .15 44 .38
14 38 .31 63 .36
15 71 .37 65 .38
16 66 .43 60 .45
17 82 .42 76 .47
18 60 .48 68 .50
19 55 .41 36 .16
20 58 .52 56 .37
21 36 .35 67 .44
22 55 .49 66 .46
23 57 .41 68 .47
24 54 .21 65 .42
25 66 .49 62 .43
26 31 .27 75 .46
27 41 .29 70 .47
28 59 .28 54 .49
29 62 .40 58 .47
30 67 .39 72 .47
31 48 .32 57 .52
32 51 .37 44 .43
33 53 .41 76 .54
34 29 .45 73 .44
35 72 .25 18 .17
36 46 .45
37 75 .41
38 56 .40
39 57 .38
40 55 .37
41 68 .53
42 63 .40
43 48 .42
44 36 .22
45 36 .35

Montgomery County Public Schools Office of Shared Accountability
Program Evaluation Unit 45 ESOL Social Studies Practices and Outcomes
Table D3
Item Difficulty and Discrimination for ESOL Modern World History Final Exams ESOL Modern World History A Final Exam ESOL Modern World History B Final Exam
Test Items Difficulty (% correct)
Discrimination
(p-biserial) Difficulty (% correct)
Discrimination
(p-biserial)
1 53 .28 51 .37
2 45 .30 60 .33
3 63 .46 73 .39
4 58 .43 77 .38
5 52 .38 35 .38
6 66 .42 26 .20
7 55 .40 67 .20
8 61 .42 44 .34
9 37 .37 44 .48
10 47 .50 50 .42
11 40 .16 37 .37
12 49 .47 49 .41
13 35 .16 47 .29
14 48 .42 68 .42
15 66 .41 54 .45
16 32 .15 52 .50
17 49 .58 48 .31
18 26 .29 55 .35
19 65 .48 36 .31
20 45 .18 54 .40
21 42 .46 50 .39
22 44 .37 69 .28
23 75 .44 45 .35
24 73 .46 53 .48
25 27 .09 62 .46
26 47 .20 45 .44
27 52 .45 62 .44
28 28 .34 62 .47
29 42 .42 57 .51
30 32 .10 40 .38
31 42 .29 61 .48
32 37 .38 26 -.02
33 45 .48 25 .35
34 45 .23 72 .35
35 48 .38 41 .36
36 80 .33
37 46 .47
38 35 .36
39 61 .56
40 57 .43

Montgomery County Public Schools Office of Shared Accountability
Program Evaluation Unit 46 ESOL Social Studies Practices and Outcomes
Table D4
Scoring Guidelines for Written Responses on ESOL Social Studies Final Exams
Final Exams
Exam
Weight Level Points
Convert to
Percent
ESOL U.S. History A 31%
4 9–10 90–100%
3 8.5 85%
2 7.5 75%
1 6.5 65%
0 0–5.5 0–55%
ESOL U.S. History B 41%
4 8 90–100%
3 7 87.5%
2 6 75%
1 5 62.5%
0 0–4 0–50%
ESOL Modern World History A* 43%
3 14–15 93–100%
2 11–13 73–87%
1 8–10 53–67%
0 0–7 0–47%
ESOL Modern World History B 46%
4 9–10 90–100%
3 8 80%
2 7 70%
1 6 60%
0 0–5 0–50% *Lower-level ESOL students are recommended for Modern World History A first in their social studies sequence; therefore, the
scoring guidelines only are provided up to Level 3.

Montgomery County Public Schools Office of Shared Accountability
Program Evaluation Unit 47 ESOL Social Studies Practices and Outcomes
Appendix E
Course Sequence and Probability of Obtaining a Course Grade of C or Higher
Table E1
Probability of Obtaining a Course Grade of C or higher in ESOL U.S. History with 2013 ACCESS Overall
Scale Score and ESOL Modern World History Experience Prior to 2012–2013
Predictors of obtaining a course
grade of C or higher B S.E. Wald’s df P
Exp(B)
(Odds
Ration)
Nagelkerke
R Square
C or + in USH S1 Course .155
2013 ACCESS Overall Scores .037 .006 42.658 1 .000 1.038
Took MWH before 2012–2013 .104 .246 .179 1 .672 1.110
Constant -13.184 2.209 35.617 1 .000 .000
C or + in USH S2 Course .121
2013 ACCESS .030 .006 28.785 1 .000 1.030
Took MWH before 2012–2013 -.316 .272 1.358 1 .244 .729
Constant -9.908 2.167 20.914 1 .000 .000
Note. USH = U.S. History; S1 = Semester 1; MWH = Modern World History; S2 = Semester 2.
Table E2
Probability of Obtaining a Course Grade of C or Higher in ESOL Modern World History with 2013
ACCESS Overall Scale Score and ESOL U.S. History Experience Prior to 2012–2013
Predictors of obtaining a
course grade of C or higher B S.E. Wald’s df
P
value
Exp(B)
(Odds
Ration)
Nagelkerke
R Square
C or + in MWH S1 Course .295
2013 ACCESS Overall Scores .055 .010 30.813 1 .000 1.056
Took USH before 2012–2013 -.131 .420 .096 1 .756 .878
Constant -19.376 3.774 26.356 1 .000 .000
C or + in MWH S2 Course .235
2013 ACCESS Overall Scores .047 .009 25.879 1 .000 1.048
Took USH before 2012–2013 -.199 .467 .182 1 .670 .819
Constant -16.712 3.592 21.649 1 .000 .000
Note. USH = U.S. History; S1 = Semester 1; MWH = Modern World History; S2 = Semester 2.