u.s. health reforms to improve access, outcomes and …
TRANSCRIPT

U.S. HEALTH REFORMS TO IMPROVE ACCESS, OUTCOMES AND VALUE:
INTERNATIONAL INSIGHTS AND INNOVATIVE POLICIES
Cathy Schoen
Senior Vice President
The Commonwealth Fund
One East 75th
Street
New York, NY 10021
http://www.commonwealthfund.org
Invited Testimony
Senate Special Committee on Aging
September 30, 2009
This testimony draws on Commonwealth Fund work authored by Karen Davis and
Commonwealth Fund colleagues and benefits from their comments. The research
assistance of Kristof Stremikis and Davis Squires and the editorial assistance of Chris
Hollander of The Commonwealth Fund are gratefully acknowledged. The views
presented here are those of the author and not necessarily those of The Commonwealth
Fund or its directors, officers, or staff.

U.S. HEALTH REFORMS TO IMPROVE ACCESS, OUTCOMES AND VALUE:
INTERNATIONAL INSIGHTS AND INNOVATIVE POLICIES
ORAL STATEMENT AND EXECUTIVE SUMMARY
Thank you, Mr. Chairman and members of the Committee, for the invitation to
testify regarding insights for the U.S. from international experiences in reforming their
health care systems to improve access, outcomes and value for their populations. As the
United States confronts the urgent need for federal action to expand and improve access
and to slow the increase in health care costs for families, employers, and the public
sector, we might well ask how other countries insure everyone, achieve outcomes that
rival or exceed those in the U.S, yet spend far less than we do.
The U.S. stands out among wealthy, industrialized nations for: our failure to cover
everyone; our expensive, complex, and inefficient insurance system; our fragmented
healthcare delivery systems with a weak primary care foundation; lack of information;
and for incentives to increase volume irrespective of quality or outcomes. Such concerns
are “made in America” – virtually all other high income, advanced industrialized
countries have adopted insurance policies that assure coverage for the entire population,
access to care, and financial protection, with an emphasis on protecting those vulnerable
due to poor health or low incomes. They do so at far lower costs with outcomes that are
often comparable or better than those in the U.S.
The U.S. leads the world in health spending with costs projected to continue to
rise far faster than incomes over the next decade if trends continue. Health care spending
already consumes 17 percent of the nation’s resources (gross domestic product) at $2.5
trillion or $7,290 per person – more than twice what other major high income,
industrialized countries spend. Health spending as a percent of our Gross Domestic
Product will likely reach 21 percent by 2020 if trends continue. Compared to other
industrialized countries, we spend about twice as much per person and 50 percent to
double the share of national resources (GDP). As a share of resources, we spend 50
percent to twice as much as other countries and the gap has been widening since 1980 –
particularly in the past five years. Relatively higher-cost countries such as Germany and
Canada have moderated their growth relative to incomes and countries with lower
spending such as the U.K. have increased outlays as a matter of deliberate public policy.

We have opportunities to learn from international strategies and reforms as
countries adopt innovative policies to improve performance, incorporate incentives to
enhance value, and harness markets and competition in the public interest. The key
questions confronting U.S. national reforms are how to expand coverage to everyone and
slow the growth in healthcare costs while maintaining or improving the quality of care.
Looking at other countries it is clear that each has developed and continues to develop its
own approach, with policies and health systems evolving from their unique histories and
institutions. Similarly, U.S. will need to craft policies and adapt changes that fit our
history, institutions, and values. Still, we can learn from values and strategies that cut
across diverse countries and from examples of incentives, policies and practices that
contribute to higher performance. The international experience provides insight regarding
the potential direction and effectiveness for U.S. insurance, payment, and delivery
systems reforms.
Five lessons from the international experience stand out:
• Payment Policies: Prices, Purchasing Power, Information, and Incentives
In comparing the U.S. to other countries, in addition to insurance gaps, we are
notable for paying higher prices, including very high prices for more specialized care,
and for incentives to do more irrespective of value. Unlike other countries with multiple-
payers and competing insurers – such as Germany, Switzerland and the Netherlands – we
lack a mechanism to coordinate payment policies to achieve coherent price signals or to
use group purchasing power to move in the same direction. In more monopolized
markets, U.S. private insurers often act as price-takers to maintain networks and pass-
through higher prices, with a mark-up for marketing, administrative costs, and margins.
As a result, the US tends to pay higher prices for specialized services, including
prescription drugs – particularly brand name drugs without generic options. A recent
McKinsey study found the U.S. pays 50 percent more for comparable drugs and pays for
a more expensive mix of drugs than do other developed countries leading to total costs
that are twice as high as expected – amounting to some $98 billion excess spending per
year.
• Primary Care: Payment, Incentives and Infrastructure
Overall, the U.S. stands out for a weak primary care foundation with poor care
coordination. Most strikingly, other countries have insurance systems that promote

continuity and provide choice of all primary care practices in the community. Many
encourage or require patients to identify a “medical home” which is their principal source
of primary care responsible for coordinating specialist care when needed. After-hours
cooperatives take over for primary care physicians at nights and weekends.
Most fundamentally, other countries make primary care financially and physically
accessible to their residents. Insurance designs emphasize coverage for primary care with
low or no cost-sharing for preventive care and essential medications for chronic illness.
The US relies on market incentives to shape its health care system, yet other countries are
more advanced in providing financial incentives to primary care physicians targeted on
quality of care. Incentives and targeted support for primary care in other countries include
extra payments to add nurses to care teams, payment for email consults, and enhanced
visit payments for after-hours care. Providers receive financial incentives for enrolling
patients and for offering chronic care services such as patient self-management education.
Several countries pay physicians in a way that narrows the spread between primary care
physician and specialists’ income, especially compared to the widening gaps in the
United States. Countries that have traditionally paid on a fee-for-service basis, are
increasingly moving toward a mixed payment method that includes a per-patient monthly
allotment for providing access, coordination, teams and serving as a “medical home” and
fees for visits or incentives for quality.
• Information Systems to Inform, Guide and Drive Innovation
Other countries have invested to spread the adoption and use of electronic health
information technology, with the capacity for information exchange. As of 2006, one-
fourth of U.S. primary care physician report use of electronic medical records –
compared with over nine in ten primary care physicians in the Netherlands, New Zealand,
and the U.K. Primary care physicians in other countries also increasingly have an array of
functionality, as countries build on capacity. When assessed against 14 different
functions of advanced information capacity, one in five US primary care physicians
reported having at least 7 out of the 14 functions compared to 60 percent to a high of
ninety percent of physicians in the Netherlands, Australia, the U.K and New Zealand .
The wide differences reflect national efforts to standardize and promote use, often with
financial incentives.
• Comparative Information and Transparency

In addition to assessing clinical effectiveness to inform clinical decisions and
benefit designs, several countries are developing rich comparative information systems
on performance. In Germany, peers visit hospitals whose quality is substandard, and enter
into a “dialogue” about why that is the case. The Netherlands and the U.K. are also
investing in transparency in reporting quality data, including patient experiences. In both
countries, this information is posted on public-websites as well as fed-back to clinicians
(Figure 28). The U.K. publishes extensive information on hospital quality and surgical
results by hospital and surgeon.
• Insurance-Related Administrative Costs
As currently structured, the U.S. insurance system also generates high insurance-
related administrative and overhead costs – for insurers and for doctors and hospitals. On
a per person basis, the U.S. spends more than twice as much for the net costs of insurance
administration. Varying benefit designs, marketing costs, churning in and out of
coverage, underwriting, and insurance profit margins also contribute to higher overhead
costs. A recent McKinsey study estimates such complexity – including multiple reporting
requirements - accounts for some $90 billion per year in excess costs.
Conclusion
In summary, several core strategies span diverse countries, although each country
has evolved its own approach. These include:
• Coverage for Everyone: An Explicit National Goal and Shared Value
o Insurance designs emphasize access, financial protection and value
o Insurance provides foundation for payment and system reforms
• Payment policies that emphasize value and use group-purchasing power, and
promote primary care, prevention and effective care of chronic disease,
• System reforms to harness markets and competition in the public interest and
provide information to spur improvement performance and innovation
o Market rules focus competition on quality and efficiency
o In multi-payer systems, joint efforts to move in the same direction
o Information systems to inform, guide, and drive change and innovation
• Leadership, goals and targets
o In countries with multiple payers and competing insurers, this includes
provisions for public and private participation

Insurance reform is fundamental for access and financial protection. It also can
serve as a base for a more rational payment system and incentives that reward value not
volume. Coherent prices and payment policies that support effective and efficient care are
critical for markets to work, as is information. Investing in comparative information and
assessment and advanced clinical information systems are instrumental to inform, guide,
and drive innovation. These core strategies cut across other countries and have fueled
reforms as countries seek to meet the health needs of current and future generations.
The time has come for the U.S. to move forward on behalf of the health and
economic security of current and future generations. We have the benefit of multiple
examples of international strategies as well as care systems in the U.S. that achieve high
quality/lower cost. We can learn from diverse international experiences as nations
innovate to meet current and future needs for accessible, high quality, and efficient care.
By enacting national reforms that take strategic steps to put the United States on a path to
a high performance system, there is the opportunity to reap a high return for the health of
the population and the economy.

U.S. HEALTH REFORMS TO IMPROVE ACCESS, OUTCOMES AND VALUE:
INTERNATIONAL INSIGHTS AND INNOVATIVE POLICIES
Cathy Schoen
The Commonwealth Fund
Thank you, Mr. Chairman and members of the Committee, for the invitation to
testify regarding insights for the U.S. from international experiences in reforming their
health care systems to improve access, outcomes and value for their populations. As the
United States confronts the urgent need for federal action to expand and improve access
and to slow the increase in health care costs for families, employers, and the public
sector, we might well ask how other countries insure everyone, achieve outcomes that
rival or exceed those in the U.S, yet spend far less than we do. The U.S. stands out among
wealthy, industrialized nations for: our failure to cover everyone; our expensive,
complex, and inefficient insurance system; our fragmented healthcare delivery systems
with a weak primary care foundation; lack of information; and for incentives to increase
volume irrespective of quality or outcomes. We have opportunities to learn from
international strategies and reforms as countries adopt innovative policies to improve
performance, incorporate incentives to enhance value, and harness markets and
competition in the public interest.
Today, I’d like to review what we know about the U.S. health system compared to
that of other countries, and then highlight policies and examples of recent innovations
that address concerns central to U.S. health reforms. Policies and practices as well as
strategic approaches draw from Denmark, France, Germany, the Netherlands, and the
United Kingdom. Recent reforms in these countries plus innovative practices illustrate a
variety of approaches to address the challenge of simultaneously achieving better access,
higher quality, and greater efficiency.
The U.S. Is the Only Major Industrialized Country Without Universal Coverage
and Spends Far More Without Commensurate Return in Value
Currently, 46 million Americans are uninsured and at least 75 million adults and
children are without coverage at some time during the year.1,2 If trends continue, we
could see 61 million uninsured by 2020 (Figure 1).3 Twenty-five million more are under-
insured – their insurance leaves them exposed to high medical care costs compared to
their incomes if sick.4 An estimated 42 percent of all adults under-65 were either
uninsured or underinsured in 2007, before the start of the recession. Insurance is

becoming ever-less affordable as premiums have doubled while incomes have stagnated:
premiums are up by 108 percent since 2000 compared to a 32 percent increase in
worker’s wages and 24 percent increase in general inflation (Figure 2). The steady rise in
health insurance costs has occurred despite a marked increase in cost-sharing. Rising
costs directly contribute to eroding coverage and stress business, federal and state/local
government budgets. With coverage eroding even for those with insurance, 72 million
adults ages 18 to 64 face problems paying medical bills or are paying off past medical
debt – including a sharp increase among middle class families.5
Such concerns are “made in America” – virtually all other high income, advanced
industrialized countries have adopted insurance policies that assure coverage for the
entire population, access to care, and financial protection, with an emphasis on protecting
those vulnerable due to poor health or low incomes. They do so at far lower costs with
outcomes that are often comparable or better than those in the U.S.
The U.S. leads the world in health spending with costs projected to continue to
rise far faster than incomes over the next decade if trends continue. Health care spending
already consumes 17 percent of the nation’s resources (gross domestic product) at $2.5
trillion or $7,290 per person. Health spending as a percent of our Gross Domestic Product
will likely reach 21 percent by 2020 if trends continue.6 Compared to other industrialized
countries, we spend about twice as much per person and 50 percent to double the share of
national resources (GDP) (Figure 3). As a share of resources, we spend 50 percent to
twice as much as other countries and the gap has been widening since 1980 – particularly
in the past five years.7 Relatively higher-cost countries such as Germany and Canada
have moderated their growth relative to incomes and countries with lower spending such
as the U.K. have increased outlays as a matter of deliberate public policy.
With such a high investment, we should expect to lead on health outcome and
care experiences. Yet we fall short of reaching achievable benchmarks for access, quality,
or efficiency.8,9 Indeed, on some key indicators we are falling behind as other countries
improve faster.10 The U.S. is now in last place, behind 18 other high-income countries on
mortality amenable to health care before age 75—in other words, deaths that are
potentially preventable with timely, effective health care or early efforts to screen and
prevent onset of disease.11 Although the U.S. death rates declined by 4 percent over five
years (1997–1998 to 2002–2003), other countries achieved much faster declines,
averaging 16 percent over the same period (Figure 4). The difference between the U.S.
and the countries with the lowest mortality rates amounts to 100,000 premature,

potentially preventable deaths each year. Within the U.S., mortality rates from conditions
amenable to healthcare – such as diabetes - are higher in states with high uninsured rates,
high rates of readmissions to hospitals, and low levels of preventive care.12 Our infant
mortality rates are high and our healthy life expectancy low by international standards.13
U.S. adults are also more likely to report medical errors, duplicative tests, and care
coordination gaps and to lack rapid access to primary care or care after-hours. The
contrasts indicate the U.S. could improve health and healthy lives with insurance reforms,
a stronger emphasis on prevention and primary care, and health care delivery system
reforms. 14
All advanced industrialized countries face rising costs from technological change,
including costly new pharmaceutical products, and aging populations with often complex
chronic disease. Indeed, the population in most European countries already has the age
distribution that the U.S. will experience in twenty years. Nor is the difference in
spending attributable to rationing care or shortages of physicians. In fact, the U.S. has
lower rates of hospitalization and shorter hospital stays than most other countries and
fewer visits to physicians each year.15
Physician to population ratios in the U.S. are also similar or lower than in other
countries. At the same time, more of U.S. physicians are specialists and subspecialists. 16
Research both within the US and across countries has shown that health care spending is
higher and health outcomes worse when there is a lower ratio of primary care to specialist
physicians and weak, less accessible primary care foundation.17
The resulting fragmented, highly specialized U.S. care system generates poorly
coordinated care that puts patients at risk and wastes resources. U.S. payment incentives
reward doing more irrespective of health benefits or costs – a recipe for increased
spending without high value in return. The fractured U.S. health insurance system further
erodes performance and undermines efforts to move in a new direction.
The U.S. stands out among other countries in our failure to insure everyone, with
benefits that assure access and financial protection. Those with insurance increasingly
face high cost-sharing or limits that leave them at risk. The fractured insurance system
and benefit designs together undermine health system performance by erecting cost
barriers to timely, effective care and weakening primary care. Half of chronically ill U.S.
adults report not getting needed care because of costs – a rate far higher than in other
countries (Figure 5). And sicker patients in the U.S. are far more likely to report high out

of pocket costs – whether insured or uninsured (Figure 6).18 Forty-two percent of
chronically ill U.S. adults who were insured all years went without needed care because
of cost. Among all U.S. adults, 30 percent of insured and 34 percent of the uninsured
spent more than $1,000 for the year in 2007 – much higher than any other country. 19
In addition to the failure to guarantee financial access to care, the organization of
care in the US also fails to ensure accessible and coordinated care. The U.S. stands out
for patients who report either having no regular doctor or having been with their
physician for a short period of time.20 This in part reflects high churning in and out of
health plans: one third (32%) of U.S. adults changed plans in the past three years and 14
percent did so more than once in a 2007 cross-national survey. U.S. job-linked coverage
plus managed care plans with restricted networks exacerbate poor continuity of care, as
patients may need to change physicians when they change jobs or their employers change
coverage.
Keys to Reform: Lessons from the International Experience
The key questions confronting U.S. national reforms are how to expand coverage
to everyone and slow the growth in health care costs while maintaining or improving the
quality of care. Looking at other countries it is clear that each has developed and
continues to develop its own approach, with policies and health systems evolving from
their unique histories and institutions. Similarly, U.S. will need to craft policies and adapt
changes that fit our history, institutions, and values. Still, we can learn from values and
strategies that cut across diverse countries and from examples of incentives, policies and
practices that contribute to higher performance. The international experience provides
insight regarding the potential direction and effectiveness for U.S. insurance, payment,
and delivery systems reforms.
Payment Policies: Prices, Purchasing Power, Information, and Incentives
In comparing the U.S. to other countries, in addition to insurance gaps, we are
notable for paying higher prices, including very high prices for more specialized care,
and for incentives to do more irrespective of value. Unlike other countries with multiple-
payers and competing insurers – such as Germany, Switzerland and the Netherlands - –
we lack a mechanism to coordinate payment policies to achieve coherent price signals or
to use group purchasing power to move in the same direction. In more monopolized

markets, U.S. private insurers often act as price-takers to maintain networks and pass-
through higher prices, with a mark-up for marketing, administrative costs, and margins.
As a result, the U.S. tends to pay higher prices for specialized services, including
prescription drugs – particularly brand name drugs without generic options.21 Studies
indicate that U.S. higher prices plus a more expensive mix of prescription medications
have contributed to rapid increases and higher U.S. spending per person than in other
countries over the past decade (Figure 7). Although the U.S. started out in 1995 near
other country spending levels on prescription drugs per capita, by 2007 it was far higher
than the next highest country.
Advances in medical treatments and technology, including medications, confront
all countries with upward pressures on costs. Other countries have responded by using
group purchasing power and reference prices to moderate increases, particularly where
alternatives exist (Figure 8). A recent McKinsey study found the U.S. pays 50 percent
more for comparable drugs and pays for a more expensive mix of drugs than do other
developed countries leading to total costs that are twice as high as expected – amounting
to some $98 billion per year.22 Other country governments typically either negotiate on
behalf of all residents to achieve lower prices or use “reference” pricing differentials in
insurance designs to drive the market to lower prices.23,24 The U.S. also tends to pay
specialists more and to pay more for surgical devices such as hip and knee prostheses.25
Increasingly, other countries are assessing the comparative information on clinical
effectiveness and costs to inform insurance benefit designs to provide incentives for
markets to work while assuring access. For example, France covers prescription drugs at
multiple cost-sharing levels, with the lowest tier for highly effective medications
including expensive drugs if these are the only options (Figure 9). Germany and Denmark
use reference pricing where multiple medications exist in a class – with full coverage at
the reference price.26 This practice has helped gain lower prices from manufacturers, with
regular updates. In the U.S., private insurers regularly use formularies and vary cost-
sharing without disclosing the rationale or underlying prices. However, other countries
with independent comparative assessment centers share information with all insurers and
make assessments publicly available to physicians and patients, with regular updates.27
Countries with multi-payers, such as Germany, the Netherlands, and Switzerland
have also established multi-payer mechanisms for paying for care that allow more
coherent policies changes over time. These policies also make it possible to ask what the

price is or the total cost of care for patients and providers. Such information is essential
for markets to function. In contrast, prices in the U.S. vary for the same service in the
same community by insurer and by hospital with little rational relationship to resource
costs or value and outcomes. Using several state examples, one observer notes the result
in the U.S. is “chaos” behind a veil of secrecy. 28
Primary Care: Payment, Incentives and Infrastructure
Overall, the U.S. stands out for a weak primary care foundation with poor care
coordination.29 Studies indicate that this undermines timely access, preventive care, and
control of chronic conditions and contributes to avoidable use of emergency rooms or
hospital admissions/readmissions from preventable complications. The contrasts reflect
insurance and payment policies, including the relative value placed on primary care,
prevention and promoting health rather than treating disease.
Most strikingly, other countries have insurance systems that promote continuity
and provide choice of all primary care practices in the community. Many encourage or
require patients to identify a “medical home” which is their principal source of primary
care responsible for coordinating specialist care when needed. When asked whether they
would value having a central source of care that knows them and helps coordinate care,
U.S. adults’ responses are similar to views in other countries – with 80 percent saying
having such a relationship is very important (Figure 10).
Country differences in care arrangements and the relative undersupply of primary
care physicians show up in patterns of care. Along with Canada which also faces primary
care concerns, U.S. adults are less likely to report same or next day access to their
physicians when sick and more likely to seek care in emergency rooms (Figure 11). Only
one fourth of U.S. and Canadian chronically ill adults said they saw their doctor the same
day the last time they needed medical attention, compared with nearly half or more in the
U.K., New Zealand, and the Netherlands. In contrast, the U.S. has comparatively shorter
waiting times for elective surgery or specialists than some other countries, although
German and Dutch adults also report rapid access to specialized care in recent surveys.30
U.S. adults are also more likely than those in several other countries to find it
difficult to get care on nights and weekends without going to the emergency room. Forty
percent of U.S. adults say getting such care is very difficult compared to less than one in

five in several other countries (Figure 12). In the U.S., 59 percent of adults reported
going to the ER during the year, often several times.
The contrast with the Netherlands is notable. Just 15 percent of Dutch say it is
difficult to get care after-hours without going to the emergency room and Dutch ER use
is relatively low. In a 2006 survey of primary care physicians, only 40 percent of US
physicians say that have an arrangement for after-hours care, compared with nearly all
primary care physicians in the Netherlands (Figure 13). The sharp differences reflect
Dutch payment policies that emphasize primary care plus recent initiatives that
established after-hour cooperatives to provide round-the-clock access.31
U.S. patients face a fragmented health care system with often poor care
coordination. More things can go wrong when care is provided by multiple parties and
poorly coordinated. In a 2008 survey of chronically ill patients in eight countries, U.S.
adults were more likely to report medical errors – particularly errors related to incorrect
lab and diagnostic tests and delays in hearing about abnormal results (Figure 14). They
were also more likely to report duplicative tests and records and test results not available
at the time of their appointments.32 In a separate survey, nearly half (47%) of U.S. adults
reported one of five experiences in the prior two years: their physician ordered a test that
had already been done; their physicians failed to provide important medical information
or test results to other doctors or nurses involved in their care; or they did not hear about
results of diagnostic tests (Figure 15).33
The weak U.S. primary care foundation reflects the way we insure and pay for
care as well as the way we organize care. A rich array of international policies and
reforms aim to strengthen and transform primary care and improve care for those with
chronic disease.
Most fundamentally, other countries make primary care financially and physically
accessible to their residents. Insurance designs emphasize coverage for primary care with
low or no cost-sharing for preventive care and essential medications for chronic illness.
In countries with cost-sharing at the point of care, insurance designs typically limit or cap
total cost exposure. France lowers or eliminates cost-sharing for those with low-income,
the disabled, and for specific chronic, severe illnesses – especially for chronic care
treatment plans. Germany limits cost sharing to 2 percent of income for the general
population and 1 percent for those with chronic conditions (Figure 16). Denmark and
France lower cost-sharing for very effective yet expensive drugs. In effect, these policies

strive for value-based benefit designs to ensure access and provide incentives for
essential effective care.
Many countries, including the Netherlands, Denmark, and the U.K., encourage or
require patients to identify a “medical home” which is their principal source of primary
care responsible for coordinating specialist care when needed. Similar to the U.S.,
Germany and France have historically operated with care systems with self-referrals to
specialists. To encourage stronger relationships with primary care and enable new
payments for primary care practices with accountability, France and Germany have
recently introduced incentives for both patients and physicians. French and German
patients opting to designate a primary care source to coordinate care face lower cost-
sharing when they need more specialized care and their physicians receive extra
payments.34
The U.S. relies on market incentives to shape its health care system, yet other
countries are more advanced in providing financial incentives to primary care physicians
targeted on quality of care. Only 30 percent of U.S. primary care physicians report having
the potential to receive financial incentives targeted on quality of care, including potential
to receive payment for: clinical care targets, high patient ratings, managing chronic
disease/complex needs, preventive care, or quality improvement activities (Figure 17). In
contrast, nearly all primary care physicians in the UK and over 70 percent in Australia
and New Zealand report such incentives.
The high rates in the U.K and other countries reflect direct incentives as well as
supplemental support for primary care practices. The UK General Practitioner contract in
April 1, 2004 provided bonuses to primary care physicians for reaching quality targets,
including improved outcomes for chronic disease (Figure 18). Follow-up studies indicate
that financial incentives change physician behavior and support improvement.35 36
Incentives and targeted support for primary care in the Netherlands include extra
payments to add nurses to care teams, payment for email consults, and enhanced visit
payments for after-hours care. Recent Dutch national reforms blend capitation, fees for
consultations, and encourage payments for performance.
The Maastricht Transmural Diabetes Organization in the Netherlands also started
a program that offers financial incentives to both GPs and patients to participate in a

system of chronic care designed to improve coordination of care and appropriate
provision. In 2006 this was adapted to a number of disease management pilots.
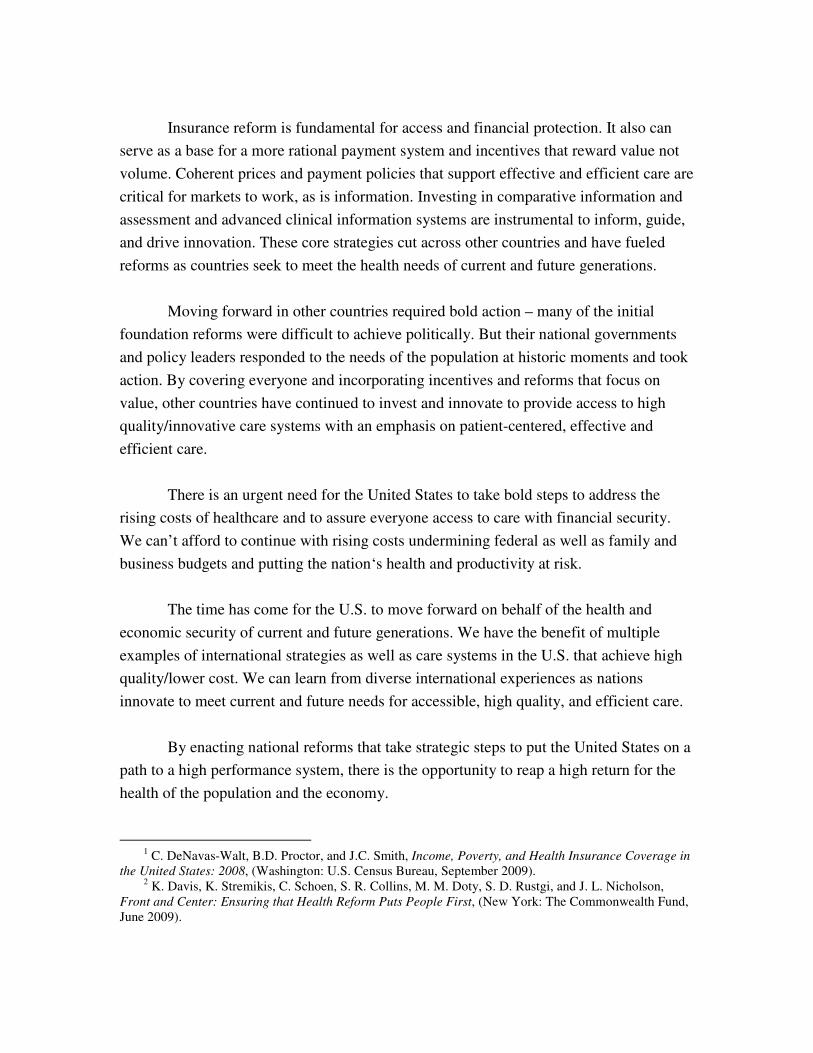
In 2000 reforms, Germany launched disease management programs and clinical
guidelines for chronic care, with financial incentives from insurance funds to develop and
enroll patients and be held accountable for care. Providers receive financial incentives for
enrolling patients and for offering chronic care services such as patient self-management
education. Early results show positive effects on quality (Figure 19) .37 Germany is also
experimenting with an all-inclusive global fee for payment of care of cancer patients in
Cologne.
In addition to a blend of capitation and consultation fees (including fees for email
consults), Denmark and the Netherlands have initiated after-hours cooperatives that take
over for primary care physicians at nights and weekends. These cooperatives rely on
community physicians and nurses to provide off-hours service. A patient’s personal
physician receives a record of care and contact the next day. Although the Danish and
Dutch systems work differently, both are integrated with community practices to provide
24-7 access to advice and care. The Dutch cooperatives are recent, set up by national
legislation in 2000/2003 (Figure 20).38 The U.K. and several other countries are also
looking to urgent care centers with efforts to link care through information systems.39
Several countries also pay physicians in a way that narrows the spread between
primary care physician and specialists’ income, especially compared to the widening gaps
in the United States. Denmark may be the extreme in seeking roughly similar net income
levels. Danish specialists are salaried and employed by hospitals; primary care physicians
own their own practices.
Countries, with strong primary care foundations such as the Netherlands and
Denmark tend to pay for care on a per patient basis with primary care physicians serving
as gateways for referrals to more specialized care. These countries, as well as countries
that have traditionally paid on a fee-for-service basis, are increasingly moving toward a
mixed payment method that includes a per-patient monthly allotment for providing
access, coordination, teams and serving as a “medical home” and fees for visits or
incentives for quality.
These and other payment innovations and infrastructure efforts increase the
attractiveness of primary care practice to medical students and support a focus on

prevention and population health. In contrast the U.S. tends to pay mainly for visits or
procedures and fails to pay in a way that supports teams, 24 hour access, and spending
time with patients or coordinating care. Without payment reforms and incentives to
strengthen and transform primary care, the U.S. health system is at risk of further
weakening an already fragile community care system. Medical students are increasingly
choosing to specialize, deterred by the hours, multiple demands and relatively lower pay
of primary care.40
Information Systems to Inform, Guide and Drive Innovation
U.S. physicians are highly trained, and U.S. hospitals are well-equipped compared
with hospitals in other countries.41 Similar to the U.S., many other countries operate with
small physician practices and an organizational divide across sites of care. In fact, fully
integrated care systems rare. To bridge the divide and support clinicians, other countries
have invested to spread the adoption and use of electronic health information technology,
with the capacity for information exchange. As of 2006, one-fourth of U.S. primary care
physician report use of electronic medical records – compared with over nine in ten
primary care physicians in the Netherlands, New Zealand, and the U.K. Primary care
physicians in other countries also increasingly have an array of functionality, as countries
build on capacity. When assessed against 14 different functions of advanced information
capacity (EMR, EMR access to other doctors, access outside office, access by patient;
routine use electronic ordering tests, electronic prescriptions, electronic access to test
results, electronic access to hospital records; computerized reminders; Rx alerts; prompt
tests results; easy to list diagnosis, medications, patients due for care), one in five US
primary care physicians reported having at least 7 out of the 14 functions compared to 60
percent to a high of ninety percent of physicians in the Netherlands, Australia, the U.K.,
and New Zealand (Figure 21). The wide differences reflect national efforts to standardize
and promote use, often with financial incentives.
An assessment of information systems in ten countries ranks Denmark at the top,
and concludes that countries with a single unifying organization setting standards and
responsible for serving as an information repository have the highest rates of information
system functionality.42 Danish physicians, whether seeing patients through the off-hours
service or during regular hours, are supported by a nationwide health information
exchange, with a health information exchange portal supported by government funds and
standards set by a nonprofit organization MedCom (Figure 22). The portal is a repository
of electronic prescriptions, lab and imaging orders and test results, specialist consult

reports, and hospital discharge letters, accessible to patients, and authorized physicians
and home health nurses. It captures 87% of all prescription orders; 88% of hospital
discharge letters; 98% of lab orders; and 60% of specialist referrals. Denmark is rated as
one of the best countries on primary care as measured by high levels of first contact
accessibility, patient-focused care over time, a comprehensive package of services, and
coordination of services when services have to be provided elsewhere.43
All Danish primary care physicians (except a few near retirement) are required to
have an electronic medical record system, and 98 percent do. Danish physicians are paid
about $8 for e-mail consultations with patients, a service that is growing rapidly. The
easy accessibility of physician advice by phone or e-mail, and electronic systems for
prescriptions and refills cut down markedly on both physician time and patient time.
Primary care physicians save an estimated 50 minutes a day from information systems
that simplify their tasks, a return that easily justifies their investment in a practice
information technology system (Figure 23).44
Comparative Information and Transparency
In addition to assessing clinical effectiveness to inform clinical decisions and
benefit designs, several countries are developing rich comparative information systems
on performance. Germany’s national hospital quality benchmarking provides real-time
quality information on all 2,000 German hospitals with over 300 quality indicators for 26
conditions (Figure 24). Peers visit hospitals whose quality is substandard, and enter into
a “dialogue” about why that is the case. Typically within a few years all hospitals come
up to high standards.
The Netherlands and the U.K. are also investing in transparency in reporting
quality data, including patient experiences. In both countries, this information is posted
on public-websites as well as fed-back to clinicians (Figure 25). The U.K. publishes
extensive information on hospital quality and surgical results by hospital and surgeon.
These countries emphasize choice and look to competition as well as
collaboration to improve. The combination of payment incentives focused on value,
information, group purchasing power, and insurance that includes the entire population
are systemic policies that seek to make markets work in the public interest.
Insurance-Related Administrative Costs

The complex and fragmented U.S. insurance system makes it difficult to
orchestrate such payer cohesion. As currently structured, the U.S. insurance system also
generates high insurance-related administrative and overhead costs – for insurers and for
doctors and hospitals. On a per person basis, the U.S. spends more than twice as much for
the net costs of insurance administration (Figure 26). Varying benefit designs, marketing
costs, churning in and out of coverage, underwriting, and insurance profit margins also
contribute to higher overhead costs. In the Netherlands or Switzerland, countries that
operate with multiple, competing private insurance plans, insurers average about 5
percent of premiums for overhead and margins compared to an average 15 percent or
more in the United States.45
Studies of U.S. administrative costs related to insurance for providers indicate that
insurance complexity is also taking a toll on time and resources and driving up costs for
medical practices. Recent studies estimate physician practices spend $31 billion—the
equivalent of 10 to 12 percent of total practice revenue—on billing and insurance-related
administrative costs, which include 3 weeks a year of physician time per practitioner
(Figure 27).46 Hospitals spend 6 to 10 percent on just these two items of insurance-related
administrative activities. If standardization could cut such insurance-related overhead in
half, there would be $15 to $20 billion in savings per year for physicians and $25 to $40
billion in savings per year for hospitals.47 The recent McKinsey study estimates such
complexity – including multiple reporting requirements - accounts for some $90 billion
per year in excess costs.48
Other countries with competing insurers – Germany, the Netherlands and
Switzerland - have enacted market reforms, including more standardized benefit designs
and prohibition on health-risk rating to focus insurer competition on total costs and
quality – rather than risk segmentation. The much lower costs reflect simpler design and
insurance market mechanisms that make it easy to compare and choose among competing
options. All three countries define national core benefits, with insurance designs that
assure financial protection. All require insurers to accept everyone and prohibit premium
variations based on health risks. Each has adopted a form of risk-adjustment to avoid
penalizing a plan with a reputation for high quality and positive outcomes for sicker
patients. In the Netherlands, for example, the risk-fund mechanism pays a plan more if it
attracts older, chronically ill, or otherwise high health risk beneficiaries. The risk
adjustment can be substantial. (Figure 28).

Each of these countries operates a type of insurance “exchange” with a choice of
plans. National policies provide market oversight and transparent posting of benefits and
premiums that facilitate choice. By simplifying benefit designs and precluding
underwriting for health risks, these countries operate with much lower insurance
marketing, underwriting and related administrative costs than in the U.S. In Germany
insurance cards, for example, are bar coded – making it easy to track cost-sharing and
facilitating payment to providers.
Conclusion
We have the world’s costliest health system yet fail to provide everyone with
access to care—and fall far short of what should be possible with the U.S. health
workforce and medical care resources. The good news is there is ample room to improve
and we have international as well as internal examples that yield equivalent or better
outcomes, better experiences for lower costs.49
Several core strategies span diverse countries, although each country has evolved
its own approach. These include:
• Coverage for Everyone: An Explicit National Goal and Shared Value
o Insurance designs emphasize access, financial protection and value
o Insurance provides foundation for payment and system reforms
• Payment policies that emphasize value and use group-purchasing power, and
promote primary care, prevention and effective care of chronic disease,
• System reforms to harness markets and competition in the public interest and
provide information to spur improvement performance and innovation
o Market rules focus competition on quality and efficiency
o In multi-payer systems, joint efforts to move in the same direction
o Information systems to inform, guide, and drive change and innovation
• Leadership, goals and targets
o In countries with multiple payers and competing insurers, this includes
provisions for public and private participation
These strategies are strikingly similar to key strategies identified by the
Commonwealth Fund’s Commission on a High Performance Health System in their call
to action and vision of concrete policies that could move the United States in a new, more
positive direction.50,51
Insurance reform is fundamental for access and financial protection. It also can
serve as a base for a more rational payment system and incentives that reward value not
volume. Coherent prices and payment policies that support effective and efficient care are
critical for markets to work, as is information. Investing in comparative information and
assessment and advanced clinical information systems are instrumental to inform, guide,
and drive innovation. These core strategies cut across other countries and have fueled
reforms as countries seek to meet the health needs of current and future generations.
Moving forward in other countries required bold action – many of the initial
foundation reforms were difficult to achieve politically. But their national governments
and policy leaders responded to the needs of the population at historic moments and took
action. By covering everyone and incorporating incentives and reforms that focus on
value, other countries have continued to invest and innovate to provide access to high
quality/innovative care systems with an emphasis on patient-centered, effective and
efficient care.
There is an urgent need for the United States to take bold steps to address the
rising costs of healthcare and to assure everyone access to care with financial security.
We can’t afford to continue with rising costs undermining federal as well as family and
business budgets and putting the nation‘s health and productivity at risk.
The time has come for the U.S. to move forward on behalf of the health and
economic security of current and future generations. We have the benefit of multiple
examples of international strategies as well as care systems in the U.S. that achieve high
quality/lower cost. We can learn from diverse international experiences as nations
innovate to meet current and future needs for accessible, high quality, and efficient care.
By enacting national reforms that take strategic steps to put the United States on a
path to a high performance system, there is the opportunity to reap a high return for the
health of the population and the economy.
1 C. DeNavas-Walt, B.D. Proctor, and J.C. Smith, Income, Poverty, and Health Insurance Coverage in
the United States: 2008, (Washington: U.S. Census Bureau, September 2009). 2 K. Davis, K. Stremikis, C. Schoen, S. R. Collins, M. M. Doty, S. D. Rustgi, and J. L. Nicholson,
Front and Center: Ensuring that Health Reform Puts People First, (New York: The Commonwealth Fund, June 2009).

3 The Commonwealth Fund Commission on a High Performance Health System, The Path to a High
Performance U.S. Health System: A 2020 Vision and the Policies to Pave the Way, (New York: The Commonwealth Fund, February 2009).
4 C. Schoen, S.R. Collins, J.L. Kriss, and M.M. Doty, “How Many Are Underinsured? Trends Among U.S. Adults, 2003 and 2007,” Health Affairs Web Exclusive, June 10, 2008:w298–w309.
5 S. R. Collins, J. L. Kriss, M. M. Doty, and S. D. Rustgi, Losing Ground: How the Loss of Adequate
Health Insurance Is Burdening Working Families: Findings from the Commonwealth Fund Biennial Health
Insurance Surveys, 2001–2007 (New York: The Commonwealth Fund, August 2008). 6 The Commonwealth Fund Commission on a High Performance Health System, The Path to a High
Performance U.S. Health System, Ibid. 7 Data from OECD 2009. 8 Commonwealth Fund Commission on a High Performance Health System, Why Not the Best?
Results from the National Scorecard on U.S. Health System Performance, 2008 (New York: The Commonwealth Fund, July 2008).
9 P.S. Hussey, G.F. Anderson, R. Osborn et al., “How Does the Quality of Care Compare in Five Countries?” Health Affairs, May/June 2004, 23(3):89-99; C. Schoen, R. Osborn, P.T. Huynh, M. Doty, J. Peugh, and K. Zapert, “On the Front Lines of Care: Primary Care Doctors’ Office Systems, Experiences, and Views in Seven Countries,” Health Affairs Web Exclusive (Nov. 2, 2006):w555-w571; C. Schoen, R. Osborn, M. Doty, et al. “Toward Higher-Performance Health Systems: Adults’ Health Care Experiences in Seven Countries, 2007,” Health Affairs Web Exclusive (Oct. 31, 2007):w717-w734; C. Schoen, R. Osborn, S. K. H. How, M. Doty, J. Peugh, “In Chronic Condition: Experiences of Patients with Complex Health Care Needs, in Eight Countries, 2008,” Health Affairs Web Exclusive (Nov. 13, 2008):w1-w16.
10 E. Nolte and C. M. McKee, “Measuring the Health of Nations: Updating an Earlier Analysis,” Health Affairs, Jan/Feb 2008, 27(1):58–71; E. Nolte, C. Bain, and M. McKee, “Diabetes as a Tracer Condition in International Benchmarking of Health Systems,” Diabetes Care, May 2006, 29(5):1007-11.
11 E. Nolte and C. M. McKee, “Measuring the Health of Nations,” Ibid. 12 J.C. Cantor, C. Schoen, D. Belloff, S.K.H. How, and D. McCarthy, Aiming Higher: Results from a
State Scorecard on Health System Performance, (New York: The Commonwealth Fund, June 2007); D. McCarthy, S.K.H. How, C. Schoen, J.C. Cantor, and D. Belloff, Aiming Higher: Results from the 2009
State Scorecard on Health System Performance, (New York: The Commonwealth Fund, forthcoming 2009).
13 Commonwealth Fund Commission on a High Performance Health System, Why Not the Best?
Results from the National Scorecard on U.S. Health System Performance, 2008 (New York: The Commonwealth Fund, July 2008).
14 C. Schoen, R. Osborn, S.K.H. How, M.M. Doty, and J. Peugh, “In Chronic Condition: Experiences
of Patients with Complex Health Care Needs, in Eight Countries, 2008,” Health Affairs Web Exclusive, Nov. 13, 2008, w1-w16. 15 G. F. Anderson and B. K. Frogner, Health Spending in OECD Countries: Obtaining Value per Dollar, Health Affairs, November/December 2008 27(6):1718–27
16 G. Anderson and P. Markovich, Multinational Comparisons of Health Systems Data, 2008 (New York, NY: The Commonwealth Fund, Nov. 2008).
17 J. S. Skinner, D. O. Staiger, and E. S. Fisher, “Is Technological Change in Medicine Always Worth It? The Case of Acute Myocardial Infarction,” Health Affairs Web Exclusive, Feb. 7, 2006, w34–w47.; B. Starfield, L. Shi, and J. Macinko, “Contribution of Primary Care to Health Systems and Health,” The
Milbank Quarterly, 2005 83(3):457–502. 18 C. Schoen et al., “In Chronic Condition,” Ibid. 19 C. Schoen, R. Osborn, M. M. Doty, M. Bishop, J. Peugh, and N. Murukutla, “Toward Higher-
Performance Health Systems: Adults' Health Care Experiences in Seven Countries, 2007,” Health Affairs Web Exclusive, Oct. 31, 2007, 26(6):w717–w734.
20 C. Schoen, R. Osborn, M. M. Doty, M. Bishop, J. Peugh, and N. Murukutla, “Toward Higher-Performance Health Systems: Adults' Health Care Experiences in Seven Countries, 2007,” Health Affairs Web Exclusive, Oct. 31, 2007, 26(6):w717–w734.
21 P.M. Danzon and M.F. Furukawa, “International Prices And Availability Of Pharmaceuticals In 2005,” Health Affairs, Jan./Feb. 2008, 27(1): 221-233.

22 G. F. Anderson et al., “Doughnut Holes and Price Controls,” Health Affairs Web Exclusive (July 21,
2004):w396–w404; Gerard Anderson et al., “It’s the Prices, Stupid: Why the United States is So Different from Other Countries,” Health Affairs, May/June 2003, 22(3):89-105.
23 McKinsey Global Institute, Accounting for the Costs of U.S. Health Care: A New Look at Why
Americans Spend More, (New York: McKinsey Global Institute, Nov. 2008). 24 Corrina Sorenson, Caroline Mudsisill, Elias Mossialos and Sherry Glied, et al. Pharmaceutical
Pricing and Coverage in Seven European Nations: Policy Levers and Mechanisms, Working Paper November 12-14, 2008 prepared for the 2008 Commonwealth Fund International Symposium on Health Care Policy.
25 Leif Wellington Haase, The Century Foundation, presentation at Outpatient Outlook 2007:The
Future of Healthcare on “Health Care Reform and Outpatient Care,” March 13, 2007. In 2004, U.S. payments for hip and knee implants were 50 percent to 200 percent higher than in Germany, France, Italy, and the U.K. Data based on Millennium Research, Bernstein Research, and MGI analysis.
26 For brief description of Germany see T. Cheng and U. Reinhardt, “Shepherding major Health Systems Reforms: A Conversation with German Health Minister Ulla Schmidt,” Health Affairs, April 8, 2008.
27 S. Thomson and E. Mossialos, Primary Care and Prescription Drugs: Coverage, Cost Sharing, and
Financial Protection in Six European Countries, (New York: The Commonwealth Fund, forthcoming 2009); C. Sorenson, The Use of Comparative Effectiveness Research for Evidence-Based Policy and Value
for Money: A Six-Country Comparison of Drug Coverage and Pricing Decisions, (New York: The Commonwealth Fund, forthcoming 2009).
28 U. E. Reinhardt, “The Pricing of U.S. Hospital Services: Chaos Behind a Veil of Secrecy,” Health
Affairs, January/February 2006; 25(1): 57-69. 29 B. Starfield, L. Shi, and J. Macinko, “Contribution of Primary Care to Health Systems and Health,”
Milbank Quarterly 2005; 83(3): 457-502.. 30 C. Schoen et al., “Toward Higher-Performance Health Systems,” Ibid.; C. Schoen et al., “In Chronic
Condition,” Ibid. 31 R. Grol et al. “After-hours Care in the U.K., the Netherlands and Denmark: New Models,” Health
Affairs, Nov/Dec. 2006, 25(6): 1733-1737. 32 C. Schoen et al., “Taking the Pulse of Health Care Systems: Experiences of Patients with Health
Problems in Six Countries,” Health Affairs Web Exclusive, Nov. 3, 2005, w509-525. 33 S.K.H. How, A. Shih, J. Lau, and C. Schoen, Public Views on U.S. Health System Organization: A
Call for New Directions, (New York: The Commonwealth Fund, Aug. 2008). 34 S. Thomson and E. Mossialos, Primary Care and Prescription Drugs, Ibid.; C. Schoen et al.,
“Focus on Health System Foundations: Primary Care Physician Experiences and Perspectives in Eleven Countries, 2009,” Health Affairs, forthcoming 2009.
35 T. Doran, C. Fullwood, H. Gravelle, D. Reeves, E. Kontopantelis, U. Hiroeh, and M. Roland, “Pay-for-Performance Programs in Family Practices in the United Kingdom,” New Engl J Med, 2006 355(4):375-384
36 S. Campbell, et al. “Effects of Pay for Performance on Quality of Primary Care in England,” N Engl
J Med, 2009: 361: 368-378. 37 Michael Hallek, “Typical problems and recent reform strategies in German health care - with
emphasis on the treatment of cancer,” Presentation to the Commonwealth Fund International Symposium, November 2, 2006.
38 R. Grol et al. “After-hours Care in the U.K., the Netherlands and Denmark,” Ibid. 39 C. Schoen et al., “Taking the Pulse of Health Care Systems: Experiences of Patients with Health
Problems in Six Countries,” Health Affairs Web Exclusive, Nov. 3, 2005, 24 :w509-525; C. Schoen, R. Osborn, P.T. Huynh, M. Doty, J. Peugh, and K. Zapert, “On the Front Lines of Care: Primary Care Doctors’ Office Systems, Experiences, and Views in Seven Countries,” Health Affairs Web Exclusive, Nov. 2, 2006, w555-w571.
40 T. Bodenheimer, K. Grumbach, and R.A. Bereson, “A Lifeline for Primary Care,” N Engl J Med, June 2009, 360:2693.
41 C. Schoen et al., 2003 Commonwealth Fund International Health Policy Survey of Hospital
Executives, (New York: The Commonwealth Fund, September 2004); R.J. Blendon, C. Schoen, C.

DesRoches, R. Osborn, and K. Zapert, "Common Concerns Amid Diverse Systems: Health Care Experiences in Five Countries,” Health Affairs, May/June 2003, 22(3):106-21.
42 D. Protti, “A Comparison of Information Technology in General Practice in Ten Countries,” Presentation to the Commonwealth Fund International Symposium, November 3, 2006.
43 B. Starfield, “Why More Primary Care: Better Outcomes, Lower Costs, Greater Equity,” Presentation to the Primary Care Roundtable: Strengthening Adult Primary Care: Models and Policy Options, October 3, 2006.
44 I. Johansen, “What Makes a High Performance Health Care System and How Do We Get There? Denmark,” Presentation to the Commonwealth Fund International Symposium, November 3, 2006.
45 R.E. Leu, F.F.H. Rutten, W. Brouwer et al., The Swiss and Dutch Health Insurance Systems:
Universal Coverage and Regulated Competitive Insurance Markets, (New York: The Commonwealth Fund, January 2009).
46 L. Casalino et al. “What Does it Cost Physician Practices to Interact with Health Insurance Plans?” Health Affairs, July/Aug. 2009, 28(4):w533-w543; J. Sakowski, et al. “Peering into the Black Box: Billing and Insurance Activities in a Medical Group,” Health Affairs, July/Aug. 2009, 28(4):w544-w554; and J. Kahn et al. “The Cost of Health Insurance Administration in California: Estimates for Insurers, Physicians and Hospitals,” Health Affairs, Nov./Dec. 2005, 24(6):1629-1639.
47 Authors’ estimate based on 2009 total hospital spending and physician practice estimates. C. Schoen, K. Davis, S. Guterman, and K. Stremikis, Fork In the Road: Alternative Paths to a High Performance U.S.
Health System, (New York: The Commonwealth Fund, June 2009). 48 McKinsey Global Institute, Accounting for the Costs of U.S. Health Care, Ibid. 49 Karen Davis et al., Room for Improvement: Patients Report on the Quality of Their Health Care.
(New York: The Commonwealth Fund, April 2002); K. Davis et al., Mirror, Mirror on the Wall: An
International Update on the Comparative Performance of American Health Care, (New York: The Commonwealth Fund, May 2007).
50 Commission on a High Performance Health System, A High Performance Health System for the
United States: An Ambitious Agenda for the Next President, (New York: The Commonwealth Fund, Nov. 2007).
51 The Commonwealth Fund Commission on a High Performance Health System, The Path to a High
Performance U.S. Health System, Ibid.

THE COMMONWEALTH
FUND
Figure 1. Health Insurance Coverage and Uninsured Trends
Data: Analysis of the U.S. Census Bureau, Current Population Survey Annual Social and Economic Supplement
2001–2009; projections to 2020 based on estimates by The Lewin Group.
Source: K. Davis, Changing Course: Trends in Health Insurance Coverage, 2000–2008, Hearing on "Income,
Poverty, and Health Insurance Coverage: Assessing Key Consensus Indicators of Family Well-Being in 2008," Joint
Economic Committee, U.S. House of Representatives, September 10, 2009.
Uninsured(15%) Employer
(59%)
Medicaid(14%)
Medicare(14%)
Total population
Military(4%)
Individual(9%)
38 4042 43 43 45
47 46 4648 49 50 52 53 55 56
6160595857
0
10
20
30
40
50
60
70
2000 2002 2004 2006 2008 2010 2012 2014 2016 2018 2020
Projected
Uninsured Projected to Rise to 61 million by 2020
Millions uninsured
46.3 Million Uninsured, 2008
THE COMMONWEALTH
FUND
Figure 2. Premiums Rising Faster Than Inflation and Wages
18%18% 19% 19%19% 20% 20% 21%21%22%23% 24%
22%
0%
5%
10%
15%
20%
25%
20
08
20
09
20
10
20
11
20
12
20
13
20
14
20
15
20
16
20
17
20
18
20
19
20
20
* 2008 and 2009 NHE projections.
Data: Calculations based on M. Hartman et al., “National Health Spending in 2007,” Health Affairs, Jan./Feb. 2009
and A. Sisko et al., “Health Spending Projections through 2018,” Health Affairs, March/April 2009. Premiums, CPI
and Workers’ earnings from Henry J. Kaiser Family Foundation/Health Research and Educational Trust, Employer
Health Benefits Annual Surveys, 2000–2009.
Source: K. Davis, Why Health Reform Must Counter the Rising Costs of Health Insurance Premiums, (New York:
The Commonwealth Fund, August 2009).
Projected Average Family Premium as
a Percentage of Median Family
Income, 2008–2020
0
25
50
75
100
125
2000 2001 2002 2003 2004 2005 2006 2007 2008* 2009*
Insurance premiums
Workers' earnings
Consumer Price Index
Cumulative Changes in Components of
U.S. National Health Expenditures and
Workers’ Earnings, 2000–2009
Percent Percent
108%
32%
24%

THE COMMONWEALTH
FUND
Figure 3. International Comparison of Spending on Health, 1980–2007
Data: OECD Health Data 2009 (July 2009).
0
1000
2000
3000
4000
5000
6000
7000
1980 1984 1988 1992 1996 2000 2004
United States
Canada
Netherlands
France
Germany
Australia
United Kingdom
Average spending on healthper capita ($US PPP)
0
2
4
6
8
10
12
14
16
1980 1984 1988 1992 1996 2000 2004
United States
France
Germany
Canada
Netherlands
Australia
United Kingdom
Total expenditures on healthas percent of GDP
THE COMMONWEALTH
FUND
7681
88 8489 89
99 9788
97
109 106116 115 113
130 134128
115
65 71 71 74 74 77 80 82 82 84 84 90 93 96 101 103 103 104 110
0
50
100
150
Fran
ceJa
pan
Aus
tral
iaSpa
in
Italy
Can
ada
Nor
way
Net
herla
nds
Sw
eden
Gre
ece
Aus
tria
Ger
man
yFi
nlan
dN
ew Z
eala
ndD
enm
ark
Uni
ted
Kin
gdom
Irel
and
Por
tuga
l
Uni
ted
Sta
tes
1997/98 2002/03
Deaths per 100,000 population *
* Countries’ age-standardized death rates before age 75; from conditions where timely effective care can make a
difference. Includes: Diabetes, asthma, ischemic heart disease, stroke, infections screenable cancer.
Data: E. Nolte and C. M. McKee, “Measuring the Health of Nations,” Health Affairs, Jan/Feb 2008).
Figure 4. Mortality Amenable to Health CareU.S. Rank Fell from 15 to Last out of 19 Countries
Source: The Commonwealth Fund Commission on a High Performance Health System, Why Not the Best? Results
from the National Scorecard on U.S. Health System Performance, 2008, (New York: The Commonwealth Fund, July
2008).

THE COMMONWEALTH
FUND
Figure 5. Cost-Related Access Problems Among the Chronically Ill, in Eight Countries, 2008
7
13
2325 26
31
36
54
0
20
40
60
NETH UK FR CAN GER NZ AUS US
Base: Adults with any chronic condition
Percent reported access problem due to cost in past two years*
* Due to cost, respondent did NOT: fill Rx or skipped doses, visit a doctor when had a medical problem, and/or get
recommended test, treatment, or follow-up.
Data: The Commonwealth Fund International Health Policy Survey of Sicker Adults (2008).
Source: C. Schoen et al., “In Chronic Condition: Experiences of Patients with Complex Healthcare Needs in Eight
Countries, 2008,” Health Affairs Web Exclusive, Nov. 13, 2008.
THE COMMONWEALTH
FUND
Figure 6. Out-of-Pocket Medical Costs in Past Year, 2008
48
13 1420
25
41
0
20
40
60
80
100
UK
NETH
GER N
ZCAN
AUS
US
81
72
6157 57
43
31
0
20
40
60
80
100
UK NETH NZ CAN GER AUS US
More than US $1,000 Under US $500
Base: Adults with any chronic condition
Percent
Data: 2008 Commonwealth Fund International Health Policy Survey of Sicker Adults
Source: C. Schoen et al., “In Chronic Condition: Experiences of Patients with Complex Healthcare Needs in Eight
Countries, 2008”, Health Affairs Web Exclusive, November 13, 2008.

THE COMMONWEALTH
FUND
Figure 7. Pharmaceutical Spending per Capita: 1995, 2007Adjusted for Differences in Cost of Living
$385
$319
$335
$317
$228
$210
$422
$431
$542
$588
$691
$878
$0 $200 $400 $600 $800 $1,000
US
CAN
FR
GER
AUS
NETH1995
2007
Source: OECD Health Data 2009.
*2006
*
THE COMMONWEALTH
FUND
Figure 8. Pharmaceutical Price Indices, 2005Manufacturer Prices at Exchange Rates
111102 100
8175 74 72 69 69 67
59 56
0
20
40
60
80
100
120
Japan
Mex
ico
U.S.
Canada
Ger
man
y
France
U.K.
Austra
lia
Brazi
lIta
ly
Spain
Chile
Data: World Development Indicators, 2005; and authors’ calculations based on data from IMS Health MIDAS
database, 2005.
Source: P.M. Danzon and M.F. Furukawa, “International Prices And Availability Of Pharmaceuticals In 2005,” Health
Affairs, 27, no. 1 (2008): 221-233.
Relative to US Prices (US = 100)

THE COMMONWEALTH
FUND
Figure 9. Cost Sharing and Protection Mechanisms for Outpatient Prescription Drugs in Six European Countries, 2008
Source: S. Thompson and E. Mossialos, Primary Care and Prescription Drugs: Coverage, Cost Sharing and Financial
Protection in Six European Countries, (New York: The Commonwealth Fund, forthcoming 2009).
12-month cap: SEK4,300
($500).
None.Deductible: SEK900 ($105) in a 12-month period.
Co-insurance: varies depending on 12-month drug costs above
the deductible; SEK900-1,700 ($198) – 50%; SEK1,700-3,300
($384) – 25%; SEK3,300-4,300 ($500) – 10%; >SEK4,300
($500) – 0%.
Sweden
N/AN/ANone.Netherlands
For all cost sharing: 2% of
household income (1% for chronically-ill people).
Household income is
calculated as lower for
dependants.
Children <18. No charge for drugs that are at least 30% below
the reference price (around 40% of drugs).
Co-insurance with minimum and maximum co-payment: 10% of
the cost of drugs priced between €50 ($66) and €100 ($130), with a minimum of €5 ($6.5) and a maximum of €10 ($13) per
prescription, plus costs above a reference price (about 7% of
drugs).
Germany
Non-reimbursable co-
payments: €50 ($66) per
person per year for all
health care, not just prescription drugs.
Co-insurance: People receiving invalidity and work injury
benefits, people with one of 30 chronic or serious conditions
(for that condition only), low income people.
Non-reimbursable co-payments: Children <18 and low income people.
Co-insurance: 0% for highly effective drugs; 35%, 65% and
100% for drugs of limited therapeutic value.
Non-reimbursable co-payment: €0.50 ($0.6) per prescription.
France
Annual pre-payment
certificate: £102.50 ($147).
Children <16, people aged 16-18 in full-time education, people
aged 60 or over, people with low income, pregnant women and
women who have given birth in the last 12 months; war pensioners, people with certain medical conditions and
disabilities, prescribed contraceptives, drugs administered by a
GP or at a walk-in centre, drugs for treatment of sexually-
transmissible infections.
Co-payment: £7.10 ($10) per prescription.England
Chronically-ill people:
DKK 3,805 ($678).
Children <18. People with very low income and terminally-ill
people can apply for financial assistance. The reimbursement
rate may be increased for some very expensive drugs.
Deductible: DKK520 ($93) per 12-month period.
Co-insurance: varies depending on 12-month drug costs above
the deductible; DKK520-1,260 ($225): 50%; DKK1,260-2,950
($526): 25%; >DKK2,950 ($526): 15%.
Denmark
Annual caps on out-of-
pocket spending
ExemptionsOutpatient prescription drugsCountry
THE COMMONWEALTH
FUND
80 78 78 74 78 84 80
15 17 18 20 1612 15
0
25
50
75
100
AUS CAN GER NETH NZ UK US
Very Important Somewhat Important
Percent very or somewhat important
Figure 10. Strong Public Support for Having A “Medical Home”: Accessible, Personal, Coordinated Care
When you need care, how important is it that you have one practice/clinic where doctors and nurses
know you, provide and coordinate the care that you need?
Source: 2007 Commonwealth Fund International Health Policy Survey. C. Schoen, et al. “Toward Higher
Performance Health Systems: Adults’ Experiences in Seven Countries, 2007,” Health Affairs Web Exclusive, Oct.
31, 2007.

THE COMMONWEALTH
FUND
Figure 11. Access to Doctor When Sick or Needed Care, 2008
6054
4843 42
36
26 26
0
20
40
60
80
NETH NZ UKGER FR
AUSCAN US
Same-day appointment
Base: Adults with any chronic condition
Percent
Data: 2008 Commonwealth Fund International Health Policy Survey of Sicker Adults
Source: C. Schoen et al., “In Chronic Condition: Experiences of Patients with Complex Healthcare Needs in Eight
Countries, 2008”, Health Affairs Web Exclusive, November 13, 2008.
26
39 40 4145
5359
64
0
20
40
60
80
NETHGER UK
FRA NZAUS US
CAN
Any ER use in past 2 years
THE COMMONWEALTH
FUND
Figure 12. Difficulty Getting Care After Hours Without Going to the Emergency Room
15 15
20 20
2933 34
40
0
20
40
60
NETH GER NZ UK FR CAN AUS US
Data: 2008 Commonwealth Fund International Health Policy Survey of Sicker Adults
Source: C. Schoen et al., “In Chronic Condition: Experiences of Patients with Complex Healthcare Needs in Eight
Countries, 2008”, Health Affairs Web Exclusive, November 13, 2008.
Base: Adults with any chronic condition who needed after-hours care
Percent reported very difficult getting care on nights, weekends, or holidays without going to ER

THE COMMONWEALTH
FUND
Figure 13. Primary Care Doctors: Practice Has Arrangement for After-Hours Care to See Nurse/Doctor, 2006
9590 87
8176
4740
0
25
50
75
100
NETH NZ UK AUS GER CAN US
Percent
Data: 2006 Commonwealth Fund International Health Policy Survey of Primary Care Physicians.
Source: Schoen et al., “On The Front Lines of Care: Primary Care Doctors' Office Systems, Experiences, and Views
in Seven Countries,” Health Affairs Web Exclusive, Nov. 2, 2006.
THE COMMONWEALTH
FUND
Figure 14. U.S. Chronically Ill Patient Experiences: Access, Coordination& Safety, 2008
3420251719182929Medical, medication, or lab error***
541331726232536Access problem due to cost*
3420211426222523Coordination problem**
FR NETHGER USUKNZCANAUSPercent reported in past 2 years:
Base: Adults with any chronic condition
*Due to cost, respondent did NOT: fill Rx or skipped doses, visit a doctor when had a medical problem, and/or get
recommended test, treatment, or follow-up.
**Test results/records not available at time of appointment and/or doctors ordered test that had already been done.
***Wrong medication or dose, medical mistake in treatment, incorrect diagnostic/lab test results, and/or delays in abnormal
test results.
Data: 2008 Commonwealth Fund International Health Policy Survey of Sicker Adults
Source: C. Schoen et al., “In Chronic Condition: Experiences of Patients with Complex Healthcare Needs in Eight
Countries, 2008”, Health Affairs Web Exclusive, November 13, 2008.

THE COMMONWEALTH
FUND
Figure 15. Poor Coordination: Nearly Half of U.S. Adults Report Failures to Coordinate Care
Percent U.S. adults reported in past two years:
Source: Commonwealth Fund Survey of Public Views of the U.S. Health Care System, 2008.
No one contacted you about test results, or you had to call repeatedly
to get results
Test results/medical records were not available at the time of appointment
Your primary care doctor did not receive a report back from a specialist
Any of the above
25
21
19
15
13
47
0 20 40 60
Doctors failed to provide important medical information to other doctors
or nurses you think should have it
Your specialist did not receive basic medical information from your
primary care doctor
THE COMMONWEALTH
FUND
Figure 16. Cost Sharing Arrangements and Protection Mechanisms for Outpatient and Inpatient Care in Six European Countries, 2008
Source: S. Thompson and E. Mossialos, Primary Care and Prescription Drugs: Coverage, Cost Sharing and Financial
Protection in Six European Countries, (New York: The Commonwealth Fund, forthcoming 2009).
Adults: SEK900
($109) for health
services.
Children <20 in most counties. Co-payment: Up
to SEK80 ($10)
per day in
hospital.
Co-payment:
SEK200-300 ($24-
36) per specialist or
emergency
department visit.
Co-payment:
SEK100-150
($12-18) per
GP visit.
Sweden
None.Children <18, GP services, mother
and child care, preventive care dental
care for <22.
Deductible: €150 ($199) per year.None.Netherlands
2% of household income (1% for
people with chronic
conditions).
Household income is
calculated as lower
for dependants.
Children <18 (all cost sharing) and people who choose gatekeeping
(doctor visits).
Co-payment: €10 ($13) per
inpatient day up
to 28 days per
year.
Co-payment: €10 ($13) for the first
visit per quarter
and subsequent
visits without
referral.
Co-payment: €10 ($13) for
the first visit
per quarter and
subsequent
visits without
referral.
Germany
Non-reimbursable
co-payments: €50 ($66) for all health
care including
prescription drugs.
Co-insurance: People receiving
invalidity and work injury benefits; people with one of 30 chronic or
serious conditions (for that condition
only); low income people; some
surgical interventions.
Non-reimbursable co-payments:
Children <18 and low income people.
Co-insurance:
20%.Non-
reimbursable co-
payment: €16
($21) per day up
to 31 days per
year.
Co-insurance: 30%
with gate keeping or 50%
Non-reimbursable
co-payment: €1
($1.3) per visit
Co-insurance:
30% with gate keeping or
50%
Non-
reimbursable
co-payment: €1
($1.3) per visit
France
N/AN/ANone.None.None.England
N/AN/ANone.None.None.Denmark
Annual cap on out-
of-pocket spending
ExemptionsInpatient careOutpatient
specialist visit
GP visitCountry

THE COMMONWEALTH
FUND
95
7972
58
43 41
30
0
25
50
75
100
UK NZ AUS NET GER CAN US
Percent reporting any financial incentive*
Figure 17. Primary Care Doctors’ Reports of Any Financial Incentives Targeted on Quality of Care, 2006
* Receive of have potential to receive payment for: clinical care targets, high patient ratings,
managing chronic disease/complex needs, preventive care, or QI activities
Data: 2006 Commonwealth Fund International Health Policy Survey of Primary Care Physicians
THE COMMONWEALTH
FUND
Figure 18. Effects of Pay-for-Performance on the Quality of Primary Care in England
Mean Scores for Clinical Quality at the Practice Level for Aspects of Care for Coronary Heart Disease, Asthma,
and Type 2 Diabetes That Were Linked with Incentives and Aspects of Care That Were Not Linked with
Incentives, 1998–2007.
Quality scores range from 0% (no quality indicator was met for any patient) to 100% (all quality indicators were
met for all patients).
Source: S. Campbell et al., “Effects of Pay for Performance on the Quality of Primary Care in England,” N Engl
J Med 2009;361:368-378.
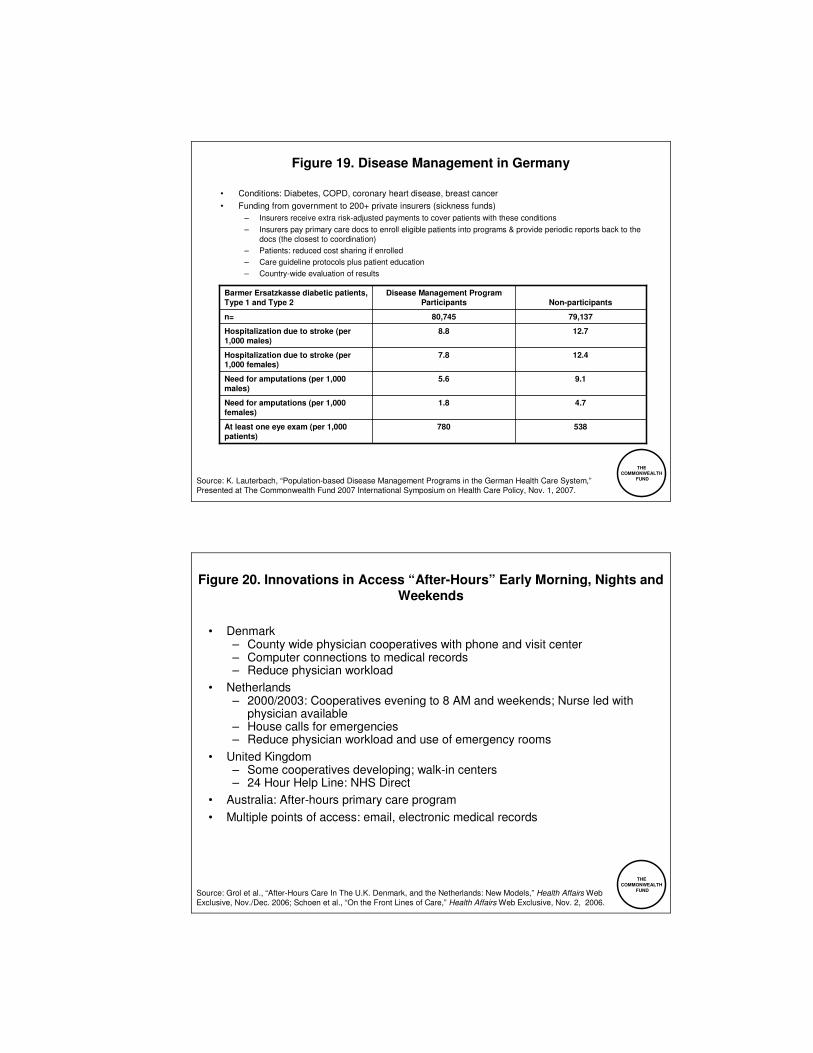
THE COMMONWEALTH
FUND
Figure 19. Disease Management in Germany
• Conditions: Diabetes, COPD, coronary heart disease, breast cancer
• Funding from government to 200+ private insurers (sickness funds)
– Insurers receive extra risk-adjusted payments to cover patients with these conditions
– Insurers pay primary care docs to enroll eligible patients into programs & provide periodic reports back to the
docs (the closest to coordination)
– Patients: reduced cost sharing if enrolled
– Care guideline protocols plus patient education
– Country-wide evaluation of results
538780At least one eye exam (per 1,000 patients)
4.71.8Need for amputations (per 1,000 females)
9.15.6Need for amputations (per 1,000 males)
12.47.8Hospitalization due to stroke (per 1,000 females)
12.78.8Hospitalization due to stroke (per 1,000 males)
79,13780,745n=
Non-participantsDisease Management Program
ParticipantsBarmer Ersatzkasse diabetic patients, Type 1 and Type 2
Source: K. Lauterbach, “Population-based Disease Management Programs in the German Health Care System,”
Presented at The Commonwealth Fund 2007 International Symposium on Health Care Policy, Nov. 1, 2007.
THE COMMONWEALTH
FUND
Figure 20. Innovations in Access “After-Hours” Early Morning, Nights and Weekends
• Denmark– County wide physician cooperatives with phone and visit center– Computer connections to medical records– Reduce physician workload
• Netherlands– 2000/2003: Cooperatives evening to 8 AM and weekends; Nurse led with
physician available– House calls for emergencies– Reduce physician workload and use of emergency rooms
• United Kingdom– Some cooperatives developing; walk-in centers– 24 Hour Help Line: NHS Direct
• Australia: After-hours primary care program
• Multiple points of access: email, electronic medical records
Source: Grol et al., “After-Hours Care In The U.K. Denmark, and the Netherlands: New Models,” Health Affairs Web
Exclusive, Nov./Dec. 2006; Schoen et al., “On the Front Lines of Care,” Health Affairs Web Exclusive, Nov. 2, 2006.

THE COMMONWEALTH
FUND
Figure 21. Only 28% of U.S. Primary Care Physicians Have Electronic Medical Records; Only 19% Advanced IT Capacity, 2006
98
9289
79
42
2823
0
25
50
75
100
NET NZ UK AUS GER US CAN
8783
72
59
32
19
8
0
25
50
75
100
NZ UK AUS NET GER US CAN
Percent reporting 7 or more out of 14 functions*
*Count of 14: EMR, EMR access other doctors, outside office, patient; routine use electronic ordering tests,
prescriptions, access test results, access hospital records; computer for reminders, Rx alerts, prompt tests results;
easy to list diagnosis, medications, patients due for care.
Percent reporting EMR
Data: 2006 Commonwealth Fund International Health Policy Survey of Primary Care Physicians.
Source: Schoen et al., “On the Front Lines of Care,” Health Affairs Web Exclusive, Nov. 2, 2006.
THE COMMONWEALTH
FUND
0
100000
200000
300000
400000
500000
600000
700000
800000
900000
1000000
1100000
1200000
1300000
1400000
1500000
92 93 94 95 96 97 98 99 20 O1 O2 O3 O4 O5 O6 O7 O8
Prescriptions
1039105 = 73%
Prescriptions
1389023 = 84%
Disch. Letters
682923 = 85 %
Disch. Letters 1131750 = 94 %
Lab. reports
543040 = 82 %
Lab. reports
988151 = 99 %
ReferralsReferrals
177525 = 65 %
ReferralsReferrals
Reimbursement
21049 = 99 %
GP´s with EDI : 2120 = 100 %
Specialists with EDI: 765 = 94 %
Hospitals with EDI : 63 = 100%
Pharmacies with EDI: 322 = 100 %
Doctors on Call : 5 = 100 %
Health Insurance : 5 = 100 %
102 messages/min
Lab Requests
349840 = 85 %
Figure 22. MedCom – The Danish Health Data NetworkMessages/Month

THE COMMONWEALTH
FUND
Figure 23. Why Invest in E-Health? Registries?Denmark Physicians and Patients Example
• Doctors:– 50 minutes saved per day in GP practice– Information ready when needed– Telephone calls to hospitals reduced by 66%– E-referrals, lab orders– Patient e-mail consultation, Rx renewal
• Patients:– Reduced waiting times, greater convenience – Info about treatments, number of cases – Patients access to own data– Preventive care reminders – Information about outcomes
Source: I. Johansen, “What Makes a High Performance Health Care System and How Do We Get There?
Denmark,” Presentation to the Commonwealth Fund International Symposium, November 3, 2006.
THE COMMONWEALTH
FUND
Figure 24. National Quality Benchmarking in Germany
Size of the project:
• 2,000 German Hospitals (> 98%)
• 5,000 medical departments
• 3 Million cases in 2005
• 20% of all hospital cases in Germany
• 300 Quality indicators in 26 areas of care
• 800 experts involved (national and regional)
Source: C. Veit, “The Structured Dialog: National Quality Benchmarking in Germany,” Presentation at
AcademyHealth Annual Research Meeting, June 2006.
Ideas and goals:
� define standards (evidence based, public)
���� define levels of acceptance
���� document processes, risks and results
���� present variation
���� start structured dialog
���� improve and check

THE COMMONWEALTH
FUND
Figure 25. Benchmarking in the Netherlands
THE COMMONWEALTH
FUND
Figure 26. High U.S. Insurance Overhead: Insurance Related Administrative Costs
• Fragmented payers + complexity = high transaction costs and overhead costs
– McKinsey estimates adds $90 billion per year*
• Insurance and providers
– Variation in benefits; lack of coherence in payment
– Time and people expense for doctors/hospitals
$76$86
$140
$191$198$220
$247
$516
$0
$100
$200
$300
$400
$500
$600
US FR SWIZ NETH GER CAN AUS* OECD
Median* 2006
Source: 2009 OECD Health Data (June 2009)
Spending on Health Insurance Administration per Capita, 2007
* McKinsey Global Institute, Accounting for the Costs of U.S. Health Care: A New Look at Why Americans Spend
More, (New York: McKinsey Global Institute, Nov. 2008).

THE COMMONWEALTH
FUND
Figure 27. Complexity Drains Resources: Total Annual Cost to U.S. Physician Practices for Interacting with Health Plans Is Estimated at $31
Billion1
MDs$15,767
Nursing staff $21,796
Clerical staff $25,040
Senior administrative $3,522
Lawyer/Accountant$2,149
Total Annual per Practice Cost per Physician: $68,274
Mean Dollar Value of Hours Spent per Physician per Yearon All Interactions with Health Plans
1 Based on an estimated 453,696 office-based physicians.
Source: L. P. Casalino, S. Nicholson, D. N. Gans et al., “What Does It Cost Physician Practices to Interact
with Health Insurance Plans?” Health Affairs Web Exclusive, May 14, 2009, w533–w543.
THE COMMONWEALTH
FUND
Figure 28. Dutch Risk Equalization System: Calculation of Allocation to Health Plan from Risk Fund
€ 297€ 7800From Risk Fund
-/- € 130€ 6202Diagnostic costgroup
-/- € 315-/- € 315Pharmaceut. costgroup
-/- € 67€ 98Region
-/- € 63 € 941Income
€ 872€ 934 Age / gender
Man, 38 , employed, prosperous region, no medication or
hospitalisation last year neither any chronic disease
Women, 40, jobless with disability income allowance,
urban region, hospitalised last year for ostéoarthriteIn €’s / yr
Source: G. Klein Ikkink, Ministry of Health, Welfare and Sport; Presentation to AcademyHealth Netherlands Health
Study Tour on September 22, 2008, “Reform of the Dutch Health Care System.”