u.s. global investors...huge pent-up demand for automotive transportation in the developing world...
TRANSCRIPT

www.usfunds.com1.800.US.FUNDS
U.S. Global InvestorsSearching for Opportunities, Managing Risk
January 201111-026
View the Worldfrom 50,000 Feet
Frank Holmes,CEO and Chief Investment Officer

www.usfunds.comJanuary 2011 11-026 2
Fund Recognition
Winner of 26 Lipper Fund Awards and certificates since 2000
Investment leadership results
in performance
www.usfunds.comJanuary 2011 11-026
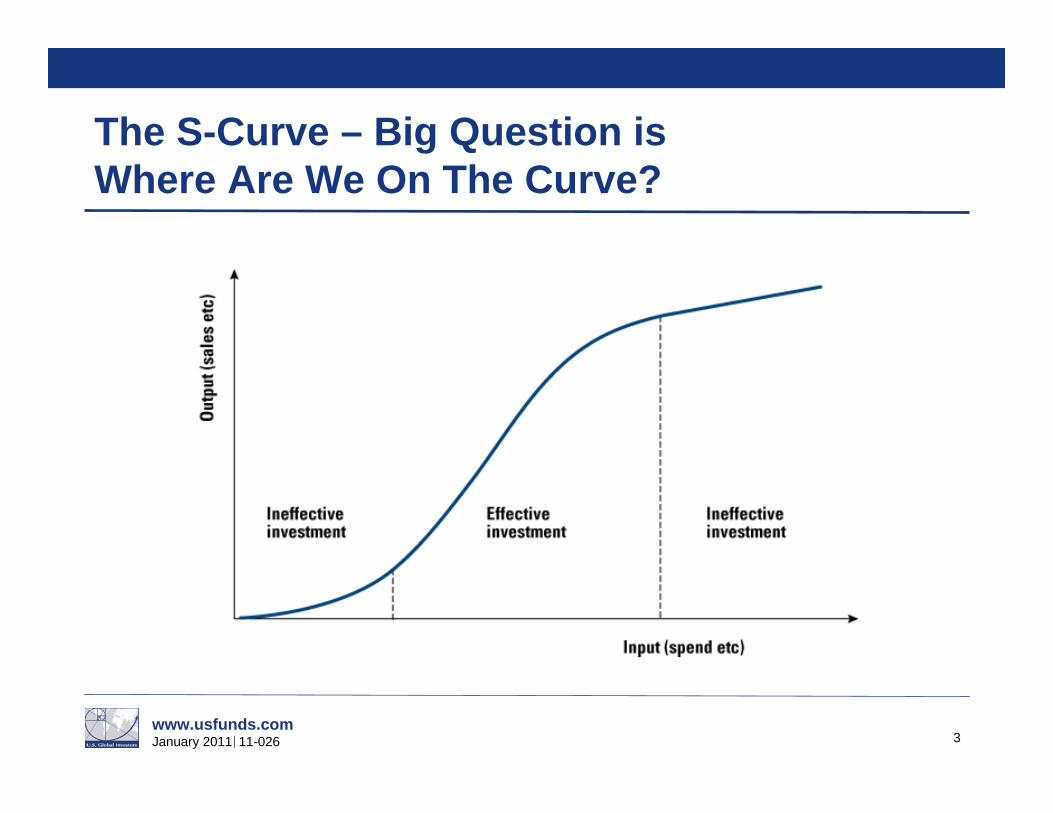
The S-Curve – Big Question is Where Are We On The Curve?
3

www.usfunds.comJanuary 2011 11-026 4
6 Billion People-Tipping Point

www.usfunds.comJanuary 2011 11-026 5
Demographics is the Key
Half of the global population (>3 billion) is estimated to live in urban areasProjected urban population is larger than the entire world population in 1965Deng Xiaoping

www.usfunds.comJanuary 2011 11-026 6
Demographics is the Key
EM = Emerging Markets
Taipei, Taiwan

www.usfunds.comJanuary 2011 11-026 7
Chindia — Rising Middle Class
Source: PIRA
Source: padanisaa.blogspot.com

www.usfunds.comJanuary 2011 11-026 8
Macro Trend-Tailwind for Investing in Emerging Economies
Source: PIRA
Population
Mercedes Showroom, China

www.usfunds.comJanuary 2011 11-026 9
Catch-Up Potential — Big Macro Trend
• Poor countries typically grow faster than rich ones• EM GDP per capita is US$5,000 vs. $40,000 in developed markets
As of Sep 2006. Source: IMF, Merrill Lynch

www.usfunds.comJanuary 2011 11-026 10
Government Policy Model —Precursor for Change
www.usfunds.comJanuary 2011 11-026 11
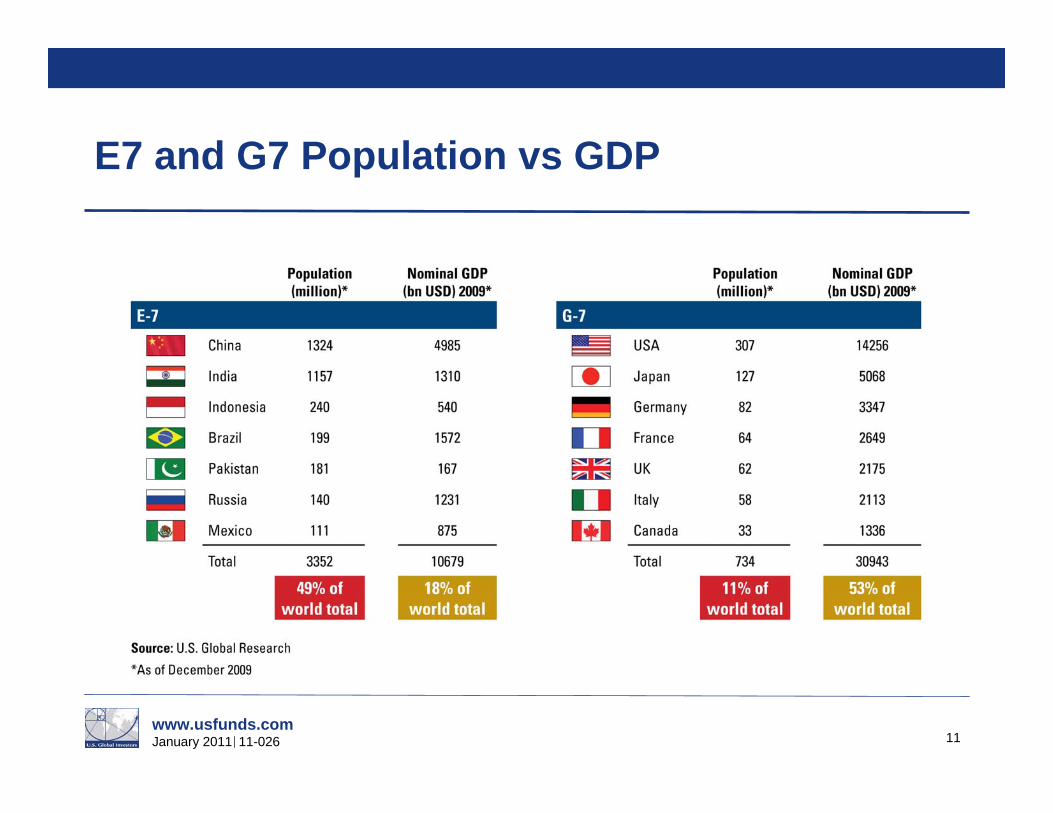
E7 and G7 Population vs GDP

www.usfunds.comJanuary 2011 11-026
Less Debt in Emerging Economies
12

www.usfunds.comJanuary 2011 11-026
The Shocking Cost of U.S. Regulation is an Opportunity for Emerging Markets
13
$8,000 per private sector employee
14% of the economy
www.usfunds.comJanuary 2011 11-026 14
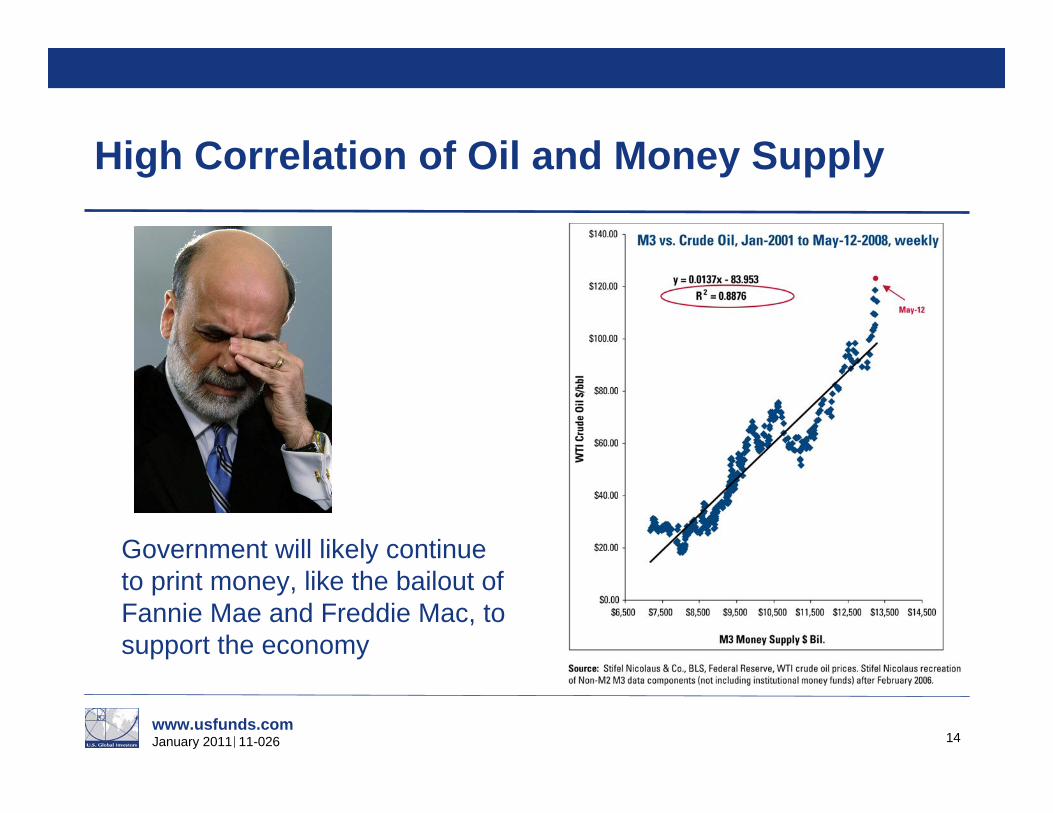
High Correlation of Oil and Money Supply
Government will likely continue to print money, like the bailout of Fannie Mae and Freddie Mac, to support the economy

www.usfunds.comJanuary 2011 11-026 15
Oil Consumption per capita:
1 to 25
1 to 16
1 to 15
1 to 2
0.9
U.S.
S. KoreaJapan
Oil Consumption and Industrialization, 1900 to present
Lower U.S. labor costs versus Europe and the U.K. drive American industrialization, enrichment and energy consumption
Lower Japanese labor costs do the same to the U.S.
Lower Korean labor costs do the same to Japan
Oil per capita rises rapidly during early industrialization, then levels to rapid real income growth. Rising world trade actually stimulates the industrialization phase.
China & India
Super Shift – Energy
Source: Dr. Marc Faber

www.usfunds.comJanuary 2011 11-026 16
Power consumption has been growing faster than the rate of GDP growth.Source: BHPB
Intensity of electricity consumption
Super Shift – Electricity
www.usfunds.comJanuary 2011 11-026
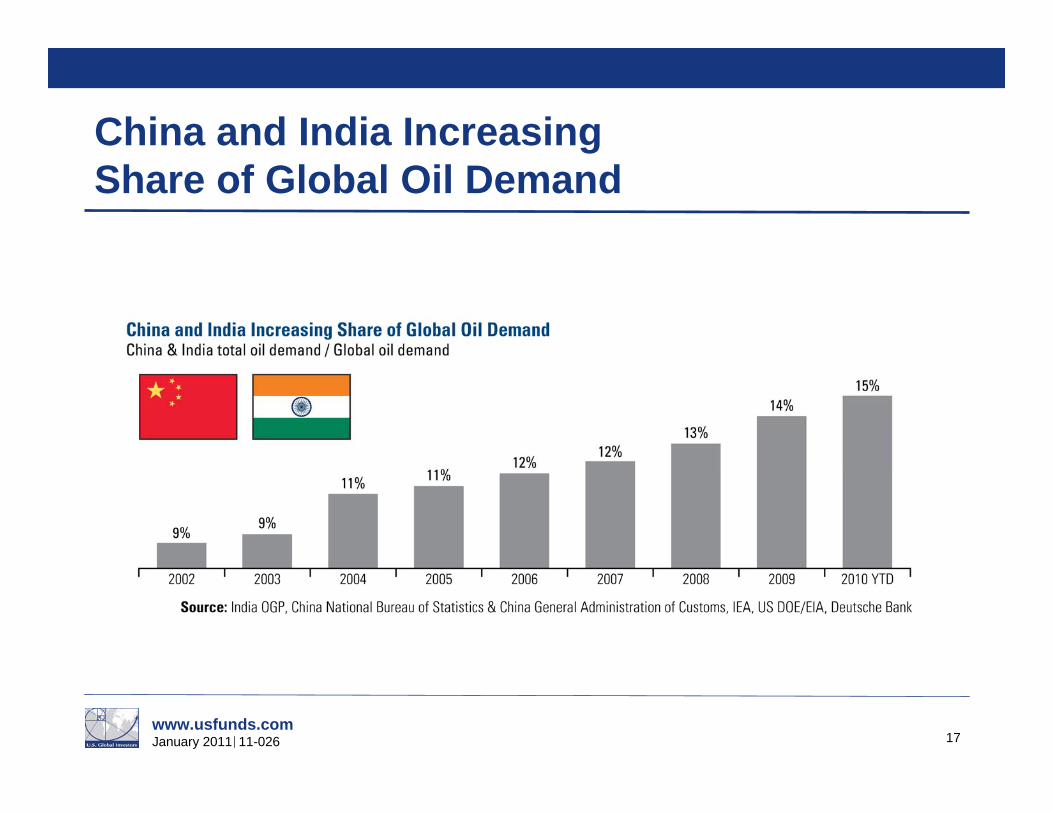
China and India Increasing Share of Global Oil Demand
17

www.usfunds.comJanuary 2011 11-026
Cars Driving Oil Demand
18
Zhanxi bridge highway, Beijing China

www.usfunds.comJanuary 2011 11-026 19
Huge Pent-Up Demand for Automotive Transportation in the Developing World
BYD (Build Your Dreams) president Wang Chuanfu sits inside the BYD E6 Electric Car during the North American International Auto Show in Detroit, Michigan January 12, 2009. Source: REUTERS/Mark Blinch

www.usfunds.comJanuary 2011 11-026 20
Oil Consumption Per Day Per Person Vis-à-Vis Per Capita Income
China

www.usfunds.comJanuary 2011 11-026
A New Era for Autos
21
Frank HolmesIndia-Nano Car

www.usfunds.comJanuary 2011 11-026
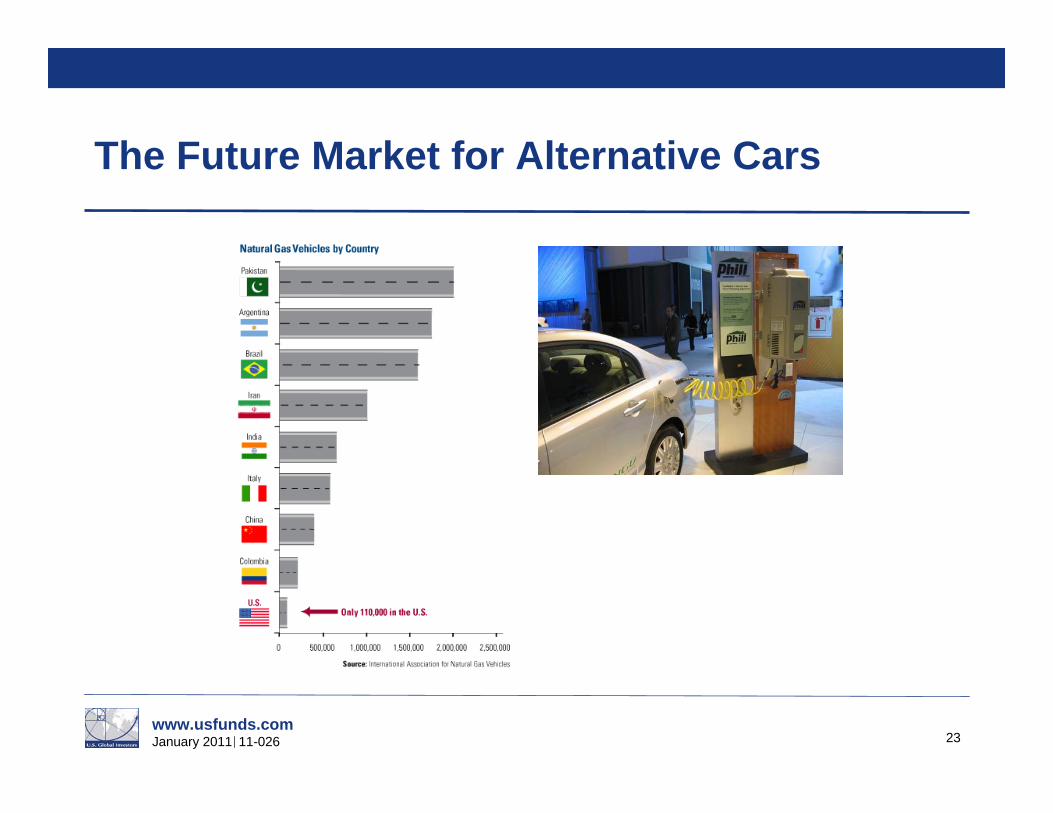
The Future Market for Alternative Cars
22
www.usfunds.comJanuary 2011 11-026
The Future Market for Alternative Cars
23

www.usfunds.comJanuary 2011 11-026
Tracking Performance of Base Metals
24

www.usfunds.comJanuary 2011 11-026
China Exports
25
Source: www.weldononline.com

www.usfunds.comJanuary 2011 11-026
China Imports
26
Source: www.weldononline.com

www.usfunds.comJanuary 2011 11-026
Copper Demand/Supply Imbalance
27
Source: www.weldononline.com

www.usfunds.comJanuary 2011 11-026
Copper Imports into China
28
Source: www.weldononline.com

www.usfunds.comJanuary 2011 11-026
China Iron Ore Imports
29
Source: www.weldononline.com
www.usfunds.comJanuary 2011 11-026
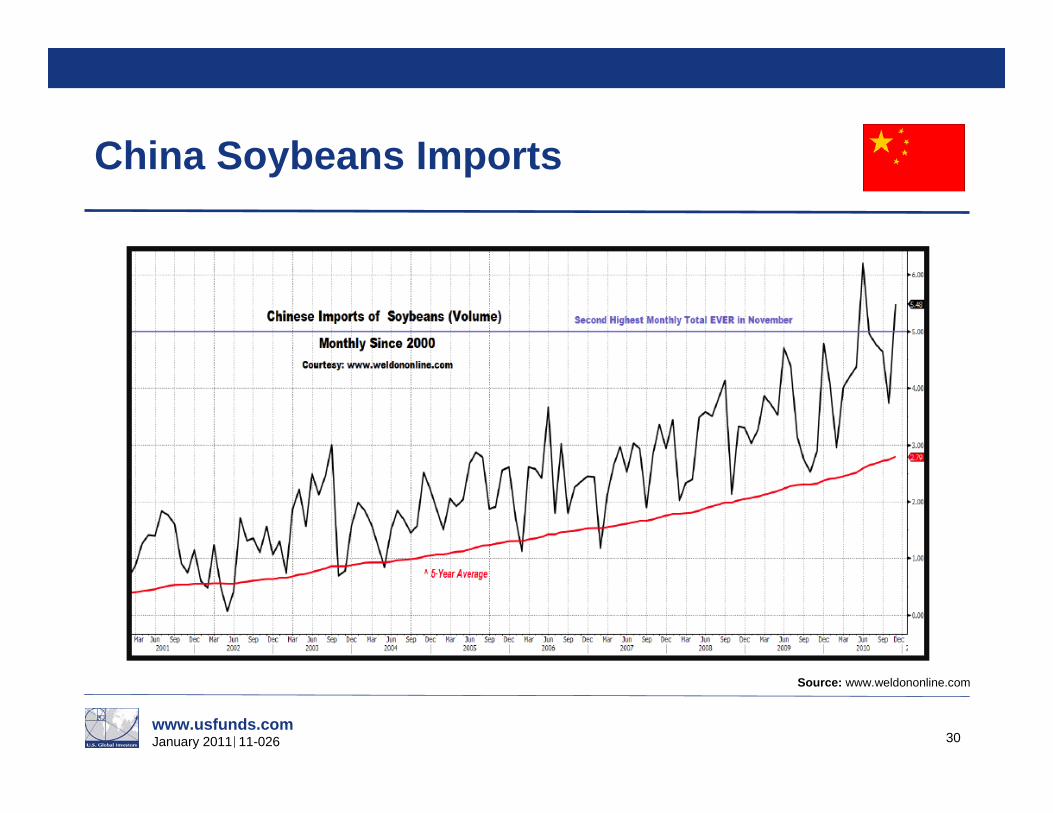
China Soybeans Imports
30
Source: www.weldononline.com
www.usfunds.comJanuary 2011 11-026
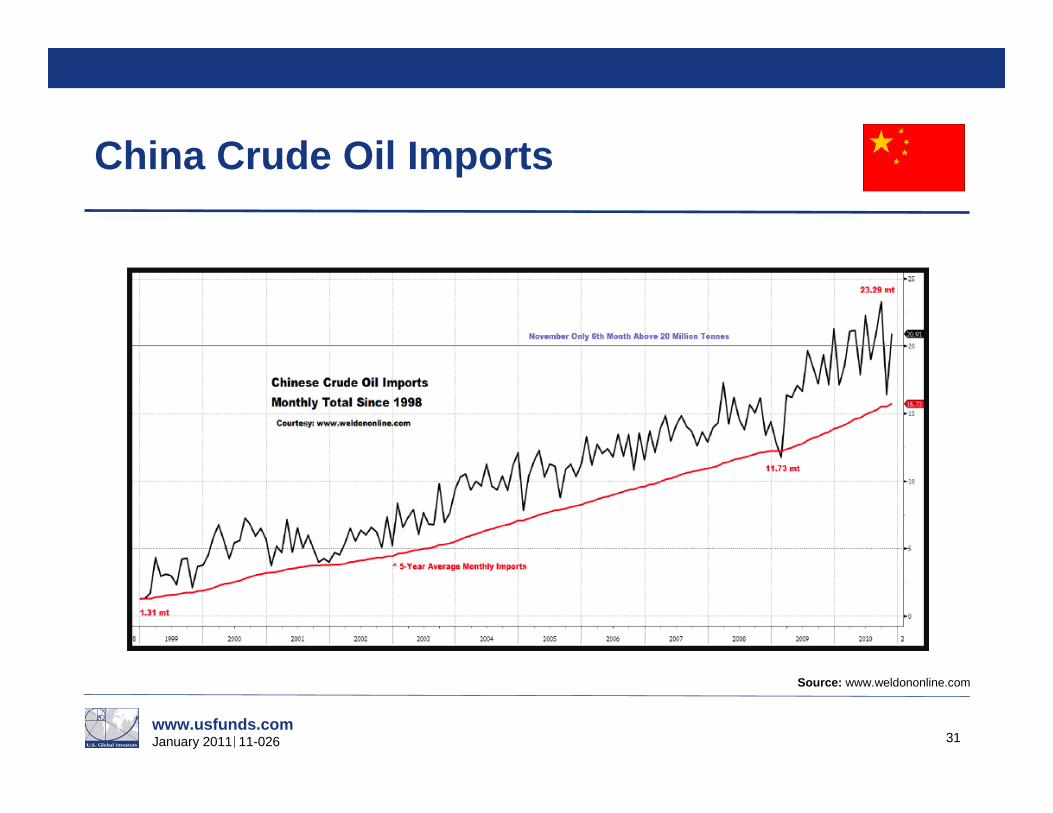
China Crude Oil Imports
31
Source: www.weldononline.com

www.usfunds.comJanuary 2011 11-026
China M-2 Money Supply
32
Source: www.weldononline.com

www.usfunds.comJanuary 2011 11-026
China Consumer Price Index
33
Source: www.weldononline.com
www.usfunds.comJanuary 2011 11-026
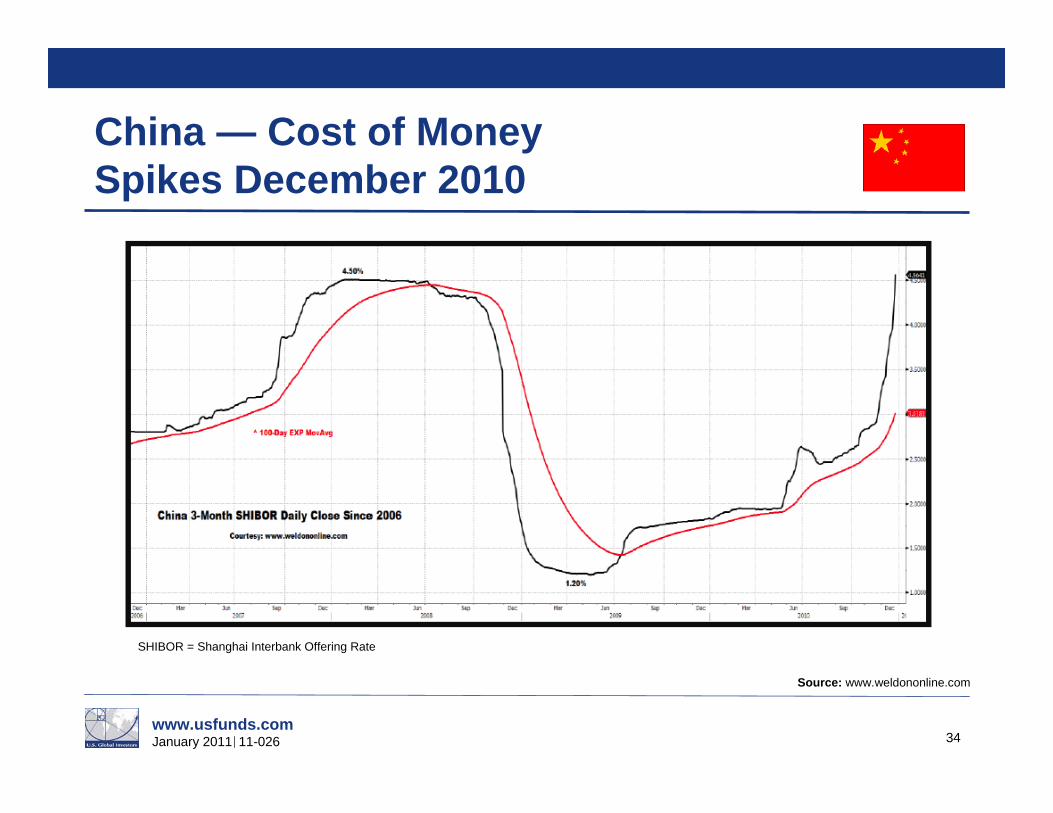
China — Cost of Money Spikes December 2010
34
Source: www.weldononline.com
SHIBOR = Shanghai Interbank Offering Rate
www.usfunds.comJanuary 2011 11-026
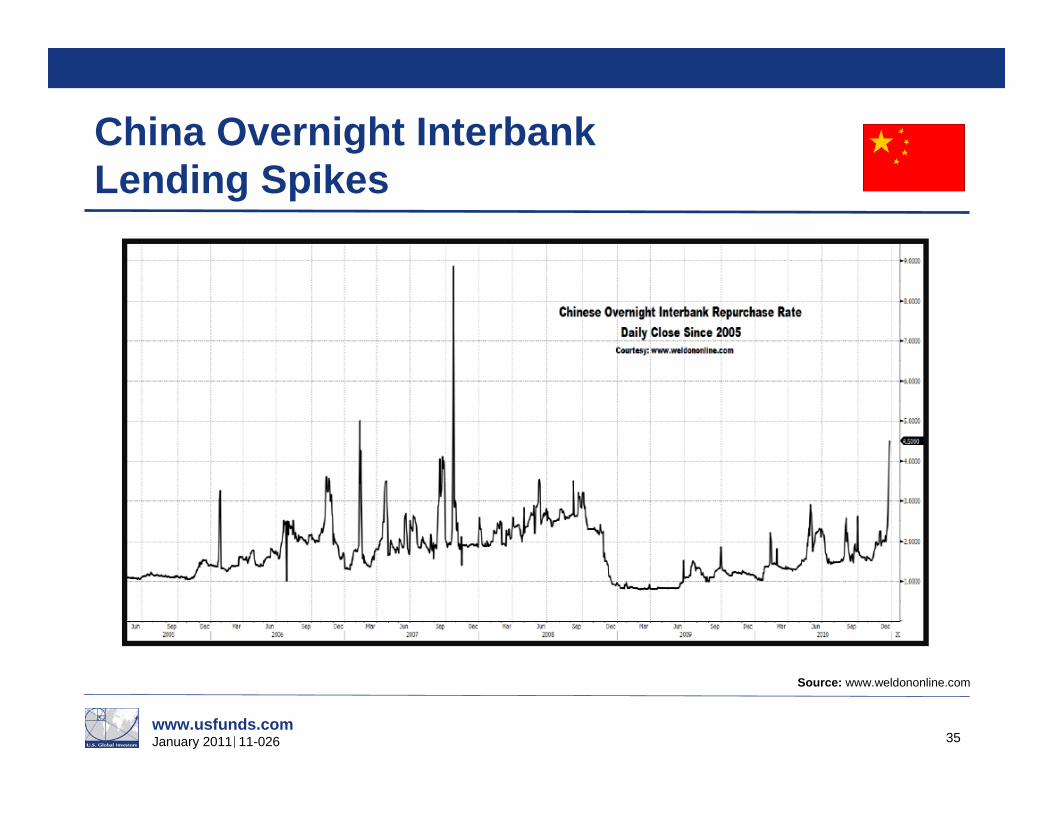
China Overnight Interbank Lending Spikes
35
Source: www.weldononline.com

www.usfunds.comJanuary 2011 11-026
China — Lots of Cash
36
Source: www.weldononline.com
www.usfunds.comJanuary 2011 11-026
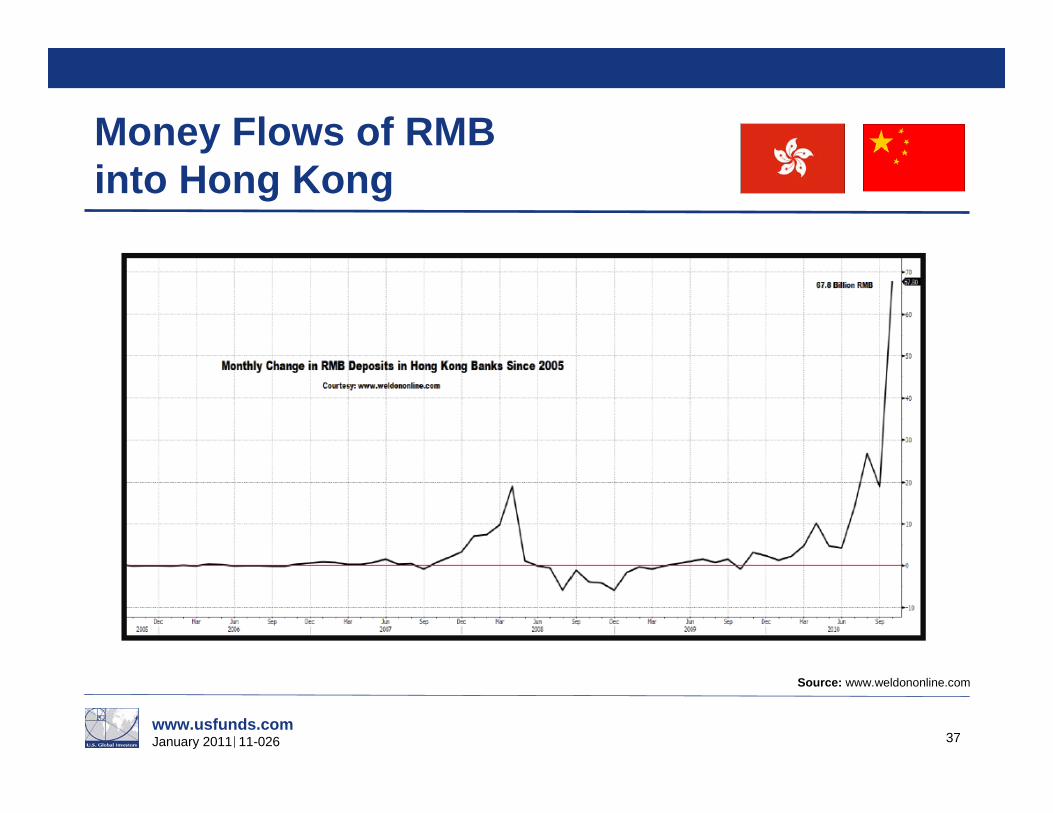
Money Flows of RMB into Hong Kong
37
Source: www.weldononline.com
www.usfunds.comJanuary 2011 11-026
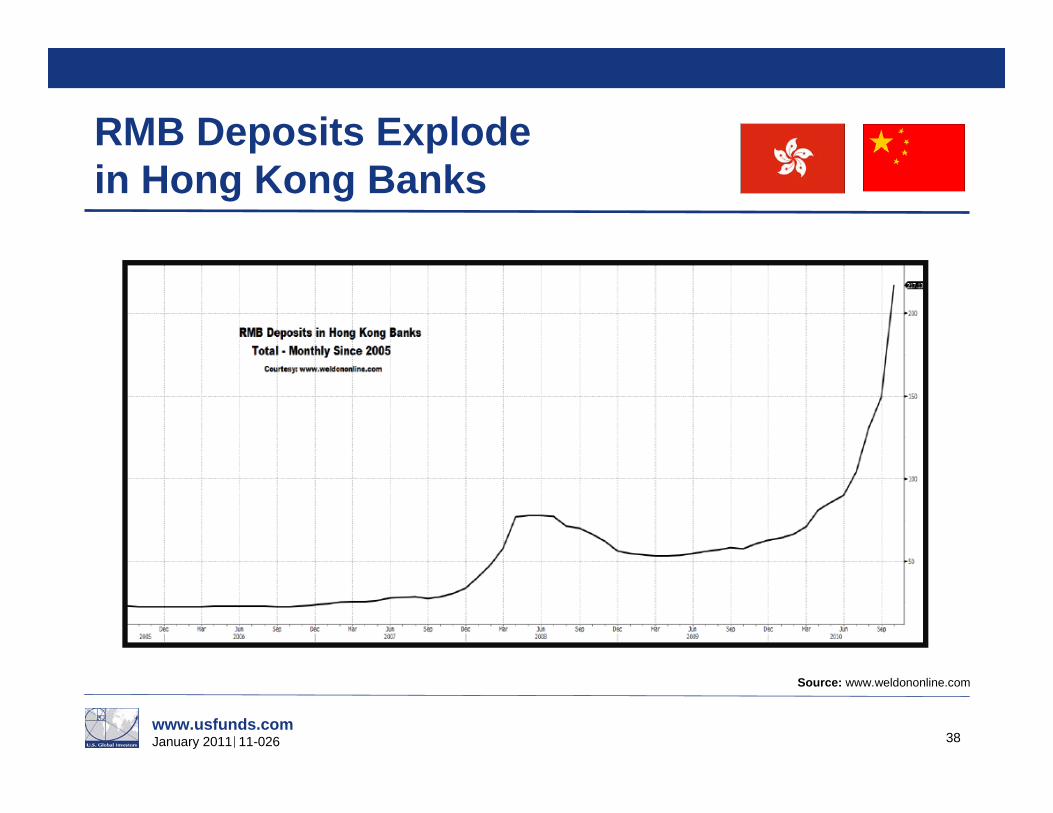
RMB Deposits Explode in Hong Kong Banks
38
Source: www.weldononline.com

www.usfunds.comJanuary 2011 11-026
China Lending Remains Robust
39
Source: www.weldononline.com
www.usfunds.comJanuary 2011 11-026
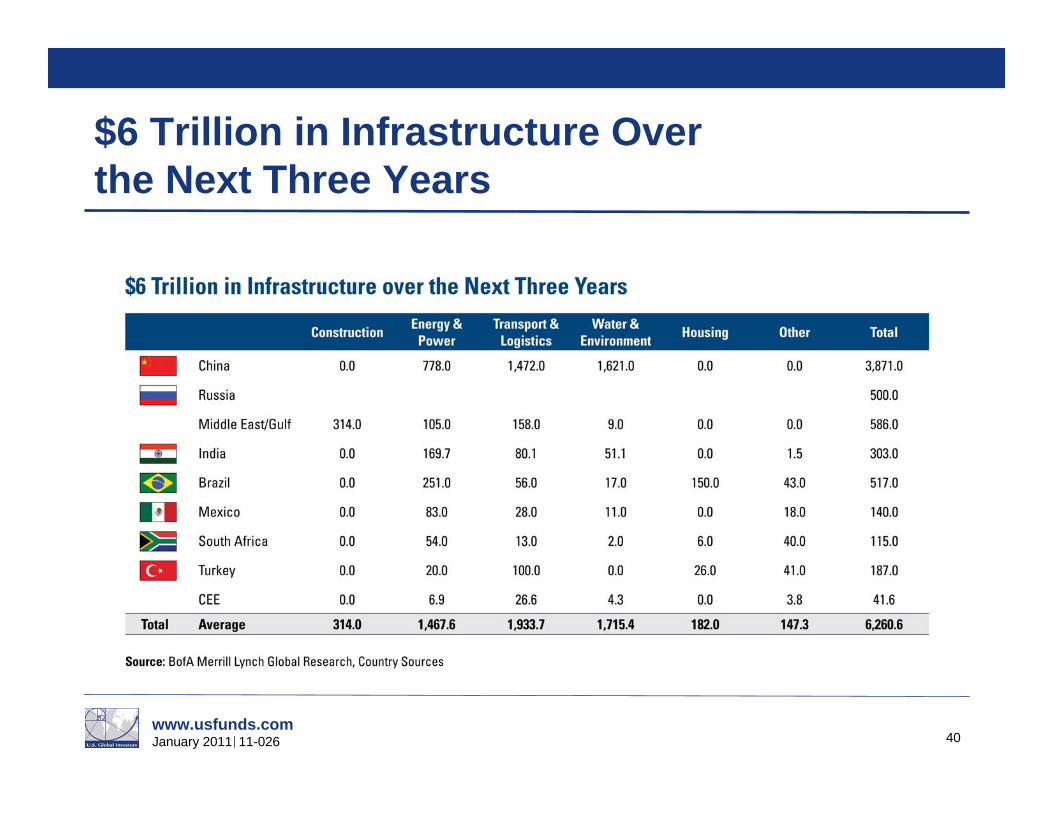
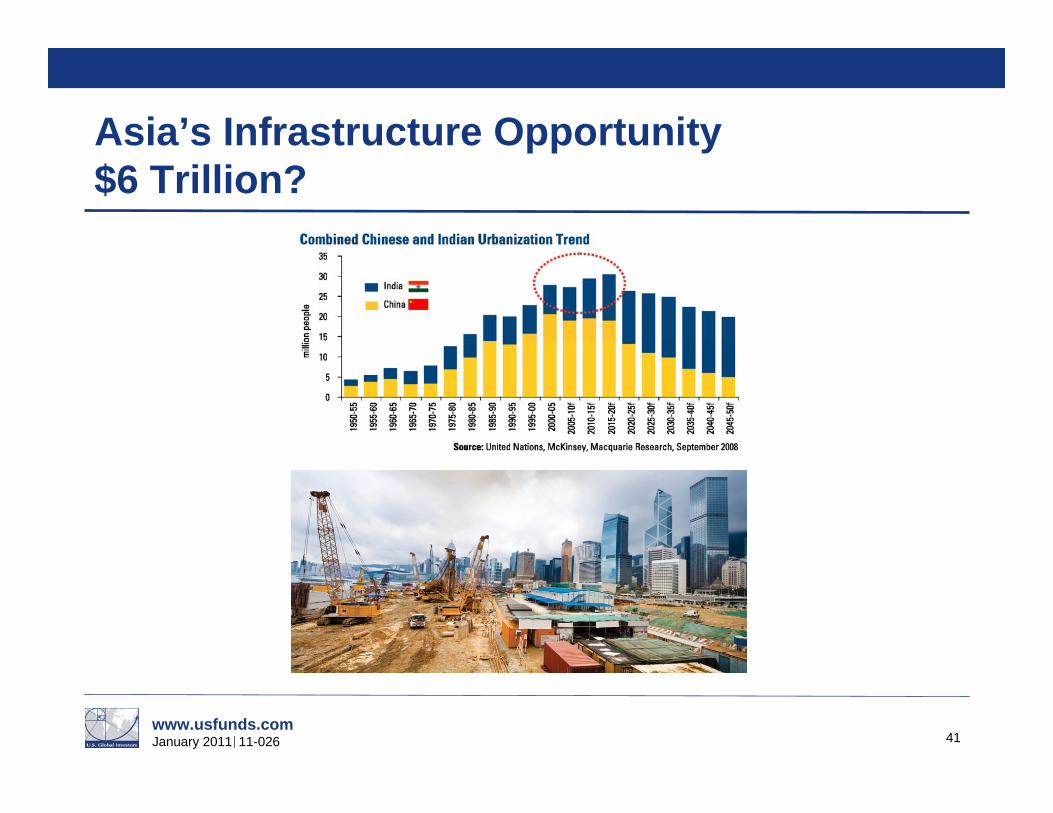
$6 Trillion in Infrastructure Over the Next Three Years
40
www.usfunds.comJanuary 2011 11-026
Asia’s Infrastructure Opportunity $6 Trillion?
41

www.usfunds.comJanuary 2011 11-026
Industry Relocation — Going West and North
42

www.usfunds.comJanuary 2011 11-026 43
Inward Looking
China

www.usfunds.comJanuary 2011 11-026 44
High Speed Rail Network —Planned and Operating
China

www.usfunds.comJanuary 2011 11-026 45
Infrastructure Spending and Oil Demand March TogetherBarrels of Oil per Day/1000
Source: PIRA
China

www.usfunds.comJanuary 2011 11-026
A New Age of Energy
46
www.usfunds.comJanuary 2011 11-026 47
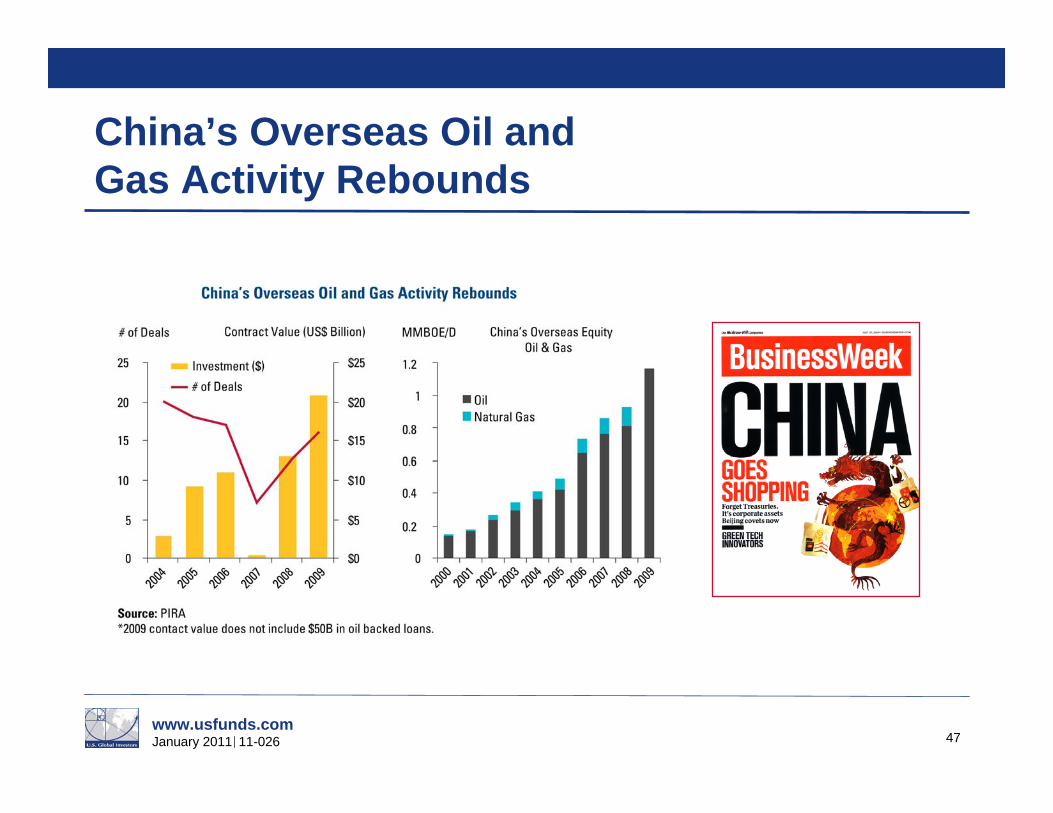
China’s Overseas Oil and Gas Activity Rebounds
www.usfunds.comJanuary 2011 11-026
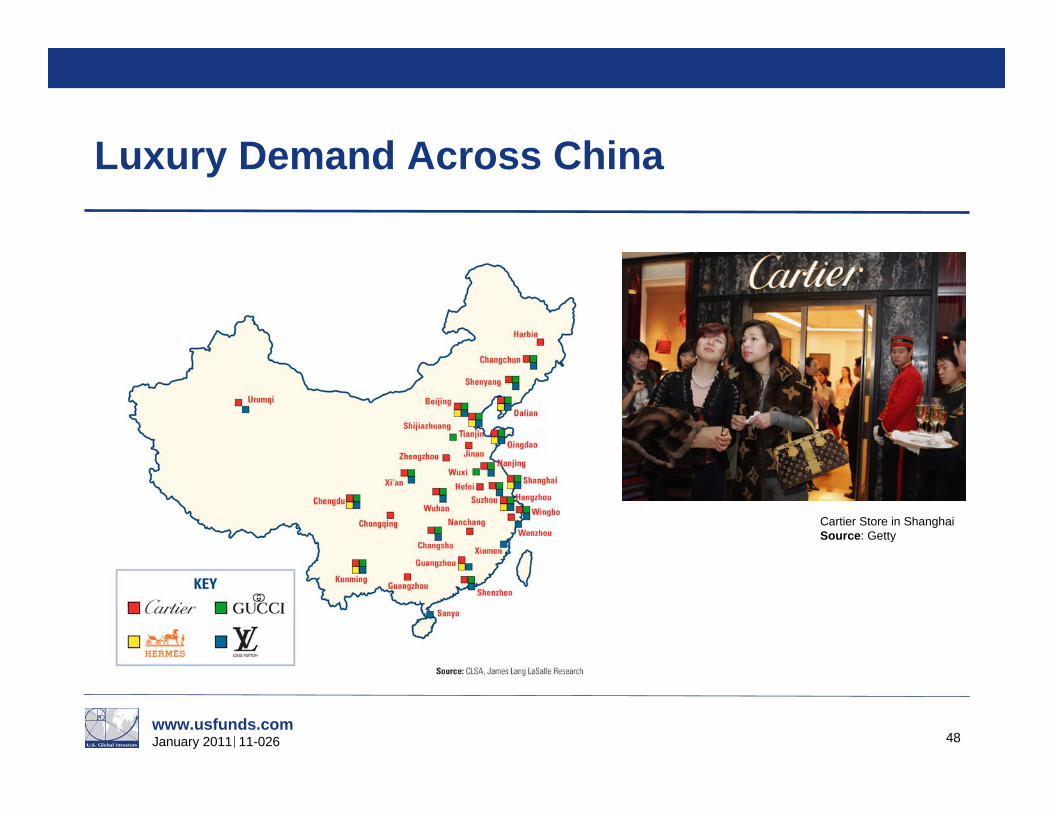
Luxury Demand Across China
48
Cartier Store in ShanghaiSource: Getty

www.usfunds.comJanuary 2011 11-026
China is Gold’s Future
49

www.usfunds.comJanuary 2011 11-026
Why More Investors Like Gold
50

www.usfunds.comJanuary 2011 11-026 51
India — From Price Taker to Price Maker
Scene from Slumdog MillionaireSource: padanisaa.blogspot.com

www.usfunds.comJanuary 2011 11-026
Low Real Interest Rates Historically Fuel Gold & Silver
52
Tipping Point for Gold2%

www.usfunds.comJanuary 2011 11-026 53
Right Time for Gold Mining Stocks?
Investor AlertSpecial Report
06/05/09
$250
$1400

www.usfunds.comJanuary 2011 11-026 54
Inflation-Adjusted Gold Prices in 2009 Dollars
www.usfunds.comJanuary 2011 11-026 55
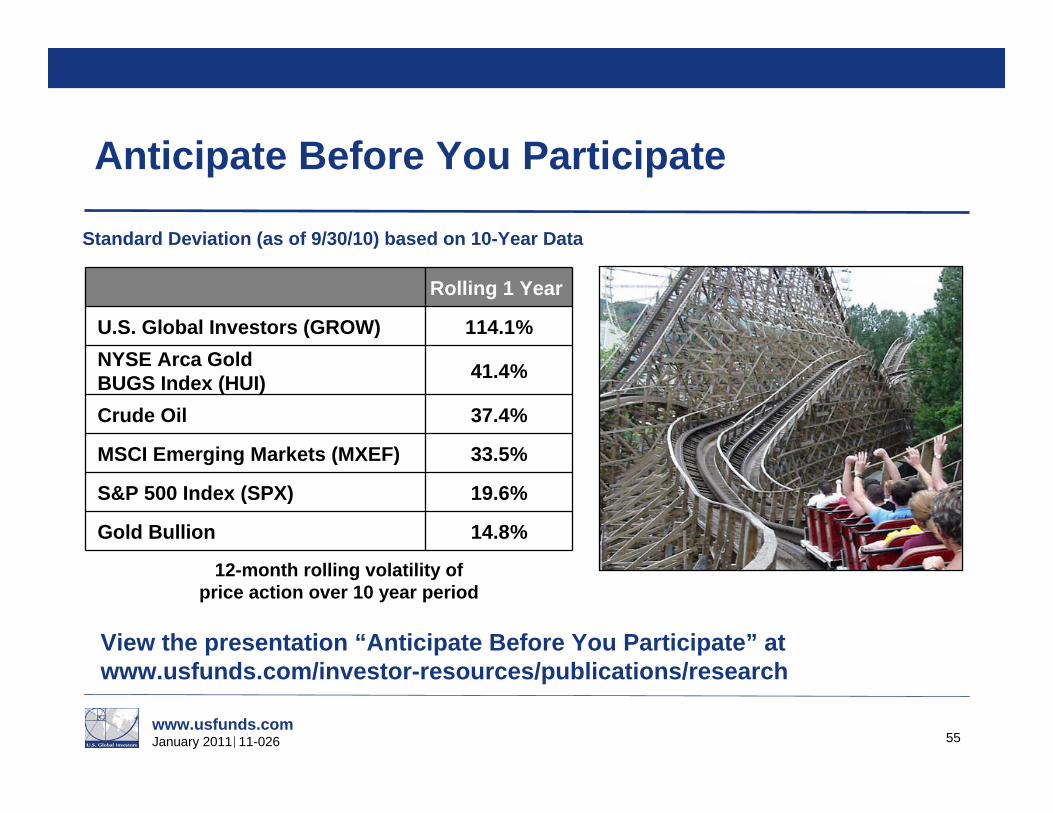
Anticipate Before You Participate
View the presentation “Anticipate Before You Participate” at www.usfunds.com/investor-resources/publications/research
Rolling 1 Year
U.S. Global Investors (GROW) 114.1%NYSE Arca Gold BUGS Index (HUI) 41.4%
Crude Oil 37.4%
MSCI Emerging Markets (MXEF) 33.5%
S&P 500 Index (SPX) 19.6%
Gold Bullion 14.8%
12-month rolling volatility of price action over 10 year period
Standard Deviation (as of 9/30/10) based on 10-Year Data

www.usfunds.comJanuary 2011 11-026 56
Gold Seasonality
www.usfunds.comJanuary 2011 11-026
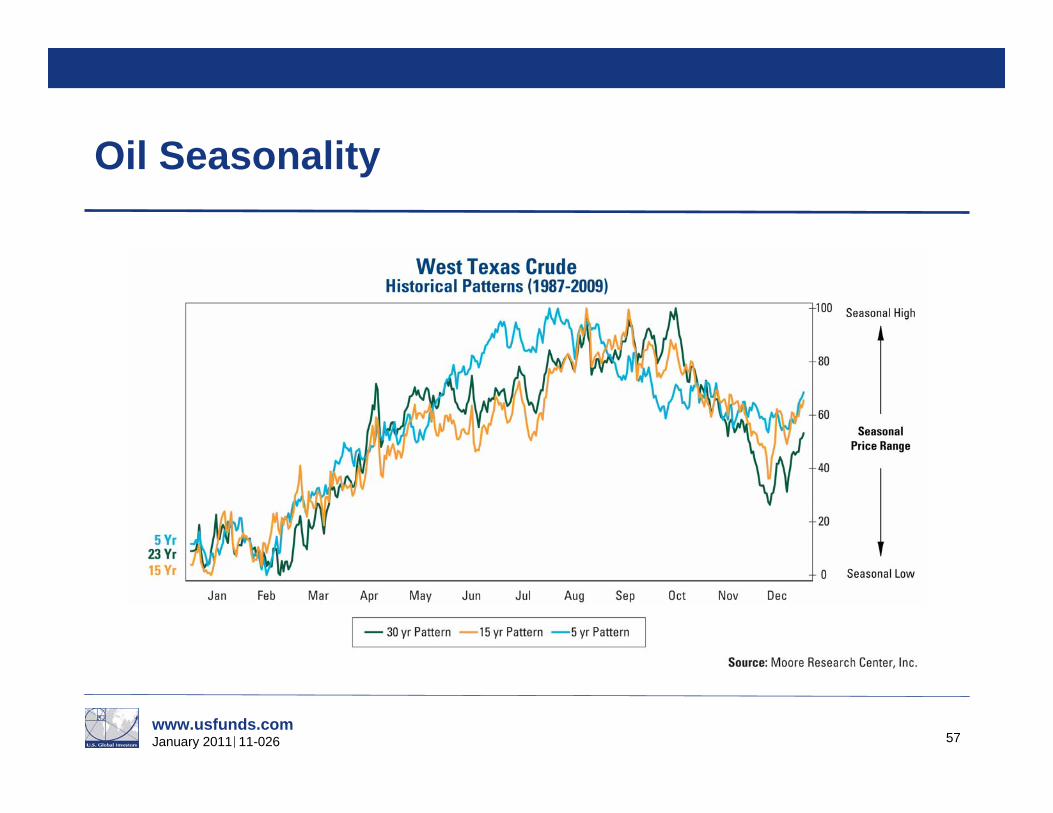
Oil Seasonality
57

www.usfunds.comJanuary 2011 11-026
Three Price Levels When Valuing Companies
1. Wholesale Price2. Retail Price3. Fairytale Price
58

www.usfunds.comJanuary 2011 11-026
Life Cycle of a Mining Share
59

www.usfunds.comJanuary 2011 11-026
The Five M’s for Gold Miners
60
Management
Mine Lifecycle
Market Cap
Money (Burn Rate)
Minerals

www.usfunds.comJanuary 2011 11-026 61
Average Share Price Impact: By Event
Source: Company Reports and CIBC World Markets Inc.
Recovery Phase…Generally 18 Months
Delays and Disappointments Impact Volatility

www.usfunds.comJanuary 2011 11-026 62
Value Drivers for Superior Performance

www.usfunds.comJanuary 2011 11-026
Superior Stock Performance is Related to Cash Flow Returns from Capital (Money) Invested in New Mines
63

www.usfunds.comJanuary 2011 11-026
Case Study: Gold Mining in Colombia
64

www.usfunds.comJanuary 2011 11-026
Case Study: Resources in Colombia
65
Brian Hicks at the Rubiales Field in Colombia
Pacific Rubiales EnergyMedoro Resources LTD.Gran Colombia Gold
www.usfunds.comJanuary 2011 11-026
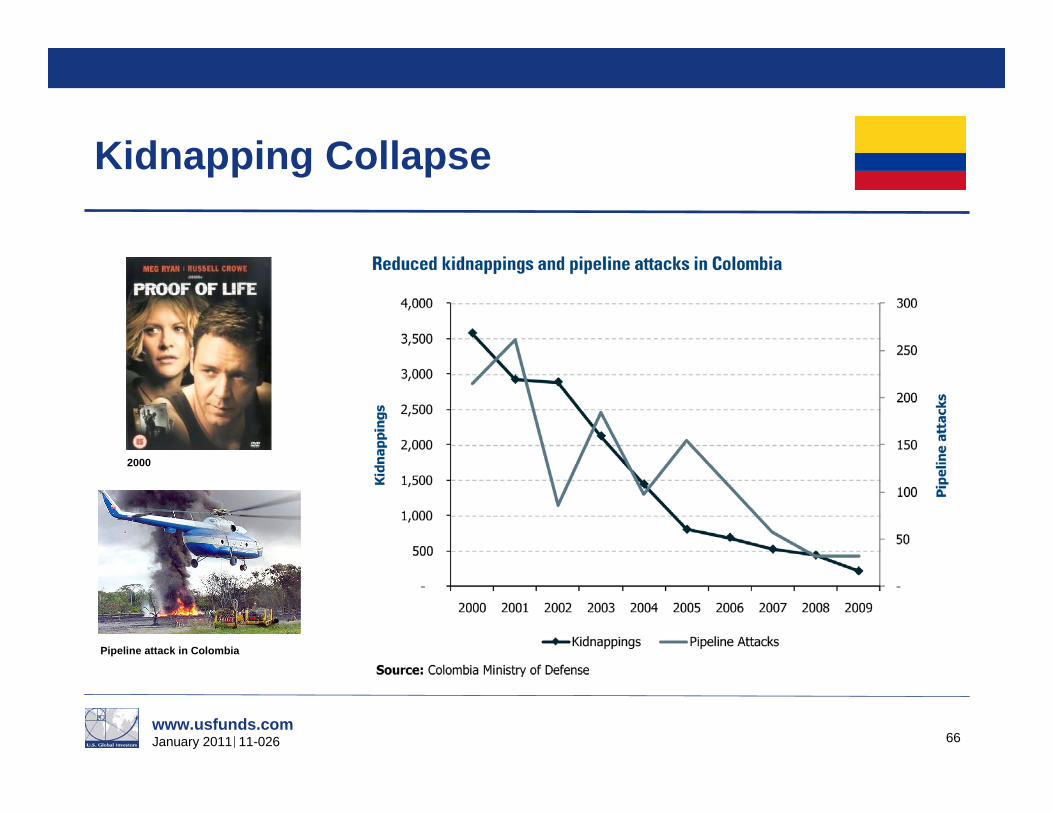
Kidnapping Collapse
66
2000
Pipeline attack in Colombia

www.usfunds.comJanuary 2011 11-026
Justice Budget Expands
67

www.usfunds.comJanuary 2011 11-026
Ease of Doing Business World RankingCompare Colombia to Venezuela
68
Juan Manuel Santos CalderónPresident of the Republic of Colombia
Hugo ChávezPresident of Venezuela

www.usfunds.comJanuary 2011 11-026
Large Scale Gold Deposits
69
Large-scale gold deposits are geologically rare
New deposits arise from exploration and economics (mines are not found, they are made)
Colombia has demonstrated potential for new large-scale deposits (Angostura-Greystar, La Colosa–AngloGold)
Colombia is in the low-hanging fruit stage
Source: Newmont

www.usfunds.comJanuary 2011 11-026
Large Gold Deposits are Rare
70
Source: BMO Capital Markets

www.usfunds.comJanuary 2011 11-026
Colombia has Junior Companies with Large Gold Deposits
71
Source: Bloomberg, BMO Capital Markets Pricing Date August 23, 2010

www.usfunds.comJanuary 2011 11-026
Medoro Resources: Marmato
72
Source: Medoro

www.usfunds.comJanuary 2011 11-026
No Bubble in Gold
73
Source: Dundee Wealth Economics
Is Gold in a Bubble?

www.usfunds.comJanuary 2011 11-026
Importance of Diversification and Rebalancing
74

www.usfunds.comJanuary 2011 11-026 75
Come Visit Us at…
Facebook: www.facebook.com/usfunds
Twitter: www.twitter.com/usfunds
Frank Talk: www.usfunds.com/franktalk
Investor Alert: www.usfunds.com/alert
www.usfunds.comJanuary 2011 11-026 76
Disclosures
All opinions expressed and data provided are subject to change without notice. Some of these opinions may not be appropriate to every investor. Advanced G-20 economies references members of the G-20 whose economies are considered by the IMF to be developed. This includes Canada, United States, Austria, Belgium, France, Greece, Ireland, Italy, Netherlands, Norway, Portugal, Spain, Sweden, Switzerland, United Kingdom, Australia, Japan and Korea. Emerging G-20 economies references members of the G-20 whose economies are considered by the IMF to be emerging. This includes Brazil, India, Indonesia, Hungary, Russia and Saudi Arabia.The Consumer Price Index (CPI) is one of the most widely recognized price measures for tracking the price of a market basket of goods and services purchased by individuals. The weights of components are based on consumer spending patterns. M2 Money Supply is a broad measure of money supply that includes M1 in addition to all time-related deposits, savings deposits, and non-institutional money-market funds. The MSCI Emerging Markets Index is a free float-adjusted market capitalization index that is designed to measure equity market performance in the global emerging markets. The S&P 500 Stock Index is a widely recognized capitalization-weighted index of 500 common stock prices in U.S. companies. The NYSE Arca Gold BUGS (Basket of Unhedged Gold Stocks) Index (HUI) is a modified equal dollar weighted index of companies involved in gold mining. The HUI Index was designed to provide significant exposure to near term movements in gold prices by including companies that do not hedge their gold production beyond 1.5 years. Standard deviation is a measure of the dispersion of a set of data from its mean. The more spread apart the data, the higher the deviation. Standard deviation is also known as historical volatility. Although Lipper makes reasonable efforts to ensure the accuracy and reliability of the data contained herein, the accuracy is not guaranteed by Lipper. Users acknowledge that they have not relied upon any warranty, condition, guarantee, or representation made by Lipper. Any use of the data for analyzing, managing, or trading financial instruments is at the user's own risk. This is not an offer to buy or sell securities. The following securities mentioned in the presentation were held by one or more of U.S. Global Investors Funds as of 9/30/10: Centamin Egypt, Pacific Rubiales, Medoro Resources, Gran Colombia Gold, El Dorado, Kinross Gold, Barrick Gold, IAMGold, Goldcorp, Agnico Eagle Mines, Yamana, Newmont Mining, Nova Gold Resources, Crystallex International, Great Basin Gold, Greystar Resources. R-squared is a statistical measure that represents the percentage of a fund or security's movements that can be explained by movements in a benchmark index. R-squared values range from 0 to 100. An R-squared of 100 means that all movements of a security are completely explained by movements in the index. Diversification does not protect an investor from market risks and does not assure a profit.