u.s. geological survey final technical report award no
TRANSCRIPT
-1-
U.S. Geological Survey Final Technical Report
Award No.: G15AP00062 Project Title: Integrated 3-D Seismotectonic-Velocity Model of
the Salton Trough Region based on Seismicity and Explosive Shots from the Salton Seismic Imaging Project
Name of Institution: California State Polytechnic University Principal Investigator: Dr. Patricia Persaud (Author) Dept. of Geological Sciences
California State Polytechnic University 3801 W. Temple Ave Pomona, CA 91768 Phone: 626-354-5053 Fax: 909-869-2920 [email protected]
Government Technical Officer: Elizabeth Lemersal
External Research Support Manager Earthquake Hazards Program, USGS
Term covered by award: 15 April 2015 – 14 April 2016 Research supported by the U.S. Geological Survey (USGS), Department of the Interior, under USGS Award No. G15AP00062. The views and conclusions contained in this document are those of the authors and should not be interpreted as necessary representing the official policies, either expressed or implied of the U.S. Government.
-2-
Integrated 3-D Seismotectonic-Velocity Model of the Salton Trough Region based on Seismicity and Explosive Shots from the Salton Seismic Imaging Project
U.S. Geological Survey Award No. G15AP00062
Key words: Salton Trough, tectonics, geophysics, seismology.
Patricia Persaud Dept. of Geological Sciences California State Polytechnic University 3801 W. Temple Ave Pomona, CA 91768 Phone: 626-354-5053 Fax: 909-869-2920 [email protected]
ABSTRACT Our goal is to build a 3-D Seismotectonic-Velocity Model of the Salton Trough of
Southern California, a region of high seismic hazard. Our approach integrates explosive shots from the Salton Seismic Imaging Project (SSIP) and seismicity, and provides an update to the models used in ground-motion simulations to assess seismic hazard. Because of the tectonic and geologic complexity of the Salton Trough, which includes the Imperial and Coachella Valleys, this project is divided into two main parts that focus on those geographic subregions. (1) We first combine data from recently relocated earthquakes and explosive shots from the SSIP and IV1979 along with knowledge of the active faults, seismicity lineaments and gravity anomalies to produce an up-to-date 3-D Seismotectonic-Velocity model of the Imperial Valley located south of the Salton Sea. We also produce a 2-D velocity model for SSIP-Line 2, a 220 km long profile that trends roughly perpendicular to the rift axis in the Imperial Valley. This work is published in Persaud et al. (2016b). (2) We provide a 3-D P-wave velocity model for the Coachella Valley located north of the Salton Sea based on shots from the SSIP, and a 2-D velocity model for SSIP-Line 5 that crosses the Banning and Mission Creek faults, the main fault strands of the San Andreas fault (SAF) system in the Coachella Valley.
Preliminary results for Line 5, which extends from the Peninsular Ranges in the southwest to the Little San Bernardino Mountains in the northeast, also include forward model ray tracing, gravity modeling, and fault imaging with the line migration of reflectors. Integration of these results shows the structural complexities of the study area, such as a dome-like basement structure associated with a zone of high velocities (VP> 6.0 km/s) located at ~1.5-2 km depth over a lateral distance of ~15 km with its eastern edge marked by a ~70° NE-dipping interface. This zone of high velocities is needed to get the best-fit curve to the observed travel times, and a good fit to the observed gravity data. Our estimated basin depths are in agreement with basement contours from Langenheim et al. (2005) based on their inversion of gravity data. Additional fault imaging shows the Banning fault has a ~62° NE dip along Line 5, similar to the dips estimated for faults in the SAF zone along other seismic profiles in the Coachella Valley. INTRODUCTION
Ongoing oblique slip at the Pacific-North America plate boundary in the Salton Trough, Southern California produced the Coachella and Imperial Valleys (Fig. 1), seismically active regions with deformation distributed across a complex network of exposed and buried faults. The Imperial Valley, located south of the Salton Sea (Fig. 2), formed in the transtensional zone encompassing the San Jacinto fault, the southern San Andreas fault (SAF), and the Imperial
-3-
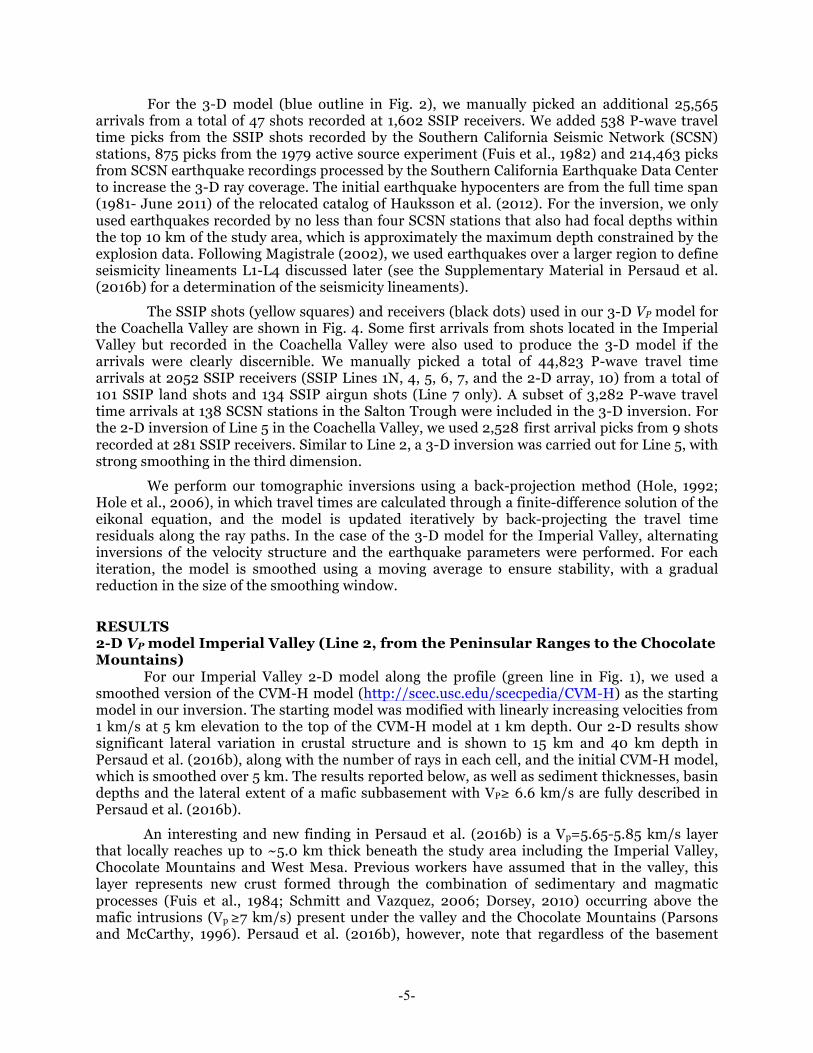
fault (Fig. 2) (e.g., Fuis and Mooney (1990) and references therein). The Imperial Valley is filled with thick sediments deposited by the Colorado River since 5.3 Ma, that were rapidly buried, heated and intermingled with mafic intrusions to form metasedimentary crust (Fuis et al., 1984; Dorsey, 2010). Despite clear seismicity lineaments continuing beneath the Imperial Valley, surface traces of the Superstition Mountain and the Superstition Hills faults are not visible in the valley, possibly due to recent sedimentation by Lake Cahuilla followed by extensive agricultural activity. In this region, earthquakes tend to occur in swarms (e.g., the August 2012 Brawley swarms), often related to the geothermal systems (Hill et al., 1975). Increased recent seismicity in the Salton geothermal area has been attributed by Brodsky and Lajoie (2013) to fluid extraction and injection during geothermal energy production. Earthquake studies suggest that the swarms are generally less than 10 km deep (Johnson and Hadley, 1976; Doser and Kanamori, 1986; Chen and Shearer, 2011; Hauksson et al., 2013); therefore, a more accurate shallow velocity structure is of particular importance for studying the source properties of swarms, and refining earthquake locations (Chu and Helmberger, 2013; Wei et al., 2013).
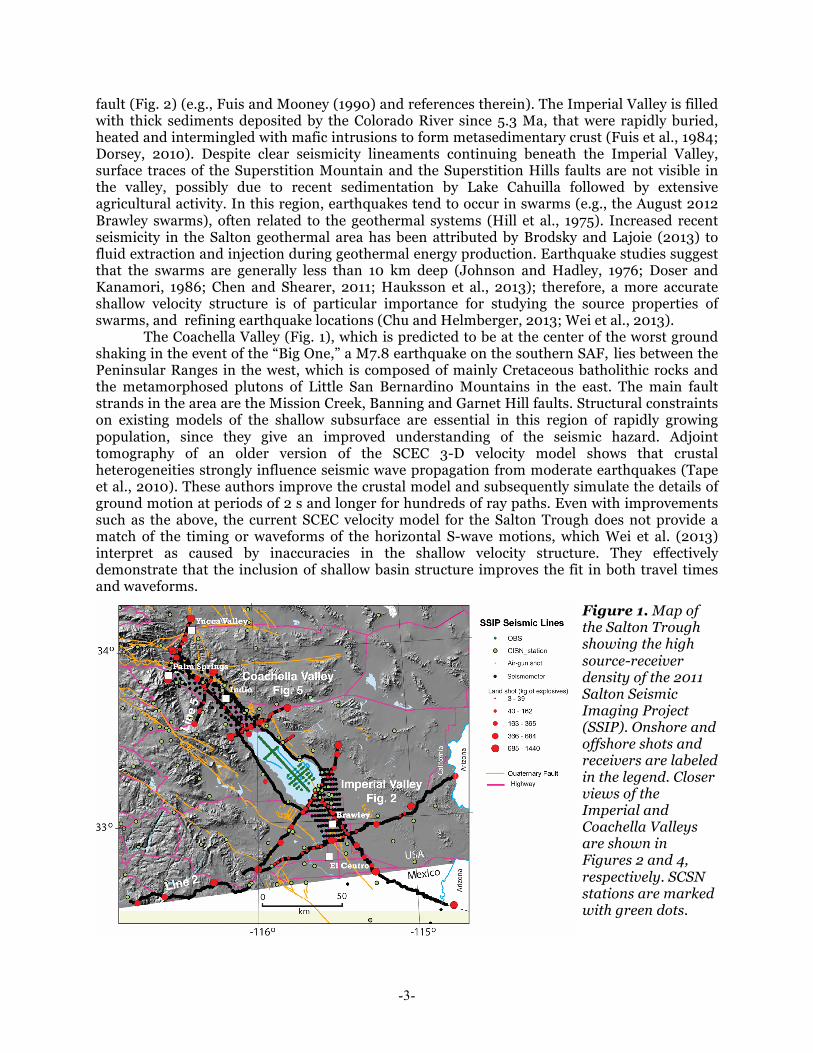
The Coachella Valley (Fig. 1), which is predicted to be at the center of the worst ground shaking in the event of the “Big One,” a M7.8 earthquake on the southern SAF, lies between the Peninsular Ranges in the west, which is composed of mainly Cretaceous batholithic rocks and the metamorphosed plutons of Little San Bernardino Mountains in the east. The main fault strands in the area are the Mission Creek, Banning and Garnet Hill faults. Structural constraints on existing models of the shallow subsurface are essential in this region of rapidly growing population, since they give an improved understanding of the seismic hazard. Adjoint tomography of an older version of the SCEC 3-D velocity model shows that crustal heterogeneities strongly influence seismic wave propagation from moderate earthquakes (Tape et al., 2010). These authors improve the crustal model and subsequently simulate the details of ground motion at periods of 2 s and longer for hundreds of ray paths. Even with improvements such as the above, the current SCEC velocity model for the Salton Trough does not provide a match of the timing or waveforms of the horizontal S-wave motions, which Wei et al. (2013) interpret as caused by inaccuracies in the shallow velocity structure. They effectively demonstrate that the inclusion of shallow basin structure improves the fit in both travel times and waveforms.
Figure 1. Map of the Salton Trough showing the high source-receiver density of the 2011 Salton Seismic Imaging Project (SSIP). Onshore and offshore shots and receivers are labeled in the legend. Closer views of the Imperial and Coachella Valleys are shown in Figures 2 and 4, respectively. SCSN stations are marked with green dots.

-4-
To better understand the shallow crustal structure in the Salton Trough as well as the connectivity of faults and seismicity lineaments, we used data primarily from the Salton Seismic Imaging Project (SSIP) (shots and receivers shown in Fig. 1) to construct a 3-D P-wave velocity model for the Imperial Valley down to 8 km depth, and a velocity profile along Line 2 (Fig. 1) across the Imperial Valley to 15 km depth, both at 1 km grid spacing. For the Coachella Valley (Fig. 1), our 1 km grid spacing 3-D velocity model using only SSIP shot data provides good resolution down to 6 km depth. We also provide a VP profile at 0.2 km grid spacing along Line 5 (Fig. 1), a 37 km long profile across the Coachella Valley. One of the main challenges in developing 3-D velocity models is an uneven stations-source distribution. To better overcome this challenge, we also include the first arrival times of the SSIP shots at the more widely spaced Southern California Seismic Network (SCSN) (Fig. 1) in our inversion, since the layout of the SSIP is complementary to the SCSN.
DATA AND METHOD
The SSIP (Rose et al., 2013) is an extensive project funded by the NSF, SCEC, and USGS designed to gather explosive-source data around the Salton Sea. One contribution from this dataset is to help improve the crustal parameters used in ground-shaking models for the area. A subset of SSIP shots and receivers (Fig. 2. red stars and dots) was used in our inversions for the Imperial Valley. Because of zigzags along the profile (SSIP-Line 2, green line in Fig. 2), we performed a 3-D inversion, but strongly smoothed the third dimension (in-and-out of the plane of the profile) in which structural variations are assumed to be small. For the 2-D model along Line 2, we manually picked 8,636 P-wave first arrivals from 24 shots recorded at 773 SSIP receivers.
Figure 2. Map of the Imperial Valley (Figure 1 in Persaud et al. (2016b)) showing the shots and receivers used in this study from the Salton Seismic Imaging Project (SSIP) the IV1979, and the SCSN stations. The green line shows the location of the profile shown in Persaud et al. (2016b), with distances marked every 10-km by black squares. Faults compiled from Jennings and Bryant (2010), Rockwell et al. (2015) and Fenby and Gastil (1991). BSZ-Brawley Seismic Zone.
-5-
For the 3-D model (blue outline in Fig. 2), we manually picked an additional 25,565 arrivals from a total of 47 shots recorded at 1,602 SSIP receivers. We added 538 P-wave travel time picks from the SSIP shots recorded by the Southern California Seismic Network (SCSN) stations, 875 picks from the 1979 active source experiment (Fuis et al., 1982) and 214,463 picks from SCSN earthquake recordings processed by the Southern California Earthquake Data Center to increase the 3-D ray coverage. The initial earthquake hypocenters are from the full time span (1981- June 2011) of the relocated catalog of Hauksson et al. (2012). For the inversion, we only used earthquakes recorded by no less than four SCSN stations that also had focal depths within the top 10 km of the study area, which is approximately the maximum depth constrained by the explosion data. Following Magistrale (2002), we used earthquakes over a larger region to define seismicity lineaments L1-L4 discussed later (see the Supplementary Material in Persaud et al. (2016b) for a determination of the seismicity lineaments).
The SSIP shots (yellow squares) and receivers (black dots) used in our 3-D VP model for the Coachella Valley are shown in Fig. 4. Some first arrivals from shots located in the Imperial Valley but recorded in the Coachella Valley were also used to produce the 3-D model if the arrivals were clearly discernible. We manually picked a total of 44,823 P-wave travel time arrivals at 2052 SSIP receivers (SSIP Lines 1N, 4, 5, 6, 7, and the 2-D array, 10) from a total of 101 SSIP land shots and 134 SSIP airgun shots (Line 7 only). A subset of 3,282 P-wave travel time arrivals at 138 SCSN stations in the Salton Trough were included in the 3-D inversion. For the 2-D inversion of Line 5 in the Coachella Valley, we used 2,528 first arrival picks from 9 shots recorded at 281 SSIP receivers. Similar to Line 2, a 3-D inversion was carried out for Line 5, with strong smoothing in the third dimension.
We perform our tomographic inversions using a back-projection method (Hole, 1992; Hole et al., 2006), in which travel times are calculated through a finite-difference solution of the eikonal equation, and the model is updated iteratively by back-projecting the travel time residuals along the ray paths. In the case of the 3-D model for the Imperial Valley, alternating inversions of the velocity structure and the earthquake parameters were performed. For each iteration, the model is smoothed using a moving average to ensure stability, with a gradual reduction in the size of the smoothing window.
RESULTS 2-D VP model Imperial Valley (Line 2, from the Peninsular Ranges to the Chocolate Mountains)
For our Imperial Valley 2-D model along the profile (green line in Fig. 1), we used a smoothed version of the CVM-H model (http://scec.usc.edu/scecpedia/CVM-H) as the starting model in our inversion. The starting model was modified with linearly increasing velocities from 1 km/s at 5 km elevation to the top of the CVM-H model at 1 km depth. Our 2-D results show significant lateral variation in crustal structure and is shown to 15 km and 40 km depth in Persaud et al. (2016b), along with the number of rays in each cell, and the initial CVM-H model, which is smoothed over 5 km. The results reported below, as well as sediment thicknesses, basin depths and the lateral extent of a mafic subbasement with VP≥ 6.6 km/s are fully described in Persaud et al. (2016b).
An interesting and new finding in Persaud et al. (2016b) is a Vp=5.65-5.85 km/s layer that locally reaches up to ~5.0 km thick beneath the study area including the Imperial Valley, Chocolate Mountains and West Mesa. Previous workers have assumed that in the valley, this layer represents new crust formed through the combination of sedimentary and magmatic processes (Fuis et al., 1984; Schmitt and Vazquez, 2006; Dorsey, 2010) occurring above the mafic intrusions (Vp ≥7 km/s) present under the valley and the Chocolate Mountains (Parsons and McCarthy, 1996). Persaud et al. (2016b), however, note that regardless of the basement
-6-
type, this layer is thickest near faults, thinning to less than one kilometer elsewhere, and is part of a larger velocity depression, particularly near seismicity lineaments and also east of the along-strike projection of the inactive Algodones fault in East Mesa. Persaud et al. (2016b) therefore suggest that the increased thickness of this layer may in part be an indicator of active or inactive faulting. Furthermore, their final model is ~0.4-1.4 km/s slower than the CVM-H in the shallow crust above LVZ1 (0-4 km profile depth at 80-110 km profile distance). This region is associated with the NE-trends in seismicity or possibly with the Elsinore fault, suggesting a possible faulting-related mechanism for generating the low velocities.
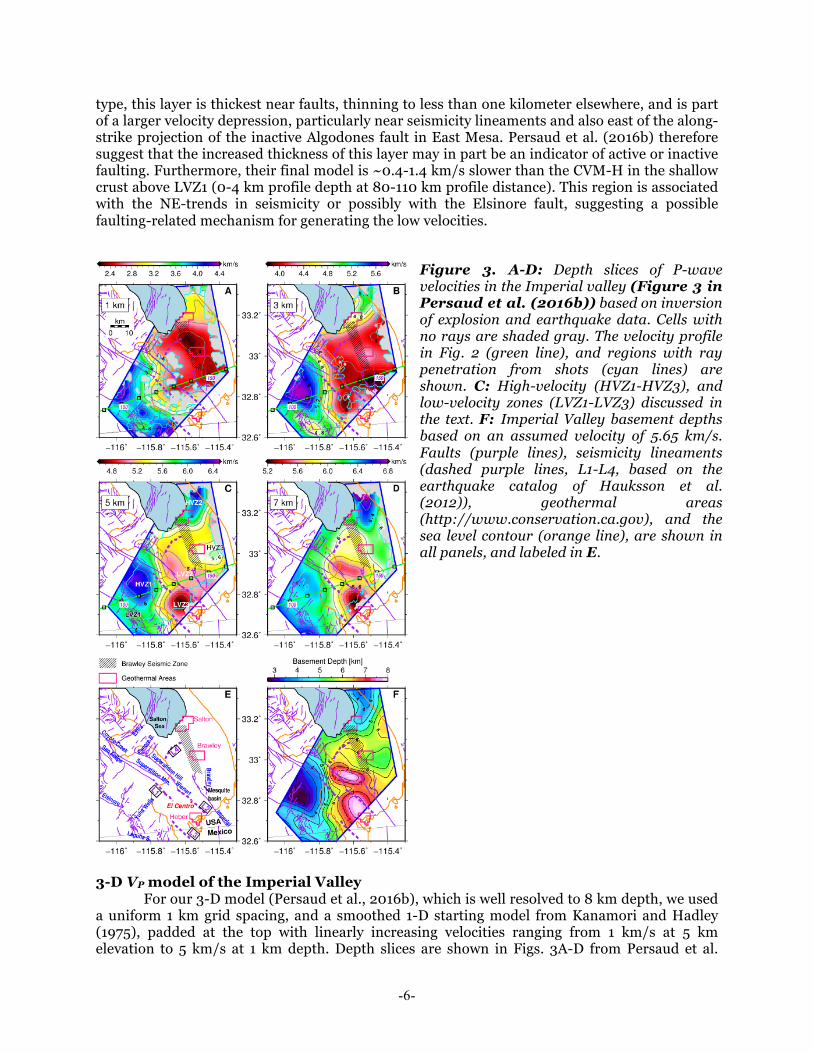
Figure 3. A-D: Depth slices of P-wave velocities in the Imperial valley (Figure 3 in Persaud et al. (2016b)) based on inversion of explosion and earthquake data. Cells with no rays are shaded gray. The velocity profile in Fig. 2 (green line), and regions with ray penetration from shots (cyan lines) are shown. C: High-velocity (HVZ1-HVZ3), and low-velocity zones (LVZ1-LVZ3) discussed in the text. F: Imperial Valley basement depths based on an assumed velocity of 5.65 km/s. Faults (purple lines), seismicity lineaments (dashed purple lines, L1-L4, based on the earthquake catalog of Hauksson et al. (2012)), geothermal areas (http://www.conservation.ca.gov), and the sea level contour (orange line), are shown in all panels, and labeled in E.
3-D VP model of the Imperial Valley
For our 3-D model (Persaud et al., 2016b), which is well resolved to 8 km depth, we used a uniform 1 km grid spacing, and a smoothed 1-D starting model from Kanamori and Hadley (1975), padded at the top with linearly increasing velocities ranging from 1 km/s at 5 km elevation to 5 km/s at 1 km depth. Depth slices are shown in Figs. 3A-D from Persaud et al.
-7-
(2016b), with the cells lacking ray penetration shaded gray. Since the 3-D structure is obtained from both active source (SSIP and IV1979) and earthquake data, we outline the area with ray coverage from the explosive shots in cyan. A more complete description of our study and results is provided in Persaud et al. (2016b).
Important results from Persaud et al. (2016b) include a narrow N-NW trending velocity gradient at the western basin boundary, which mimics the sea level contour (orange line) at 1 km depth (Figs. 3A-D). To highlight the western basin boundary, and the influence of nearby seismicity trends (L1-L4, dashed purple lines) and faults on the shape of basin edges, depths to the 5.65 km/s surface is shown in Fig. 3F, representing approximate basement depths in the valley and a shallower surface outside the valley where basement velocities are typically higher. Figures 3A-D and 3F present complementary views of the structure of the Imperial Valley.
The Mesquite basin appears to be a low-velocity zone at 3-km depth (Persaud et al., 2016b) (Fig. 3B). In contrast, at 5- and 7-km depth, a more prominent low-velocity zone and possible basin (Fig. 3C-D, LVZ2) is located in the left-step between the Superstition Hill and the Imperial faults, to the west of the Mesquite basin. This velocity depression, is ~15-km long, ~8-km deep, symmetric along strike, and coincides with a gravity low (Biehler, 1971). In our inversion of the explosion data only, this feature is deeper at its western end, where it abuts the Superstition Mountain fault, suggesting it may be segmented along axis. Another velocity low and possible basin (LVZ3) is interpreted near the end of the Superstition Hill fault, northwest of the Heber geothermal area (Persaud et al., 2016b) (Figs. 3C-D). This feature appears to be bounded by two NW-trends in seismicity, i.e., by L3, and by the IF, or to a lesser extent L2 (Fig. 3F). The northern end of this feature also coincides with the terminus of L1. Persaud et al. (2016b) note that LVZ3 lies in a poorly imaged region; as such the exact velocities values may be less accurate than elsewhere. It, however, coincides with a gravity low (Biehler, 1971), and an interpreted 9-km wide right-step between the Cerro Prieto and the Superstition Mountain faults (Magistrale, 2002).
Possible support for the continuity of slip between the San Jacinto fault zone and the Cerro Prieto
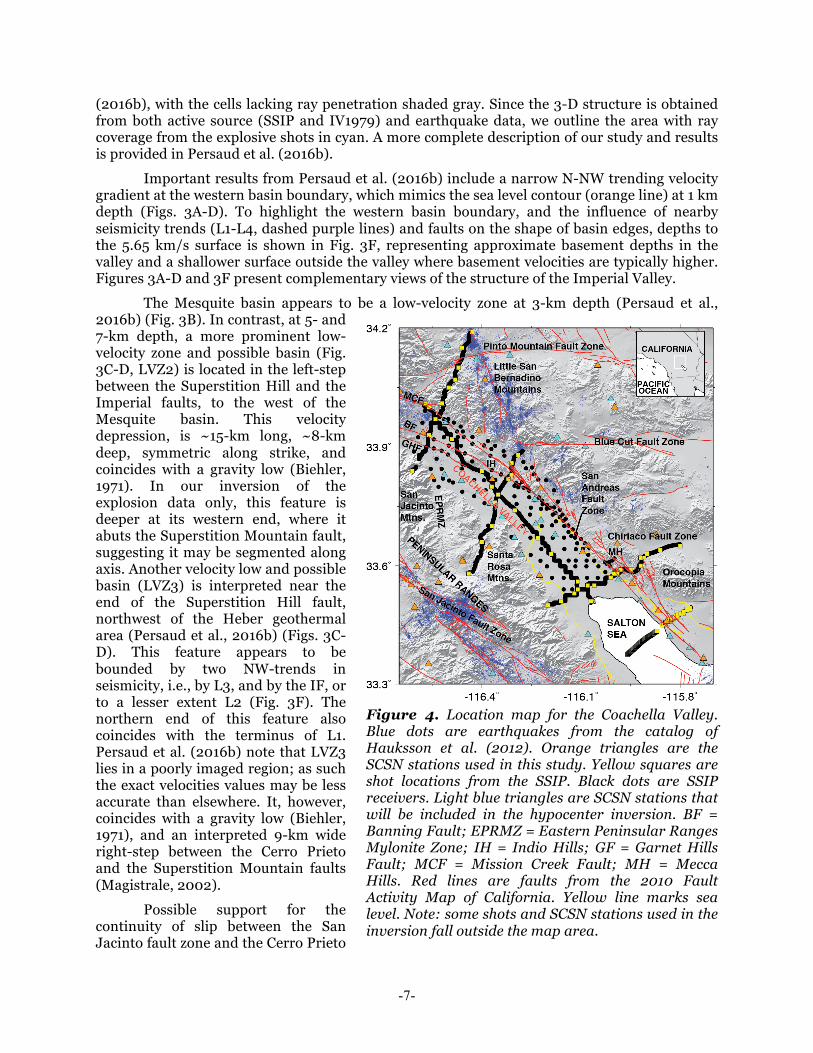
Figure 4. Location map for the Coachella Valley. Blue dots are earthquakes from the catalog of Hauksson et al. (2012). Orange triangles are the SCSN stations used in this study. Yellow squares are shot locations from the SSIP. Black dots are SSIP receivers. Light blue triangles are SCSN stations that will be included in the hypocenter inversion. BF = Banning Fault; EPRMZ = Eastern Peninsular Ranges Mylonite Zone; IH = Indio Hills; GF = Garnet Hills Fault; MCF = Mission Creek Fault; MH = Mecca Hills. Red lines are faults from the 2010 Fault Activity Map of California. Yellow line marks sea level. Note: some shots and SCSN stations used in the inversion fall outside the map area.

-8-
fault suggested by Magistrale (2002), and the existence of a related unmapped hazard in the Imperial Valley 10-20 km west of the Imperial fault (Lindsey and Fialko, 2016) is discussed in Persaud et al. (2016b).
The Salton and Brawley geothermal areas lie in well-imaged regions of our 3-D model. Both geothermal areas are associated with local gravity maxima (Biehler, 1971), and overlie, or are located at the edge of high-velocity zones, HVZ2 and HVZ3 (Persaud et al., 2016b) (Fig. 3C), which at shallow depths probably resulted from cementation, recrystallization, and thermal metamorphism of sediments by circulating hot brines (Elders et al., 1972). Sediment consolidation explains the extremely shallow earthquakes in these areas. At 7-km depth, HVZ2 and HVZ3 appear to merge into an elongated high-velocity zone in the west of our study area, which may form the eastern boundary of the Brawley Seismic Zone (Fig. 3D).
Figure 5. P-wave velocities in the Coachella Valley at 2-, 3-, 4-, 5- and 6-km depths based on inversion of SSIP explosion data. Cells with no rays are shaded white based on the ray coverage. Red lines are faults from the 2010 Fault Activity Map of California (see fault labels in Fig. 4). Shots and receivers are the same as in Fig. 4. 3-D VP model of the Coachella Valley
We provide a preliminary 1 km grid spacing 3-D P-wave velocity model for the Coachella Valley based on a subset of 126 explosive shots (yellow squares in Fig. 4) recorded across a 2-D seismic array and 5 profiles (SSIP Lines 1N, 4, 5, 6, 7 & 10; black dots in the map in Fig. 4). We also included travel times from SSIP shots recorded at SCSN stations (Fig. 4). Some of the shots used in our 3-D inversion lie outside the map area in the Imperial Valley to the south. Our preliminary 3-D velocity model shows good resolution down to 6 km depth within and southwest of the Coachella Valley (Fig. 5).
In general, there is an overall pattern in the top ~3 km that reflects the surface geology (Fig. 5). At shallow depths, an elongated trough of low-velocity sediments located mainly west of the SAF underlies the Coachella Valley (Fig. 5). Three subbasins associated with velocity lows are noted along the strike of SAF. The subbasin in the central valley flattens out to the east, possibly associated with the Chiriaco fault zone (Figs. 5 and 6) that appears to align with this basin. Another basin to the north that merges to the east of the SAF shows a similar pattern in

-9-
association with the Blue Cut fault zone (Figs. 4 and 5). In our 3-D model, velocities of 5.5 km/s or lower extend down to minimum depths of 6 km. Changes in subbasin shape are also associated with bedrock promontories in the Coachella Valley, e.g., Point Happy near Line 5. Basin geometry and depth (based on the 5.5 km/s surface) vary along strike of the SAF and likely reveal the irregular shape of the underlying Peninsular Ranges basement. 2-D VP model Coachella Valley (Line 5)
The location of Line 5 in the Coachella Valley is shown in Fig. 6 with the preliminary results from our tomographic inversion provided in Fig. 7B based on a starting model with linearly increasing velocities. The line extends 37 km from the Peninsular Ranges to the Little San Bernardino Mountains crossing the major strands of the SAF Zone. Based on the broad range in velocities noted in this profile at shallow depths, we took a structure-based approach to confirm our interpretation of the major features in the 2-D tomography, and give details on basement depths, fault zones and basin geometry. We created and analyzed 1-D and 2-D forward models from ray tracing by analyzing first arrivals from nine 65–911 kg explosive SSIP shots recorded along the profile (Fig. 6). We began by fitting predicted travel time curves based
on 1-D P-wave velocity models to the observed first-arrival picks for each shot using MacRay from Luetgert (1988) to produce separate best fit 1-D VP models for travel time arrivals east and west of each individual shot. Next we produced a 2-D VP model that provides the best fit to the east and west branches of all observed travel time curves (Fig. 7A) (Hernandez et al., 2015a, b).
In general, the 1-D models east of individual shots have deeper basement contacts and lower apparent velocities, ~5 km/s at 4 km depth, whereas the models west of individual shots have shallower basement and velocities up to 6 km/s at 2 km depth. Mismatches in basement depths (assuming 5-6 km/s) between individual 1-D models indicate a shallowly dipping basement, deepening eastward towards the Banning Fault and shoaling abruptly farther east. An
east-dipping structure in the 2-D model (A in Fig. 7A) also gives a better fit than flat-lying layers. Based on high-velocity zones derived from travel times at 9-20 km distance from the western end of the line (B2 in Fig. 7A), we included an offset from ~2 km to 4 km depth (B3 in Fig. 7A) associated with a dome-like basement structure near the middle of the line, which significantly improved the 2-D model fit.
We also inferred the geometry of near-vertical faults from the pre-stack line migration method of Bauer et al. (2013) (Fig. 8, also see Bauer et al. (2015)). Preliminary results for Line 5
Figure 6. Map from Hernandez et al. (2015a) with the receivers along Line 5 shown as black dots on a geologic map of the study area modified from Dorsey and Langenheim (2015). The nine shots are marked with red squares with shot numbers given in the legend. Basement depths in kilometers from Langenheim et al. (2005) are shown as red contours. Earthquakes are marked with blue dots from Hauksson et al. (2012) and faults are black lines based on the 2010 California Fault Activity Map.
-10-
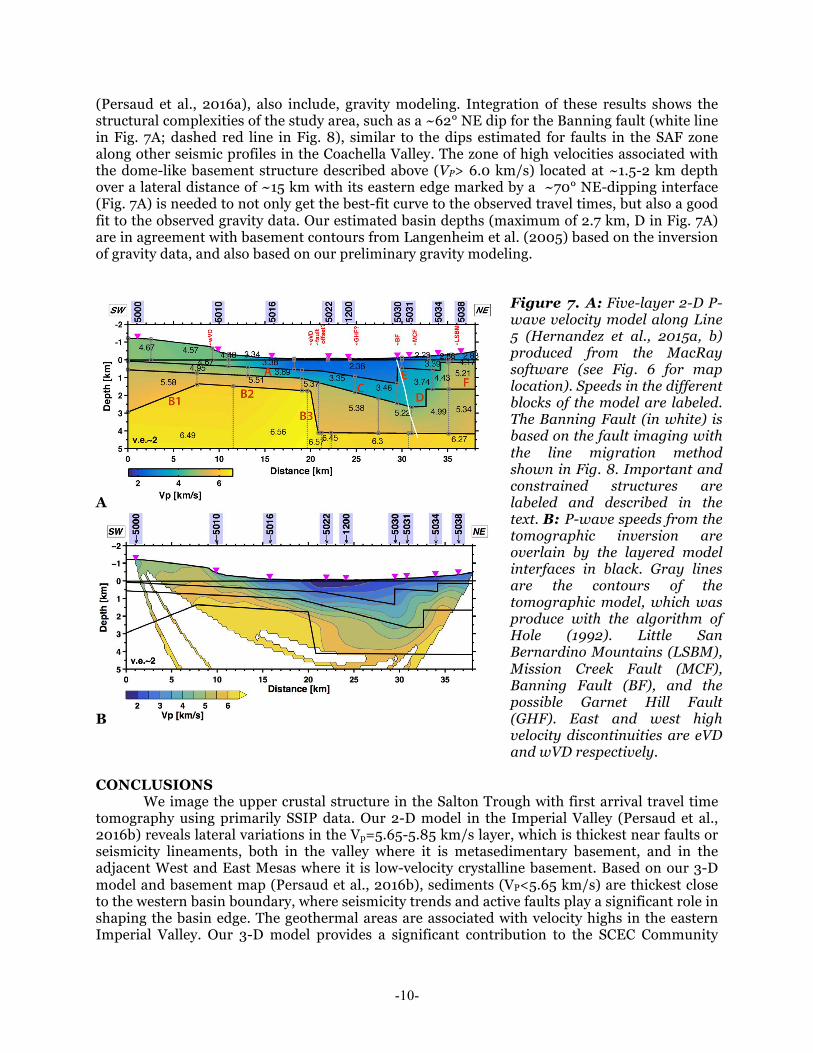
(Persaud et al., 2016a), also include, gravity modeling. Integration of these results shows the structural complexities of the study area, such as a ~62° NE dip for the Banning fault (white line in Fig. 7A; dashed red line in Fig. 8), similar to the dips estimated for faults in the SAF zone along other seismic profiles in the Coachella Valley. The zone of high velocities associated with the dome-like basement structure described above (VP> 6.0 km/s) located at ~1.5-2 km depth over a lateral distance of ~15 km with its eastern edge marked by a ~70° NE-dipping interface (Fig. 7A) is needed to not only get the best-fit curve to the observed travel times, but also a good fit to the observed gravity data. Our estimated basin depths (maximum of 2.7 km, D in Fig. 7A) are in agreement with basement contours from Langenheim et al. (2005) based on the inversion of gravity data, and also based on our preliminary gravity modeling.
A
Figure 7. A: Five-layer 2-D P-wave velocity model along Line 5 (Hernandez et al., 2015a, b) produced from the MacRay software (see Fig. 6 for map location). Speeds in the different blocks of the model are labeled. The Banning Fault (in white) is based on the fault imaging with the line migration method shown in Fig. 8. Important and constrained structures are labeled and described in the text. B: P-wave speeds from the tomographic inversion are overlain by the layered model interfaces in black. Gray lines are the contours of the tomographic model, which was produce with the algorithm of Hole (1992). Little San Bernardino Mountains (LSBM), Mission Creek Fault (MCF), Banning Fault (BF), and the possible Garnet Hill Fault (GHF). East and west high velocity discontinuities are eVD and wVD respectively.
B
CONCLUSIONS We image the upper crustal structure in the Salton Trough with first arrival travel time
tomography using primarily SSIP data. Our 2-D model in the Imperial Valley (Persaud et al., 2016b) reveals lateral variations in the Vp=5.65-5.85 km/s layer, which is thickest near faults or seismicity lineaments, both in the valley where it is metasedimentary basement, and in the adjacent West and East Mesas where it is low-velocity crystalline basement. Based on our 3-D model and basement map (Persaud et al., 2016b), sediments (VP<5.65 km/s) are thickest close to the western basin boundary, where seismicity trends and active faults play a significant role in shaping the basin edge. The geothermal areas are associated with velocity highs in the eastern Imperial Valley. Our 3-D model provides a significant contribution to the SCEC Community
-11-
Fault Model (CFM) and SCEC Community Velocity Model (CVM-H) and will be readily available for refinement of future seismic hazard maps.
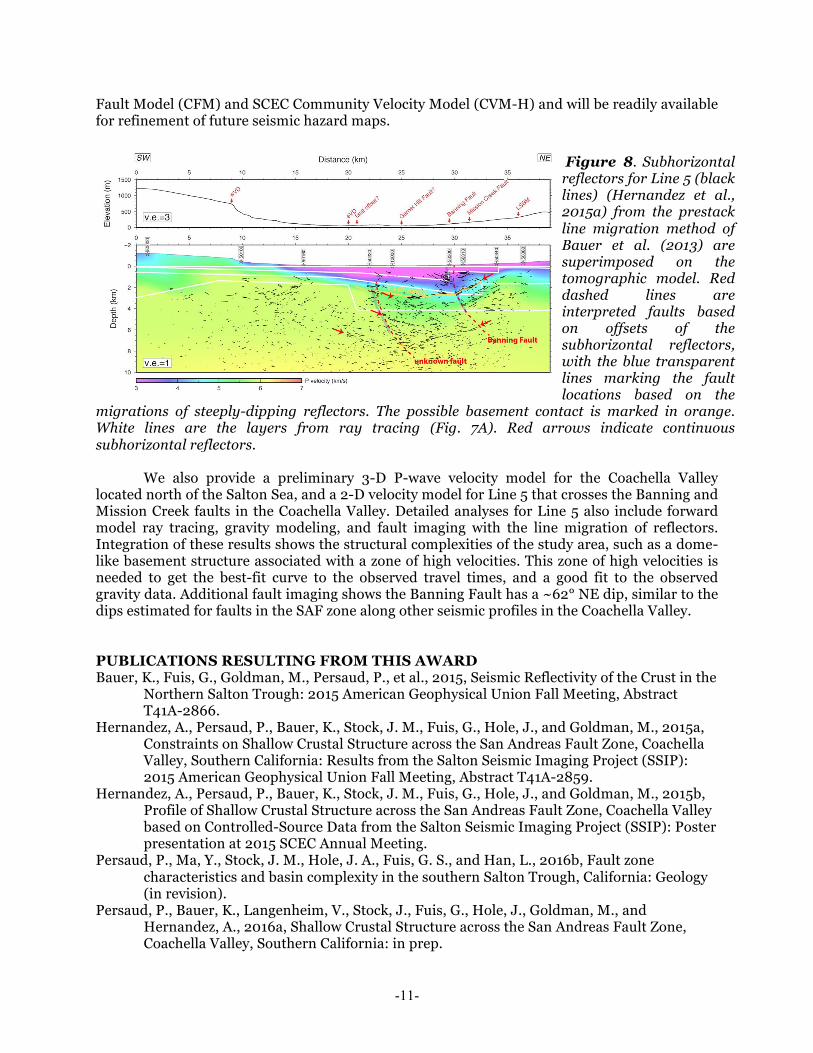
Figure 8. Subhorizontal reflectors for Line 5 (black lines) (Hernandez et al., 2015a) from the prestack line migration method of Bauer et al. (2013) are superimposed on the tomographic model. Red dashed lines are interpreted faults based on offsets of the subhorizontal reflectors, with the blue transparent lines marking the fault locations based on the
migrations of steeply-dipping reflectors. The possible basement contact is marked in orange. White lines are the layers from ray tracing (Fig. 7A). Red arrows indicate continuous subhorizontal reflectors.
We also provide a preliminary 3-D P-wave velocity model for the Coachella Valley located north of the Salton Sea, and a 2-D velocity model for Line 5 that crosses the Banning and Mission Creek faults in the Coachella Valley. Detailed analyses for Line 5 also include forward model ray tracing, gravity modeling, and fault imaging with the line migration of reflectors. Integration of these results shows the structural complexities of the study area, such as a dome-like basement structure associated with a zone of high velocities. This zone of high velocities is needed to get the best-fit curve to the observed travel times, and a good fit to the observed gravity data. Additional fault imaging shows the Banning Fault has a ~62° NE dip, similar to the dips estimated for faults in the SAF zone along other seismic profiles in the Coachella Valley. PUBLICATIONS RESULTING FROM THIS AWARD Bauer, K., Fuis, G., Goldman, M., Persaud, P., et al., 2015, Seismic Reflectivity of the Crust in the
Northern Salton Trough: 2015 American Geophysical Union Fall Meeting, Abstract T41A-2866.
Hernandez, A., Persaud, P., Bauer, K., Stock, J. M., Fuis, G., Hole, J., and Goldman, M., 2015a, Constraints on Shallow Crustal Structure across the San Andreas Fault Zone, Coachella Valley, Southern California: Results from the Salton Seismic Imaging Project (SSIP): 2015 American Geophysical Union Fall Meeting, Abstract T41A-2859.
Hernandez, A., Persaud, P., Bauer, K., Stock, J. M., Fuis, G., Hole, J., and Goldman, M., 2015b, Profile of Shallow Crustal Structure across the San Andreas Fault Zone, Coachella Valley based on ControlledSource Data from the Salton Seismic Imaging Project (SSIP): Poster presentation at 2015 SCEC Annual Meeting.
Persaud, P., Ma, Y., Stock, J. M., Hole, J. A., Fuis, G. S., and Han, L., 2016b, Fault zone characteristics and basin complexity in the southern Salton Trough, California: Geology (in revision).
Persaud, P., Bauer, K., Langenheim, V., Stock, J., Fuis, G., Hole, J., Goldman, M., and Hernandez, A., 2016a, Shallow Crustal Structure across the San Andreas Fault Zone, Coachella Valley, Southern California: in prep.
-12-
REFERENCES Bauer, K., Fuis, G., Goldman, M., Persaud, P., et al., 2015, Seismic Reflectivity of the Crust in the
Northern Salton Trough: 2015 American Geophysical Union Fall Meeting, Abstract T41A-2866.
Bauer, K., Ryberg, T., Fuis, G. S., and Lüth, S., 2013, Seismic Imaging of the Waltham Canyon Fault, California: Comparison of Ray‐Theoretical and Fresnel Volume Prestack Depth Migration: Bulletin of the Seismological Society of America, v. 103, no. 1, p. 340-352.
Biehler, S., 1971, Gravity studies in the Imperial Valley: United States, University of California at Riverside, Education Research Service : Riverside, CA, United States, p. 29-41.
Brodsky, E. E., and Lajoie, L. J., 2013, Anthropogenic seismicity rates and operational parameters at the Salton Sea Geothermal Field: Science, v. 341, no. 6145, p. 543-546.
Chen, X., and Shearer, P., 2011, Comprehensive analysis of earthquake source spectra and swarms in the Salton Trough, California: Journal of Geophysical Research: Solid Earth, v. 116, no. B09309, DOI: 10.1029/2011JB008263.
Chu, R., and Helmberger, D. V., 2013, Source parameters of the shallow 2012 Brawley earthquake, Imperial Valley: Bulletin of the Seismological Society of America, v. 103, no. 2A, p. 1141-1147, DOI: 10.1785/0120120324.
Dorsey, R. J., 2010, Sedimentation and crustal recycling along an active oblique-rift margin: Salton Trough and northern Gulf of California: Geology, v. 38, no. 5, p. 443-446.
Dorsey, R. J., and Langenheim, V. E., 2015, Crustal-scale tilting of the central Salton block, southern California: Geosphere, DOI: 10.1130/ges01167.1.
Doser, D. I., and Kanamori, H., 1986, Depth of seismicity in the Imperial Valley region (1977–1983) and its relationship to heat flow, crustal structure and the October 15, 1979, earthquake: Journal of Geophysical Research: Solid Earth, v. 91, no. B1, p. 675-688.
Elders, W. A., Rex, R. W., Robinson, P. T., Biehler, S., and Meidav, T., 1972, Crustal Spreading in Southern California: Science, v. 178, no. 4056, p. 15-24.
Fenby, S. S., and Gastil, R. G., 1991, Geologic-tectonic map of the Gulf of California and surrounding areas, in Dauphin, J. P., and Simoneit, B. R. T., eds., The Gulf and Peninsular Provinces of the Californias, American Association of Petroleum Geologists Memoir 47: Tulsa, Oklahoma, p. 79–83.
Fuis, G., Mooney, W., Healy, J., McMechan, G., and Lutter, W., 1984, A seismic refraction survey of the Imperial Valley region, California: Journal of Geophysical Research: Solid Earth, v. 89, no. B2, p. 1165-1189.
Fuis, G. S., and Mooney, W. D., 1990, Lithospheric structure and tectonics from seismic-refraction and other data: US Geological Survey Professional Paper, v. 1515, p. 207-236.
Fuis, G. S., Mooney, W. D., Healey, J. H., McMechan, G., and Lutter, W., 1982, Crustal structure of the Imperial Valley region: US Geological Survey Professional Paper, v. 1254, p. 25-49.
Hauksson, E., Stock, J., Bilham, R., Boese, M., Chen, X., Fielding, E. J., Galetzka, J., Hudnut, K. W., Hutton, K., and Jones, L. M., 2013, Report on the August 2012 Brawley Earthquake Swarm in Imperial Valley, Southern California: Seismological Research Letters, v. 84, no. 2, p. 177-189.
Hauksson, E., Yang, W., and Shearer, P. M., 2012, Waveform relocated earthquake catalog for Southern California (1981 to June 2011): Bulletin of the Seismological Society of America, v. 102, no. 5, p. 2239-2244.
Hernandez, A., Persaud, P., Bauer, K., Stock, J. M., Fuis, G., Hole, J., and Goldman, M., 2015a, Constraints on Shallow Crustal Structure across the San Andreas Fault Zone, Coachella Valley, Southern California: Results from the Salton Seismic Imaging Project (SSIP): 2015 American Geophysical Union Fall Meeting, Abstract T41A-2859.
-13-
Hernandez, A., Persaud, P., Bauer, K., Stock, J. M., Fuis, G., Hole, J., and Goldman, M., 2015b, Profile of Shallow Crustal Structure across the San Andreas Fault Zone, Coachella Valley based on Controlled-Source Data from the Salton Seismic Imaging Project (SSIP): Poster presentation at 2015 SCEC Annual Meeting.
Hill, D. P., Mowinckel, P., and Peake, L. G., 1975, Earthquakes, active faults, and geothermal areas in the Imperial Valley, California: Science, v. 188, no. 4195, p. 1306-1308.
Hole, J., 1992, Nonlinear high‐resolution three‐dimensional seismic travel time tomography: Journal of Geophysical Research: Solid Earth (1978–2012), v. 97, no. B5, p. 6553-6562.
Hole, J., Ryberg, T., Fuis, G., Bleibinhaus, F., and Sharma, A., 2006, Structure of the San Andreas fault zone at SAFOD from a seismic refraction survey: Geophysical Research Letters, v. 33, no. L07312, DOI: 10.1029/2005GL025194.
Jennings, C. W., and Bryant, W. A., 2010, Fault activity map of California: California Geological Survey Geologic Data Map No. 6, map scale 1:750,000.
Johnson, C. E., and Hadley, D. M., 1976, Tectonic implications of the Brawley earthquake swarm, Imperial Valley, California, January 1975: Bulletin of the Seismological Society of America, v. 66, no. 4, p. 1133-1144.
Kanamori, H., and Hadley, D., 1975, Crustal structure and temporal velocity change in southern California, Earthquake Prediction and Rock Mechanics, Springer, p. 257-280.
Langenheim, V. E., Jachens, R. C., Matti, J. C., Hauksson, E., Morton, D. M., and Christensen, A., 2005, Geophysical evidence for wedging in the San Gorgonio Pass structural knot, southern San Andreas fault zone, southern California: Geological Society of America Bulletin, v. 117, no. 11-12, p. 1554-1572, DOI: 10.1130/b25760.1.
Lindsey, E. O., and Fialko, Y., 2016, Geodetic constraints on frictional properties and earthquake hazard in the Imperial Valley, Southern California: Journal of Geophysical Research: Solid Earth, v. 121, no. 2, p. 1097-1113, DOI: 10.1002/2015JB012516.
Luetgert, J. H., 1988, User’s Manual for RAY84/R83PLT – Interactive Two-Dimensional Raytracing/Synthetic Seismogram Package: U.S. Geological Survey Open File Report 88-238.
Magistrale, H., 2002, The relation of the southern San Jacinto fault zone to the Imperial and Cerro Prieto faults: Special Paper - Geological Society of America, v. 365, p. 271-278.
Parsons, T., and McCarthy, J., 1996, Crustal and upper mantle velocity structure of the Salton Trough, southeast California: Tectonics, v. 15, no. 2, p. 456-471.
Persaud, P., Bauer, K., Langenheim, V., Stock, J., Fuis, G., Hole, J., Goldman, M., and Hernandez, A., 2016a, Shallow Crustal Structure across the San Andreas Fault Zone, Coachella Valley, Southern California: in prep.
Persaud, P., Ma, Y., Stock, J. M., Hole, J. A., Fuis, G. S., and Han, L., 2016b, Fault zone characteristics and basin complexity in the southern Salton Trough, California: Geology (in revision).
Rockwell, T. K., Fletcher, J. M., Teran, O. J., Hernandez, A. P., Mueller, K. J., Salisbury, J. B., Akciz, S. O., and Štěpančíková, P., 2015, Reassessment of the 1892 Laguna Salada Earthquake: Fault Kinematics and Rupture Patterns: Bulletin of the Seismological Society of America, DOI: 10.1785/0120140274.
Rose, E. J., Fuis, G. J., Stock, J. M., Hole, J., et al., 2013, Report for Borehole Explosion Data Acquired in the 2011 Salton Seismic Imaging Project (SSIP), Southern California: Description of the Survey (Open-File Report No. 2013-1172). U.S. Geological Survey.
Schmitt, A., and Vazquez, J., 2006, Alteration and remelting of nascent oceanic crust during continental rupture: Evidence from zircon geochemistry of rhyolites and xenoliths from the Salton Trough, California: Earth and Planetary Science Letters, v. 252, no. 3, p. 260-274.
-14-
Tape, C., Liu, Q., Maggi, A., and Tromp, J., 2010, Seismic tomography of the Southern California crust based on spectral-element and adjoint methods: Geophysical Journal International, v. 180, no. 1, p. 433-462, DOI: 10.1111/j.1365-246X.2009.04429.x.
Wei, S., Helmberger, D., Owen, S., Graves, R. W., Hudnut, K. W., and Fielding, E. J., 2013, Complementary slip distributions of the largest earthquakes in the 2012 Brawley swarm, Imperial Valley, California: Geophysical Research Letters, v. 40, no. 5, p. 847-852, DOI: 10.1002/grl.50259.