u.s. fresh fruit import market demand analysis: …
TRANSCRIPT
U.S. FRESH FRUIT IMPORT MARKET DEMAND ANALYSIS:
IMPORT ELASTICITIES AND SEASONALITY
A Thesis
by
SULI XU
Submitted to the Office of Graduate and Professional Studies of
Texas A&M University
in partial fulfillment of the requirements for the degree of
MASTER OF SCIENCE
Chair of Committee, David Bessler
Co-Chair of Committee, Marco A. Palma
Committee Members, Ximing Wu
Head of Department, C. Parr Rosson III
May 2016
Major Subject: Agricultural Economics
Copyright 2016 Suli Xu

ii
ABSTRACT
U.S. has consistently been the net importer of fresh fruit over decades. Studies suggest
that the demand for fresh fruit will continue to increase because of the globalization of
markets and U.S. policies. However, the structure of the import mix has changed
dramatically, between 1990-92 and 2010-12. The striking changes of value share are
apparently caused mainly by the preference change of consumers, further elasticity
estimates, as the indicator of consumers’ preference for most fresh fruits, are outdated
and or nonexistent. Outdated import elasticities will cause problems in estimating the
quantity changes, since the incomes and market fundamentals may have already
changed. Seasonality is an import characteristic for the fruit market, the analysis of
seasonality could help producers and market managers identify the market competition
and opportunities. The seasonality change is analyzed mainly based on five-year
monthly average of domestic production and imports amount between1990-94 and 2010-
14. Import elasticities are estimated based on a Nonlinear AIDS model. Through the
seasonality analysis, we find the domestic production season had no significant change
between 1990-94 and 2010-14, whereas, the import window expanded its length.
Imports had no significant sign to compete with domestic production during domestic
production season, on the contrary, imports have supplemented domestic production
during off-season to meet increased U.S. demand. The estimation results show that the
imported fruits are also priced inelastic at market level. Imported grapes are the only
luxury good (relative to their expenditure elasticities). When expenditures increase,

iii
people prefer more imported grapes and less imported apples. Issues of endogeneity and
import versus domestic elasticities are identified but left for future research.

iv
ACKNOWLEDGEMENTS
I would like to express my sincere gratitude to all my committee members: Prof. David
Bessler, Prof. Marco A Palma, Prof Ximing Wu. I learned how to do the research from
the methodology class taught by Prof. Bessler. It gives me a new perspective to look at
what I am doing and what I am going to do. His guidance will always help me in doing
research. Because of the kind help from Prof. Palma, I have a chance to join his weekly
research meeting and exhibit my thesis idea to others. Also, I need to thank Prof. Palma
to invite me to have dinner at his home. It was an unforgettable night. Prof. Wu taught
me econometrics in his class, which helped me a lot in understanding the model.
At last, I would like to thank my parents and my friends. Because of their support and
encouragement, I could complete my degree successfully.
v
TABLE OF CONTENTS
Page
ABSTRACT .......................................................................................................................ii
ACKNOWLEDGEMENTS .............................................................................................. iv
TABLE OF CONTENTS ................................................................................................... v
LIST OF FIGURES ........................................................................................................... vi
LIST OF TABLES ...........................................................................................................vii
CHAPTER I INTRODUCTION ........................................................................................ 1
CHAPTER II LITERATURE REVIEW ABOUT FRESH FRUITS ELASTICITIES ...... 3
CHAPTER III THEORETICAL MODEL ......................................................................... 5
CHAPTER IV DATA AND METHOD ............................................................................. 9
CHAPTER V SEASONALITY ANALYSIS AND RESULTS ...................................... 10
Banana .......................................................................................................................... 10 Apple ............................................................................................................................ 11 Orange .......................................................................................................................... 13 Grape ............................................................................................................................ 15 Avocado ....................................................................................................................... 17 Strawberry .................................................................................................................... 19
CHAPTER VI RESULTS ABOUT IMPORT FRESH FRUIT ELASTICITIES ........... 20
CHAPTER VII CONCLUSIONS .................................................................................... 26
REFERENCES ................................................................................................................. 28
vi
LIST OF FIGURES
Page
Figure 1. Seasonal shipment relationships for domestic and import apple between
1990-94 and 2010-14 ........................................................................................ 10
Figure 2. Seasonal shipment relationships for domestic and import orange between
1990-94 and 2010-14. ....................................................................................... 12
Figure 3. Seasonal shipment relationships for domestic and import grape between
1990-94 and 2010-14. ....................................................................................... 14
Figure 4. Seasonal shipment relationships for domestic and import avocado between
1990-94 and 2010-14. ....................................................................................... 16
Figure 5. Seasonal shipment relationships for domestic and import strawberry
between 1990-94 and 2010-14. ......................................................................... 18
Figure 6. Monthly expenditure shares from 1990 through 2014. ..................................... 20
vii
LIST OF TABLES
Page
Table 1. Estimates of Nonlinear AIDS Model of U.S. Demand for Import
Fresh Fruits. ....................................................................................................... 20
Table 2. Uncompensated Elasticities for Import Fresh Fruits. ......................................... 23
Table 3. Import Expenditure Elasticities for Import Fresh Fruits .................................... 25
1
CHAPTER I
INTRODUCTION
U.S. consumers have benefited from the year-round availability of fresh fruit,
particularly since the 1990s. Fresh fruit imports have risen from $1.68 billion per year in
1990-92 to $6.89 billion per year in 2010-2012 in nominal dollars. These imports
contribute to making up the off-season fruit shortage, providing varieties that differ
from domestically produced, lowering the fruit price in domestic markets and smooth
out price fluctuation( Huang, S. W. 2013). The main suppliers in U.S import market are
banana-exporting countries, the Southern Hemisphere, and NAFTA regions, which
roughly account for 36 percent, 32 percent, and 27 percent of U.S. fresh fruit import
market value, respectively( Huang, S. W. and K. S. Huang 2007). The rapid growth is
attributed to the following main factors: (1) increasing consumer income, people could
spend more money on fresh fruits (2) government policies; to promote a healthy diet,
Dietary Guidelines for Americans was issued every five years to encourage Americans
to consumer more fresh fruits. For import policies, the most significant policy is the
North American Free Trade Agreement (NAFTA) eliminated the trade barriers and
promoted the fresh fruit import dramatically. An additional factor contributing to growth
in fruit trade is (3) Industry promotion programs. Fruit industry associations promote the
consumption of fruits, such as avocados, blueberries, mangoes, by education of
consumers about the nutrition facts and provision of recommendations to add certain
fruits into daily diet. Further factor contributing to fruit import growth include: (4) The
increasing size and diversity of ethnic population, such as Asians, Africans, Caribbean

2
islanders, and Hispanics are prefer to consume more tropical produce meals and (5) The
improvement of techniques, technological innovation to increase the production,
lengthen the production season and enable the fresh fruits to be shipped globally with
high quality at affordable prices (Huang and Huang 2007, Nzaku, K., et al. 2010,
Knutson, R. D., et al. 2014).
U.S. has consistently been the net importer of fresh fruit over decades Palma, M. A., et
al. 2013) and the demand will continue to increase because of the globalization of
markets and U.S. policies ( Knutson, R. D., et al. 2014). However, the structure of the
import mix has changed dramatically, between 1990-92 and 2010-12 ( Huang, S. W.
2013). Even though bananas as the most popular fruit still ranks at the top in U.S. fresh
fruit import market, their value share shrank from nearly 60 percent to around 28
percent, the value market of apples, as the second most popular fruit also declined
significantly, but other tropical fruits, berries, avocados and citrus all increased their
value shares dramatically ( Huang, S. W. and K. S. Huang 2007, Huang, S. W. 2013). In
our study, we focus on five major fresh fruit imports-bananas, grapes, avocados,
oranges, strawberries, and apples. We select these fruits because they account for almost
two-thirds of the total value of fresh imports and they also represent all the general
categories of fresh fruit- tropical , citrus, and non-citrus ( Huang, S. W. 2013).
3
CHAPTER II
LITERATURE REVIEW ABOUT FRESH FRUITS ELASTICITIES
The striking changes of value shares are caused mainly by the preference change of
consumers, whereas elasticity as the indicator of consumers’ preference for most fresh
fruits are outdated and or nonexistent ( Seale Jr, J. L., et al. 2013). Outdated elasticities
will cause problems in estimating the quantity changes since incomes and markets have
already changed ( Knutson, R. D., et al. 2014).
Durham, C. and J. Eales (2010) collected fresh fruit elasticities from 16 previous
studies, of which 10 of these estimated the elasticities of fresh fruit as an aggregate
commodity and nine sources calculated individual fruit elasticities. For fresh fruit as
aggregate commodity, the average own price elasticity was -0.66, the minimum was -
1.32, the maximum was -0.21. For apples, the elasticities were -0.33, -0.72, -0.16,
respectively. For bananas, they were-0.46, -0.74 -0.24. For oranges, they were -0.79, -
1.14, -0.27. They found that fresh fruit was price inelastic at the market level, their
estimates of elasticities based on the retail level were greater than previous results
(previous papers). Hoch, S. J., et al. (1995) found the own price elasticity in a Chicago
grocery chain was also elastic. Herrmann, R. (1998) mentioned that price-inelastic
demand was not necessary at the retail level because of high price competition between
retailers. You, Z., et al. (1996) and Huang, K. S. and B.-H. Lin (2000) showed that
fresh grapes and other import fresh fruit were found to be luxury goods, Nzaku, K., et
al. (2010), (Nzaku, K., et al. 2011) used the AIDS (Almost Ideal Demand System) model
4
incorporating seasonality, trend and NAFTA binary variables to analyze the import
demand for tropical fresh fruit and vegetable imports, and found that banana, import
grapes and other fruit imports were complementary; banana budget share had significant
downward trend but other tropical fruits had positive trend; the seasonality for tropical
fruit and vegetable was significant. Baldwin, K. L. and K. G. Jones (2013) also analyzed
seasonality and substitution of U.S. citrus import demand based on nonlinear AIDS
model incorporating seasonal components and trend.
5
CHAPTER III
THEORETICAL MODEL
The almost ideal demand system is one of the most popular model in demand analysis
proposed by Deaton, A. and J. Muellbauer (1980), in which the expenditure shares as
the dependent variables is a function of price and the related food expenditures as:
Wi =∝i+ ∑ γijlnpj
n
j=1
+ βi ln (X
P)
Where 𝑊𝑖 is the expenditure share associated with banana, orange, apple, strawberry,
avocado, and table grape; ∝i is subsistence consumption share for ith good; pi is the
price for imported fruit i; X is the total expenditure on all imported fresh fruits we study;
and P is the translog price index, which we defined as:
ln(P) = α0 + ∑ αi ln(pi)
n
i=1
+ 0.5 ∑ ∑ γij∗ ln(pi) ln(pj) .
n
j=1
n
i=1
αi, βi, and γij are coefficients to be estimated and γij = (γij∗ + γji
∗ )/2.
Each γij represents 102 times the effect on the ith budget share of a 1 percent change of
𝑝𝑗 with (x/p) held constant. βi represents the change of the ith budget share with respect
to real expenditure with prices remain constant. If βi > 0, the commodity is considered
to be a luxury good, if βi < 0, the commodity is considered to be a necessity. If γij > 0,
goods i and j are substitutes, if γij < 0, they are complements ( Deaton, A. and J.
Muellbauer 1980).
The following constrains should be applied to guarantee the model is consistent with
consumer demand theory:
6
∑ ∝i= 1, ∑ γijni=1 = 0, and ∑ βi = 0 (adding-up property);
∑ γijnj=1 = 0 (Homogeneity)
γij = γji (Symmetry)
One of the main reason for its popularity is that a linear price index could be applied to
the model to replace the nonlinear form index. The Stone price index was introduced
suggested by Deaton, A. and J. Muellbauer (1980), which is defined as:
ln(p) = ∑ Wiln pi
n
i=1
The linear AIDS model has been used extensively and it was more frequently used than
nonlinear form in many previous works. The linear AIDS model is actually an
approximation to the nonlinear model but not derived from a well specified
representation of preferences. The problem using linear AIDS is that Stone index is not
the real index which should satisfy a fundamental property of index numbers. So
approximation properties may be seriously affected by the fact that the Stone price is not
invariant to the changes in the units of measurement of prices ( Moschini, G. 1995).
Therefore, to avoid this problem, the nonlinear AIDS model will be applied in our work.
Arnade, C. and D. Pick (1998) extend their model to incorporate seasonality. The
seasonality could be represented by a variable that consists of interaction term between a
trend variable and a trigonometric variable. The interaction terms could be created for
every frequency and can be used as an exogenous variable in economic model. Arnade,
C., et al. (2005) incorporate seasonality components above in AIDS model. So the final
model is defined as:
7
Wi =∝i+ ∑ γijlnpj
n
j=1
+ βi ln (X
P) + ∑ a1iufu + ∑ a2ivgv +
4
v=1
4
u=1
a3it
fuand gv are seasonal functions defined as fu = cos ((𝑢
𝑧) 𝜋𝑡) and
gv = sin((𝑣
𝑧) 𝜋𝑡), t coincides with the observation number, z=s/2 where s is the
frequency of the data, since we are using monthly data, s=12, u and v represent different
seasonal frequencies of the data, for example if u and v equal 3, then there is three
seasonal cycles in a year.
Since the sum of expenditure is 1, the coefficients of seasonality and trend also have to
satisfy the following condition:
∑ 𝑎1𝑖𝑛𝑖=1 = 0, ∑ 𝑎2𝑖
𝑛𝑖=1 = 0,∑ 𝑎3𝑖
𝑛𝑖=1 = 0.
The AIDS model implies that Marshallian price elasticity for good i with respect to good
j is
ϵijM =
γij − βi(wi − βj ln (XP))
wi− δij
Where δij = 1 if i=j, δij = 0 otherwise.
Expenditure elasticity is given by
𝑒𝑖 =𝛽𝑖
𝑤𝑖+ 1
Marshallian elasticities could be transformed into Hicksian elasticities through the
Slutsky equation.
ϵijH = ϵij
M + 𝑤𝑖 ∗ 𝑒𝑖
8
Below we estimate Import Elasticities. This is somewhat at variance with standard
elasticity estimation, where one looks at both imports and domestic production. So our
study provides import elasticities. Our reason for taking this (admittedly non-standard
approach) is that we wanted to focus just on imports and not add the complication of
domestic production. Further research might well look at both imports and domestic
production as separate goods, similar to the approach taken by Armington-like demand
systems (Armington, P. S. 1969). This would have given us a 12 commodity study,
which, while certainly doable, was deemed beyond the scope of the MS Thesis.
9
CHAPTER IV
DATA AND METHOD
We will use the monthly import price, import quantities and domestic quantities for
banana, apple, orange, strawberry, avocado, and grapes between 1990 and 2014 from
U.S. Department of Commerce, U.S. census Bureau, Foreign Trade and ERS
calculations using census trade statistic. The expenditure share for each good will be
calculated by the import price and quantity, the price for each good will be divided by its
price mean to get mean scaled price data (Goodwin, B. 2008). Since the sum of the
expenditure share is 1, one of the share equations is deleted to avoid the singularity, we
will drop the banana share equation (Actually it does not matter which one will be
eliminated, we can recover the parameters by adding up property). The nonlinear AIDs
model will be estimated by applying the MODEL procedure and the econometric
method of ITSUR (iterated seemingly unrelated regression) in SAS computer program
(Goodwin, B. 2008). Then the import elasticities will be calculated at the mean value of
the observation based on the formulas above. Since we only focus on the import market,
all the import elasticities we calculate are import elasticities. The seasonality change will
be analyzed mainly based on five-year monthly average of domestic production and
imports between1990-94 and 2010-14, simple graphs will apply in my analysis. Since
the production of banana in U.S is very trivial, we do not report the graph analysis for
banana.
10
CHAPTER V
SEASONALITY ANALYSIS AND RESULTS
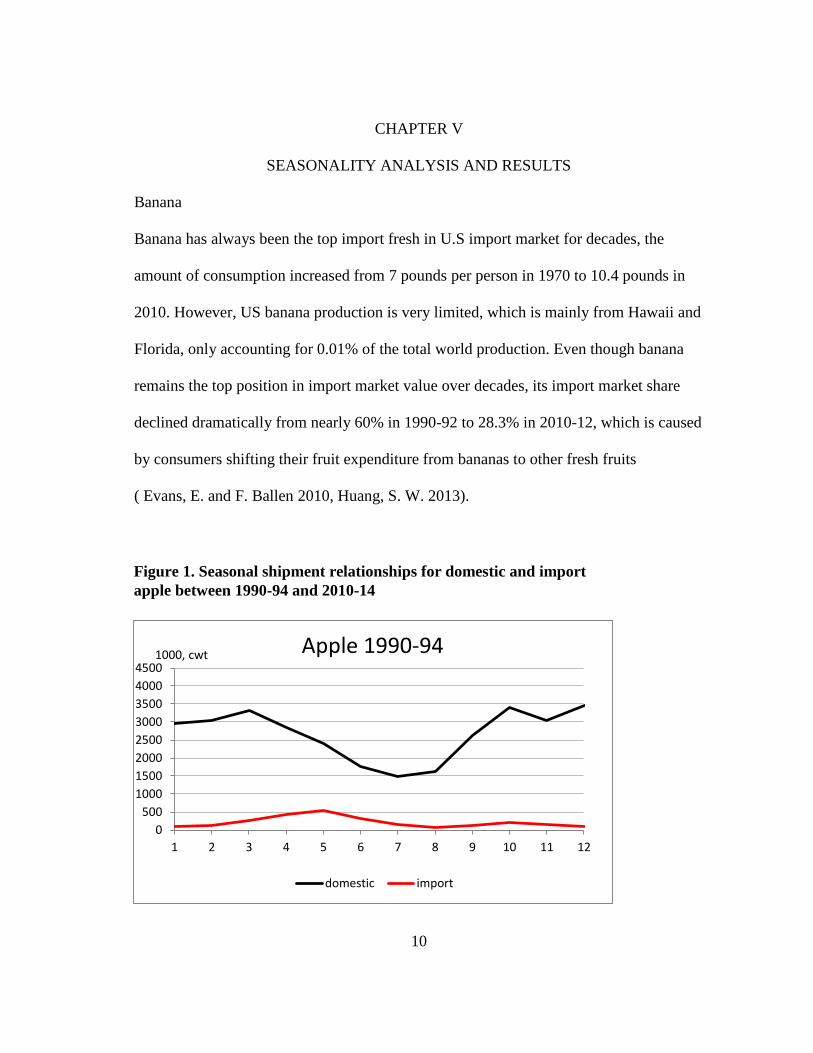
Banana
Banana has always been the top import fresh in U.S import market for decades, the
amount of consumption increased from 7 pounds per person in 1970 to 10.4 pounds in
2010. However, US banana production is very limited, which is mainly from Hawaii and
Florida, only accounting for 0.01% of the total world production. Even though banana
remains the top position in import market value over decades, its import market share
declined dramatically from nearly 60% in 1990-92 to 28.3% in 2010-12, which is caused
by consumers shifting their fruit expenditure from bananas to other fresh fruits
( Evans, E. and F. Ballen 2010, Huang, S. W. 2013).
0
500
1000
1500
2000
2500
3000
3500
4000
4500
1 2 3 4 5 6 7 8 9 10 11 12
Apple 1990-94
domestic import
1000, cwt
Figure 1. Seasonal shipment relationships for domestic and import
apple between 1990-94 and 2010-14
11
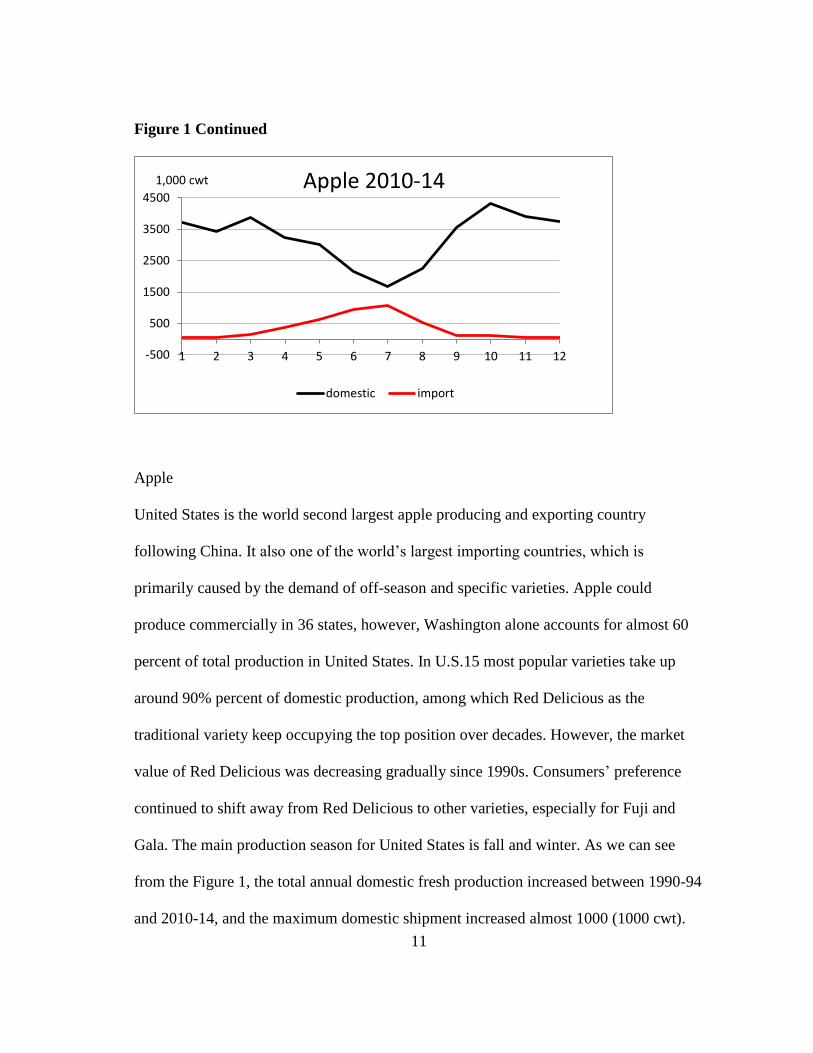
Figure 1 Continued
Apple
United States is the world second largest apple producing and exporting country
following China. It also one of the world’s largest importing countries, which is
primarily caused by the demand of off-season and specific varieties. Apple could
produce commercially in 36 states, however, Washington alone accounts for almost 60
percent of total production in United States. In U.S.15 most popular varieties take up
around 90% percent of domestic production, among which Red Delicious as the
traditional variety keep occupying the top position over decades. However, the market
value of Red Delicious was decreasing gradually since 1990s. Consumers’ preference
continued to shift away from Red Delicious to other varieties, especially for Fuji and
Gala. The main production season for United States is fall and winter. As we can see
from the Figure 1, the total annual domestic fresh production increased between 1990-94
and 2010-14, and the maximum domestic shipment increased almost 1000 (1000 cwt).
-500
500
1500
2500
3500
4500
1 2 3 4 5 6 7 8 9 10 11 12
Apple 2010-14
domestic import
1,000 cwt
12
While, the consumer demand in spring and summer are satisfied primarily by importing
from southern Hemisphere. Chile as the top and counter season supplier in U.S. apple
import market accounts for almost 60 percent of market value, and Canada, while as the
year around supplier, accounts for nearly 20 percent of import market share. The import
maximum shipment point shifted from May to July and the maximum shipment amount
doubled between 1990-94 and 2010-14. ( Lynch, B. 2010, Huang, S. W. 2013).
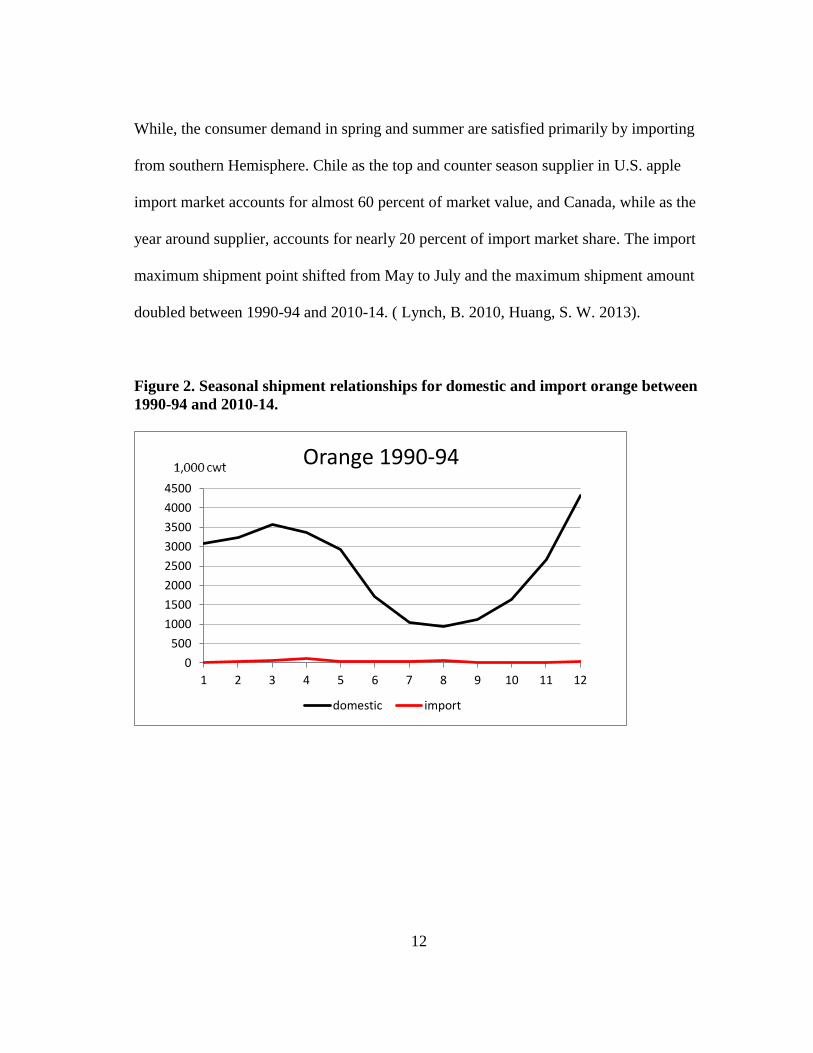
Figure 2. Seasonal shipment relationships for domestic and import orange between
1990-94 and 2010-14.
0
500
1000
1500
2000
2500
3000
3500
4000
4500
1 2 3 4 5 6 7 8 9 10 11 12
Orange 1990-94
domestic import
13
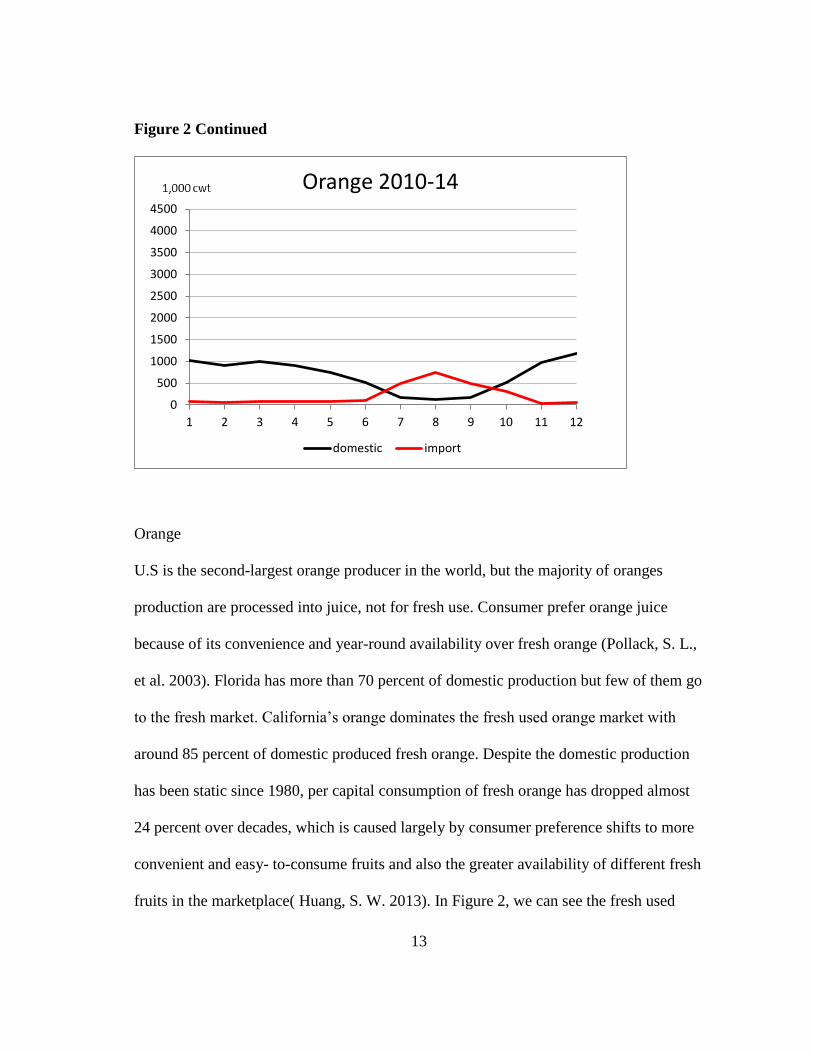
Figure 2 Continued
Orange
U.S is the second-largest orange producer in the world, but the majority of oranges
production are processed into juice, not for fresh use. Consumer prefer orange juice
because of its convenience and year-round availability over fresh orange (Pollack, S. L.,
et al. 2003). Florida has more than 70 percent of domestic production but few of them go
to the fresh market. California’s orange dominates the fresh used orange market with
around 85 percent of domestic produced fresh orange. Despite the domestic production
has been static since 1980, per capital consumption of fresh orange has dropped almost
24 percent over decades, which is caused largely by consumer preference shifts to more
convenient and easy- to-consume fruits and also the greater availability of different fresh
fruits in the marketplace( Huang, S. W. 2013). In Figure 2, we can see the fresh used
0
500
1000
1500
2000
2500
3000
3500
4000
4500
1 2 3 4 5 6 7 8 9 10 11 12
Orange 2010-14
domestic import

14
orange shipment decreased dramatically between1990-94 and 2010-14, since most of
orange were processed to juice. The domestic production seasonality does not change
much over decades, which is from November through May and the main fresh orange
imports starts from Jun, peak on August, and end on November. The main suppliers for
U.S. orange market are South Africa, Chile, Mexico, and Australia. In 1990-94, fresh
orange imports amount was almost zero, but in 2010-14, the orange import amount
became significant. The imports is increasing largely because of seasonal shortage, even
though the import oranges only accounts relatively small portion of domestic production.
The import peaks on July following by California navel season and ends when Florida
early-season varieties begins.
Figure 3. Seasonal shipment relationships for domestic and import grape between
1990-94 and 2010-14.
0
1000
2000
3000
4000
5000
6000
7000
1 2 3 4 5 6 7 8 9 10 11 12
Grape 1990-94
domestic import
15
Figure 3 Continued
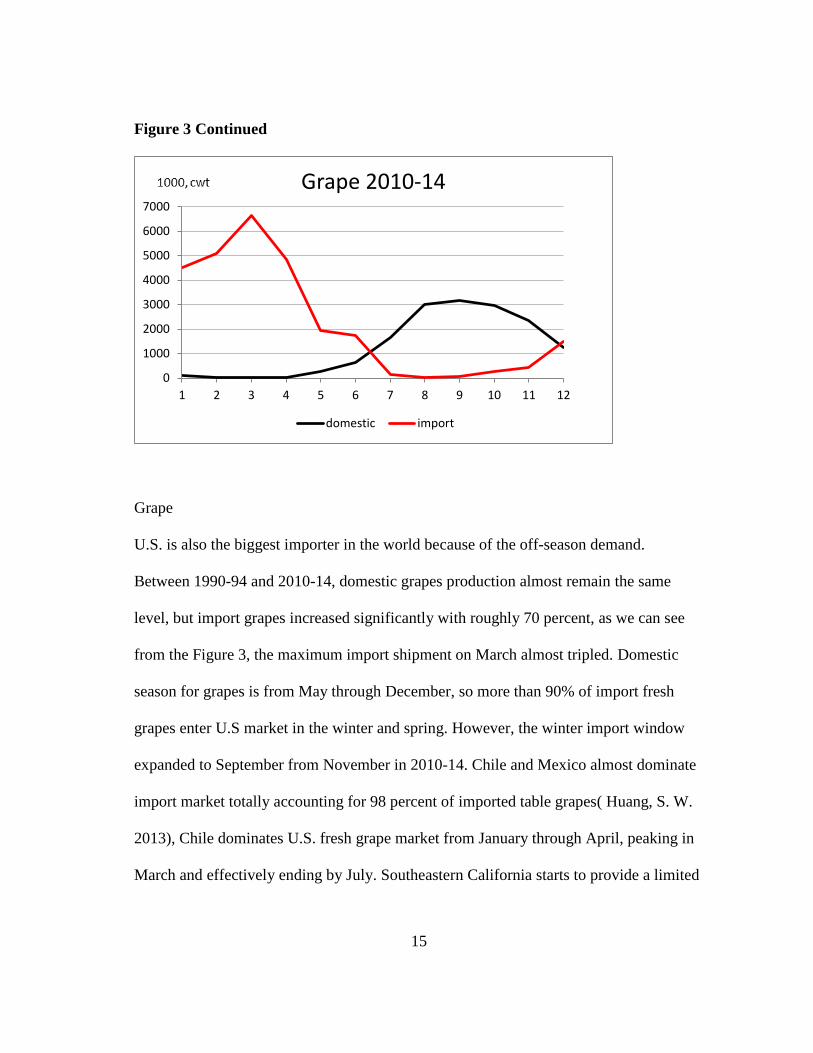
Grape
U.S. is also the biggest importer in the world because of the off-season demand.
Between 1990-94 and 2010-14, domestic grapes production almost remain the same
level, but import grapes increased significantly with roughly 70 percent, as we can see
from the Figure 3, the maximum import shipment on March almost tripled. Domestic
season for grapes is from May through December, so more than 90% of import fresh
grapes enter U.S market in the winter and spring. However, the winter import window
expanded to September from November in 2010-14. Chile and Mexico almost dominate
import market totally accounting for 98 percent of imported table grapes( Huang, S. W.
2013), Chile dominates U.S. fresh grape market from January through April, peaking in
March and effectively ending by July. Southeastern California starts to provide a limited
0
1000
2000
3000
4000
5000
6000
7000
1 2 3 4 5 6 7 8 9 10 11 12
Grape 2010-14
domestic import

16
amount of fresh grapes in May and June, at this time, Mexico shipments enter the market
and end before the largest volume of domestic grapes from central California.
Figure 4. Seasonal shipment relationships for domestic and import avocado
between 1990-94 and 2010-14.
0
200
400
600
800
1000
1200
1400
1 2 3 4 5 6 7 8 9 10 11 12
Avocado 1990-94
domestic import
0
200
400
600
800
1000
1200
1400
1 2 3 4 5 6 7 8 9 10 11 12
Avocado 2010-14
domestic import
17
Avocado
Since all the import barriers of avocado were eliminated in 2007, U.S then became the
world largest importer. U.S domestic production is mainly from California and Florida
because of avocado growing climate. Avocados from California account for almost 90
percent of total domestic production. Avocados could produce year-round in U.S, but the
main season is from April to September. Chile once used to be the largest supplier in
U.S avocado market before 2005, but after Mexico entered U.S market, the market share
of Chile shrank to almost 14 percent. While, Mexico as the world’s leading avocados
producer and exporter can supply U.S market year-round, which accounts for almost 80
percent market value recently. The main import season centers in October through
March, to avoid the domestic production season. In 1990-94, the import period was from
September to October, however, the import period became year-round in 2010-14. U.S
imported avocado even in domestic production season. As we can see from the Figure 4,
both import and domestic shipments increased dramatically between 1990-94 and 2010-
14. The Average annual avocado import amount for U.S. increased almost 2,214 percent
since 1990, reaching about 420,954 metric tons in 2010-12 ( Huang, S. W. 2013). The
demand of avocado in U.S increased dramatically over years, but the domestic
production even could not satisfy the increased demand. The increased demand mainly
attributed to avocado industry-funded program, these program significantly promoted
the consumption of avocado.

18
0
500
1000
1500
2000
2500
3000
1 2 3 4 5 6 7 8 9 10 11 12
Strawberry 2010-14
domestic import
0
500
1000
1500
2000
2500
3000
1 2 3 4 5 6 7 8 9 10 11 12
Strawberry 1990-94
domestic import
Figure 5. Seasonal shipment relationships for domestic and import
strawberry between 1990-94 and 2010-14.

19
Strawberry
U.S. is the leading strawberry production country, while it is also the fourth largest
importer of fresh strawberry in the world. The average annual imports tripled, reaching
119,915 metric tons, between 1990-92 and 2010-12( Huang, S. W. 2013). California as
the main domestic producer occupies nearly 90 percent U.S. production. Strawberries
growing season from California can be all the year, but the main shipment time for
California’s strawberries is in spring and summer. While Florida strawberries primarily
enter the market in winter, from December to March. The whole domestic shipment for
U.S. fresh strawberry peaks between April and June. From Figure 5 we can see, the
import amount is limited in 1990-94, however, import strawberries grow significant in
2010-14. Import strawberries mainly enter U.S. market in winter and spring. Since
strawberries are delicate and relatively hard to ship, Mexico is nearly the only supplier of
fresh strawberries in U.S market. But U.S fresh strawberry market is dominated by
domestic production, either in total production or in any season, import strawberries play
a trivial role in U.S. fruit market ( Boriss, H., et al. 2006, Huang, S. W. 2013).

20
CHAPTER VI
RESULTS ABOUT IMPORT FRESH FRUIT ELASTICITIES
Figure 6. Monthly expenditure shares from 1990 through 2014.
Figure 6 shows the monthly expenditure share change for each import fruit from 1990 to
2014. The monthly expenditure shares show strong seasonality and trend for import
bananas, grapes, oranges, apples, strawberries, and avocados between 1990 and 2014.
Import banana expenditure share is the only one that experienced a downward trend,
while all the other expenditure shares have increasing trend. So in our model, the
seasonality components and trends are incorporated.
Table 1. Estimates of Nonlinear AIDS Model of U.S. Demand for Import
Fresh Fruits. (Notes: The values are coefficient, standard error, p value.*, **, ***
denote statistical significance at 5%, 1%, 0.1%)
0
0.1
0.2
0.3
0.4
0.5
0.6
0.7
0.8
0.9
1
0 12 24 36 48 60 72 84 96 108120132144156168180192204216228240252264276288300
Shar
e
month
w_ban w_gra w_ora w_app w_str w_avo
21
Description Fresh bananas Fresh apples Fresh oranges Fresh Strawberries Fresh grapes Fresh avocados
Intercept 2.141611***
0.0880
(<0.0001)
0.26451***
0.0320
(<0.0001)
0.101683***
0.0302
(0.0009)
0.060409**
0.0192
(0.0019)
-1.79789***
0.0704
(<.0001)
0.22968***
0.0648
(0.0005)
Fresh bananas -0.17606***
0.0353
(<.0001)
Fresh apples -0.05823***
0.00810
(<.0001)
-0.00196
0.00534
(0.7136)
Fresh oranges -0.03614***
0.00682
(<.0001)
-0.0023
0.00282
(0.4161)
0.019648***
0.00300
(<.0001)
Fresh Strawberries-0.01547**
0.00491
(0.0018)
0.008483***
0.00240
(0.0005)
-0.00289
0.00164
(0.0795)
0.009523***
0.00209
(<.0001)
Fresh grapes 0.332682***
0.0319
(<.0001)
0.054441***
0.00928
(<.0001)
0.025123**
0.00821
(0.0024)
0.00591
0.00520
(0.2564)
-0.46407***
0.0364
(<.0001)
Fresh avocados -0.04678***
0.0136
(0.0006)
-0.00043
0.00367
(0.9070)
-0.00344
0.00300
(0.2523)
-0.00555**
0.00198
(0.0055)
0.045911*
0.0179
(0.0108)
0.01029
0.00733
(0.1615)
Real expenditure -0.20583 -0.03019***
0.00428
(<.0001)
-0.01212**
0.00404
(0.0029)
-0.00679**
0.00256
(0.0086)
0.288253***
0.00925
(<.0001)
-0.03332***
0.00862
(0.0001)
Sin1
/
0.011042**
0.00342
(0.0014)
-0.01591***
0.00321
(<.0001)
0.017391***
0.00210
(<.0001)
0.180423***
0.00773
(<.0001)
-0.03652***
0.00661
(<.0001)
cos1
/
-0.03896***
0.00223
(<.0001)
-0.01432***
0.00192
(<.0001)
0.007379***
0.00156
(<.0001)
0.023994***
0.00592
(<.0001)
0.031507***
0.00388
(<.0001)
sin2
/
0.004892***
0.00189
(0.0100)
0.017935***
0.00178
(<.0001)
-0.00354**
0.00111
(0.0016)
0.012157*
0.00588
(0.0395)
-0.01975***
0.00377
(<.0001)
cos2
/
0.017418***
0.00213
(<.0001)
-0.01207***
0.00196
(<.0001)
0.005545***
0.00137
(<.0001)
0.026705***
0.00651
(<.0001)
-0.00811*
0.00406
(0.0466)
sin3
/
-0.00615***
0.00185
(0.0010)
0.000256
0.00175
(0.8834)
-0.00512***
0.00110
(<.0001)
0.029662***
0.00603
(<.0001)
-0.00069
0.00384
(0.8575)
cos3
/
-0.00149
0.00178
(0.4048)
0.011706***
0.00167
(<.0001)
0.00078
0.00106
(0.4631)
-0.02007***
0.00580
(0.0006)
-0.00606
0.00368
(0.1007)
sin4
/
0.006412***
0.00174
(0.0003)
-0.00087
0.00164
(0.5950)
0.000074
0.00103
(0.9431)
0.008105
0.00579
(0.1630)
-0.00355
0.00361
(0.3258)
cos4
/
0.004865**
0.00172
(0.0050)
0.003434*
0.00162
(0.0351)
-0.00054
0.00102
(0.5928)
-0.00982
0.00578
(0.0903)
-0.00089
0.00359
(0.8037)
trend
/
0.00011***
0.000027
(<.0001)
0.000139***
0.000023
(<.0001)
0.000076***
0.000015
(<.0001)
-0.0008***
0.000069
(<.0001)
0.000824***
0.000046
(<.0001)
R square 0.6887 0.7545 0.6405 0.9477 0.8013
22
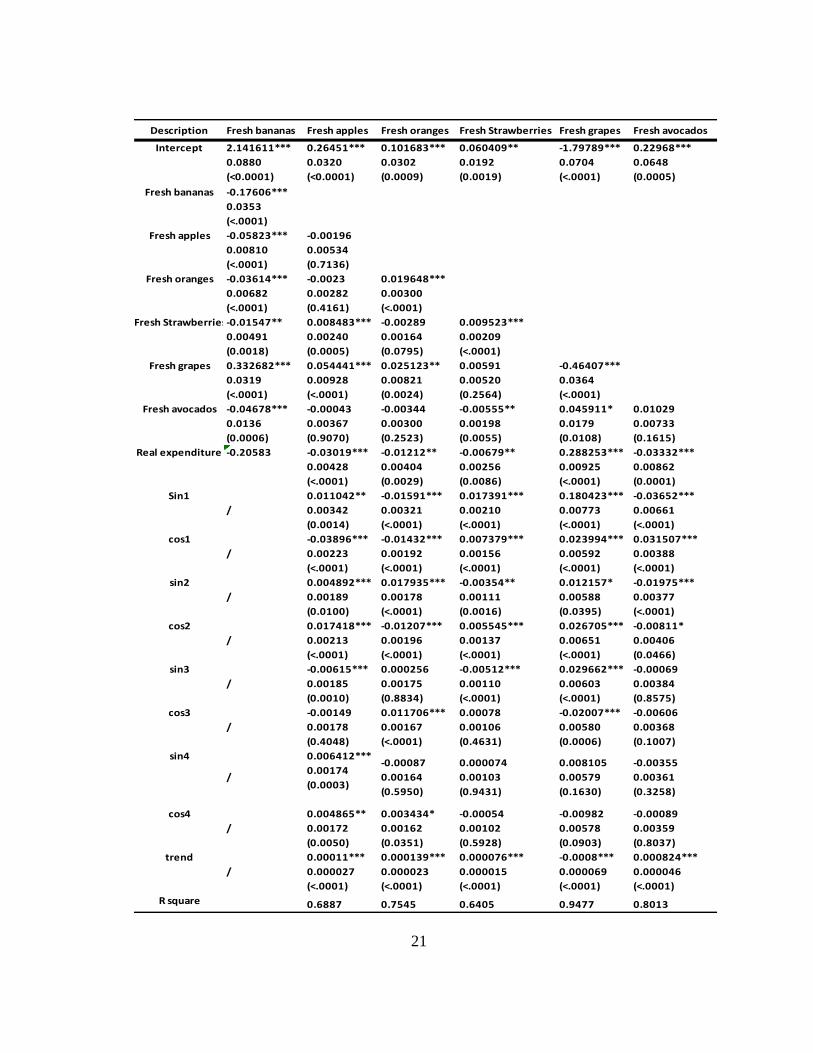
Table 1 is the estimated results of nonlinear model. The intercept represents the
subsistence consumption share, the intercepts of fresh bananas, apples, oranges,
strawberries, grapes, and avocado are all statistically significant with value
2.141611,0.26451, 0.101683, 0.060409, -1.79789 and 0.22968, respectively. Bananas as
the top popular fresh fruit in American diet has the biggest subsistence consumption,
which is reasonable. As for grapes, the sign of intercept is negative, it is probably
because of the dramatic expenditure share change. During the fresh grape import
window, its expenditure share could reach around 70 percent, but in the domestic season,
import fresh grape drops to almost zero. As we can see from the real expenditure
coefficients, all the values are statistically significant for fresh banana, apples, oranges,
strawberries, and avocados and the coefficients of real expenditure except for grapes are
all negative, which means that bananas, strawberries, oranges, and apples are necessities,
but for grape, the coefficient of real expenditure is positive, which means it is the only
luxury good. All the budget share equations have significant trend at 0.1% significance
level except for bananas and grapes. Since we dropped the fresh banana budget share
equation, we do not have coefficient of trend for import fresh banana, but we can see
from the previous graph, import bananas have obviously downward trend. All the
commodities have at least four statistically significant seasonality variables, where the
seasonal frequencies of the data equal to 1 and 2. Fresh apples and grapes have more
statistically significant seasonal variables. The significance of seasonal components
show that seasonality is an important character in fresh fruit market, which is consistent
with the earlier results from Nzaku, K., et al. (2010)
23
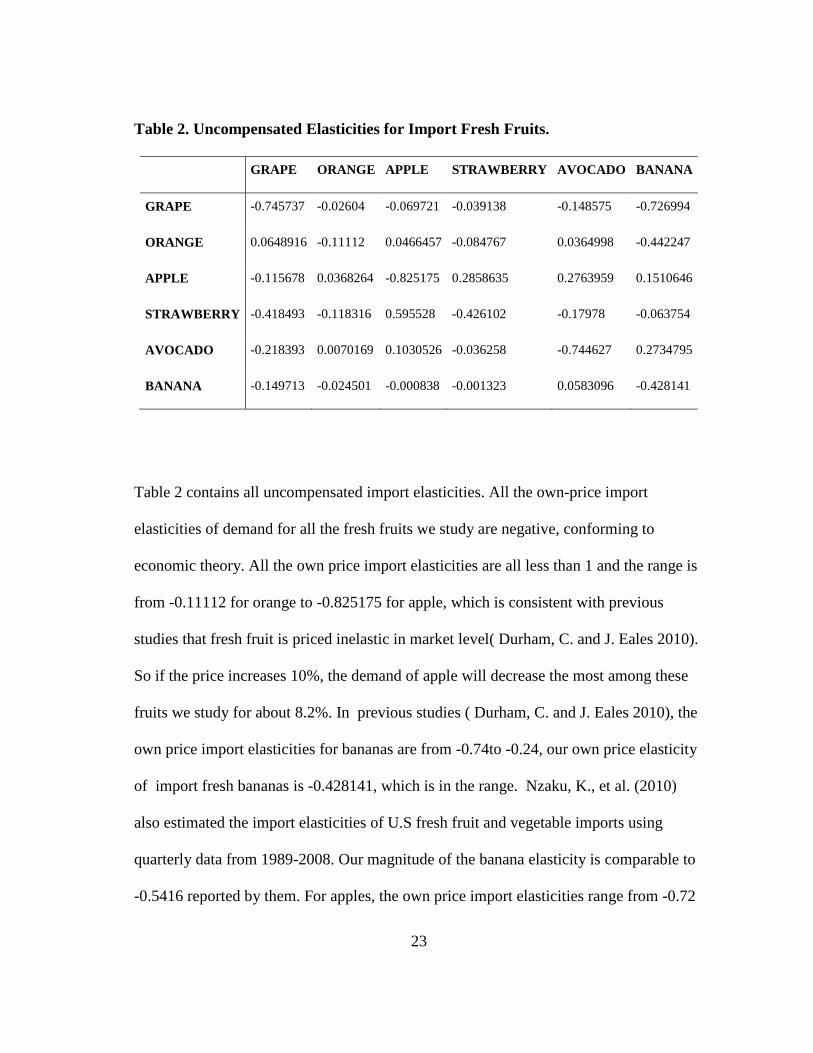
Table 2. Uncompensated Elasticities for Import Fresh Fruits.
GRAPE ORANGE APPLE STRAWBERRY AVOCADO BANANA
GRAPE -0.745737 -0.02604 -0.069721 -0.039138 -0.148575 -0.726994
ORANGE 0.0648916 -0.11112 0.0466457 -0.084767 0.0364998 -0.442247
APPLE -0.115678 0.0368264 -0.825175 0.2858635 0.2763959 0.1510646
STRAWBERRY -0.418493 -0.118316 0.595528 -0.426102 -0.17978 -0.063754
AVOCADO -0.218393 0.0070169 0.1030526 -0.036258 -0.744627 0.2734795
BANANA -0.149713 -0.024501 -0.000838 -0.001323 0.0583096 -0.428141
Table 2 contains all uncompensated import elasticities. All the own-price import
elasticities of demand for all the fresh fruits we study are negative, conforming to
economic theory. All the own price import elasticities are all less than 1 and the range is
from -0.11112 for orange to -0.825175 for apple, which is consistent with previous
studies that fresh fruit is priced inelastic in market level( Durham, C. and J. Eales 2010).
So if the price increases 10%, the demand of apple will decrease the most among these
fruits we study for about 8.2%. In previous studies ( Durham, C. and J. Eales 2010), the
own price import elasticities for bananas are from -0.74to -0.24, our own price elasticity
of import fresh bananas is -0.428141, which is in the range. Nzaku, K., et al. (2010)
also estimated the import elasticities of U.S fresh fruit and vegetable imports using
quarterly data from 1989-2008. Our magnitude of the banana elasticity is comparable to
-0.5416 reported by them. For apples, the own price import elasticities range from -0.72

24
to -0.16 concluded by Durham, C. and J. Eales (2010), but the own price elasticity of
import apples in our study is -0.825175, which is smaller than the minimum value of
previous study. For oranges, the own price import elasticities are from -1.14 to -0.27 in
previous studies, but our own price elasticity of bananas is -0.11112, which is out of the
range and greater than the maximum value. For grapes, the elasticity is -0.7457, the
magnitude is greater than 0.3823 reported by Durham, C. and J. Eales (2010). For
avocados, the own price elasticity is -0.744627, which is comparable to -0.8823 reported
by Nzaku, K., et al. (2010). We should notice that, in our comparison of import
elasticities, most of the import elasticities in previous study are estimated by domestic
consumption data rather than import data. The difference of import elasticities might
also come from the different types and time period of the data. However, the resources
about import elasticities from previous studies are very limited.
From table 2, we also can see that grape and apple, strawberry, avocado, and banana are
complements, Strawberry and all the other fruits are complements except for apple, since
their cross-price import elasticities are negative. Strawberry and apple are substitutes.
Avocado and orange, apple, and banana are substitutes. Nzaku, Houston et al. (2011)
had some same results with us, they found import avocados are substitutes for bananas,
import grapes; bananas and grape imports are complements.

25
Table 3. Import Expenditure Elasticities for Import Fresh Fruits
GRAPE 1.7562047
ORANGE 0.4900962
APPLE 0.1907023
STRAWBERRY 0.6109165
AVOCADO 0.6157286
BANANA 0.546207
The expenditure import elasticities are reported in Table 3. As we can see from the table,
all the expenditure import elasticities have positive sign, which is consistent with
economic theory. The expenditure import elasticities range from 0.1907023 for apples to
1.7562047 for grapes, So, when income increase, the demand of import grapes will
increase the most and the demand of import apple will increase the least, which means
people prefer more import grapes and less import apples for a fresh fruit budget
constructed by all the fruits we study. The magnitude of expenditure import elasticities
for oranges, strawberries, avocados and bananas are closely at the same level. Import
fresh grapes is the only luxury good because its expenditure elasticity is greater than 1.
You, Z., et al. (1996) also found that fresh grapes was luxury commodity.

26
CHAPTER VII
CONCLUSIONS
As the consumer demand increased rapidly since 1990s, both domestic production and
imports increased dramatically. Domestic production season had no significant change
between 1990-94 and 2010-14, whereas, the length of import window has expanded.
Imports have no significant sign to compete with domestic production, on the contrary,
imports have supplemented domestic production during off-season to meet increased
U.S demand (Huang, S. W. and K. S. Huang 2007).
Most of estimation results from nonlinear AIDS model are statistically significant,
especially for trend and seasonality components. Trend and seasonality are very import
characteristics for the import fresh fruit market. The own-price import elasticities for all
import fruits we study are all negative and less than 1, which means import fresh fruits
are also price inelastic in the market level. Import grapes are the only luxury good, and it
is the complement for all the other import fruits we study. However import apples have
the minimum magnitude of expenditure elasticity, and it is the substitute for most of
other import fruits. As the expenditure increases, consumers shift their preference from
import apple to other import fruits, especially import grapes. We did not address possible
endogeneity issue with respect to expenditures. In consumer theory, income is
exogenous. Not having income we use expenditures in this thesis, as have others in the
literature. This is a problem left for future research (Wang, Z. and D. A. Bessler, 2006).

27
For the further study, we will find statistical methods to estimate significance of
seasonality movements and how they shift over years. And it is better to estimate total
consumer demand if we get consumption for both domestic and import market.
28
REFERENCES
Armington, P. S. (1969). "A theory of demand for products distinguished by place of
production." Staff Papers-International Monetary Fund: 159-178.
Arnade, C. and D. Pick (1998). "Seasonality and unit roots: The femand for fruits."
Agricultural Economics 18(1): 53-62.
Arnade, C., et al. (2005). "Testing and incorporating seasonal structures into demand
models for fruit." Agricultural Economics 33(s3): 527-532.
Baldwin, K. L. and K. G. Jones (2013). "US citrus import demand: Seasonality and
substitution." Journal of International Food & Agribusiness Marketing 25(1): 24-41.
Boriss, H., et al. (2006). "Commodity profile: Strawberries." Agricultural Issues Center,
University of California, Davis, California, USA. Website http://aic. ucdavis.
edu/profiles/Strawberries-2006. pdf [accessed 25 March 2014].
Deaton, A. and J. Muellbauer (1980). "An almost ideal demand system." The
American Economic Review 70(3): 312-326.

29
Durham, C. and J. Eales (2010). "Demand import elasticities for fresh fruit at the
retail level." Applied Economics 42(11): 1345-1354.
Evans, E. and F. Ballen (2010). "Banana market." Report FE901, University of Florida,
IFAS Extension.
Goodwin, B. (2008). SAS/ETS examples: Estimating an almost ideal demand system
model. Available at http://support.sas.com/rnd/app/examples/ets/aids/.
Goodwin, B. (2008). SAS/ETS examples: Calculating elasticities in an almost ideal
demand system model. Available at
http://support.sas.com/rnd/app/examples/ets/elasticity/.
Herrmann, R. (1998). "Some neglected issues in food demand analysis: Retail-level
demand, health information and product quality." Australian Journal of Agricultural
and Resource Economics 42(4): 341-367.
Hoch, S. J., et al. (1995). "Determinants of store-level price elasticity." Journal of
Marketing Research 32(1): 17-29.
30
Huang, K. S. and B.-H. Lin (2000). "Estimation of food demand and nutrient elasticities
from household survey data." Tech. Bull. 1887. Washington, DC: USDA/ERS/Food
Rural Econ. Div
Huang, S. W. (2013). "Imports contribute to year-round fresh fruit availability." US
Department of Agriculture, Economic Research Service. http://ers. usda.
gov/publications/fts-fruit-and-tree-nuts-outlook/fts-356-01. aspx#. UvJee7Rfvd4.
Huang, S. W. and K. S. Huang (2007). “Increased U.S. imports of fresh fruit and
vegetables.” Pub. No. FTS-328-01, USDA/Economic Research Service, Washington,
DC.
Knutson, R. D., et al. (2014). "Role of trade in satisfying US fresh fruit and vegetable
demand." Journal of International Food & Agribusiness Marketing 26(4): 326-343.
Lynch, B. (2010). "Apples. Industry & trade summary." US International Trade
Commission Report ITS-04, Washington, DC. Available at Web site http://www. usitc.
gov/publications/332/ITS_4. pdf (accessed April 16, 2010).
Moschini, G. (1995). "Units of measurement and the stone index in demand system
estimation." American Journal of Agricultural Economics 77(1): 63-68.
31
Nzaku, K., et al. (2011). "US demand for fresh fruit and vegetable imports." Journal of
Food Distribution Research 42(1): 96.
Nzaku, K., et al. (2010). "Analysis of US demand for fresh fruit and vegetable imports."
Journal of Agribusiness 28(2): 163.
Palma, M. A., et al. (2013). "Implications of US trade agreements and US nutrition
policies for produce production, demand, and trade." Journal of Agricultural and Applied
Economics 45(03).
Pollack, S. L., et al. (2003). "Characteristics of US orange consumption." Electronic
Outlook Report from the Economic Research Service (www.ers.usda.gov). FTS 305-01,
August 2003, pp. 1–17.
Seale Jr, J. L., et al. (2013). "US import demand and supply response for fresh tomatoes,
cantaloupes, onions, oranges, and spinach." Journal of Agricultural and Applied
Economics 45(03): 435-452.
32
Wang, Z. and D. A. Bessler (2006). "Price and quantity endogeneity in demand analysis:
evidence from directed acyclic graphs." Agricultural Economics 34(1): 87-95.
You, Z., et al. (1996). "A composite system demand analysis for fresh fruits and
vegetables in the United States." Journal of Food Distribution Research 27: 11-22.