u.s. fish & wildlife service wildlife watching in the u.s ... types of outdoor recreation in the...
TRANSCRIPT

U.S. Fish & Wildlife Service
Wildlife Watching in the U.S.: The Economic Impacts on National and State Economies in 2006Addendum to the 2006 National Survey of Fishing, Hunting, and Wildlife-Associated RecreationReport 2006-1

Wildlife Watching in the U.S.: The Economic Impacts on National and State Economies in 2006Addendum to the 2006 National Survey of Fishing, Hunting, and Wildlife-Associated RecreationReport 2006-1
U.S. Fish & Wildlife Service
July 2008
Jerry Leonard Wildlife and Sport Fish Restoration Programs U.S. Fish and Wildlife Service Arlington, VA
This report is intended to complement the National and State Reports for the 2006 National Survey of Fishing, Hunting and Wildlife-Associated Recreation. The conclusions in this report are the author’s and do not represent official positions of the U.S. Fish and Wildlife Service.
The author thanks Jim Caudill, Sylvia Cabrera, Richard Aiken, and Tom Allen for valuable input on this report.

2 Wildllife Watching in the U.S.: The Economic Impacts on National and State Economies in 2006
Wildlife watching is one of the most popular types of outdoor recreation in the United States. Nearly a third of the U.S. population, 71 million people, enjoyed closely observing, feeding, and photographing wildlife in 2006. Wildlife watching around the home and on trips is an important and growing form of recreation. Eight percent more people participated in 2006 than in 2001.
In addition to contributing significantly to people’s enjoyment of the outdoors, wildlife watching has a substantial impact on the nation’s and states’ economies. The $45.7 billion spent on wildlife equipment and trips in 2006 contributed substantially to federal and state tax revenues, jobs, earnings, and economic output.
This report presents estimates of the national and state economic impacts of wildlife watching, which were derived using data from the 2006 Fishing, Hunting, and Wildlife Associated Recreation Survey (FHWAR). The following topics are addressed: (1) national participation in wildlife watching; (2) expenditures associated with participation in wildlife watching; (3) estimates of the total economic activity generated by these expenditures; (4) total employment and
employment income associated with these expenditures; and (5) estimates of associated state and federal tax revenue. Two other reports used the 2006 FHWAR to address the national and state economic impacts of hunting and fishing1.
1 See “Hunting in America: An Economic Engine and Conservation Powerhouse,” Association of Fish and Wildlife Agencies and “Sportfishing in America: An Economic Engine and Conservation Powerhouse,” American Sportfishing Association.
The 2006 FHWAR collected information on fishing, hunting, and wildlife-watching participation and expenditures in 2006. National and state reports are accessible on the following websites http://wsfrprograms.fws.gov and http://www.census.gov/prod/www/abs/fishing.html
Introduction
Mar
k B
ertr
am/U
SFW
S
Lee
Kar
ney/
USF
WS
Wildllife Watching in the U.S.: The Economic Impacts on National and State Economies in 2006 3
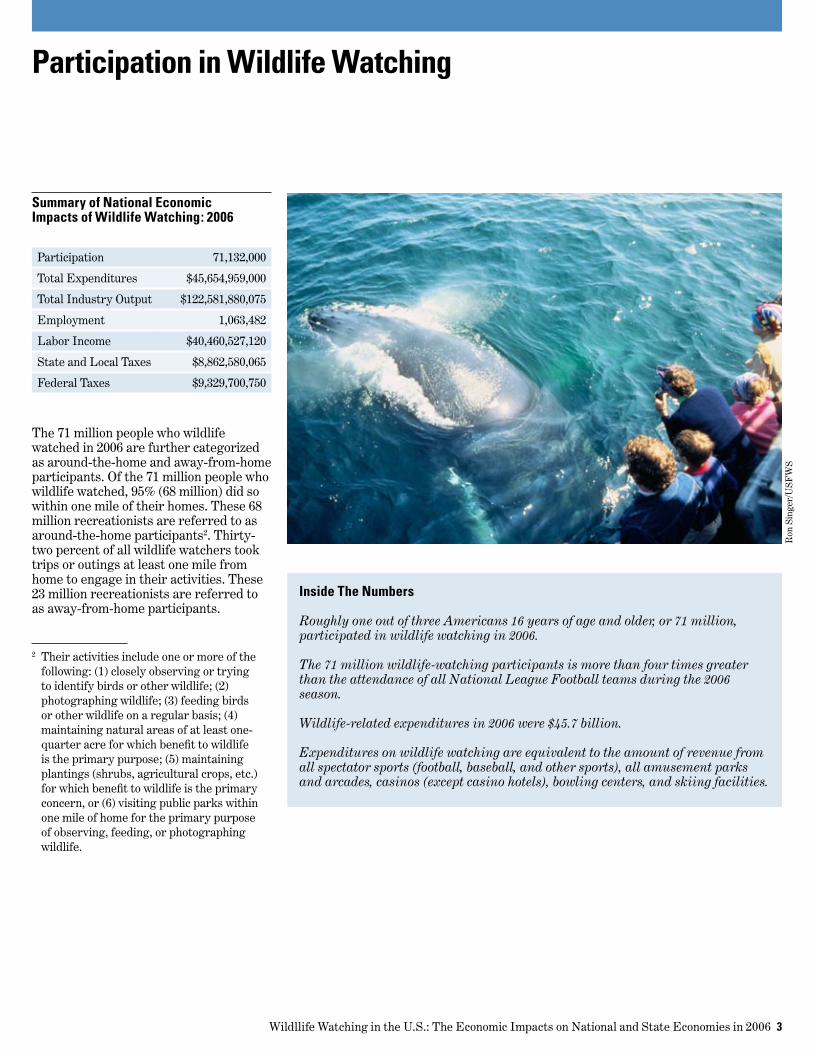
The 71 million people who wildlife watched in 2006 are further categorized as around-the-home and away-from-home participants. Of the 71 million people who wildlife watched, 95% (68 million) did so within one mile of their homes. These 68 million recreationists are referred to as around-the-home participants2. Thirty-two percent of all wildlife watchers took trips or outings at least one mile from home to engage in their activities. These 23 million recreationists are referred to as away-from-home participants.
2 Their activities include one or more of the following: (1) closely observing or trying to identify birds or other wildlife; (2) photographing wildlife; (3) feeding birds or other wildlife on a regular basis; (4) maintaining natural areas of at least one-quarter acre for which benefit to wildlife is the primary purpose; (5) maintaining plantings (shrubs, agricultural crops, etc.) for which benefit to wildlife is the primary concern, or (6) visiting public parks within one mile of home for the primary purpose of observing, feeding, or photographing wildlife.
Participation in Wildlife Watching
Inside The Numbers
Roughly one out of three Americans 16 years of age and older, or 71 million, participated in wildlife watching in 2006.
The 71 million wildlife-watching participants is more than four times greater than the attendance of all National League Football teams during the 2006 season.
Wildlife-related expenditures in 2006 were $45.7 billion.
Expenditures on wildlife watching are equivalent to the amount of revenue from all spectator sports (football, baseball, and other sports), all amusement parks and arcades, casinos (except casino hotels), bowling centers, and skiing facilities.
Summary of National Economic Impacts of Wildlife Watching: 2006
Participation 71,132,000
Total Expenditures $45,654,959,000
Total Industry Output $122,581,880,075
Employment 1,063,482
Labor Income $40,460,527,120
State and Local Taxes $8,862,580,065
Federal Taxes $9,329,700,750
Ron
Sin
ger/
USF
WS

4 Wildllife Watching in the U.S.: The Economic Impacts on National and State Economies in 2006
Table 1. Number of Wildlife-Watching Participants: 2006(Population 16 years and older)
State where activity took place
Total participants Number
Alabama 1,161,000
Alaska 496,000
Arizona 1,277,000
Arkansas 1,011,000
California 6,270,000
Colorado 1,819,000
Connecticut 1,170,000
Delaware 285,000
Florida 4,240,000
Georgia 1,987,000
Hawaii 262,000
Idaho 754,000
Illinois 2,566,000
Indiana 2,042,000
Iowa 1,205,000
Kansas 816,000
Kentucky 1,475,000
Louisiana 738,000
Maine 801,000
Maryland 1,491,000
Massachusetts 1,919,000
Michigan 3,227,000
Minnesota 2,093,000
Mississippi 731,000
Missouri 2,248,000
Montana 755,000
Nebraska 490,000
Nevada 686,000
New Hampshire 710,000
New Jersey 1,713,000
New Mexico 787,000
New York 3,852,000
North Carolina 2,641,000
North Dakota 148,000
Ohio 3,489,000
Oklahoma 1,110,000
Oregon 1,484,000
Pennsylvania 3,947,000
Rhode Island 436,000
South Carolina 1,115,000
South Dakota 432,000
Tennessee 2,362,000
Texas 4,225,000
Utah 877,000
Vermont 468,000
Virginia 2,312,000
Washington 2,331,000
West Virginia 743,000
Wisconsin 2,039,000
Wyoming 643,000
United States, total 71,132,000
Economic Impact Quick Facts
Expenditures rippled through the economy generating $122.6 billion in total industry output and 1,063,482 jobs
The more than one million jobs supported by wildlife watchers are almost three times the number of people who work for United Parcel Service in the U.S.
Figure 1. Wildlife Expenditures by Major Category: 2006(Total Expenditures: $45.7 billion)
Figure 2. Trip Expenditures for Wildlife Watching: 2006(Total Trip Expenditures: $12.9 billion)
Equipment: 51%$23.2 billion
Other: 21%$9.6 billion
Trip: 28%$12.9 billion
Transportation: 35%$4.5 billion
Lodging: 25%$3.2 billion
Food: 33%$4.3 billion
Other: 7%$0.9 billion

Wildllife Watching in the U.S.: The Economic Impacts on National and State Economies in 2006 5
spending associated with wildlife watching has a substantial impact on economic activity, employment, and household income across the nation.
MethodsThe 2006 FHWAR contains estimates of annual travel and equipment expenditures by wildlife-watching participants. These expenditures were used in conjunction with an economic modeling method known as input-output analysis4 to estimate total industry output, employment and employment income associated with these expenditures.
Direct ExpendituresTotal direct expenditures by participants were $45.7 billion in 2006. Trip-related expenditures accounted for about $12.9 billion (28 percent of total expenditures). Food and drink accounted for 33 percent of total trip-related expenditures and transportation and lodging accounted for 35 and 25 percent, respectively.
Equipment and other expenditures accounted for $32.8 billion (72 percent of total expenditures). Special equipment such as off-road vehicles, tent trailers, motor homes, pick-up trucks, and boats accounted for 27 percent of total expenditures. Packaged and bulk wild bird food accounted for 7 percent of total expenditures, while film and developing accounted for 2 percent, and photographic equipment such as cameras accounted for 7 percent.
4 The estimates of total economic activity, employment, employment income and federal and state taxes in this report were derived using IMPLAN, a regional input-output model and software system. For additional information, see MIG, Inc. IMPLAN System (2004 data and software) and Olson and Lindall, IMPLAN Professional Software, Analysis and Data Guide. For additional information on input-output modeling, see Miller and Blair Input-Output Analysis .
Spending associated with wildlife watching generates a substantial amount of economic activity across the United States. Participants spent $45.7 billion in 2006 on a wide variety of goods and services. Trip-related expenditures by away-from-home participants include expenses for food, lodging, and transportation. Both around-the-home and away-from-home participants also buy equipment and related goods for the primary purpose of engaging in wildlife watching such as binoculars, cameras, wild bird food, memberships in wildlife organizations, camping equipment, motor homes, campers, and off-road vehicles.
To help place the $45.7 billion in wildlife-watching expenditures into context, consider that it is equivalent to the amount of revenue from all spectator sports (football, baseball, and other sports), all amusement parks and arcades, casinos (except casino hotels) bowling centers, and skiing facilities3.
These direct expenditures are only part of the total picture. Businesses and industries that supply the local retailers where the purchases are made also benefit from wildlife-watching expenditures. For example, a family may decide to purchase a pair of binoculars to use primarily for birdwatching on an upcoming vacation. Part of the total purchase price will go to the local retailer such as a sporting goods store. The sporting goods store in turn pays a wholesaler that in turn pays the manufacturer of the binoculars. The manufacturer then spends a portion of this income to pay businesses supplying the manufacturer.
In this fashion, each dollar of local retail expenditures can affect a variety of businesses at the local, regional, and national level. Consequently, consumer
3 The figures were obtained from the revenue totals, corrected for inflation, displayed in the 1997 Economic Census published by the U.S. Census Bureau.
The Economic Impacts of Wildlife Watching
Tax Impact Quick Facts
$9.3 billion in federal tax revenue
$8.9 billion in state tax revenue
Stev
e H
illeb
rand
/USF
WS

6 Wildllife Watching in the U.S.: The Economic Impacts on National and State Economies in 2006
Table 2. National Expenditures for Wildlife Watching by Category: 2006
Expenditures Percent of Category
ExpendituresPercent of Total
Expenditures
Trip-Related ExpendituresFood $4,298,403,000 33.4% 9.4%
Lodging $3,217,878,000 25.0% 7.1%
Public transportation $1,566,963,000 12.2% 3.4%
Private transportation $2,889,050,000 22.4% 6.3%
Guide fees, pack trip or package fees $250,047,000 1.9% 0.5%
Public land use fees $140,508,000 1.1% 0.3%
Private land use fees $66,145,000 0.5% 0.1%
Equipment rental $148,706,000 1.2% 0.3%
Boating costs $224,981,000 1.7% 0.5%
Heating and cooking fuel $72,470,000 0.6% 0.2%
Total trip-related $12,875,152,000 100.0% 28.2%
Equipment Wildlife-watching equipment
Binoculars, spotting scopes $656,462,000 6.7% 1.4%
Cameras, video cameras, special lenses, and other photographic equipment $3,078,089,000 31.2% 6.7%
Film and developing $767,465,000 7.8% 1.7%
Commercially prepared and packaged wild bird food $2,707,601,000 27.4% 5.9%
Other bulk foods used to feed wild birds $642,531,000 6.5% 1.4%
Feed for other wildlife $664,554,000 6.7% 1.5%
Nest boxes, bird houses, feeders, baths $789,918,000 8.0% 1.7%
Day packs, carrying cases, and special clothing $451,524,000 4.6% 1.0%
Other wildlife-watching equipment (such as field guides and maps) $111,582,000 1.1% 0.2%
Wildlife-watching equipment, total $9,869,727,000 100.0% 21.6%Auxiliary equipment
Tents, tarps $243,670,000 23.6% 0.5%
Frame packs and backpacking equipment $140,371,000 13.6% 0.3%
Other camping equipment $368,281,000 35.6% 0.8%
Other auxiliary equipment (such as blinds) $280,739,000 27.2% 0.6%
Auxiliary equipment, total $1,033,060,000 100.0% 2.3%Special equipment
Off-the-road vehicle $3,819,030,000 31.1% 8.4%
Travel or tent trailer, pickup, camper, van, motor home, recreational vehicle $5,329,261,000 43.4% 11.7%
Boats, boat accessories $1,824,071,000 14.9% 4.0%
Cabins and Other $1,298,904,000 10.6% 2.8%
Special equipment, total $12,271,266,000 100.0% 26.9%
Other ItemsMagazines, books $359,681,000 3.7% 0.8%
Land leasing and ownership $6,551,517,000 68.2% 14.4%
Membership dues and contributions $1,052,496,000 11.0% 2.3%
Plantings $1,642,061,000 17.1% 3.6%
Other, total $9,605,755,000 100.0% 21.0%
National Total, All Items $45,654,960,000 100.0%

Wildllife Watching in the U.S.: The Economic Impacts on National and State Economies in 2006 7
Total Industry OutputThe direct expenditures of $45.7 billion in 2006 generated $122.6 billion in total industrial output (TIO) across the U.S. TIO includes the direct, indirect, and induced effects5 of wildlife-watching expenditures. The ratio of TIO to direct expenditures, 2.68, means that for each $1 of direct spending associated with wildlife watching, an additional $1.68 of economic activity is generated. Major sectors affected include retail
5 Direct effects are production changes associated with the immediate effects of changes in final demand (in this case, changes in wildlife-associated expenditures); indirect effects are production changes in those industries which supply the inputs to industries directly affected by final demand; induced effects are changes in regional household spending patterns caused by changes in regional employment (generated from the direct and indirect effects) (Taylor et al. 1993, Appendix E, p. E-1).
trade which accounted for $26.2 billion (21 percent of the impact in all sectors); manufacturing $22.4 billion (18 percent); and accommodation and food services $7.3 billion (6 percent).
Employment and Employment IncomeThe total industrial output of $122.6 billion resulted in 1,063,482 jobs (full and part time) with total income of $40.5 billion. With respect to employment, major industrial sectors affected include trade with over 358 thousand jobs (34 percent); accommodation and food services with 116 thousand jobs (11 percent); real estate and rental with 71 thousand jobs (7 percent) and arts, entertainment, and recreation with 61 thousand jobs (6 percent).
The retail trade sector accounted for the largest portion of income at $10.6 billion (28 percent); manufacturing accounted for $3.5 billion (9 percent); transportation and warehousing with $2.6 billion
(7 percent) and accommodation and food services at $2.4 billion (6 percent). Table 3 summarizes economic impacts by major business sector.
Federal and State TaxesWildlife-watching expenditures generate taxes at both the state and federal level in a number of ways. Direct and indirect expenditures generate state sales tax (except in those states without sales tax). Second, employment income is taxed at both the state (with the exception of states which do not tax income) and federal levels. Additionally, tax revenue is generated through taxes on corporate profits and excise taxes such as fuel taxes. Based on total industrial output and associated employment that result from wildlife-watching, 2006 tax revenue at the federal level was $9.3 billion, and tax revenue at the state and local levels was $8.9 billion.
Table 3. National Economic Impacts of Wildlife Watching by Major North American Industrial Classification Sector: 2006Total
Industrial Output
Sector as Percent of Total Employment
Sector as Percent of Total
Salaries, Wages, and Business
Owner’s Income
Sector as Percent of Total
11 Agriculture, Forestry, Fishing, and Hunting $1,734,812,928 1.4% 19,448 1.8% $429,253,120 1.1%
21 Mining $938,586,944 0.8% 2,078 0.2% $191,473,248 0.5%
22 Utilities $1,869,424,128 1.5% 2,586 0.2% $355,420,448 0.9%
23 Construction $1,095,349,760 0.9% 9,468 0.9% $434,646,272 1.1%
31-33 Manufacturing $22,396,049,408 18.3% 57,350 5.4% $3,490,920,448 9.1%
42 Wholesale Trade $4,141,315,328 3.4% 23,562 2.2% $1,485,685,504 3.9%
48-49 Transportation and Warehousing $4,977,086,976 4.1% 49,743 4.7% $2,608,190,976 6.8%
44-45 Retail trade $26,186,409,984 21.4% 358,982 33.8% $10,585,159,680 27.6%
51 Information $5,180,698,112 4.2% 17,017 1.6% $1,280,071,168 3.3%
52 Finance and insurance $6,462,498,816 5.3% 31,670 3.0% $2,248,221,696 5.9%
53 Real estate, rental, and leasing $12,442,369,024 10.2% 70,810 6.7% $2,112,347,264 5.5%
54 Professional, scientific, and technical services $5,293,267,968 4.3% 40,302 3.8% $2,413,937,408 6.3%
55 Management of companies $2,644,068,096 2.2% 12,366 1.2% $1,147,169,792 3.0%
56 Administrative and waste services $3,231,049,728 2.6% 56,684 5.3% $1,523,274,240 4.0%
61 Educational services $589,612,288 0.5% 10,996 1.0% $317,360,864 0.8%
62 Health and social services $4,504,817,152 3.7% 54,267 5.1% $2,250,874,880 5.9%
71 Arts, entertainment, and recreation $2,733,827,584 2.2% 61,320 5.8% $1,144,816,896 3.0%
72 Accomodation and food services $7,316,387,840 6.0% 116,456 11.0% $2,422,788,864 6.3%
81 Other services $4,111,477,504 3.4% 58,819 5.5% $1,484,820,864 3.9%
92 Government and non-NAICs $4,604,338,688 3.8% 9,560 0.9% $490,758,976 1.3%
Total $122,581,880,075 100.0% 1,063,482 100.0% $40,460,527,120 100.0%
8 Wildllife Watching in the U.S.: The Economic Impacts on National and State Economies in 2006
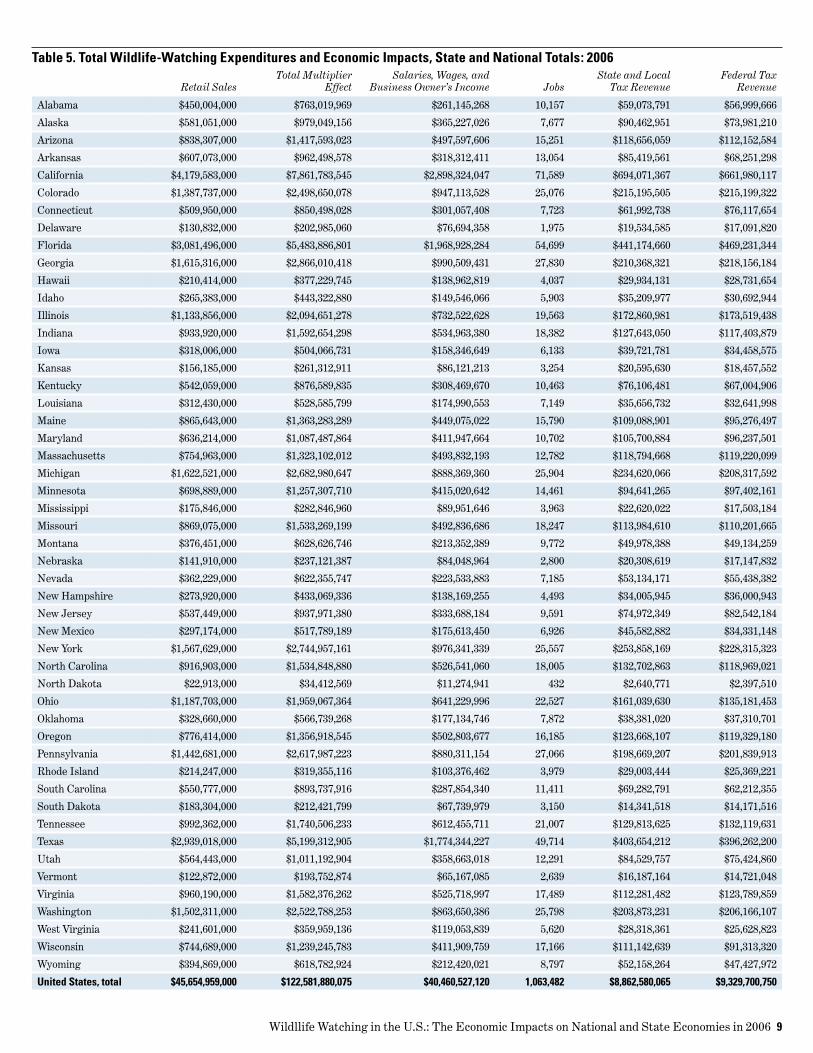
State ImpactsTable 5 shows the economic impacts of wildlife-watching expenditures by state for 2006. U.S. totals are shown at the bottom of Table 4. State totals do not add up to U.S. totals because state impact figures show only those impacts which occur within the state. For example, a Bozeman, Montana sporting goods store may carry a brand of fishing tackle that is manufactured in Burlington, Vermont. When an angler purchases the fishing tackle, only a portion of the money is kept by the retailer in Montana. Part of the total selling price goes to the Vermont manufacturer. This transaction between the sporting goods store and the manufacturer (or wholesaler, depending on the situation) will not appear in the Montana state totals. However, the U.S. totals capture these interstate impacts.
Table 4. Top 10 States Ranked by Economic Output: 2006Economic Output Wildife Watchers
California $7,861,784 6,270,000
Florida $5,483,887 4,240,000
Texas $5,199,313 4,225,000
Georgia $2,866,010 1,987,000
New York $2,744,957 3,852,000
Michigan $2,682,981 3,227,000
Pennsylvania $2,617,987 3,947,000
Washington $2,522,788 2,331,000
Colorado $2,498,650 1,819,000
Illinois $2,094,651 2,566,000
USF
WS
John
and
Kar
en H
ollin
gsw
orth
/USF
WS
Wildllife Watching in the U.S.: The Economic Impacts on National and State Economies in 2006 9
Table 5. Total Wildlife-Watching Expenditures and Economic Impacts, State and National Totals: 2006
Retail SalesTotal Multiplier
EffectSalaries, Wages, and
Business Owner’s Income JobsState and Local
Tax RevenueFederal Tax
Revenue
Alabama $450,004,000 $763,019,969 $261,145,268 10,157 $59,073,791 $56,999,666
Alaska $581,051,000 $979,049,156 $365,227,026 7,677 $90,462,951 $73,981,210
Arizona $838,307,000 $1,417,593,023 $497,597,606 15,251 $118,656,059 $112,152,584
Arkansas $607,073,000 $962,498,578 $318,312,411 13,054 $85,419,561 $68,251,298
California $4,179,583,000 $7,861,783,545 $2,898,324,047 71,589 $694,071,367 $661,980,117
Colorado $1,387,737,000 $2,498,650,078 $947,113,528 25,076 $215,195,505 $215,199,322
Connecticut $509,950,000 $850,498,028 $301,057,408 7,723 $61,992,738 $76,117,654
Delaware $130,832,000 $202,985,060 $76,694,358 1,975 $19,534,585 $17,091,820
Florida $3,081,496,000 $5,483,886,801 $1,968,928,284 54,699 $441,174,660 $469,231,344
Georgia $1,615,316,000 $2,866,010,418 $990,509,431 27,830 $210,368,321 $218,156,184
Hawaii $210,414,000 $377,229,745 $138,962,819 4,037 $29,934,131 $28,731,654
Idaho $265,383,000 $443,322,880 $149,546,066 5,903 $35,209,977 $30,692,944
Illinois $1,133,856,000 $2,094,651,278 $732,522,628 19,563 $172,860,981 $173,519,438
Indiana $933,920,000 $1,592,654,298 $534,963,380 18,382 $127,643,050 $117,403,879
Iowa $318,006,000 $504,066,731 $158,346,649 6,133 $39,721,781 $34,458,575
Kansas $156,185,000 $261,312,911 $86,121,213 3,254 $20,595,630 $18,457,552
Kentucky $542,059,000 $876,589,835 $308,469,670 10,463 $76,106,481 $67,004,906
Louisiana $312,430,000 $528,585,799 $174,990,553 7,149 $35,656,732 $32,641,998
Maine $865,643,000 $1,363,283,289 $449,075,022 15,790 $109,088,901 $95,276,497
Maryland $636,214,000 $1,087,487,864 $411,947,664 10,702 $105,700,884 $96,237,501
Massachusetts $754,963,000 $1,323,102,012 $493,832,193 12,782 $118,794,668 $119,220,099
Michigan $1,622,521,000 $2,682,980,647 $888,369,360 25,904 $234,620,066 $208,317,592
Minnesota $698,889,000 $1,257,307,710 $415,020,642 14,461 $94,641,265 $97,402,161
Mississippi $175,846,000 $282,846,960 $89,951,646 3,963 $22,620,022 $17,503,184
Missouri $869,075,000 $1,533,269,199 $492,836,686 18,247 $113,984,610 $110,201,665
Montana $376,451,000 $628,626,746 $213,352,389 9,772 $49,978,388 $49,134,259
Nebraska $141,910,000 $237,121,387 $84,048,964 2,800 $20,308,619 $17,147,832
Nevada $362,229,000 $622,355,747 $223,533,883 7,185 $53,134,171 $55,438,382
New Hampshire $273,920,000 $433,069,336 $138,169,255 4,493 $34,005,945 $36,000,943
New Jersey $537,449,000 $937,971,380 $333,688,184 9,591 $74,972,349 $82,542,184
New Mexico $297,174,000 $517,789,189 $175,613,450 6,926 $45,582,882 $34,331,148
New York $1,567,629,000 $2,744,957,161 $976,341,339 25,557 $253,858,169 $228,315,323
North Carolina $916,903,000 $1,534,848,880 $526,541,060 18,005 $132,702,863 $118,969,021
North Dakota $22,913,000 $34,412,569 $11,274,941 432 $2,640,771 $2,397,510
Ohio $1,187,703,000 $1,959,067,364 $641,229,996 22,527 $161,039,630 $135,181,453
Oklahoma $328,660,000 $566,739,268 $177,134,746 7,872 $38,381,020 $37,310,701
Oregon $776,414,000 $1,356,918,545 $502,803,677 16,185 $123,668,107 $119,329,180
Pennsylvania $1,442,681,000 $2,617,987,223 $880,311,154 27,066 $198,669,207 $201,839,913
Rhode Island $214,247,000 $319,355,116 $103,376,462 3,979 $29,003,444 $25,369,221
South Carolina $550,777,000 $893,737,916 $287,854,340 11,411 $69,282,791 $62,212,355
South Dakota $183,304,000 $212,421,799 $67,739,979 3,150 $14,341,518 $14,171,516
Tennessee $992,362,000 $1,740,506,233 $612,455,711 21,007 $129,813,625 $132,119,631
Texas $2,939,018,000 $5,199,312,905 $1,774,344,227 49,714 $403,654,212 $396,262,200
Utah $564,443,000 $1,011,192,904 $358,663,018 12,291 $84,529,757 $75,424,860
Vermont $122,872,000 $193,752,874 $65,167,085 2,639 $16,187,164 $14,721,048
Virginia $960,190,000 $1,582,376,262 $525,718,997 17,489 $112,281,482 $123,789,859
Washington $1,502,311,000 $2,522,788,253 $863,650,386 25,798 $203,873,231 $206,166,107
West Virginia $241,601,000 $359,959,136 $119,053,839 5,620 $28,318,361 $25,628,823
Wisconsin $744,689,000 $1,239,245,783 $411,909,759 17,166 $111,142,639 $91,313,320
Wyoming $394,869,000 $618,782,924 $212,420,021 8,797 $52,158,264 $47,427,972
United States, total $45,654,959,000 $122,581,880,075 $40,460,527,120 1,063,482 $8,862,580,065 $9,329,700,750

10 Wildllife Watching in the U.S.: The Economic Impacts on National and State Economies in 2006
Wildlife-watching in the U.S. has significant economic impacts at the local, regional, state, and national levels. In 2006 it generated $122.6 billion in economic output, 1.1 million jobs and $18.2 billion in state, local, and federal tax revenues. Wildlife watching’s continued popularity gives evidence to the importance that people attach to diverse, accessible and robust fish and wildlife populations.
The magnitude of its economic impacts prove that wildlife watching is a major force, driving billions in spending around the country. These economic impacts can be the life-blood of a local economy. Rural areas can attract thousands of wildlife watchers each year, generating millions of dollars.
Summary
Deb
bie
McC
rens
ky/U
SFW
S
Wildllife Watching in the U.S.: The Economic Impacts on National and State Economies in 2006 11
American Sportfishing Association. Sportfishing in America: An Economic and Conservation Powerhouse. Washington DC, 2008.
Association of Fish and Wildlife Agencies. Hunting in America: An Economic and Conservation Powerhouse. Washington DC, 2008.
MIG, Inc. IMPLAN System (2004 Data and Software). 1940 South Greeley Street, Suite 101, Stillwater, MN 55082. 2004.
Miller, Ronald E. and Peter D. Blair. Input-Output Analysis: Foundations and Extensions. Englewood Cliffs NJ: Prentice-Hall, 1985.
Olson, Doug and Scott Lindall. IMPLAN Professional Software, Analysis and Data Guide. 1940 South Greeley Street, Suite 101, Stillwater, MN 55082. 1996.
Taylor, Carol, Susan Winter, Greg Alward and Eric Siverts. Micro IMPLAN User’s Guide. Fort Collins CO: U.S. Department of Agriculture – Forest Service, Land Management Planning Systems Group, 1993.
U.S. Department of the Interior, Fish and Wildlife Service and U.S. Department of Commerce, Bureau of the Census. 2006 National Survey of Fishing, Hunting, and Wildlife-Associated Recreation. Washington DC: U.S. Government Printing Office, October 2007.
U.S. Department of Commerce, Bureau of the Census. 1997 Economic Census. Washington DC: U.S. Government Printing Office, April 2000.
Sources
Aar
on C
ollin
s/U
SFW
S
Stev
e H
illeb
rand
/USF
WS

12 Wildllife Watching in the U.S.: The Economic Impacts on National and State Economies in 2006


U.S. Department of the InteriorU.S. Fish & Wildlife Servicehttp://wsfrprograms.fws.gov
Cove
r pho
to: K
aren
Lau
bens
tein
/USF
WS