u.s. department of effect of dynamic envelope pavement
TRANSCRIPT

U.S. Department of Transportation
Federal Railroad Administration
Effect of Dynamic Envelope Pavement Markings on Vehicle Driver Behavior at a Highway-Rail Grade Crossing
Office of Research and Development Washington, DC 20590
DOT/FRA/ORD-14/04 Final Report April 2014

NOTICE
This document is disseminated under the sponsorship of the Department of Transportation in the interest of information exchange. The United States Government assumes no liability for its contents or use thereof. Any opinions, findings and conclusions, or recommendations expressed in this material do not necessarily reflect the views or policies of the United States Government, nor does mention of trade names, commercial products, or organizations imply endorsement by the United States Government. The United States Government assumes no liability for the content or use of the material contained in this document.
NOTICE
The United States Government does not endorse products or manufacturers. Trade or manufacturers’ names appear herein solely because they are considered essential to the objective of this report.

iii
NSN 7540-01-280-5500 Standard Form 298 (Rev. 2-89) Prescribed by ANSI Std. 239-18
298-102
REPORT DOCUMENTATION PAGE Form Approved OMB No. 0704-0188
Public reporting burden for this collection of information is estimated to average 1 hour per response, including the time for reviewing instructions, searching existing data sources, gathering and maintaining the data needed, and completing and reviewing the collection of information. Send comments regarding this burden estimate or any other aspect of this collection of information, including suggestions for reducing this burden, to Washington Headquarters Services, Directorate for Information Operations and Reports, 1215 Jefferson Davis Highway, Suite 1204, Arlington, VA 22202-4302, and to the Office of Management and Budget, Paperwork Reduction Project (0704-0188), Washington, DC 20503.
1. AGENCY USE ONLY (Leave blank)
2. REPORT DATE April 2014
3. REPORT TYPE AND DATES COVERED Technical Report
4. TITLE AND SUBTITLE Effect of Dynamic Envelope Pavement Markings on Vehicle Driver Behavior at a Highway-Rail Grade Crossing
5. FUNDING NUMBERS
RR97A6/KT925
RR97A6/LT925
6. AUTHOR(S) Scott H Gabree, Ph.D., Stephanie Chase Ph.D., and Marco daSilva 7. PERFORMING ORGANIZATION NAME(S) AND ADDRESS(ES) U.S. Department of Transportation Research and Innovative Technology Administration John A. Volpe National Transportation Systems Center 55 Broadway Cambridge, MA 02142
8. PERFORMING ORGANIZATION REPORT NUMBER
DOT-VNTSC-FRA-13-05
9. SPONSORING/MONITORING AGENCY NAME(S) AND ADDRESS(ES) U.S. Department of Transportation Federal Railroad Administration Office of Railroad Policy and Development Office of Research and Development Washington, DC 20590
10. SPONSORING/MONITORING AGENCY REPORT NUMBER
DOT/FRA/ORD-14/04
11. SUPPLEMENTARY NOTES Program Manager: Tarek Omar, D.Sc. 12a. DISTRIBUTION/AVAILABILITY STATEMENT This document is available to the public through the FRA Web site at http://www.fra.dot.gov.
12b. DISTRIBUTION CODE
13. ABSTRACT (Maximum 200 words) The U. S. Department of Transportation’s (U.S. DOT) Research and Innovative Technology Administration’s (RITA) John A. Volpe National Transportation Systems Center (Volpe Center), under the direction of the U.S. DOT Federal Railroad Administration (FRA) Office of Research and Development (R&D), conducted a research study to evaluate the effectiveness of roadway pavement markings placed within the dynamic envelope, the region between and immediately adjacent to the tracks at a highway-rail grade crossing, and new corresponding signage at the Commercial Boulevard grade crossing in Ft. Lauderdale, FL. The goal of the added markings and signage is to reduce the number of vehicles that come to a stop within the dynamic envelope, a violation of most applicable State highway traffic laws, thus reducing the possibility that a vehicle is present on the tracks when a train approaches. Results indicate that the addition of the dynamic envelope pavement markings and modified signage reduced the number of vehicles that stopped within the dynamic envelope zone and increased the number of vehicles that stopped properly—safely behind the stop line. Though these results seem to indicate that dynamic envelope pavement markings and signage may be an effective way to increase safe behavior, these safety enhancements have only been studied at one crossing. Additional field testing is necessary before recommendations for wider use can be made.
14. SUBJECT TERMS highway-rail, grade crossing, driver behavior, violations, enhancement, safety, signage, pavement markings, dynamic envelope
15. NUMBER OF PAGES 49
16. PRICE CODE
17. SECURITY CLASSIFICATION OF REPORT Unclassified
18. SECURITY CLASSIFICATION OF THIS PAGE Unclassified
19. SECURITY CLASSIFICATION OF ABSTRACT Unclassified
20. LIMITATION OF ABSTRACT

iv
METRIC/ENGLISH CONVERSION FACTORS ENGLISH TO METRIC METRIC TO ENGLISH
LENGTH (APPROXIMATE) LENGTH (APPROXIMATE) 1 inch (in) = 2.5 centimeters (cm) 1 millimeter (mm) = 0.04 inch (in) 1 foot (ft) = 30 centimeters (cm) 1 centimeter (cm) = 0.4 inch (in)
1 yard (yd) = 0.9 meter (m) 1 meter (m) = 3.3 feet (ft) 1 mile (mi) = 1.6 kilometers (km) 1 meter (m) = 1.1 yards (yd)
1 kilometer (km) = 0.6 mile (mi)
AREA (APPROXIMATE) AREA (APPROXIMATE) 1 square inch (sq in, in2) = 6.5 square centimeters (cm2) 1 square centimeter (cm2) = 0.16 square inch (sq in, in2)
1 square foot (sq ft, ft2) = 0.09 square meter (m2) 1 square meter (m2) = 1.2 square yards (sq yd, yd2) 1 square yard (sq yd, yd2) = 0.8 square meter (m2) 1 square kilometer (km2) = 0.4 square mile (sq mi, mi2) 1 square mile (sq mi, mi2) = 2.6 square kilometers (km2) 10,000 square meters (m2) = 1 hectare (ha) = 2.5 acres
1 acre = 0.4 hectare (he) = 4,000 square meters (m2)
MASS - WEIGHT (APPROXIMATE) MASS - WEIGHT (APPROXIMATE) 1 ounce (oz) = 28 grams (gm) 1 gram (gm) = 0.036 ounce (oz) 1 pound (lb) = 0.45 kilogram (kg) 1 kilogram (kg) = 2.2 pounds (lb)
1 short ton = 2,000 pounds (lb)
= 0.9 tonne (t) 1 tonne (t)
= =
1,000 kilograms (kg) 1.1 short tons
VOLUME (APPROXIMATE) VOLUME (APPROXIMATE) 1 teaspoon (tsp) = 5 milliliters (ml) 1 milliliter (ml) = 0.03 fluid ounce (fl oz)
1 tablespoon (tbsp) = 15 milliliters (ml) 1 liter (l) = 2.1 pints (pt) 1 fluid ounce (fl oz) = 30 milliliters (ml) 1 liter (l) = 1.06 quarts (qt)
1 cup (c) = 0.24 liter (l) 1 liter (l) = 0.26 gallon (gal) 1 pint (pt) = 0.47 liter (l)
1 quart (qt) = 0.96 liter (l) 1 gallon (gal) = 3.8 liters (l)
1 cubic foot (cu ft, ft3) = 0.03 cubic meter (m3) 1 cubic meter (m3) = 36 cubic feet (cu ft, ft3) 1 cubic yard (cu yd, yd3) = 0.76 cubic meter (m3) 1 cubic meter (m3) = 1.3 cubic yards (cu yd, yd3)
TEMPERATURE (EXACT) TEMPERATURE (EXACT)
[(x-32)(5/9)] °F = y °C [(9/5) y + 32] °C = x °F
QUICK INCH - CENTIMETER LENGTH CONVERSION10 2 3 4 5
InchesCentimeters 0 1 3 4 52 6 1110987 1312
QUICK FAHRENHEIT - CELSIUS TEMPERATURE CONVERSION -40° -22° -4° 14° 32° 50° 68° 86° 104° 122° 140° 158° 176° 194° 212°
°F
°C -40° -30° -20° -10° 0° 10° 20° 30° 40° 50° 60° 70° 80° 90° 100°
For more exact and or other conversion factors, see NIST Miscellaneous Publication 286, Units of Weights and Measures. Price $2.50 SD Catalog No. C13 10286 Updated 6/17/98

v
Acknowledgements
The U.S. Department of Transportation (U.S. DOT) Federal Railroad Administration (FRA) Office of Research and Development sponsored the work leading to this report. The authors would like to thank Sam Alibrahim, Chief of the Train Control and Communications Division, FRA, and Tarek Omar, D.Sc., Program Manager, Train Control and Communications Division, FRA Office of Research and Development, for their guidance during the project and in developing this report.
The authors would like to thank Bianka Mejia, Surface Transportation Human Factors Division, U.S. DOT Research and Innovative Technology Administration’s John A. Volpe National Transportation Systems (Volpe Center), for her support in data collection and analysis.
The authors would also like to thank William Baron, Security and Emergency Management Division, and Alan Kauffman of Computer Science Corporation, Volpe Center onsite contractor, for their technical support in data collection system development, installation, and maintenance.
Additional thanks to Brian Reeves, Florida Department of Transportation (FDOT) Office of Modal Development onsite contractor, as well as to the FDOT District Four field personnel for their part in supporting this evaluation effort.

vi
Contents
Executive Summary ........................................................................................................................ 1
1. Introduction ................................................................................................................. 2 1.1 Past Research ............................................................................................................... 2 1.2 Background ................................................................................................................. 5 1.3 Overall Approach ........................................................................................................ 6 1.4 Organization of the Report .......................................................................................... 6
2. Pavement Markings and Signage ................................................................................ 7
3. Test Site Location and Data Collection ..................................................................... 12 3.1 Test Site Location Characteristics ............................................................................. 12 3.2 Data Collection .......................................................................................................... 16
4. Data Analysis Method ............................................................................................... 18
5. Results ....................................................................................................................... 21 5.1 Traffic Patterns .......................................................................................................... 21 5.2 Motorist Stopping Behavior ...................................................................................... 22 5.3 Violations .................................................................................................................. 30 5.4 Summary of Findings ................................................................................................ 33
6. Conclusion and Discussion........................................................................................ 34 6.1 Next Steps .................................................................................................................. 34
7. Potential Limitations ................................................................................................. 36
8. References ................................................................................................................. 37
Appendix A. Additional Examples .............................................................................................. 38
Abbreviations and Acronyms ....................................................................................................... 41

vii
Illustrations
Figure 1. Barberville Rural Crossing with X-Box Markings (excerpted from Stevens and Long, 2002) ....................................................................................................................................... 4
Figure 2. Example of Dynamic Envelope from MUTCD (Figure 8B-8) ....................................... 7
Figure 3. Schematic of Dynamic Envelope Zone Markings at Commercial Boulevard Grade Crossing .................................................................................................................................. 9
Figure 4. Accompanying Signage at Commercial Boulevard Grade Crossing ............................ 10
Figure 5. Dynamic Envelope Zone Pavement Markings at Commercial Boulevard .................... 11
Figure 6. Dynamic Envelope Zone Modified Signage at Commercial Boulevard ....................... 11
Figure 7. Commercial Boulevard Grade Crossing Satellite Image............................................... 12
Figure 8. Lane Coding Scheme for Commercial Boulevard Grade Crossing............................... 13
Figure 9. Example of Traffic Backed up on Westbound Lanes .................................................... 14
Figure 10. Example of Traffic Backed up on Eastbound Lanes ................................................... 15
Figure 11. Camera Setup on Pole along Commercial Boulevard ................................................. 16
Figure 12. Camera and Solar Panel (left) and Utility Box (right) ................................................ 16
Figure 13. Camera Setup to Capture Eastbound (red) and Westbound (yellow) Traffic ............. 17
Figure 14. Zone Assignments ....................................................................................................... 19
Figure 15. Proportion of Eastbound Vehicles Stopping by Zone ................................................. 23
Figure 16. Eastbound Zone 2 (yellow circles) and Zone 3 (red circle) Stopping Behaviors ........ 23
Figure 17. Eastbound Zone 2 (yellow circle) and Zone 3 (red circles) Stopping Behaviors ........ 24
Figure 18. Proportion of Westbound Vehicles Stopped by Zone ................................................. 25
Figure 19. Westbound Zone 1 (green circles) and Zone 4 (yellow circle) Stopping Behaviors ... 26
Figure 20. Westbound Zone 1 (green circles), Zone 2 (yellow circle), Zone 3 (red circle), and Zone 4 (rightmost yellow circle) Stopping Behaviors .......................................................... 27
Figure 21. Example of a Vehicle Performing a U-Turn ............................................................... 29
Figure 22. Example of a Vehicle Changing Lanes to Exit Tracks................................................ 29
Figure 23. Eastbound Vehicles Trapped Inside Gates During an Activation ............................... 32
Figure 24. Westbound Vehicles Trapped Inside Gates During an Activation .............................. 32
viii
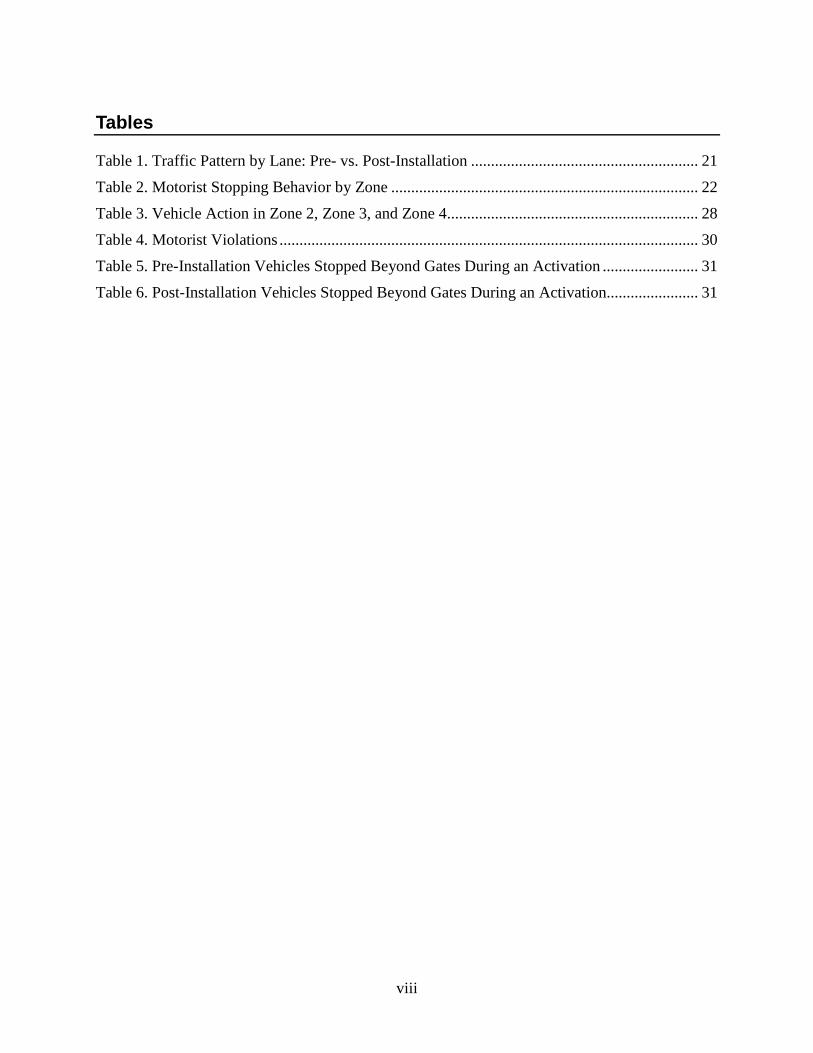
Tables
Table 1. Traffic Pattern by Lane: Pre- vs. Post-Installation ......................................................... 21
Table 2. Motorist Stopping Behavior by Zone ............................................................................. 22
Table 3. Vehicle Action in Zone 2, Zone 3, and Zone 4 ............................................................... 28
Table 4. Motorist Violations ......................................................................................................... 30
Table 5. Pre-Installation Vehicles Stopped Beyond Gates During an Activation ........................ 31
Table 6. Post-Installation Vehicles Stopped Beyond Gates During an Activation....................... 31

1
Executive Summary
There are more than 212,000 highway-rail grade crossings in the United States. Deaths resulting from highway-rail grade crossing collisions and trespasser events account for approximately 95 percent of all rail-related fatalities each year. In 2013, there were 2,087 incidents at these highway-rail grade crossings. Of the 2,087 incidents, there were 943 injuries and 250 fatalities.1 In addition to the injuries and loss of life that occur at grade crossings, financial burdens from delays in service and damage to the train or track are also of concern. The Federal Railroad Administration (FRA) is involved with numerous wide-ranging engineering, education, and enforcement efforts to increase highway-rail grade crossing safety by reducing the number, frequency, and severity of incidents that occur each year. The study described in this document is a safety improvement effort being conducted by the Florida Department of Transportation (FDOT).
This study evaluated the effectiveness of pavement markings placed within the dynamic envelope, the region between and immediately adjacent to the tracks at a grade crossing, and new corresponding signage at the Commercial Boulevard grade crossing (ID# 628186E) in Ft. Lauderdale, FL. The goal of the added markings and signage is to positively influence driver behavior and reduce the number of vehicles that come to a stop within the dynamic envelope, thus reducing the possibility that a vehicle is present on the tracks when a train approaches, which would not only be dangerous to the vehicle occupants but also to standers-by, train crews, and train passengers.
Researchers coded driver stopping behavior at this crossing for two 14-day periods. Vehicles were coded as having stopped in one of four zones: behind the stop line and gate arm (Zone 1), past the stop line but before the tracks (Zone 2), on the tracks (Zone 3), or immediately after the tracks (Zone 4). Stopping in Zone 3 is considered to be the most dangerous driver behavior, while stopping in Zone 1 is the safest.
Results indicate that the addition of the dynamic envelope pavement markings and modified signage reduced the proportion of vehicles that stopped in Zone 3. They also increased the proportion of vehicles that stopped in Zone 1. Additionally, fewer vehicles were found to stop in both Zone 2 and Zone 4, which are both moderately dangerous.
Despite the positive results with safe stopping behavior, there were less conclusive results when looking at motorists’ actions. Pavement markings and signage did not cause motorists to act differently once they had come to a stop in one of the dangerous zones, Zones 2–4 (i.e., drivers were not more likely to try to switch lanes or reverse to exit the crossing once stopped).
Though these results seem to indicate that dynamic envelope pavement markings and signage may be an effective way to increase safe stopping behavior, they have only been studied at one crossing. Additional field testing and analysis is necessary before more recommendations for wider use can be made.
1 Obtained from the FRA Office of Safety Analysis Web site: http://safetydata.fra.dot.gov/officeofsafety/default.aspx on April 4, 2014

2
1. Introduction
There are more than 212,000 highway-rail grade crossings in the United States. Deaths resulting from highway-rail grade crossing collisions and trespasser events account for approximately 95 percent of all rail-related fatalities each year. In 2013, there were 2,087 incidents at these highway-rail grade crossings. Of the 2,087 incidents, there were 943 injuries and 250 fatalities.2 In addition to the injuries and loss of life that occur at grade crossings, financial burdens from delays in service and damage to the train or track are also of concern. FRA is involved with numerous wide-ranging engineering, education, and enforcement efforts to increase highway-rail grade crossing safety by reducing the number, frequency, and severity of incidents that occur each year. The study described in this document is a safety improvement effort being conducted by FDOT.
This study evaluated the effectiveness of pavement markings placed within the dynamic envelope and new corresponding signage at the Commercial Boulevard grade crossing (ID# 628186E) in Ft. Lauderdale, FL. The goal of the added markings and signage is to reduce the number of vehicles that come to a stop within the dynamic envelope, thus reducing the possibility that a vehicle is present on the tracks when a train approaches.
1.1 Past Research
1.1.1 Pavement Markings and Signage Though to our knowledge there have not been any studies of dynamic envelope pavement markings, studies on other types of pavement markings have been conducted since the 1960s. Early research studies on pavement markings, specifically edge line markings, were shown to reduce the likelihood of a crash (Musick, 1962; Basile, 1962). The safety benefit of edge line markings was shown in both studies to be most beneficial during nighttime driving, likely due to the reflectivity of the markings off the headlights.
However, despite evidence that pavement markings (e.g., edge line markings) for roadway guidance purposes can provide added safety benefits, research on the safety benefits of pavement markings that are used for pedestrian or railroad crossings is less clear. For example, pedestrian-motor vehicle collisions were more than twice as likely to occur at sites marked with a crosswalk than at sites with no crosswalk markings; this was especially true at sites not accompanied by a traffic signal or stop sign, even after controlling for pedestrian and vehicle flow and crossing length (Koepsell, McCloskey, Wolf, Vernez-Moudon, Buchner, Kraus & Patterson, 2002). Other research has concluded that the addition of a sign prompting drivers to yield to pedestrians may help to improve safe driving behavior around pavement markings. Van Houten, Malenfant, and McCusker (2001) investigated driver behavior at pedestrian crosswalks after the installation of advance yield markings and an accompanying sign prompting motorists to yield to pedestrians at the markings. Findings showed that the pavement markings and corresponding signage increased the distance that motorists stopped in front of the crosswalk and decreased the number of motor 2 Obtained from the FRA Office of Safety Analysis Web Site: http://safetydata.fra.dot.gov/officeofsafety/default.aspx on April 4, 2014

3
vehicle-pedestrian conflicts. This result was demonstrated with the signage placed at various distances from the pavement marking (10m, 15m, and 25m) all of which produced similar results. In 2004, Huybers, Van Houten, and Malenfant showed a similar change in driver behavior (i.e., reduction in vehicle-pedestrian conflicts and increased yielding distance) using advanced yield pavement markings and signage. However, they also determined that the same changes in driver behavior were found with only pavement markings, indicating that the pavement markings were the essential component producing safer driver behavior.
Pavement markings and signage are also often used in an attempt to keep drivers from blocking intersections. The Manual of Uniform Traffic Control Devices (MUTCD) includes a section on “Do Not Block Intersection Markings.”3 The guidance in this section of the MUTCD includes pavement markings and signage. Pavement markings may include crosshatch lines or wording such as “Do Not Block” or “Keep Clear.”. The signage described in the MUTCD says “Do Not Block Intersection” and is intended to be mounted before or above the intersection.
One such campaign aimed at reducing the number of vehicles stopping in major intersections was initiated in New York City in 1980. This effort, known as “Don’t Block the Box,” included the installation of crosshatch pavement markings covering several major intersections, along with accompanying signage which stated “Don’t Block the Box.” Ticket “blitzes” were also conducted to issue fines to individuals found to be blocking the intersection. However, a 2006 report showed that the early positive impacts of this effort may have faded away (Stringer, 2006)4. During a 9-hour period at 10 busy Manhattan intersections, 3,044 vehicles blocked the box and prevented traffic flow. Despite traffic officers being present for many of these incidents, no tickets were issued. There is no known estimate of the number of vehicles blocking the box prior to this campaign, so the effect of this effort cannot be determined; however, a stronger enforcement presence may improve compliance.
1.1.2 Grade Crossing Pavement Markings and Signage These previous studies show conflicting evidence regarding the safety benefits of pavement markings and accompanying signage. However, when such safety implementations are used at highway-rail grade crossings, different challenges must be considered. Specifically, at a highway-rail grade crossing it is important not only for vehicles to stop prior to the crossing when a train is present, but also for the safety instruments to alert drivers to a crossing ahead so that they do not come to a stop on the tracks at any point in time.
Driver stopping on the railroad tracks is an issue which has prompted the development of mitigation strategies to reduce this behavior. One such strategy is the preemption of traffic signals to turn green when gate activation occurs (Institute of Transportation Engineers, 1997). This preemption method is used across the United States and is intended to clear any possible queue of vehicles stopped on the tracks prior to the train’s arrival at the crossing. The MUTCD recommends that preemption be considered for any highway-rail grade crossing within 200 feet of a signalized intersection. The Institute of Transportation Engineers (ITE), a community of almost 17,000 transportation professionals, recommends preemption based on a detailed queuing
3 http://mutcd.fhwa.dot.gov/htm/2009/part3/fig3b_18_longdesc.htm 4 http://www.mbpo.org/uploads/policy_reports/DONT%20BLOCK%20THE%20BOX.pdf

4
analysis. Such recommendations have prompted research into how best to manage traffic signal preemption at grade crossings based on characteristics of the crossing and traffic patterns (e.g., Long, 2003).
Although preemption techniques can help to clear a crossing in the event that a train approaches the crossing, any situation in which a vehicle comes to a complete stop on the railroad tracks is dangerous. For example, a traffic signal near a grade crossing can create a situation where a line of vehicles builds up behind a red signal. If this line of vehicles backs up to the grade crossing, vehicles can choose to proceed forward onto the tracks behind the vehicle in front of them or wait a distance back. The best course of action that a driver can take is to wait to enter the crossing (i.e., stay behind the stop line where the gate arm is located) until the traffic has already cleared. This is the safest action that a motorist can take and never risks the driver being stuck on the tracks without a means to escape. However, motorists do not always behave safely and often enter the crossing before the traffic on the opposite site of the tracks has cleared, causing them to come to a stop on the tracks. One pavement marking design, the “X-box,” has been tested to measure its ability to keep drivers from entering the crossing until there is sufficient space on the opposite side of the track for their vehicle to exit the crossing. See Figure 1 for a representation of the “X-box” pavement marking, as shown in Stevens and Long, 2003.
Figure 1. Barberville Rural Crossing with X-Box Markings (excerpted from Stevens and Long, 2003)

5
The X-box is a 25-foot long rectangle with an “X” inside it that is drawn just beyond the tracks. This marking lets drivers know that if they cannot see the full “X,” there is not enough space for their vehicle to fit beyond the tracks and they should wait until the X-box has cleared before proceeding to cross the tracks. Stevens and Long (2003) studied two X-box installations to evaluate their effect on driver stopping behavior in an urban setting and in a rural setting, neither setting accompanied by signage. The urban environment tested in this study was on Commercial Boulevard in Ft. Lauderdale, FL, the same site being investigated in the current study. They found significant reductions in driver stopping behavior on or adjacent to the tracks in a rural setting, but found no significant change in driver stopping rates in an urban environment.
Given that this X-box design was ineffective at increasing safe driver behaviors in an urban setting, it may be worthwhile to explore other options for alternative pavement markings or for added signage in an urban setting. The purpose of this study is to assess the effects of a new, more conspicuous pavement marking design and accompanying signage on driving behavior. This pavement marking design will not be placed after the crossing, but will completely fill the region known as the dynamic envelope between and around the railroad tracks.
1.2 Background The Commercial Boulevard grade crossing in Ft. Lauderdale, FL, is a site where drivers often find themselves stopped on the railroad tracks. Since 1979, 20 incidents have been reported to FRA at this crossing and 18 of these incidents involved a vehicle coming to a complete stop on the tracks (the other two involved pedestrians)5. The following vehicle-related incidents occurred at this crossing:
• The vehicle came to a stop on the tracks and could not or did not exit because of vehicles in front and a gate behind (n = 13).
• The vehicle was coded as having stopped before proceeding onto the tracks where it was then struck (n = 2).
• The vehicle went around the descended gates and was struck by the train (n = 1).
• The vehicle drove around the gates and into the train (n = 1).
• The driver turned onto the tracks, mistaking the railway for a road (n = 1). FDOT looked at driver behaviors at this crossing in a 2003 study of the South Florida Railroad Corridor. As a part of this effort, FDOT recorded video at several crossings along the South Florida Railroad Corridor, including the Commercial Boulevard grade crossing. During the study, 2,449 two-minute video clips were examined (for a total of more than 81 hours of video). According to these video clips, a total of 201 vehicles stopped on (149) or near (52) the tracks. The majority of those vehicles were stopping in inner lanes (i.e., not from the outermost lanes). Eastbound traffic at the Commercial Boulevard grade crossing was found to have the most problems of all the crossings studied. Seventy-two percent of the drivers who stopped on the tracks chose to take no action once stopped on the tracks (e.g., rather than reverse or change
5 The 20 incidents can be found on the FRA Safety Data website. Incident numbers: 087907405, 088007405, 078107404, 072981A, 108412407, 102284A, 1201874A, 128412403, 0904921, 1007931, 040494, 100112023, 050312007, 112105, 000016942, 050906 (pedestrian), 010809 (pedestrian), 113075, 111909, 000081538

6
lanes). Lastly, drivers at this crossing also violated the crossing while the gates were in motion, with westbound traffic violating more than twice as often as eastbound traffic.
FDOT decided to take action to increase safe driver behavior and reduce the number of incidents occurring at this crossing. FDOT determined that the best option for improving safe driving behaviors at this crossing was to add pavement markings to the area around the tracks known as the “dynamic envelope” and include accompanying signage instructing drivers not to stop in this area. The dynamic envelope is the area a train occupies as it passes through a crossing. Since a train extends beyond the track on which it travels, the dynamic envelope includes the track itself, the area between the rails, and 6 feet in either direction from the tracks (see section 2 for additional details). The goal of the pavement markings and signage is to make the zone on and around the tracks clearer to drivers. If the zone is more conspicuous, motorists may be more aware of the crossing and less likely to enter the tracks and be stuck as a train approaches.
1.3 Overall Approach To understand the effect of the dynamic envelope pavement markings and signage on driving behavior, driver stopping behavior was coded both before and after the installation. Video data was collected 8 hours per day (from 7:30 to 9:30 a.m., 11 a.m. to 1 p.m., 4 p.m. to 6 p.m., and 10 p.m. to 12 a.m.) for 14 continuous days before installation and then again 4 weeks after installation. In total, 224 hours of video (112 before and 112 after dynamic envelope marking installation) were collected and analyzed to measure the effectiveness of this installation.
1.4 Organization of the Report This report is organized as follows:
• Chapter 2 provides the dynamic envelope improvement specifications.
• Chapter 3 provides an overview of the test site location and data collection activities.
• Chapter 4 describes the analyses.
• Chapter 5 presents findings.
• Chapter 6 presents the conclusions of the study and offers recommendations for next steps.

7
2. Pavement Markings and Signage
The strategy that was chosen to reduce the number of motorists stopping on the railroad tracks was to paint the dynamic envelope with brightly colored paint and modify existing signage to match this new paint scheme. The MUTCD is a document developed by the Federal Highway Administration (FHWA) under 23 Code of Federal Regulations (CFR), Part 655, Subpart F, which defines standards for the installation and maintenance of traffic control devices6. The most recent MUTCD (revised May 2012)7 defines the “Dynamic Envelope” as “the clearance required for light rail transit traffic or a train and its cargo overhang due to any combination of loading, lateral motion, or suspension failure.” Any object within the dynamic envelope has the potential to be struck by a train as the train passes through the crossing. Figure 2 shows an example of the dynamic envelope as defined in Figure 8B-8 of the MUTCD.
Figure 2. Example of Dynamic Envelope from MUTCD (Figure 8B-8)
6 http://mutcd.fhwa.dot.gov/ 7 http://mutcd.fhwa.dot.gov/kno_2009r1r2.htm

8
For this implementation, the entire dynamic envelope was painted. The entire area between the two sets of tracks (and between each individual set of tracks) was painted yellow, while the area extending 6 feet outside the tracks was panted yellow with a white ‘X’ pattern. The schematic in Figure 3 shows where the yellow and white paint were applied to the crossing.
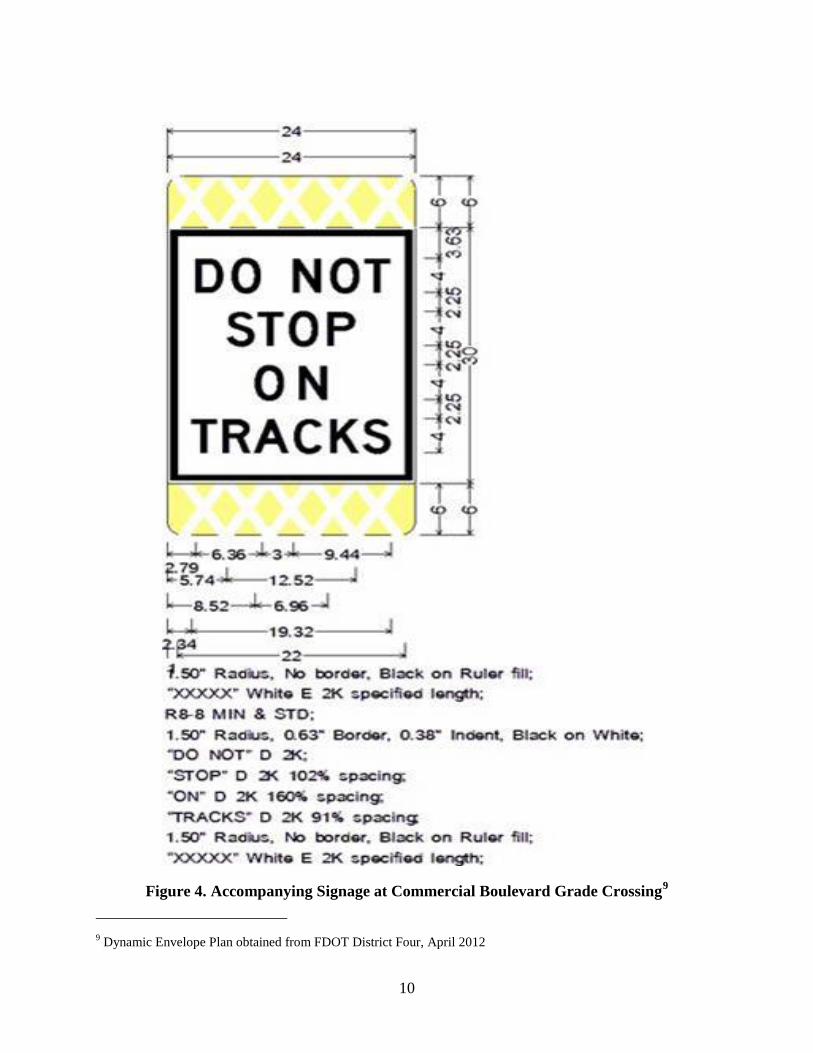
In addition to the pavement markings, existing “DO NOT STOP ON TRACKS” (R8-8) signs were replaced with a modified R8-8 sign with a similar yellow and white pattern added to instruct motorists on how to behave at the crossing. The accompanying sign, which can be seen in Figure 4, displays the text ”DO NOT STOP ON TRACKS”. This modified signage replaced the existing signs on poles along the median of the boulevard and on the sidewalks on the opposite side of the tracks from the oncoming traffic. The signage facing eastbound traffic was placed at 65 feet (sidewalk sign) and 85 feet (median sign) past the stop line for the crossing. Both sidewalk and median signage facing westbound traffic were placed at 90 feet past the stop line for the crossing. Each newly modified sign was attached to the same poles to which the prior R8-8 sign had been secured. As with the original signage, this pole included flashing yellow lights to increase its conspicuity to approaching motorists. Images of the pavement marking (left and right) and signage (right) installation are shown in Figure 5 and Figure 6, respectively.
The installation occurred overnight over a 2-day period from December 9 to10, 2012. The installation of the pavement markings and associated signage at this crossing cost $37,000.

9
Figure 3. Schematic of Dynamic Envelope Zone Markings at Commercial Boulevard Grade Crossing8 8 Dynamic Envelope Plan obtained from FDOT District Four, April 2012
10
Figure 4. Accompanying Signage at Commercial Boulevard Grade Crossing9 9 Dynamic Envelope Plan obtained from FDOT District Four, April 2012

11
Figure 5. Dynamic Envelope Zone Pavement Markings at Commercial Boulevard
Figure 6. Dynamic Envelope Zone Modified Signage at Commercial Boulevard

12
3. Test Site Location and Data Collection
The site chosen for this effort was the grade crossing on Commercial Boulevard in Ft. Lauderdale, FL (ID# 628186E). This location was chosen by FDOT because of its historically high grade crossing crash risk.
3.1 Test Site Location Characteristics There are two active railroad tracks which intersect with the Commercial Boulevard crossing. According to the U.S. DOT Crossing Inventory data, approximately 51 trains move through this crossing daily at speeds ranging from 74 to 79 mph10. Both passenger (TriRail and Amtrak) and freight (CSX) trains pass through this crossing. The estimated daily highway user traffic at this crossing is 69,000 vehicles per day with a posted speed limit of 45 miles per hour (mph). Figure 7 shows a satellite image of this area, with the specific crossing outlined by the white dashed box.
Figure 7. Commercial Boulevard Grade Crossing Satellite Image
10 Grade crossing inventory data can be obtained from the FRA Safety Data website at http://safetydata.fra.dot.gov/OfficeofSafety/PublicSite/Crossing/Crossing.aspx. Data in this report was gathered on June 5, 2013.

13
3.1.1 Westbound The location of the grade crossing is complex in many ways. First, the westbound traffic through the crossing is on a section of roadway immediately west of the off-ramp from Interstate 95. There are four lanes for traffic traveling westbound through the crossing. Figure 8 shows the nine lanes that cross the tracks (four westbound and five eastbound) were coded numerically and are shown in Figure 8.
Figure 8. Lane Coding Scheme for Commercial Boulevard Grade Crossing
Lane 1 includes primarily vehicles exiting from Interstate 95 South (I95S). There is a traffic light approximately 800 feet to the west of the grade crossing at Powerline Road; however, that road layout creates a situation in which traffic can back up into the crossing because of the long red light phase (the traffic light includes a 120-second red light and a 75-second green light phase). Figure 9 provides an example of traffic backing up through the crossing. Vehicles in both Lane 2 and Lane 4 are backed up onto the tracks and a vehicle in Lane 4 has stopped before the tracks, but after the stop line.

14
Figure 9. Example of Traffic Backed up on Westbound Lanes

15
3.1.2 Eastbound There are five lanes of traffic traveling eastbound through the crossing (see Figure 8 for representation of crossing). Lane 9 primarily includes vehicles entering the on-ramp for I95S. Vehicles typically use Lane 5 and Lane 6 to prepare to turn left after the traffic light to enter the on-ramp to I95N (this left turn is just after the I95 overpass that is to the east of the crossing in Figure 7). A traffic light approximately 150 feet from the grade crossing would likely create a traffic backup with a high volume of traffic pushed into the dynamic envelope for all lanes except Lane 9, which exits before the traffic light. Figure 10 shows an example of a traffic backup situation. No vehicles are stopped directly on the tracks in this example, but all lanes except Lane 9 are backed up and vehicles in Lane 5, Lane 6, and Lane 7 have all pulled past the stop line and risk being stuck inside the crossing if an activation occurs.
Figure 10. Example of Traffic Backed up on Eastbound Lanes

16
3.2 Data Collection A video-based data collection system was installed at the crossing on May 23, 2012. Two separate systems were mounted on poles adjacent to the roadway to capture video of vehicles travelling in both directions on Commercial Boulevard. Each pole had a solar panel and camera mounted high on the pole to obtain a good vantage point from which to see vehicles passing through the crossing. Figure 11 shows an example of the pole with the solar panel and camera and utility box with battery and digital video recorder. Closer images of the camera and solar panel (left) and utility box (right) can be seen in Figure 12.
Figure 11. Camera Setup on Pole along Commercial Boulevard
Figure 12. Camera and Solar Panel (left) and Utility Box (right)
Solar Panel and Camera
Utility Box

17
The utility box housed the following components: a solar controller, battery, fan, temperature and voltage loggers, temperature switch, and a digital video recorder (DVR).
Two of these setups (camera, solar panel, and utility box) were installed to monitor the Commercial Boulevard grade crossing traffic approaching from both sides. The locations of the two cameras can be seen in Figure 13. The red shading indicates the area captured by Camera 1, which was positioned to record westbound traffic, and the yellow shading indicates the area captured by Camera 2, which was positioned to record eastbound traffic.
Figure 13. Camera Setup to Capture Eastbound (red) and Westbound (yellow) Traffic
Camera 1
Camera 2

18
4. Data Analysis Method
The goal of this research study was to gain an understanding of how effectively the pavement markings on the dynamic envelope and accompanying signage at a highway grade crossing can influence driver behavior at grade crossings. The addition of the dynamic envelope markings and signage was intended to make this area more pronounced, resulting in fewer motorists entering the dynamic envelope if unable to exit the other side.
To understand the effect of the dynamic envelope pavement markings and signage on driving behavior, driver stopping behavior was coded both before and after the installation. Video data was collected from the wayside cameras, 8 hours per day (between 7:30 and 9:30 a.m., 11 a.m. and 1 p.m., 4 and 6 p.m., and 10 p.m. and 12 a.m.) for 14 continuous days (a total of 112 hours of data before installation and then again 4 weeks after installation. The pre-installation data collection took place between May 26, 2012, and June 9, 2012 (no data was collected on Memorial Day, May 28). The pavement markings and signage modifications were installed on December 9 and 10, 2012, and the post-installation data collection took place between January 6 and January 19, 2013. The 4 weeks between the installation of the markings and the post-installation data collection allowed for drivers who frequently pass through this crossing to become familiar with the markings. The researchers ascertained that initial reactions to the new markings would likely not illicit behaviors that reflect long-term behavior changes. By delaying data collection for 4 weeks, the motorist behaviors as they approach the pavement markings were more likely to reflect longer term effects and not immediate novelty effects from the markings and signage. In total, 224 hours of video (112 before and after dynamic envelope marking installation) were collected and analyzed to measure the effectiveness of this installation.
A coder analyzed each of the 224 hours of video. If the coder was unsure how to code a specific vehicle, a second researcher was brought in to help make a determination. Researchers watched approximately 1 hour of videos alongside the coder initially to verify that the coding was being completed according to the established coding scheme. All data were entered into a Microsoft Excel spreadsheet for analysis.
Driver stopping behavior was coded based on four possible zones in which a motorist could come to a complete stop. The locations of these four zones are shown in Figure 14 below. A driver was considered to have stopped if:
• the driver’s forward momentum came to a complete halt, or
• the driver’s forward momentum slowed to a near stop because of stopped traffic directly ahead.
Only vehicles that stopped in one of these four zones were coded (i.e., vehicles that passed through the crossing without stopping were not included in our study). In Zone 1, a vehicle was coded if the driver stopped in Zone 1 without any vehicles immediately in front of it. This coding scheme ensured that the driver stopping in Zone 1 was performing a safe behavior and not simply stopping because of traffic. Vehicles stopping in other zones had already chosen to perform an unsafe action, so a similar caveat was unnecessary. For example, if a driver came to a stop in Zone 3 with vehicles directly in front of him, he had already chosen to enter the grade crossing during an unsafe time (i.e., when traffic was backed up into the grade crossing). However, if a vehicle was stopped in Zone 1 because of traffic congestion, the driver may not

19
have had an opportunity to decide to act safely or unsafely. Thus, we cannot determine how the driver would have acted without traffic forcing him or her to stop appropriately.
Figure 14. Zone Assignments The four zones over the crossing represent different levels of danger if the motorist comes to a full stop in that zone:
• Zone 1 (not dangerous): A motorist who stops in Zone 1 has stopped before the stop line where the gate descends during an activation. Motorists stopping in this zone are behaving safely.
• Zone 2 (moderately dangerous): A motorist who stops in Zone 2 has stopped after the stop line, but before the dynamic envelope. Motorists stopping in Zone 2 would be stuck inside of a descended gate but not struck by a train.
• Zone 3 – Dynamic Envelope Zone (very dangerous): A motorist who stops in Zone 3 has stopped in the most dangerous part of the crossing—the dynamic envelope zone. In this zone, a train and vehicle would collide.
• Zone 4 (moderately dangerous): A motorist who stops in Zone 4 has stopped past but adjacent to the dynamic envelope zone. Motorists stopping in Zone 4 would not be struck by a train.
20
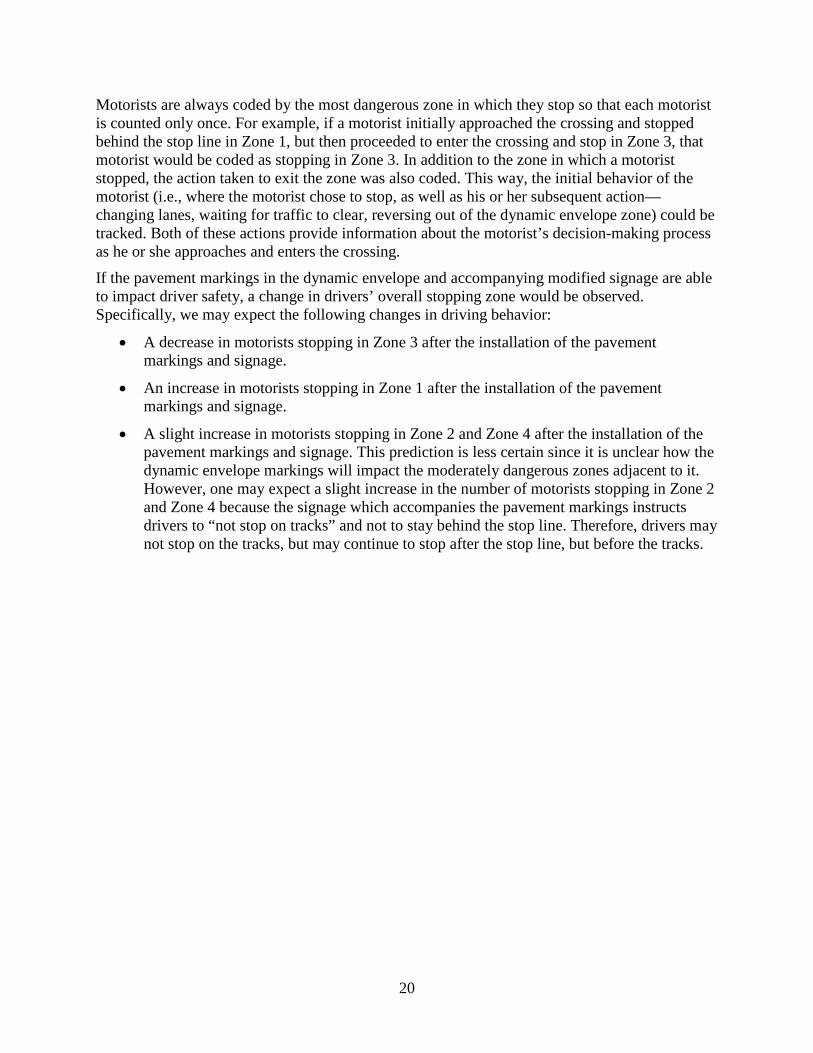
Motorists are always coded by the most dangerous zone in which they stop so that each motorist is counted only once. For example, if a motorist initially approached the crossing and stopped behind the stop line in Zone 1, but then proceeded to enter the crossing and stop in Zone 3, that motorist would be coded as stopping in Zone 3. In addition to the zone in which a motorist stopped, the action taken to exit the zone was also coded. This way, the initial behavior of the motorist (i.e., where the motorist chose to stop, as well as his or her subsequent action—changing lanes, waiting for traffic to clear, reversing out of the dynamic envelope zone) could be tracked. Both of these actions provide information about the motorist’s decision-making process as he or she approaches and enters the crossing.
If the pavement markings in the dynamic envelope and accompanying modified signage are able to impact driver safety, a change in drivers’ overall stopping zone would be observed. Specifically, we may expect the following changes in driving behavior:
• A decrease in motorists stopping in Zone 3 after the installation of the pavement markings and signage.
• An increase in motorists stopping in Zone 1 after the installation of the pavement markings and signage.
• A slight increase in motorists stopping in Zone 2 and Zone 4 after the installation of the pavement markings and signage. This prediction is less certain since it is unclear how the dynamic envelope markings will impact the moderately dangerous zones adjacent to it. However, one may expect a slight increase in the number of motorists stopping in Zone 2 and Zone 4 because the signage which accompanies the pavement markings instructs drivers to “not stop on tracks” and not to stay behind the stop line. Therefore, drivers may not stop on the tracks, but may continue to stop after the stop line, but before the tracks.

21
5. Results
From the 224 hours of data collection, a total of 12,989 vehicles were coded. Prior to the installation of the dynamic envelope pavement markings, 6,230 vehicles were coded; after the installation of the pavement markings, 6,759 vehicles were coded.
5.1 Traffic Patterns Traffic patterns by lane before and after the installation of the dynamic envelope pavement markings were similar. The traffic patterns by lane can be seen in Table 1 (Note: percentages are relative to one direction of traffic and not both).
Table 1. Traffic Pattern by Lane: Before vs. After Installation
Lane Pre-Installation Post-Installation
Wes
tbou
nd
1 1,118 (35.1%) 1,348 (39.1%)
2 548 (17.2%) 583 (16.9%)
3 767 (24.1%) 781 (22.6%)
4 754 (23.7%) 739 (21.4%)
1 – 4 Total 3,187 (100%) 3,440 (100%)
Eas
tbou
nd
5 900 (29.6%) 803 (24.3%)
6 754 (24.8%) 840 (25.4%)
7 767 (25.2%) 958 (29.0%)
8 324 (10.6%) 435 (13.2%)
9 298 (9.8%) 272 (8.2%)
5 – 9 Total 3,043(100%) 3,319 (100%)
Bot
h OverallTOTAL 6,230 6,759
Patterns for westbound traffic were similar, with the largest amount of traffic passing through the crossing in Lane 1 (the off-ramp from I95) and the least traffic passing through the crossing in Lane 2. However, a chi-square analysis reveals that the patters of traffic did differ before and after installation (χ2 = 29.92, df = 3, p<0.01). This difference owes primarily to the increase in Lane 1 traffic (and small decreases in each of the other lanes). Eastbound traffic showed slightly different patterns before and after the installation of the pavement markings and signage. A chi-square test revealed a significant change in the lanes used to travel through the crossing (χ2 =

22
78.48, df = 3, p<0.01). This change was primarily driven by a large decrease in Lane 5 traffic and increases in traffic in Lane 7 and Lane 8.
Despite significant changes in traffic pattern by lane, the overall amount of traffic was relatively similar. Lane-specific effects are not being studied as a part of this initial effort, but will be included in future, more in-depth analyses. For the purposes of this study, it is assumed that motorists will see the newly installed pavement markings from any of the nine lanes and react similarly regardless of the lane in which they choose to drive.
5.2 Motorist Stopping Behavior The main indicator for this study was where motorists came to a stop as they approached the tracks. Table 2 reports this stopping behavior, along with the number and percentage of vehicles that stopped in each of the four zones. Stopping behavior is shown separately for eastbound and westbound traffic.
Table 2. Motorist Stopping Behavior by Zone
Eastbound Traffic Westbound Traffic
Zone Stopped Pre-Install Post-Install Pre-Install Post-Install
Zone 1 1,890 (62.1%) 2,244 (67.6%) 1,926 (60.4%) 2,209 (64.2%)
Zone 2 832 (27.3%) 875 (26.4%) 749 (23.5%) 784 (22.8%)
Zone 3 216 (7.1%) 130 (3.9%) 400 (12.6%) 369 (10.7%)
Zone 4 105 (3.5%) 70 (2.1%) 112 (3.5%) 78 (2.3%)
Total 3,043 3,319 3,187 3,440
For eastbound traffic, the installation of the pavement markings elicited a significant change in behavior. A chi-square test of independence showed a significant difference between the pre- and post-installation conditions (χ2=82.22, df = 3, p <0.01). This change in driver behavior is evidenced by a 45 percent reduction in motorists stopping in Zone 3, a 39 percent reduction in motorists stopping in Zone 4, and a 9 percent increase in motorists stopping appropriately in Zone 1. These changes in proportion can be seen graphically in Figure 15.

23
Figure 15. Proportion of Eastbound Vehicles Stopping by Zone (Pre-Install n = 3,043 and Post-Install n = 3,319)
Examples of eastbound vehicles stopped in each of the zones are provided in Figure 16 and Figure 17. In Figure 16, two vehicles (circled in yellow) have come to a stop after the stop line but before the crossing in Zone 2, and one vehicle (circled in red) has come to a stop with its rear bumper still in Zone 3. All other vehicles are moving through the crossing.
Figure 16. Eastbound Zone 2 (yellow circles) and Zone 3 (red circle) Stopping Behaviors

24
In Figure 17, the two vehicles circled in red are both at least partially in Zone 3, while the vehicle circled in yellow has come to a stop in Zone 2.
Figure 17. Eastbound Zone 2 (yellow circle) and Zone 3 (red circles) Stopping Behaviors

25
Similar patterns were found for westbound traffic. Significant changes in driver stopping behavior were found from before to after the installation of the pavement markings and signage (χ2=31.72, df = 3, p <0.01). The decrease in vehicles stopping in Zone 3 was 14 percent—less substantial than for eastbound traffic. Further, the coders noted a 6 percent increase in Zone 1 stopping and a 36 percent decrease in Zone 4 stopping. These changes in proportion can be seen graphically in Figure 18.
Figure 18. Proportion of Westbound Vehicles Stopped by Zone (Pre-Install n = 3,187 and Post-Install n = 3,440)

26
Examples of vehicles stopping in each of the zones are provided in Figure 19 and Figure 20. In Figure 19, the two vehicles circled in green have come to a full stop in Zone 1, behind the stop line. The vehicle circled in yellow has fully exited the crossing; however, it is very close to the tracks and is considered to be in Zone 4. The two vehicles seen on the tracks were moving and never came to a stop in the crossing; thus, they were not coded.
Figure 19. Westbound Zone 1 (green circles) and Zone 4 (yellow circle) Stopping Behaviors

27
In Figure 20, vehicles stopping in all four zones can be seen. The vehicles circled in green have come to a full stop in Zone 1, behind the stop line. The vehicle circled in red has come to a full stop in Zone 3, on the tracks. The two vehicles circled in yellow stopped in Zone 2 (the uppermost yellow circle) and in Zone 4 (the lower and rightmost yellow circle).
Figure 20. Westbound Zone 1 (green circles), Zone 2 (yellow circle), Zone 3 (red circle), and Zone 4 (rightmost yellow circle) Stopping Behaviors

28
A vehicle which stops in a zone has four possible choices for action: changing lanes, reversing, performing a U-turn, or taking no action and waiting for traffic in front to clear. For this analysis, only vehicles that stopped in Zone 2, Zone 3, or Zone 4 are considered. We chose to exclude Zone 1 from this analysis because a driver choosing to take no action in Zone 1 is acting safely (that driver has yet to enter the crossing, so waiting is appropriate), whereas choosing to take no action in Zones 2, 3, or 4 is potentially dangerous. Findings showed that the majority of drivers for both eastbound and westbound traffic chose to take no action after stopping in Zone 2, Zone 3, or Zone 4. See Table 3 for details about vehicle actions in Zones 2, 3, and 4.
Table 3. Vehicle Action in Zone 2, Zone 3, and Zone 4
Eastbound Traffic Westbound Traffic
Motorist Action Pre-Install Post-Install Pre-Install Post-Install
Change Lane 34 (2.9%) 27 (2.5%) 78 (6.2%) 79 (6.4%)
Reverse 9 (0.8%) 6 (0.5%) 5 (0.4%) 7 (0.6%)
U-Turn 25 (2.2%) 30 (2.8%) 7 (0.6%) 7 (0.6%)
No Action 1,085 (94.1%) 1,011 (94.1%) 1,171 (92.9%) 1,138 (92.4%)
Total 1,153 1,074 1,261 1,231
Neither eastbound nor westbound traffic showed a significant change in vehicle action following the installation of the pavement markings and signage (Eastbound: χ2=3.30, df = 3, p >0.05 and Westbound: χ2=1.05, df = 3, p >0.05). This indicates that though drivers may have changed their decisionmaking process prior to entering the crossing, once they found themselves in the crossing and at a stop, there was little change in their behaviors. Examples of these behaviors can be seen in Figure 21 (U-turn) and Figure 22 (lane change).

29
Figure 21. Example of a Vehicle Performing a U-Turn
Figure 22. Example of a Vehicle Changing Lanes to Exit Tracks

30
5.3 Violations Although the dynamic envelope pavement markings are intended to deter drivers from stopping in the dynamic envelope, they may also affect a driver’s willingness to violate a crossing during an activation event. To assess this possibility, researchers analyzed vehicles that violated the crossing during a train activation. Two types of violations were considered, each with varying levels of potential danger:
• Descending Violation (moderately dangerous): A descending violation is one in which a motorist passes underneath the gates after they have initiated their descent but are not yet horizontal.
• Horizontal Violation (most dangerous): A horizontal violation is one in which a motorist drives around or through the fully descended gate.
All violations that were observed during the study timeframe are reported in Table 4. Note that there are no horizontal violations in this table. At this crossing, when the gates are horizontal they cover the entire roadway. When combined with the median between the east and westbound traffic, a driver would be required to break the gate in order to violate while the gate arm was horizontal.
Table 4. Motorist Violations
Descending Violations
Lane Pre-Install
(291 Activations) Post-Install
(287 Activations)
Wes
tbou
nd 1 104 49
2 88 26
3 66 23
4 71 19
Eas
tbou
nd
5 34 23
6 47 34
7 42 29
8 35 17
9 99 60
TOTAL 586 280
The number of descending violations decreased by more than 50 percent following the installation of the pavement markings and modified signage (note: after installation there were four fewer train activations). This indicates that the pavement markings and signage may have been effective at reducing drivers’ likelihood to enter the crossing after the gates had initiated descent.

31
Although potentially dangerous (i.e., during a second train event), ascending violations, which occur when motorists pass underneath the gate as it ascends following an activation, were not tracked in this analysis because of the large number of vehicles committing this violation. Almost all vehicles positioned to cross the stop line did so as soon as they were able to fully pass under the ascending gate. Anecdotally, it seemed as if the presence of the dynamic envelope markings and signage had no impact on ascending violations.
No train-vehicle collisions occurred during this study, although on nine occasions a vehicle was stuck between the fully descended gates and the tracks during an activation event. Four of these incidents occurred prior to the installation of the pavement markings and signage, whereas five incidents occurred after. Additional details about the vehicles location can be found in Table 5 (pre-installation) and Table 6 (post-installation).
Table 5. Pre-Installation Vehicles Stopped Beyond Gates during an Activation
Pre-Installation of Pavement Markings and Signage
Vehicle # Date Traffic Direction Lane
Adjacent Lane
Open?
Train Direction
1 5/29/2012 Eastbound 5 Yes Northbound
2 6/5/2012 Eastbound 6 Yes Southbound
3 6/5/2012 Eastbound 5 Yes Northbound
411 6/5/2012 Eastbound 6 Yes Northbound
Table 6. Post-Installation Vehicles Stopped Beyond Gates during an Activation
Post-Installation of Pavement Markings and Signage
Vehicle # Date Traffic Direction Lane
Adjacent Lane
Open?
Train Direction
5 1/8/2013 Westbound 4 Yes Southbound
6 1/8/2013 Westbound 4 Yes Northbound
712 1/8/2013 Westbound 3 Yes Northbound
8 1/10/2013 Eastbound 5 Yes Southbound
9 1/18/2013 Eastbound 5 Yes Northbound
11 Vehicle 4 was trapped beyond the gates during the same activation as Vehicle 3. They were in adjacent lanes, as seen in Figure 23. 12 Vehicle 7 was trapped beyond the gates during the same activation as Vehicle 6. They were in adjacent lanes, as seen in Figure 24.

32
These findings are somewhat surprising. The jump from zero westbound incidents in the pre-installation timeframe to three incidents for westbound traffic in the post-installation timeframe is especially surprising. Also unexpected is the fact that at least one adjacent lane was open in each of these incidents, indicating that vehicles could have acted to exit the crossing but chose to remain trapped. An example of a vehicle trapped inside the gates is provided in Figure 23 (eastbound) and Figure 24 (westbound). Appendix A provides additional examples of this type of incident.
Figure 23. Eastbound Vehicles Trapped Inside Gates during an Activation
Figure 24. Westbound Vehicles Trapped Inside Gates during an Activation

33
5.4 Summary of Findings Overall, the addition of the dynamic envelope pavement markings and signage had a positive effect on driver stopping behaviors at grade crossings. To specifically address the study’s predictions:
• A decrease will be seen in motorists stopping in Zone 3 after the installation of the pavement markings and signage.
Findings: We observed a 45 percent reduction in the number of motorists stopped in Zone 3 eastbound and a 15 percent reduction for westbound vehicles after installation.
• An increase in motorists stopping in Zone 1 after the installation of the pavement markings and signage.
Findings: We observed a 9 percent increase in the number of motorists stopped in Zone 1 eastbound and a 6 percent increase for westbound vehicles after installation
• A slight increase in motorists stopping in Zone 2 and Zone 4 after the installation of the pavement markings and signage.
Findings: We observed a slight decrease in motorists stopped in Zone 2 both eastbound and westbound, but a 39 percent decrease in the number of motorists stopping in Zone 4 eastbound and a 36 percent decrease for westbound vehicles after installation.
• A reduction in the number of violations post installation (both horizontal and descending).
Findings: Descending violations were reduced by more than 50 percent after the installation of the pavement markings and modified signage. No horizontal violations took place before or after installation. Nine incidents occurred where a vehicle was stuck inside the gates during an activation; four motorists heading eastbound were stuck between the fully descended gate and the tracks before installation; and five motorists (two eastbound and three westbound) were stuck after installation.
Additional findings: There was no significant change found in the specific actions taken by motorists in Zones 2 to 4 before and after installation, indicating that once they found themselves stopped in the crossing, they initiated the same type of actions (e.g., waiting for traffic to clear, a U-turn, or lane change).
The lanes that motorists used were significantly different before and after installation, with eastbound traffic showing a significant decrease in Lane 5 usage and an increase in both Lane 7 and Lane 8, and westbound traffic increasing in Lane 1 (off ramp from I95) after installation.
It is also important to note that the traffic patterns changed from before and after installation, which affected the amount of data collected with 6,230 vehicles before installation and 6,759 after installation. Based on our findings thus far, there is no evidence to suggest that this difference would skew our findings.

34
6. Conclusion and Discussion
Pavement markings in the dynamic envelope and the accompanying signage were effective at changing driver behavior around the Commercial Boulevard grade crossing. Fewer drivers entered the crossing and came to a stop on the tracks after the dynamic envelope had been painted and signage was installed (percent decreases of 45 percent for eastbound traffic and 14 percent for westbound traffic). This reduction in unsafe stopping behavior was coupled by an increase in safe driving behavior where the driver came to a full stop before the stop line before the crossing (percent increases of 9 percent for eastbound traffic and 6 percent for westbound traffic).
Drivers were also less likely to stop in the moderately unsafe regions immediately before or after the dynamic envelope. This may indicate that the pavement markings and modified signage were effective at making drivers aware of the crossing as a whole and not just the dynamic envelope. One might have anticipated that the increased visibility of the signage, which stated “Do Not Stop on Tracks,” and the painting of the dynamic envelope may have resulted in an increase of drivers choosing to stop in the region beyond the stop line, but before the newly painted dynamic envelope. However, it seems that the markings and signage instead resulted in an increase in the safest behavior, stopping before the stop line, while all other stopping behaviors decreased.
Despite the positive effects on driver stopping behavior, the pavement markings and signage seemed to have little effect once the motorist had already stopped. Once a driver chose to stop in Zone 2, Zone 3, or Zone 4, the driver typically chose not to actively attempt to remove the vehicle from this zone. Instead drivers tended to wait until traffic cleared to proceed through the crossing. The addition of the pavement marking and modified signage had no effect on this behavior.
Lastly, the pavement markings and signage did not result in a reduction in the number of vehicles getting stuck on the inside of the gates during an activation. In fact, during the timeframe prior to the installation of the improvements, no such event was recorded for westbound traffic; however, after installation there were three such events.
The results of this study provide initial evidence that dynamic envelope pavement markings with signage can cause an increase in safe stopping behaviors. However, to better understand the impact these makings and signage may have at another grade crossing, further exploration is required.
6.1 Next Steps Though this study provided a great deal of information about the impact of dynamic envelope pavement markings and signage, additional exploration may reveal more information. There are several aspects of the current data collection that require added attention; for example, how the data collected at this site will compare with data collected from other sites.
The following are potential next steps for this study:
• A detailed analysis of the effects of time-of-day on stopping behavior. The current report does not include a detailed account of the effect of traffic density or daylight on stopping behavior. Both of these variables may play a role in influencing driver behavior.

35
• A lane-by-lane analysis to see if the inner lanes were affected by the pavement markings and signage differently than the outer lanes. For example, the signage may have been more visible to the outer lanes, resulting in an increase in safe driving behavior. Alternatively, the outer lanes may also have had more vehicles planning to turn and thus drivers may have been focused on the road up ahead and missed the markings or signage.
• A more complete understanding of the effects of time of year on driver behavior. Though not a part of this effort, it is possible that seasonal variations may arise. This may be due to lighting, type of driver (more local versus visiting drivers), or weather. This information may help to better determine the locations best suited for a potential follow-up installation.
• A comparison with another highway-rail grade crossing to better understand how much the geometry of the Commercial Boulevard grade crossing impacted results. For example, among other attributes, the Commercial Boulevard grade crossing has tracks which are not perpendicular to the roadway, a highway off-ramp leading directly into the crossing, and a highway on-ramp immediately after the crossing. Each of these characteristics may affect the way vehicles react to the markings and signage. Testing similar implementations at other grade crossings may help to better understand if a certain crossing geometry (e.g., parallel tracks) is better suited to this type of implementation.

36
7. Potential Limitations
This study was carefully designed to evaluate the effects of the Commercial Boulevard implementation of dynamic envelope pavement markings and modified signage; therefore, there are particular aspects of the crossing which may make the results difficult to translate to some other grade crossing situations. First, though the amount of time over which videos were recorded was consistent between pre- and post-installation conditions, the overall number of vehicles that stopped varied (529 more vehicles stopped in the post-installation condition). The numbers reported in this document represent the proportion of vehicles stopping in each zone; however, it is possible that the increased traffic in the post-installation condition may have elicited different driver behaviors.
The specifics of the site tested in this study also pose some potential limitations. As described earlier in this document, the grade crossing chosen for this study was unique in many ways. It was directly adjacent to both the on-ramp and off-ramp of a major freeway. Motorists entering or exiting the freeway may have had a different mindset as they entered the crossing compared with motorists who approached the crossing straight on and continued straight past the crossing.
Another limiting factor may have been the placement of the accompanying signage. This signage was the only information drivers received regarding the action expected of them when they saw the dynamic envelope markings. However, this signage was placed on the opposite side of the tracks from the approaching traffic, so drivers may have been unable to clearly see and understand the modifications on the signage prior to arriving at the crossing, and at that point, it may have been too late to alter their decision to enter the dynamic envelope. Additionally, because of the geometry of the track-road intersection at that location, motorists traveling westbound arrived at the tracks sooner after the stop line (and further from the signage) than motorists traveling eastbound. This non-perpendicular geometry may partially explain why the impact of the dynamic envelope pavement markings and signage was different for eastbound and westbound traffic. It is worth noting that similar signage (i.e., the same sign without the added yellow markings at the top and bottom) was in place prior to the installation of the pavement markings. However, the modification of the signage directly linked the sign to the dynamic envelope with the yellow crosshatch pattern and provided drivers with the only direct instructions for how to act around the new pavement markings.
Lastly, the pre- and post-installation data collections were completed during different times of the year. The pre-installation collection was completed in late May and early June, whereas the post-installation collection was completed in January. Although at this particular location there is no concern about inclement winter weather, there may be different types of drivers during the different times of year. For example, drivers in the winter may be more likely to be local drivers (rather than visitors) compared with drivers in the spring and/or summer. These different driving populations may result in different baseline behaviors for the two groups regardless of any markings or signage.

37
8. References
Basile, A.J. Effect of Pavement Edge Markings on Traffic Accidents in Kansas. In Highway Research Board Bulletin 308, Highway Research Board, National Research Council, Washington, DC, 1962, pp. 80-86.
Courage, K. & Kirkpatrick, B. (2003). Video Based Studies of Flexible Traffic Separators at Highway-Railroad Grade Crossings. Florida Department of Transportation.
Koepsell, T., McCloskey, L., Wolf, M., Moudon, A. V., Buchner, D., Kraus, J., & Patterson, M. (2002). Crosswalk markings and the risk of pedestrian–motor vehicle collisions in older pedestrians. JAMA: the journal of the American Medical Association, 288(17), 2136-2143.
Lenne, M. G., Rudin-Brown, C. M., Navarro, J., Edquist, J., Trotter, M., & Tomasevic, N. (2011). Driver behaviour at rail level crossings: Responses to flashing lights, traffic signals and stop signs in simulated rural driving. Applied ergonomics, 42(4), 548-554.
Long, G. (2003). Easy-to-apply solution to a persistent safety problem: clearance time for railroad-preempted traffic signals. Transportation Research Record: Journal of the Transportation Research Board, 1856(1), 239-247.
Manual on Uniform Traffic Control Devices for Streets and Highways, U.S. Department of Transportation, Federal Highway Administration, Washington D.C., 1988.
Musick, J. V. Effect of Pavement Edge Marking on Two-Lane Rural State Highways in Ohio. Highway Research Board Bulletin 266, 1962, pp. 1-7.
Preemption of Traffic Signals at or near Railroad Grade Crossings with Active Warning Devices: A Recommended Practice. Traffic Engineering Council Committee TENC- 4M-35, Institute of Transportation Engineers, Washington, DC, February 1997.
Stephens, B. W., & Long, G. (2003). Supplemental pavement markings for improving safety at railroad-highway grade crossings. Transportation Research Record: Journal of the Transportation Research Board, 1844(1), 18-24.
The 1981 Highway Safety Stewardship Report. Report of the Secretary of Transportation to the United States Congress, Office of Highway Safety, Federal Highway Administration, U.S. Department of Transportation, Washington, DC, April 1981.
Traffic Engineering Council Committee 4M-35, Recommended Practice, Preemption of Traffic Signals At or Near Railroad Grade Crossings with Active Warning Devices, Institute of Transportation Engineers, Washington DC, 1997.
Ward, N. J., & Wilde, G. J. (1995). Field observation of advance warning/advisory signage for passive railway crossings with restricted lateral sightline visibility: An experimental investigation. Accident Analysis & Prevention, 27(2), 185-197.
Zegeer, C. V., Stewart, J. R., Huang, H., & Lagerwey, P. (2001). Safety effects of marked versus unmarked crosswalks at uncontrolled locations: analysis of pedestrian crashes in 30 cities. Transportation Research Record: Journal of the Transportation Research Board, 1773(1), 56-68.

38
Appendix A. Additional Examples
Below are additional examples of vehicles that stopped on or near the tracks during the study timeframe. Vehicles circled in green were coded as having stopped in Zone 1. Vehicles circled in red were coded as having stopped in Zone 3. Vehicles circled in yellow were coded as being in Zone 2 if they were yet to cross the tracks and Zone 4 if they were already past the tracks. Not all vehicles were circled (only those that stopped in one of the four zones and were coded as such).
• Westbound
Figure A- 1. Westbound Vehicles Stopped in Zone 1 and Zone 4

39
Figure A- 2. Westbound Truck Stopped in Zone 3
Figure A- 3. Many Westbound Vehicles Stopped on or Near the Tracks

40
• Eastbound
Figure A- 4. Eastbound Vehicles Stopped in Zone 2 and Zone 4
Figure A- 5. Eastbound Vehicles Stopped in Zone 2 and Zone 3

41
Abbreviations and Acronyms
FDOT
FHWA
Florida Department of Transportation
Federal Highway Administration
FRA Federal Railroad Administration
ITE Institute of Transportation Engineers
mph miles per hour
MUTCD Manual on Uniform Traffic Control Devices
ROW Right-Of-Way
U.S. DOT U.S. Department of Transportation
Volpe Center John A. Volpe National Transportation Systems