u.s. department of education 2011 - blue ribbon … u.s. department of education 2011 - blue ribbon...
TRANSCRIPT

1
U.S. Department of Education 2011 - Blue Ribbon Schools Program
A Private School
School Type (Public Schools): (Check all that apply, if any)
Charter
Title 1
Magnet
Choice
Name of Principal: Mrs. Mary Hemmelman
Official School Name: St. Emily School
School Mailing Address: 1400 E. Central Rd.
Mount Prospect, IL 60056-2650
County: Cook State School Code Number: 05-016-503X-10-0000
Telephone: (847) 296-3490 E-mail: [email protected]
Fax: (847) 296-1155 Web URL: www.stemily.org
I have reviewed the information in this application, including the eligibility requirements on page 2 (Part I - Eligibility Certification), and certify that to the best of my knowledge all information is accurate.
_________________________________________________________ Date _____________________ (Principal’s Signature)
Name of Superintendent*: Sister M. Paul McCaughey, O.P Superintendent e-mail: [email protected]
District Name: Archdiocese of Chicago District Phone: (312) 534-5200
I have reviewed the information in this application, including the eligibility requirements on page 2 (Part I - Eligibility Certification), and certify that to the best of my knowledge it is accurate.
_________________________________________________________ Date _____________________ (Superintendent’s Signature)
Name of School Board President/Chairperson: Mrs. Maria LaTorraca
I have reviewed the information in this application, including the eligibility requirements on page 2 (Part I - Eligibility Certification), and certify that to the best of my knowledge it is accurate.
_________________________________________________________ Date _____________________ (School Board President’s/Chairperson’s Signature)
*Private Schools: If the information requested is not applicable, write N/A in the space. The original signed cover sheet only should be converted to a PDF file and emailed to Aba Kumi, Blue Ribbon Schools Project Manager ([email protected]) or mailed by expedited mail or a courier mail service (such as Express Mail, FedEx or UPS) to Aba Kumi, Director, Blue Ribbon Schools Program, Office of Communications and Outreach, U.S. Department of Education, 400 Maryland Ave., SW, Room 5E103, Washington, DC 20202-8173.
11PV76

2
PART I - ELIGIBILITY CERTIFICATION 11PV76
The signatures on the first page of this application certify that each of the statements below concerning the school’s eligibility and compliance with U.S. Department of Education, Office for Civil Rights (OCR) requirements is true and correct.
1. The school has some configuration that includes one or more of grades K-12. (Schools on the same campus with one principal, even K-12 schools, must apply as an entire school.)
2. The school has made adequate yearly progress each year for the past two years and has not been identified by the state as "persistently dangerous" within the last two years.
3. To meet final eligibility, the school must meet the state's Adequate Yearly Progress (AYP) requirement in the 2010-2011 school year. AYP must be certified by the state and all appeals resolved at least two weeks before the awards ceremony for the school to receive the award.
4. If the school includes grades 7 or higher, the school must have foreign language as a part of its curriculum and a significant number of students in grades 7 and higher must take the course.
5. The school has been in existence for five full years, that is, from at least September 2005.
6. The nominated school has not received the Blue Ribbon Schools award in the past five years: 2006, 2007, 2008, 2009 or 2010.
7. The nominated school or district is not refusing OCR access to information necessary to investigate a civil rights complaint or to conduct a district-wide compliance review.
8. OCR has not issued a violation letter of findings to the school district concluding that the nominated school or the district as a whole has violated one or more of the civil rights statutes. A violation letter of findings will not be considered outstanding if OCR has accepted a corrective action plan from the district to remedy the violation.
9. The U.S. Department of Justice does not have a pending suit alleging that the nominated school or the school district as a whole has violated one or more of the civil rights statutes or the Constitution’s equal protection clause.
10. There are no findings of violations of the Individuals with Disabilities Education Act in a U.S. Department of Education monitoring report that apply to the school or school district in question; or if there are such findings, the state or district has corrected, or agreed to correct, the findings.

3
PART II - DEMOGRAPHIC DATA 11PV76
All data are the most recent year available.
DISTRICT
Questions 1 and 2 are for Public Schools only.
SCHOOL (To be completed by all schools)
3. Category that best describes the area where the school is located: Suburban
4. Number of years the principal has been in her/his position at this school: 7
5. Number of students as of October 1, 2010 enrolled at each grade level or its equivalent in applying school:
Grade # of Males # of Females Grade Total # of Males # of Females Grade Total
PreK 27 38 65 6 14 17 31
K 12 16 28 7 17 18 35
1 11 19 30 8 13 19 32
2 9 9 18 9 0 0 0
3 16 16 32 10 0 0 0
4 8 16 24 11 0 0 0
5 7 14 21 12 0 0 0
Total in Applying School: 316

4
11PV76
6. Racial/ethnic composition of the school: 0 % American Indian or Alaska Native
18 % Asian
1 % Black or African American 5 % Hispanic or Latino 1 % Native Hawaiian or Other Pacific Islander 72 % White 3 % Two or more races 100 % Total
Only the seven standard categories should be used in reporting the racial/ethnic composition of your school. The final Guidance on Maintaining, Collecting, and Reporting Racial and Ethnic data to the U.S. Department of Education published in the October 19, 2007 Federal Register provides definitions for each of the seven categories.
7. Student turnover, or mobility rate, during the 2009-2010 school year: 0%
This rate is calculated using the grid below. The answer to (6) is the mobility rate.
(1) Number of students who transferred to the school after October 1, 2009 until the end of the school year.
2
(2) Number of students who transferred from the school after October 1, 2009 until the end of the school year.
0
(3) Total of all transferred students [sum of rows (1) and (2)].
2
(4) Total number of students in the school as of October 1, 2009
336
(5) Total transferred students in row (3) divided by total students in row (4).
0.00
(6) Amount in row (5) multiplied by 100. 0
8. Percent limited English proficient students in the school: 0%
Total number of limited English proficient students in the school: 0
Number of languages represented, not including English: 5
Specify languages:

5
11PV76
9. Percent of students eligible for free/reduced-priced meals: 0%
Total number of students who qualify: 0
If this method does not produce an accurate estimate of the percentage of students from low-income families, or the school does not participate in the free and reduced-priced school meals program, supply an accurate estimate and explain how the school calculated this estimate.
10. Percent of students receiving special education services: 2%
Total number of students served: 6
Indicate below the number of students with disabilities according to conditions designated in the Individuals with Disabilities Education Act. Do not add additional categories.
0 Autism 0 Orthopedic Impairment
0 Deafness 1 Other Health Impaired
0 Deaf-Blindness 1 Specific Learning Disability
0 Emotional Disturbance 4 Speech or Language Impairment
0 Hearing Impairment 0 Traumatic Brain Injury
0 Mental Retardation 0
Visual Impairment Including Blindness
0 Multiple Disabilities 0 Developmentally Delayed
11. Indicate number of full-time and part-time staff members in each of the categories below:
Number of Staff
Full-Time Part-Time
Administrator(s) 1
1
Classroom teachers 17
1
Special resource teachers/specialists 3
3
Paraprofessionals 1
1
Support staff 4
0
Total number 26
6
12. Average school student-classroom teacher ratio, that is, the number of students in the school divided by the Full Time Equivalent of classroom teachers, e.g., 22:1:
19:1

6
11PV76
13. Show the attendance patterns of teachers and students as a percentage. Only high schools need to supply graduation rates. Briefly explain in the Notes section any student or teacher attendance rates under 95% and teacher turnover rates over 12% and fluctuations in graduation rates.
2009-2010 2008-2009 2007-2008 2006-2007 2005-2006
Daily student attendance 98% 98% 98% 98% 98%
Daily teacher attendance 99% 99% 99% 99% 99%
Teacher turnover rate 8% 12% 12% 12% 8%
High school graduation rate % % % % %
If these data are not available, explain and provide reasonable estimates.
14. For schools ending in grade 12 (high schools): Show what the students who graduated in Spring 2010 are doing as of Fall 2010.
Graduating class size: Enrolled in a 4-year college or university % Enrolled in a community college % Enrolled in vocational training % Found employment % Military service % Other % Total 0%

7
PART III - SUMMARY 11PV76
A walk through the halls of St. Emily School provides a snapshot of the happy, academically successful, and faith-filled children learning and growing in an environment where teachers and parents work together to educate all children, in the interest of leaving no child behind. A peek into the classrooms shows students reading a play, catching a ball to recite math facts, working on a science experiment, discussing veterans in their own families, learning musical instruments, drawing self-portraits, doing a time-line on the computer, learning Spanish, analyzing an algebra problem, writing characterizations in literature, or doing a fitness routine to music. The stories of St. Emily School have been written for fifty years, and continue to be an example of excellence, offering opportunities for all desiring a faith-based education.
St. Emily School students experience a Catholic Christian community within the wonderful cultural diversity of the school and parish community in Mount Prospect, Illinois. St. Emily School students are active in social justice concerns such as Heifer International, I CEAR, support for victims of hurricane Katrina, food drives, support for local charities, and recycling. These activities support the school mission: St. Emily Catholic School accepts the Church’s challenge to create a religious, educational, and evangelizing community, enlightened by the gift of faith, which parents, as primary educators, have nurtured. St. Emily School strives to foster a sense of independence in each student so that he/she may be responsible, respectful, and make right choices. In pursuit of academic excellence, curriculum is implemented to foster and develop the talents of each student.
Students with special learning needs receive a variety of supports and accommodations with a Special Needs teacher in the school’s Resource Center, and additional tutoring through a volunteer program. Additionally, students receive services through the district when possible. On-going assessment of student performance monitors student progress at all levels.
St. Emily provides an extensive early childhood program for preschool three- and four-year olds, half-day and full-day options, where emphasis is placed on interaction with peers, developing specific reading readiness skills and demonstrating an understanding of basic math concepts. A standards-based curriculum provides for a full-day kindergarten program for five-year olds and primary students, with basic skills and learning center enrichment that ensures success for all students. Students are challenged to read independently and for enjoyment in Reading Resource, and are introduced to Spanish in the K-3 Learning Center. Spanish is incorporated in the junior high curricula as a whole-year program for all seventh and eighth grade students. French classes are offered for second and third grade students as an extracurricular program.
The teachers of St. Emily School facilitate learning in grades Pre-K through 8, encouraging each student to reach his or her potential, while being responsible, respectful, and making right choices. This dedicated and enthusiastic faculty is committed to professional growth, participating in curriculum development and staff development for Response to Intervention that will better serve the needs of all children. Teachers have improved their own technology literacy to include technology in their classrooms, including Project Based Learning, to enrich and differentiate instructional activities.
Beyond the regular classroom, students are offered opportunities to participate in National Junior Honor Society, Student Council, Drama Club, French Club, Math Club, scouting, Scholastic Bowl, intramural sports, band, and choir to help develop leadership, good sportsmanship, and self-confidence. Extended Care, before and after school, offers children a nurturing and social environment that supports family needs.
In this fiftieth anniversary year, St. Emily School's traditions of service to others and academic excellence continue in a faith-filled environment. The Sisters of the Holy Family of Nazareth opened the school in
8
1961, and have served as administrators and teachers for fifty years. Today, lay teachers and administrators continue to provide families, desiring a Catholic education for their children, the opportunity to do so. The Reverend John A. McLoraine, founding pastor, has left a legacy to Catholic education through a scholarship endowment that provides several eighth grade graduates, each year, with 4-year scholarships to Catholic high schools. The Village of Mount Prospect has recognized St. Emily School as a "religious, educational, and evangelizing community, enlightened by the gift of faith." Alumni return to share stories of successes and accomplishments as current students prepare for the future.
St. Emily School is worthy of Blue Ribbon School status as it successfully educates its students to assume their roles as citizens of the global community and the people of God.
9
PART IV - INDICATORS OF ACADEMIC SUCCESS 11PV76
1. Assessment Results:
Each school year in March, St. Emily School administers the TerraNova Multiple Assessments to all students in grades three, four, five, six and seven. (Eighth graders are not tested since their performance is assessed by the local high schools with a battery of placement tests.) Those students with learning disabilities or service plans who have a formal Individual Educational Plan requiring testing modifications (extended time, tests read aloud, or other modifications) are provided with those accommodations by the school. The TerraNova Reading Test measures objectives in “basic understanding, identifying and applying reading strategies, evaluating and extending meaning, and analyzing text.” The mathematics test includes objectives covering “numbers and numerical relations, computation and estimation, measurement, geometry and spatial sense, date—statistics and probability, patterns—functions and algebra, problem solving and reasoning, and communication.”
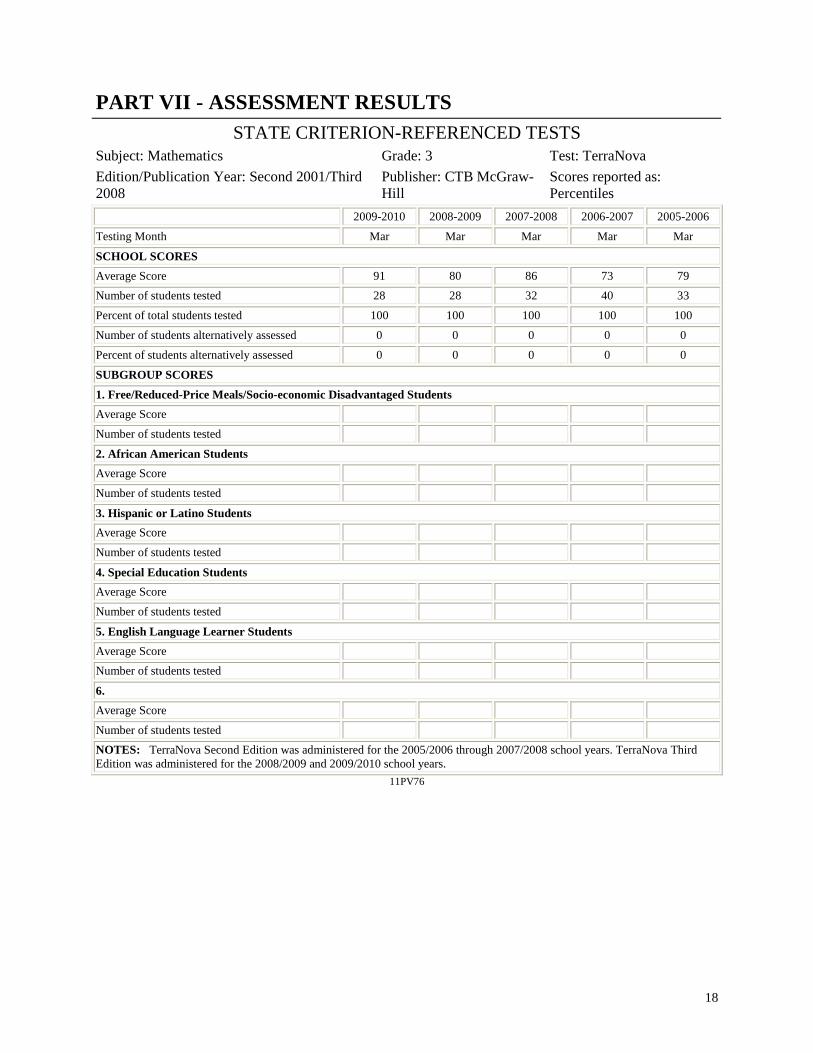
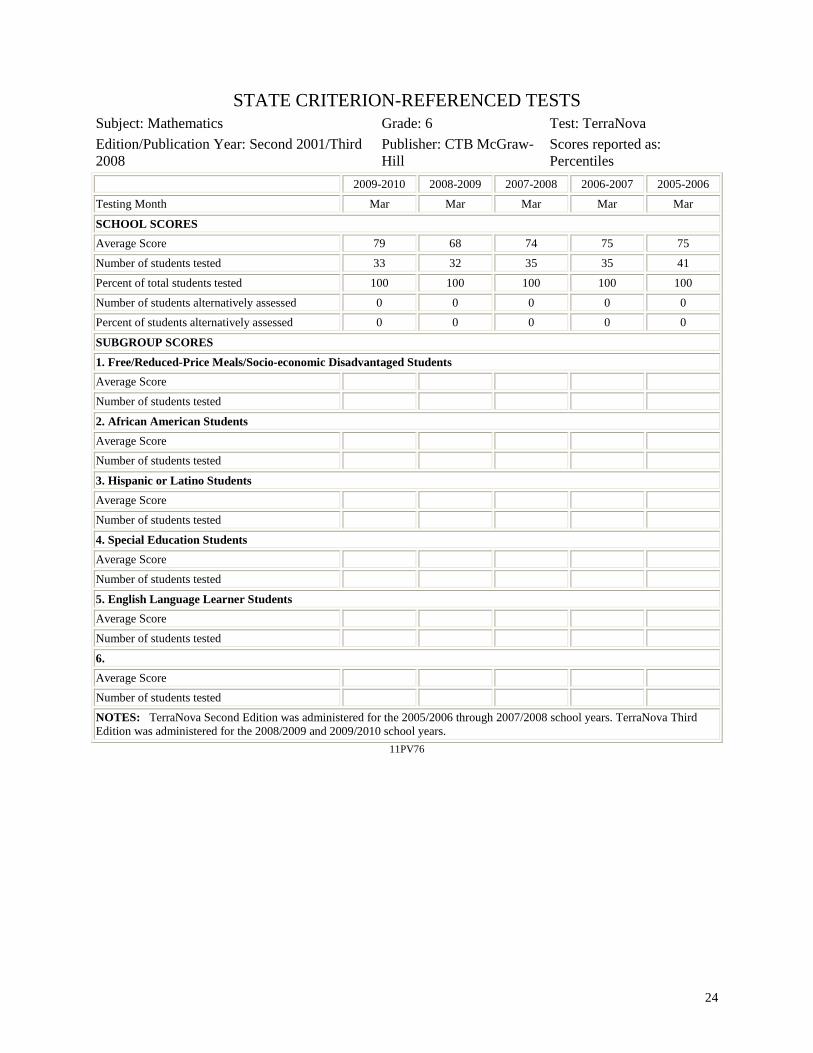
When looking at test data over a five-year period, St. Emily School students are above the national average in every subject area at every grade level. For current test scores in reading, the local percentile of students above 50% is 82% in 3rd grade, 76% in 4th grade, 93% in 5th grade, 88% in 6th grade and 90% in 7th grade. For mathematics, the local percentile of students above 50% is 93% in 3rd grade, 62% in 4th grade, 96% in 5th grade, 91% in 6th grade and 77% in 7th grade. Additionally, achieved scores were at or above the anticipated scores in every subject area at every grade level.
The performance trends show St. Emily School students consistently in the 60th, 70th, and 80th percentiles in all subject areas at all grade levels over the five-year period. There was a significant decrease in 3rd grade reading from an 85 NP of the Mean NCE in 2006 to 69 NP of the Mean NCE in 2007, but this quickly increased in 2008 with an NP of the Mean NCE of 83. Fifth grade reading showed a significant gain from 74 NP of the Mean NCE in 2009 to 87 NP of the Mean NCE in 2010. Seventh grade reading showed a significant gain from 69 NP of the Mean NCE in 2008 to 82 NP of the Mean NCE in 2009. Third grade math showed a significant gain from 73 NP of the Mean NCE in 2007 to 86 NP of the Mean NCE in 2008, with a second significant gain from 80 NP of the Mean NCE in 2009 to 91 NP of the Mean NCE in 2010. Sixth grade math went from 74 NP of the Mean NCE in 2008 to 68 NP of the Mean NCE in 2009, but showed a significant gain the following year, 2010, to 79 NP of the Mean NCE. A newly written curriculum, with concentration in one subject area per year, staff development in differentiation and RtI, and faculty assignments have contributed to significant gains and consistent achievement over the five year period.
The TerraNova Multiple Assessments Test changed from the Second Edition to the Third Edition in the 2008/2009 testing period. St. Emily School regularly updates its curricula so that it is aligned with the Archdiocese of Chicago curricula and Illinois Learning Standards, so the expectation was that there would be little or no change in scores. "The TerraNova Third Edition assesses higher depths of knowledge overall." TerraNova Third Edition Reading test items, for example, measure a deeper understanding than those of the TerraNova Second Edition. The most noticeable change in scores for St. Emily School was in 6th grade mathematics that went from 74 NP of the Mean NCE in 2008 to 68 NP of the Mean NCE in 2009, but increased to 79 NP of the Mean NCE in 2010. The greatest gain from the Second Edition to the Third Edition of the test was in 7th grade reading that went from 69 NP of the Mean NCE in 2008 to 82 NP of the Mean NCE in 2009.
All of St. Emily School grade levels tested achieved the NP of the Mean NCE in reading and mathematics at or above the Student Percentile Equivalent for the 85th School Percentile as listed on the Blue Ribbon Schools requirements. St. Emily School has significant reading scores above the Blue Ribbon Schools requirements for 3rd, 4th, 5th and 7th grades. Significant mathematics scores above Blue Ribbon Schools requirements are seen in 3rd, 5th, and 6th grades for the 2009-2010 testing period.
10
2. Using Assessment Results:
One of the major purposes of a school testing program is to provide teachers with information to help students learn. TerraNova test score information for broad content areas indicates general strengths and weaknesses of students’ performance as compared with a norm group. Other test information provides scores on instructional objectives that indicate the degree to which students have mastered specific content skills. Assessment data are used systematically in decision-making processes to improve teaching and learning. TerraNova test data is used by teachers to place students in classrooms, so there is a range of high and low in each room. Teachers also use test data to further place students in groups that support ability levels. In grades 5 through 8, there are three reading and math groups per grade level. In grades 3 and 4, students are placed in reading groups and the teacher works with the Reading Resource teacher, who offers higher level students enrichment classes, while the classroom teacher works with smaller groups needing more individualization. Additionally, teachers review performance on objectives so strengths and weaknesses can be identified and instruction time is used to the best advantage. At the beginning of each new school year, teachers create a data-driven instructional grid according to “high mastery,” “moderate mastery,” and “low mastery” for every student in every subject area. This is one tool used for the placement of students in instructional groupings to differentiate instruction based on common strengths and needs. The most significant gains came in the 2008-2009 school year in TerraNova reading results. It was an all-school goal to raise reading scores, and there was a significant improvement when the seventh grade NP of the Mean NCE score increased from 69 to 82 from 2007/2008 to 2008/2009. Teachers shared pre-reading activities at faculty meetings, during-reading activities were observed by the principal for teachers’ formal evaluations, and post-reading activities were implemented as a follow-up to better reading instruction in content areas. Each student's total verbal and total nonverbal scores are reviewed as a means of identifying ways the student learns best and guide the teacher in planning activities that differentiate. Data are also used to identify who the students scoring below the 50th percentile are so interventions can be put in place.
3. Communicating Assessment Results:
The TerraNova Home Report is sent to parents in late spring, with an explanation of Mean Normal Curve Equivalent and the yearly progress for third through seventh grade students in each subject area. Additional information includes obtained, anticipated and median scores for each grade level in every subject area, with a discussion of how anticipated scores are based on students’ In View results and the meaning of the median national percentile. The yearly school profile reports the National Percentile of the Average Student, along with the Local Percentile of Students Above 50%. Parents are invited to attend a verbal explanation of TerraNova test results at an open School Advisory Board meeting when results are disseminated to the members of the Board and all attendees. Performance on Objectives (OPI—an estimate of the number of items that a student could be expected to answer correctly if there had been 100 items for that objective) is also presented by grade level. The local average OPI scores are above the national average OPI scores in all grade levels for all objectives. TerraNova information showing the yearly progress of the past five years is included in the Welcome Packet given to prospective families. The same scores are discussed in a parent meeting at the Open House during Catholic Schools Week, providing an opportunity for the community and parents to see all the learning and achievements of St. Emily School students. Teachers receive test data as soon as it is returned to the school, usually in May. The data is reviewed and used to set all-school goals for the next school year. Mid-term progress reports and report cards including achievement and behavior are issued four times a year. Parent/Student/Teacher conferences are held at the end of the first quarter to discuss student progress and achievement. Teachers use test data in conferencing with students and parents to review areas of strengths and weaknesses. A weekly newsletter to parents, with updated information, continues the partnership between school and home.
4. Sharing Success:
St. Emily School’s greatest resources are its students, parents, and teachers. Junior high students share their time and resources with other local junior high students to provide gifts at Christmas time for those

11
in need in the local community. Students in Confirmation Sacramental Preparation are part of a program that includes students from other local schools that also do service projects to help others, and share their successes with these community organizations. Essay contest winners (DAR and Elks), Scholastic Bowl participation in local schools, and athletic programs give student opportunities to show and promote the excellence of St. Emily School. Parents promote the faith-based education of St. Emily School with their voices and financial support of Catholic education. Through their participation as School Advisory Board members and Family School Association members, they have visited Springfield lobbying the state legislature for more support for private education, and the local district for transportation reimbursement. As volunteers, parents bring much time and effort to sustain and support the school and local community. Innovative activities in 3rd grade include a classroom website and outside visitation opportunities to promote curriculum and instruction successes, and to inform the community of all the positive things going on at St. Emily School. Teachers plan and set up communication and sharing opportunities for students and residents of local nursing homes. The art teacher recently had students participate in the “Lamb Umbrellas for Peace” project that demonstrated to parents, parishioners and the community that St. Emily students are peacemakers. Teachers participate in sharing best practices at vicariate in-services, and work with the administration in promoting school spirit and school excellence. The weekly school information, including the Principal's Newsletter, recognizes students, alumni and their accomplishments, and promotes participation in school events to the parish and community. The "School News" page in the weekly parish bulletin highlights student work and achievements in each grade and school organizations such as Drama Club and athletics. The school’s website uses all its resources to share its successes and to promote the values of Catholic education at St. Emily School, and will continue to do so when St. Emily School is awarded Blue Ribbon School status.
12
PART V - CURRICULUM AND INSTRUCTION 11PV76
1. Curriculum:
Language Arts (reading/literature, English, writing, vocabulary/spelling/phonics): Curricula for reading, English, and vocabulary/spelling/phonics were developed as separate subjects to ensure complete and consistent instruction in these major subject areas. Reading instruction provides students with phonemic awareness, decoding, sequencing, comprehension, and inferencing skills in grades K-6. Literature in grades 7-8 is novel based with emphasis on characterization, setting, and elements of plot. Students learn to analyze written material through discussion, inquiry and role playing. Daily Oral Language activities are used each day to present and reinforce grammar rules and proofreading skills. Teachers incorporate prewriting, drafting, revising, proofreading, and publishing in all curriculum areas to demonstrate and improve communication skills.
Mathematics: Students learn math concepts and terminology, and demonstrate math skills according to their abilities. Students develop critical thinking skills to solve problems, reason, and apply these skills to daily life. Students learn to recognize patterns, analyze data, and develop geometric and spatial understanding. Primary and intermediate grades investigate mathematics through hands-on experiences, while upper grade students prepare for and complete a full year of first level algebra enabling many students to enter advanced algebra or geometry courses in their freshman year.
Science: The curriculum includes and builds on major concepts in the areas of biology, chemistry, physics, earth and space science. Students explore and demonstrate their understanding through hands-on experimentation, projects, and demonstrations that emphasize the scientific method. Current events and writing assignments, including lab reports, reinforce the concepts.
Social Studies: Students study how events, trends, individuals, and movements have shaped the history of the United States, other nations, and Illinois. Primary grades study community living and use map skills to locate, describe, and explain places and regions on Earth. Grade 6 focuses on ancient world cultures and history. United States history is the focus of grades 5, 7, and 8 with seventh grade students completing the Federal Constitution test and eighth grade students completing the Illinois State Constitution test.
Religion: St. Emily School collaborates with the Archdiocese of Chicago in teaching a unified, systematic and cohesive religion curriculum that conveys the truths of the Gospel and the Catholic faith. Activities center on worship—Eucharistic liturgy, sacramental preparation and prayer experiences that help students to grow in their relationship with God; message—instruction in the Gospel, Catholic faith and moral living; community—commitment to faith development and caring respect for each person; service—opportunities for service to others and action for justice based on education in the social teaching of the Church and mission to the world.
Computer skills and technology: All students in K-8 have access to a computer lab and classes in that lab at least once a week. Students develop keyboarding skills, use word processing, make Power Point presentations, learn Internet safety, and apply and integrate these skills across the curriculum. Individual classrooms have 2 to 4 computers for student use. Research, remediation and enrichment activities provide students with additional opportunities to improve technological skills.
Fine Arts: The Fine Arts curriculum includes music, art, movement, and drama. In music, students learn to understand and appreciate different genres of music through listening, singing, and performance. In art, visual concepts such as perspective, color, line, and texture are explored through the use of a variety of media. Band is offered to St. Emily students as an elective course in grades 4 to 8. Drama Club is an extracurricular activity available to students in grades 5 to 8, with opportunities for performance in a Christmas play and Spring production. Students in K-7 participate in a school Christmas program, and

13
students in K-8 have an opportunity to showcase their talents in a Talent Show. All programs are open to the parents and community.
Physical Education: Students participate in a variety of individual and team activities to develop physical skills, an understanding of good health and fitness habits, good sportsmanship, and an enjoyment of physical activity. All students participate in two forty-minute P.E. periods per week. They learn the benefits of leading a physically active lifestyle, and set personal goals for maintaining health and fitness. Students learn to understand and respect differences among people in physical activity settings. To encourage good nutrition and fitness, the physical education teacher promotes a “fruit or vegetable of the week,” and has encouraged the faculty and parish community to participate in developing and following through with a personal fitness program.
Spanish: St. Emily School is in compliance with the program's foreign language requirements. For grades 7 and 8, 100 percent of the students receive Spanish instruction during the regular school day, for a minimum of 120 minutes per week, for two years. Students are introduced to the cultures of Spanish speaking countries, along with the study of vocabulary, grammar, conversation, reading, and writing of the language. The seventh grade course is an introduction, with the eighth grade course a continuation and advancement of these skills. Student in grades K-3 are introduced to the Spanish language and culture as enrichment in the Learning Center. Students in grades 2 to 4 have the opportunity to take French classes as an extracurricular activity.
2. Reading/English:
St. Emily School has chosen the Harcourt Reading Series which is a research-based developmental reading curriculum, and implemented in Kindergarten through grade 6 in 2008. The foundation of the program is high-quality children’s literature, as well as informational texts, which use different genres. The program reflects current, confirmed research which prioritizes, and sequences essential skills and strategies into a clear, organized model for instruction. St. Emily uses a scaffolding approach for both teaching and assessing student progress. Teachers help students cope with the complexity of a task, process how to accomplish a task, and complete the given task. This is accomplished by using phonics, focusing on spelling patterns, and using high-frequency words within the various genres. Comprehension, robust vocabulary, grammar and writing are incorporated at every level. On a daily basis, teachers monitor and use progress notes to help check understanding, thus extending instruction if necessary. St. Emily will then do benchmark assessments three times a year to see where the students stand in relation to state standards. By using multiple assessments in a tiered approach, this process gives teachers the clearest picture of students’ progress, and will help teachers to know what to teach, and how much. These aspects of reading are consistent with the standards of No Child Left Behind (2001). TerraNova scores have risen thirteen percentage points from 69% to 82% (NP of the Mean NCE) in just one year since implementing this program; thus proving that our methods are successful. To build a reading culture throughout the school, St. Emily has adopted the Accelerated Reader Program, Star Reader, Silent Sustained Reading and the D.E.A.R. program. Students identified with special needs are provided with reading support in small groups or as individuals by a reading resource teacher and those students with an IEP receive services through the public school. Children that have been identified with an ICEP are provided reading support where needed and as needed through differentiated instruction. To meet the needs of children who are talented and gifted, St. Emily has an Enrichment Program that serves grades 1 through 4. To address the needs of upper level students in grades 5 through 8, St. Emily has opted for reading groups that are based on TerraNova scores, in-house comprehension tests and faculty input. All of these programs are fluid and ongoing.
3. Mathematics:
The mathematics curriculum implemented at St. Emily School develops the skills and knowledge necessary for success in the academic arena and life. From the primary grades through junior high, the instruction offered builds strong computation and estimation skills and a clear number sense, develops an understanding of patterns and problem solving skills, focuses on mastery of measurement skills as well as

14
knowledge and use of data, statistics and probability. It also aims to achieve an understanding of functions and algebraic reasoning and skills, fosters the development of geometry and its applications to life, and nurtures an effective communication of mathematics through oral and written language. Recognizing the varying ability levels of the students, differentiated instruction is incorporated to help each student learn in an environment conducive to his/her own needs. Math skills are reinforced as teachers incorporate interdisciplinary lessons into the curriculum, using math skills in science, social studies and language arts. In the primary and intermediate grades, mathematics education is provided on a daily basis in a concrete manner to ensure understanding. The Harcourt Mathematics series allows for teacher-directed instruction and reinforces concepts learned at each grade level. Basic measurement skills, number sense, patterning, use of data and statistics, and early problem solving are all explored in a hands-on format with manipulatives, calendar activities, and charting. Continual maintenance of skills takes place even after mastery to insure retention. The achievements of the students are supported through continual assessments, including standardized testing. In junior high, emphasis is placed on the skills necessary for success in algebra and higher level math. Instruction is provided at remedial, average, and accelerated rates. The McDougal-Little series is utilized, allowing for concrete lessons when necessary, yet stressing application of skills for problem solving at higher levels. Pre-Algebra skills are developed and students are offered a full year of algebra. Assessments provided to students moving on to the high school level support the success of this program. St. Emily School’s mission is to foster and develop the unique talents of each student, and its mathematics curriculum empowers each student to strive toward an optimum opportunity for success.
4. Additional Curriculum Area:
Technology: The use of technology is important to the student's acquisition of essential skills and knowledge. St. Emily School uses an approved technology plan from the Archdiocese of Chicago. Technology is integrated throughout the curriculum to enhance student understanding, to help the student realize the importance of technology and its impact on the environment and society. The technology curriculum is designed to utilize appropriate instruments, electronic equipment, networks, and venues to access information. Students are then able to process ideas, communicate learning, create, and perform. In support of the school's mission the use of technology helps foster a sense of independence in each student so that he/she can improve academic achievement and show responsibility and make right choices when using technology. Technology-based teaching strategies and instructional resources help develop the talents of each student, and encourage higher level thinking skills and creative problem solving. For teachers, technology expands the variety of teaching tools to differentiate and support diverse learners.
Project Based Learning has been used as a comprehensive approach to learning. Students participated in projects and practiced an interdisciplinary array of skills including math, language arts, fine arts, social studies, science and technology. PBL also promoted a greater responsibility for social interaction. The student incorporated technology in classroom research, investigations, and contextual studies.
St. Emily School provides technology resources to its students and staff for educational and administrative purposes. The goal in providing these resources is to promote educational excellence in St. Emily School by facilitating resource sharing, innovation and communication with the support and supervision of parents, teachers, and support staff. St. Emily School prepares students to be lifelong learners who are responsible for their own learning, skilled in accessing and processing information, confident in using technological tools, and able to communicate locally, nationally, and globally.
5. Instructional Methods:
Classroom instruction is adapted to accommodate students’ needs and performance. Instructional goals and objectives ensure that each student grasps the essential skills needed for growth in the subject matter. Since students vary greatly in readiness and learning styles, staff development and professional growth opportunities in differentiation help teachers put this into practice in the classrooms. Many of the key components of differentiated learning are utilized in classrooms at many levels. Students are
15
encouraged to be independent learners with guidance from the teachers, but are given flexibility to work on their own. Science, writing, math, and art centers are examples of learning and/or interest centers that are set up in many of the classrooms. The flexibility enables students of varying abilities to increase learning capabilities in a relaxed and independent manner. The use of audio-visual materials such as CD players, overhead projectors and computer access provides the needed stimulation for auditory and visual learners in the groups. Many of the primary teachers incorporate music and movement to stimulate creativity and focus on tactile-kinesthetic learners. Classes are often subdivided into smaller groups to problem-solve and explore topics from the curriculum through dialogue and investigation. St. Emily teachers modify content through the use of learning materials to accomplish their objectives. The use of graphic organizers, pacing, tiered instruction, independent projects and portfolios allow the educators a myriad of strategies to provide for a student-centered, differentiated classroom. For children that struggle with reading and/or deciphering directions many assessment instruments are adjusted and individualized to truly gauge students’ knowledge.
Additionally, for students in K-3, Learning Center time is provided for small groups for 30-40 minutes each week. The teacher uses creative activities to provide enrichment and supplemental support to classroom learning. This includes an introduction to the Spanish culture and terms (colors, numbers, animal names, etc.). Writing strategies are stressed to improve student writing. Students in grades 5-8 are placed in small groups for mathematics and reading to produce learning and achievement. A Special Needs teacher works with those students needing more individualized, modified or remedial help in the Resource Center. These groups are seen on a daily basis for 40 minute periods.
All curricula support instructional planning in the "Backward Design" model. The teachers plan instruction by looking at the intended learning (outcome/objective), what students will do to demonstrate knowledge, skills, and understanding (assessment), and what teaching and learning activities and resources the teachers can use to help students show evidence of learning (strategies).
6. Professional Development:
To support the continuing success of Catholic school students, the Archdiocese of Chicago has implemented a strategic management process entitled, Genesis: A New Beginning for Catholic Schools. St. Emily School has integrated Genesis goals into its all-school goals and professional development. Goal #1: “Implement a systemic, research-based curriculum that enables students to master and integrate intellectual and practical skills.” During the past seven years, the principal and faculty have written the first St. Emily School Curriculum Guide using curriculum mapping and frameworks from the Archdiocese of Chicago, including the “Backward Design” model in lesson plans, and Illinois state standards. The principal and faculty continue to review and revise one subject area per year, updating textbooks and instructional materials. Teachers and programs are proactive in differentiating content, process, and product, to provide inclusive education. Goal #2: “Utilize interactive teaching and learning strategies to optimize all student-learning experiences.” Through staff development, teachers have integrated technology throughout the curriculum including Project Based Learning and Power Point presentations. The NP of the Mean NCE TerraNova reading scores for grade 7 increased from 69%, in 2008, to 82%, in 2009, after professional development in Reading Strategies for the Content Areas. Goal #3: “Implement the practice of inclusion of students with varying abilities, differing learning needs and styles within the regular education classroom.” The Archdiocesan office of Inclusive Education made several presentations to the teachers resulting in more ICEPs (Individual Catholic Education Plans) to meet the needs of students. Response to Intervention professional development opportunities have been provided for teachers as well as seminars discussing classroom strategies for teaching students with autism. All professional development supports student learning and is aligned with content standards.
St. Emily School has seen improved student achievement in reading after setting this as an all-school goal and implementing professional development in teaching reading in the content areas. Improving student writing skills has also been a goal with professional development provided for teachers and monitoring of techniques by the principal in lesson plans, formal evaluations, faculty sharing opportunities and student work.
16
7. School Leadership:
The principal serves the St. Emily Catholic educational community by ensuring that the school is integral to the mission of evangelization by giving witness to Gospel living, spiritual and educational development, and a deepening of the faith in all members of the local community. The principal is the faith and instructional leader of the school. St. Emily School’s Catholic identity is evident in all-school morning prayer, weekly liturgies, service projects to the global and local communities, prayer services, and overall environment. Curriculum mapping and the writing of a school Curriculum Guide, by the principal and faculty, developed over the past seven years, provide guidelines and standards for all instruction and learning in the school. Textbooks and learning materials have been updated to improve student learning. This was accomplished through the Textbook Loan Program and school budget. Professional development has supported the curriculum and goals of the school and School Improvement Process (2005/2006), and moved student learning forward as evidenced with improved TerraNova test data. Programs such as Project Based Learning have integrated technology into all areas of the curriculum, enhanced the technology program, and improved student achievement. The restructuring of personnel by the school's leadership has increased the success of the mathematics program and technology program, along with the establishment of a Resource Center with a Special Education teacher to offer support and guidance to the faculty in working with students’ special needs. The Fine Arts program has grown to include drama opportunities for students, along with a more comprehensive curriculum for all grades. Spanish was added to the Junior High program for high school preparation seven years ago. Extracurricular activities have been added to help develop student leadership, good sportsmanship and self-confidence. The principal works with marketing and development personnel of the Archdiocese and the School Advisory Board to ensure continued vitality and support and growth for school programs. The school's leadership, in conjunction with the Archdiocese of Chicago, has established an Enrollment Management Team, working with teachers, parents, and advocates of Catholic education to sustain and grow school enrollment.

17
PART VI - PRIVATE SCHOOL ADDENDUM 11PV76
1. Private school association: Catholic
2. Does the school have nonprofit, tax-exempt (501(c)(3) status? Yes
3. What are the 2009-2010 tuition rates, by grade? (Do not include room, board, or fees.)
$3830
$3830
$3830
$3830
$3830
$3830
K
1st
2nd
3rd
4th
5th
$3830
$3830
$3830
$
$
$
6th
7th
8th
9th
10th
11th
$
$
12th
Other
4. What is the educational cost per student? (School budget divided by enrollment) $5106
5. What is the average financial aid per student? $1300
6. What percentage of the annual budget is devoted to scholarship assistance and/or tuition reduction?
2%
7. What percentage of the student body receives scholarship assistance, including tuition reduction? 10%
18
PART VII - ASSESSMENT RESULTS
STATE CRITERION-REFERENCED TESTS
Subject: Mathematics Grade: 3 Test: TerraNova
Edition/Publication Year: Second 2001/Third 2008
Publisher: CTB McGraw-Hill
Scores reported as: Percentiles
2009-2010 2008-2009 2007-2008 2006-2007 2005-2006
Testing Month Mar Mar Mar Mar Mar
SCHOOL SCORES
Average Score 91 80 86 73 79
Number of students tested 28 28 32 40 33
Percent of total students tested 100 100 100 100 100
Number of students alternatively assessed 0 0 0 0 0
Percent of students alternatively assessed 0 0 0 0 0
SUBGROUP SCORES
1. Free/Reduced-Price Meals/Socio-economic Disadvantaged Students
Average Score
Number of students tested
2. African American Students
Average Score
Number of students tested
3. Hispanic or Latino Students
Average Score
Number of students tested
4. Special Education Students
Average Score
Number of students tested
5. English Language Learner Students
Average Score
Number of students tested
6.
Average Score
Number of students tested
NOTES: TerraNova Second Edition was administered for the 2005/2006 through 2007/2008 school years. TerraNova Third Edition was administered for the 2008/2009 and 2009/2010 school years.
11PV76

19
STATE CRITERION-REFERENCED TESTS
Subject: Reading Grade: 3 Test: TerraNova
Edition/Publication Year: Second 2001/Third 2008
Publisher: CTB McGraw-Hill
Scores reported as: Percentiles
2009-2010 2008-2009 2007-2008 2006-2007 2005-2006
Testing Month Mar Mar Mar Mar Mar
SCHOOL SCORES
Average Score 76 76 83 69 85
Number of students tested 28 28 32 40 34
Percent of total students tested 100 100 100 100 100
Number of students alternatively assessed 0 0 0 0 0
Percent of students alternatively assessed 0 0 0 0 0
SUBGROUP SCORES
1. Free/Reduced-Price Meals/Socio-economic Disadvantaged Students
Average Score
Number of students tested
2. African American Students
Average Score
Number of students tested
3. Hispanic or Latino Students
Average Score
Number of students tested
4. Special Education Students
Average Score
Number of students tested
5. English Language Learner Students
Average Score
Number of students tested
6.
Average Score
Number of students tested
NOTES: TerraNova Second Edition was administered for the 2005/2006 through 2007/2008 school years. TerraNova Third Edition was administered for the 2008/2009 and 2009/2010 school years.
11PV76

20
STATE CRITERION-REFERENCED TESTS
Subject: Mathematics Grade: 4 Test: TerraNova
Edition/Publication Year: Second 2001/Third 2008
Publisher: CTB McGraw-Hill
Scores reported as: Percentiles
2009-2010 2008-2009 2007-2008 2006-2007 2005-2006
Testing Month Mar Mar Mar Mar Mar
SCHOOL SCORES
Average Score 67 77 76 72 76
Number of students tested 21 30 38 33 40
Percent of total students tested 100 100 100 100 100
Number of students alternatively assessed 0 0 0 0 0
Percent of students alternatively assessed 0 0 0 0 0
SUBGROUP SCORES
1. Free/Reduced-Price Meals/Socio-economic Disadvantaged Students
Average Score
Number of students tested
2. African American Students
Average Score
Number of students tested
3. Hispanic or Latino Students
Average Score
Number of students tested
4. Special Education Students
Average Score
Number of students tested
5. English Language Learner Students
Average Score
Number of students tested
6.
Average Score
Number of students tested
NOTES: TerraNova Second Edition was administered for the 2005/2006 through 2007/2008 school years. TerraNova Third Edition was administered for the 2008/2009 and 2009/2010 school years.
11PV76

21
STATE CRITERION-REFERENCED TESTS
Subject: Reading Grade: 4 Test: TerraNova
Edition/Publication Year: Second 2001/Third 2008
Publisher: CTB McGraw-Hill
Scores reported as: Percentiles
2009-2010 2008-2009 2007-2008 2006-2007 2005-2006
Testing Month Mar Mar Mar Mar Mar
SCHOOL SCORES
Average Score 78 80 74 83 71
Number of students tested 21 30 38 33 40
Percent of total students tested 100 100 100 100 100
Number of students alternatively assessed 0 0 0 0 0
Percent of students alternatively assessed 0 0 0 0 0
SUBGROUP SCORES
1. Free/Reduced-Price Meals/Socio-economic Disadvantaged Students
Average Score
Number of students tested
2. African American Students
Average Score
Number of students tested
3. Hispanic or Latino Students
Average Score
Number of students tested
4. Special Education Students
Average Score
Number of students tested
5. English Language Learner Students
Average Score
Number of students tested
6.
Average Score
Number of students tested
NOTES: TerraNova Second Edition was administered for the 2005/2006 through 2007/2008 school years. TerraNova Third Edition was administered for the 2008/2009 and 2009/2010 school years.
11PV76

22
STATE CRITERION-REFERENCED TESTS
Subject: Mathematics Grade: 5 Test: TerraNova
Edition/Publication Year: Second 2001/Third 2008
Publisher: CTB McGraw-Hill
Scores reported as: Percentiles
2009-2010 2008-2009 2007-2008 2006-2007 2005-2006
Testing Month Mar Mar Mar Mar Mar
SCHOOL SCORES
Average Score 85 77 74 79 75
Number of students tested 27 36 32 33 35
Percent of total students tested 100 100 100 100 100
Number of students alternatively assessed 0 0 0 0 0
Percent of students alternatively assessed 0 0 0 0 0
SUBGROUP SCORES
1. Free/Reduced-Price Meals/Socio-economic Disadvantaged Students
Average Score
Number of students tested
2. African American Students
Average Score
Number of students tested
3. Hispanic or Latino Students
Average Score
Number of students tested
4. Special Education Students
Average Score
Number of students tested
5. English Language Learner Students
Average Score
Number of students tested
6.
Average Score
Number of students tested
NOTES: TerraNova Second Edition was administered for the 2005/2006 through 2007/2008 school years. TerraNova Third Edition was administered for the 2008/2009 and 2009/2010 school years.
11PV76

23
STATE CRITERION-REFERENCED TESTS
Subject: Reading Grade: 5 Test: TerraNova
Edition/Publication Year: Second 2001/Third 2008
Publisher: CTB McGraw-Hill
Scores reported as: Percentiles
2009-2010 2008-2009 2007-2008 2006-2007 2005-2006
Testing Month Mar Mar Mar Mar Mar
SCHOOL SCORES
Average Score 87 74 80 80 78
Number of students tested 27 36 32 33 35
Percent of total students tested 100 100 100 100 100
Number of students alternatively assessed 0 0 0 0 0
Percent of students alternatively assessed 0 0 0 0 0
SUBGROUP SCORES
1. Free/Reduced-Price Meals/Socio-economic Disadvantaged Students
Average Score
Number of students tested
2. African American Students
Average Score
Number of students tested
3. Hispanic or Latino Students
Average Score
Number of students tested
4. Special Education Students
Average Score
Number of students tested
5. English Language Learner Students
Average Score
Number of students tested
6.
Average Score
Number of students tested
NOTES: TerraNova Second Edition was administered for the 2005/2006 through 2007/2008 school years. TerraNova Third Edition was administered for the 2008/2009 and 2009/2010 school years.
11PV76
24
STATE CRITERION-REFERENCED TESTS
Subject: Mathematics Grade: 6 Test: TerraNova
Edition/Publication Year: Second 2001/Third 2008
Publisher: CTB McGraw-Hill
Scores reported as: Percentiles
2009-2010 2008-2009 2007-2008 2006-2007 2005-2006
Testing Month Mar Mar Mar Mar Mar
SCHOOL SCORES
Average Score 79 68 74 75 75
Number of students tested 33 32 35 35 41
Percent of total students tested 100 100 100 100 100
Number of students alternatively assessed 0 0 0 0 0
Percent of students alternatively assessed 0 0 0 0 0
SUBGROUP SCORES
1. Free/Reduced-Price Meals/Socio-economic Disadvantaged Students
Average Score
Number of students tested
2. African American Students
Average Score
Number of students tested
3. Hispanic or Latino Students
Average Score
Number of students tested
4. Special Education Students
Average Score
Number of students tested
5. English Language Learner Students
Average Score
Number of students tested
6.
Average Score
Number of students tested
NOTES: TerraNova Second Edition was administered for the 2005/2006 through 2007/2008 school years. TerraNova Third Edition was administered for the 2008/2009 and 2009/2010 school years.
11PV76

25
STATE CRITERION-REFERENCED TESTS
Subject: Reading Grade: 6 Test: TerraNova
Edition/Publication Year: Second 2001/Third 2008
Publisher: CTB McGraw-Hill
Scores reported as: Percentiles
2009-2010 2008-2009 2007-2008 2006-2007 2005-2006
Testing Month Mar Mar Mar Mar Mar
SCHOOL SCORES
Average Score 75 78 72 71 70
Number of students tested 33 32 35 35 41
Percent of total students tested 100 100 100 100 100
Number of students alternatively assessed 0 0 0 0 0
Percent of students alternatively assessed 0 0 0 0 0
SUBGROUP SCORES
1. Free/Reduced-Price Meals/Socio-economic Disadvantaged Students
Average Score
Number of students tested
2. African American Students
Average Score
Number of students tested
3. Hispanic or Latino Students
Average Score
Number of students tested
4. Special Education Students
Average Score
Number of students tested
5. English Language Learner Students
Average Score
Number of students tested
6.
Average Score
Number of students tested
NOTES: TerraNova Second Edition was administered for the 2005/2006 through 2007/2008 school years. TerraNova Third Edition was administered for the 2008/2009 and 2009/2010 school years.
11PV76

26
STATE CRITERION-REFERENCED TESTS
Subject: Mathematics Grade: 7 Test: TerraNova
Edition/Publication Year: Second 2001/Third 2008
Publisher: CTB McGraw-Hill
Scores reported as: Percentiles
2009-2010 2008-2009 2007-2008 2006-2007 2005-2006
Testing Month Mar Mar Mar Mar Mar
SCHOOL SCORES
Average Score 72 75 73 73 77
Number of students tested 31 35 34 41 39
Percent of total students tested 100 100 100 100 100
Number of students alternatively assessed 0 0 0 0 0
Percent of students alternatively assessed 0 0 0 0 0
SUBGROUP SCORES
1. Free/Reduced-Price Meals/Socio-economic Disadvantaged Students
Average Score
Number of students tested
2. African American Students
Average Score
Number of students tested
3. Hispanic or Latino Students
Average Score
Number of students tested
4. Special Education Students
Average Score
Number of students tested
5. English Language Learner Students
Average Score
Number of students tested
6.
Average Score
Number of students tested
NOTES: TerraNova Second Edition was administered for the 2005/2006 through 2007/2008 school years. TerraNova Third Edition was administered for the 2008/2009 and 2009/2010 school years.
11PV76

27
STATE CRITERION-REFERENCED TESTS
Subject: Reading Grade: 7 Test: TerraNova
Edition/Publication Year: Second 2001/Third 2008
Publisher: CTB McGraw-Hill
Scores reported as: Percentiles
2009-2010 2008-2009 2007-2008 2006-2007 2005-2006
Testing Month Mar Mar Mar Mar Mar
SCHOOL SCORES
Average Score 81 82 69 65 73
Number of students tested 31 35 34 41 39
Percent of total students tested 100 100 100 100 100
Number of students alternatively assessed 0 0 0 0 0
Percent of students alternatively assessed 0 0 0 0 0
SUBGROUP SCORES
1. Free/Reduced-Price Meals/Socio-economic Disadvantaged Students
Average Score
Number of students tested
2. African American Students
Average Score
Number of students tested
3. Hispanic or Latino Students
Average Score
Number of students tested
4. Special Education Students
Average Score
Number of students tested
5. English Language Learner Students
Average Score
Number of students tested
6.
Average Score
Number of students tested
NOTES: TerraNova Second Edition was administered for the 2005/2006 through 2007/2008 school years. TerraNova Third Edition was administered for the 2008/2009 and 2009/2010 school years.
11PV76