u.s. department of commerce …...u.s. department of commerce environmental science services...
TRANSCRIPT

U.S. DEPARTMENT OF COMMERCE ENVIRONMENTAL SCIENCE SERVICES ADMINISTRATION
WEATHER BUREAU
Weather Bureau Technical Memorandum HYDR0-2
ANNOTATED BIBLIOGRAPHY OF ESSA PUBLICATIONS OF HYDROLOGICAL INTEREST
J. L. H. Paulhus
OFFICE OF HYDROLOGY TECHNICAL MEMORANDUM NO. 2 WASHINGTON, D.C. February 1967
1. 2. 3. 4. 5. 6. 7. B. 9.
10. 11. 12. 13. 14. 15. 16. 17. 18. 19. 20. 21. 22. 23. 24. 25.
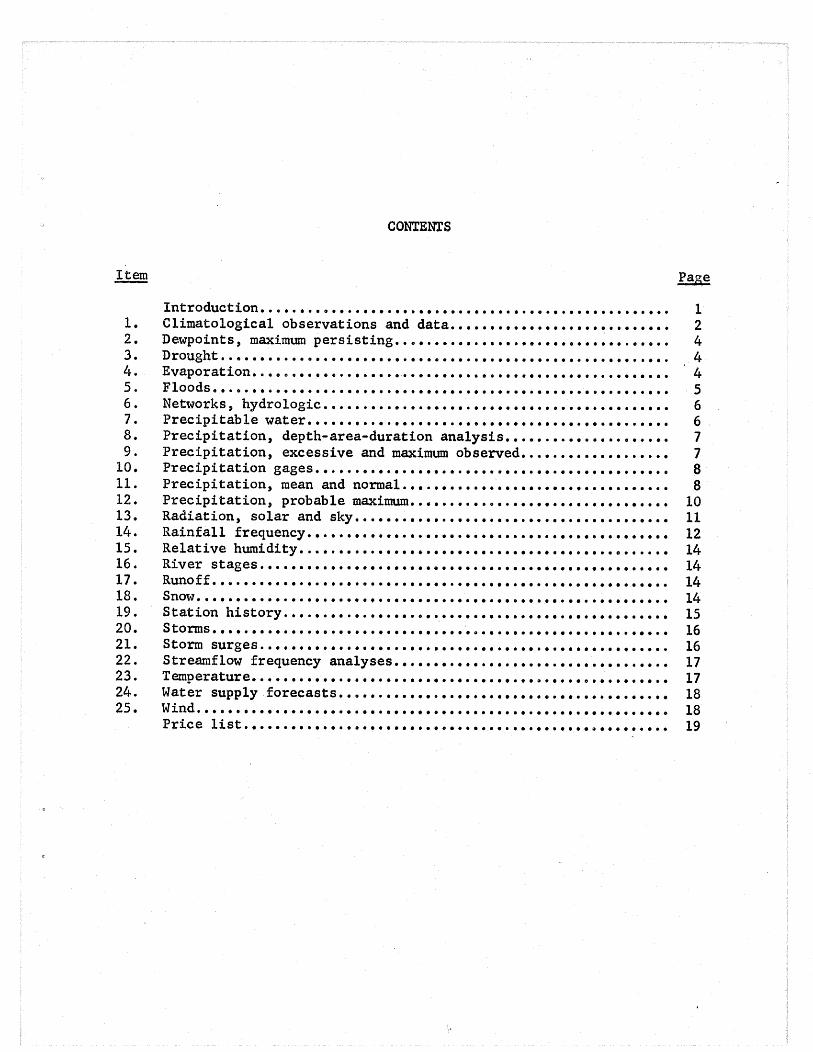
CONTENTS
Introduction •••••••••••••••••••••••••••••••••••••••••••••••••••• Climatological observations and data •••••••••••••••••••••••••••• Dewpoints, maximum persisting ••••••••••••••••••••••••••••••••••• Drought . .•..•........••••.•..•.•.••..•..•..•.•••.•••.....••..••. Evaporation •••••••••••.••••••••••••••••••••••••••••••••••••••••• Floods •••••••••••••••••••••••••••••••••••••••••••••••••••••••••• Networks, hydrologic •••••.•••••••••••••••••••••••••••••••••••••• Precipitable water ••••••••••.••••••••••••••••••••••••••••••••••• Precipitation, depth-area-duration analysis •••••.••••••••••••••• Precipitation, excessive and maximum observed ••••••••••••••••••• Precipitation gages ••••••••••••••••••••••••••••••••••••••••••••• Precipitation, mean and normal •••.•••••••• · •••••••••••••••••••••• Precipitation, probable maximum ••••••••••••.•••••••••••••••••••• Radiation, solar and sky •••••••••••••••••••••••••••••••••••••••• Rainfall frequency ••.••••••••••••••••••••••••••••••••••••••••••• Relative humidity •.••.•••••••••••••••••••••••••••••••••••••••••• River stages .••••••••••••••••••••••••••••••••••••••••••••••••••• Runoff ••••••••••••••••••••••••••••••.•••••••••••••••• • ••• • • • • • • • Snow ••••••••••••••••••••••••••• • •• • • • • • • • • • • • • • • • • • • • • • • • • • • • • • • Station history .••.••••.•••••••••• •.• •••••••••••••••••••••••••••• Storms .......................................................... . Storm surges .••••••••••••••••••••••••••••••••••••••••••••••••••• Streamflow frequency analyses ••••••••••••••••••••••••••••••••••• Temperature ••••••••••••••••••••••••••••••••••••••••••••••••••••• Water supply forecasts •••••.•••••••••••••••••••••••••••••••••••• Wind •••••••••••••••••••••••••••••••••••••••••••••••••••••••••••• Price list •••••••••••••••••••••••••••••••••.••••••••••••••••••••
1 2 4 4 4 5 6 6 7 7 8 8
10 11 12 14 14 14 14 15 16 16 17 17 18 18 19

ANNOTATED BlBLIOGRAPHY OF ESSA PUBLICATIONS
OF HYDROMETEOROLOGICAL INTEREST
October 1966
Many requests from engineers and others for hydrometeorological informa-tion indicate many are not aware that much of the information required is already available in published form. Bibliographies of government publica-tions are issued periodically, but they cover publications in many. fields of interest, and the selection of publications providing information in s'ome particular field is often difficult.
This bibliography is especially intended to servethe engineer by bring-ing to his attention the publications. of hydrometeorological material that he often requires. Some of the publications listed are included also ;i.n other indices covering meteorological or climatological subjects.
The bibliography, with a few exceptions, does not include periodicals such as the monthly and annual Climatological Data, which are all described in detail in "Selective Gu.ide to Published C l i m a t i c Data Sources Prepared by U. S. Weather Bureau," Key to Meteorological Records Documentation No. 4.11, 1963 (see item 1.9, page 3). Other publications have been omitted because the procedures described or data presented have been rendered obsolete by more recent works, or because they are not available for distribution. .A few out-of-print reports are listed because they are the only sources of some useful information. These publications are on the shelves of many libraries and may be available on a loan basis. Also, local Weather Bureau offices maintain a file of many of these publications for reference purposes.
Key to parenthetical identifiers
(GPO) Available from Superintendent of Documents, U. S. Government Printing Office, Washington, D. C. 20402
(WB) Available from Chief, Water Management Information Division, Office of Hydrology, ESSA -- Weather Bureau, Silver Spring, Md. 20910
(X) Out of print -- not available for distribution
1

1. CLIMATOLOGICAL OBSERVATIONS AND DATA
1.1 "Instructions for Climatological Observers," Weather Bureau Circular B, 11th ed., rev. 1962 (GP0 •.. $0.50)
Describes (1) the standard Weather Bureau instruments for measuring temperature, precipitation and evapora-tion, (2) the exposure of the instruments, and (3) the procedures for making the measurements.
1.2 Local Climatological Data with Comparative Data (name of station and year), (GP0 .• . $ 0 . 1 5 )
Issued yearly for each of about 200 U. S. cities where Weather Bureau has first-order stations. Lists monthly precipitation and means of temperature, relative humidity and wind for the year of issue. Average temperature and total precipitation are tabulated for each month of record. Tables of normals, means and extremes of temperature, pre-cipitation, relative humidity, wind and cloudiness for the period of record are also included. Also sunnnarizes infor-mation on station locations, elevations, exposures, instru-mentations from date station was established. (The 1962 issue contained only monthly data for that year . )
1.3 "Climatic Summary of the United States--Supplement for 1931 through 1952, (name of State)," Climatography of the United States No. 11, (GP0 ••• $0.20 to $0.70; price list on last two pages.)
Lists monthly and annual precipitation, temperature, snowfall for each month and year. Also presents mean number of days with precipitation equal to or greater than 0.10 and 0.50 inch, mean evaporation, mean maximum and minimum daily temperatures, mean number of days with temperature greater than 90°F or less than 32°F.
1.4 "Climates of the States, (name of State)," Climatography of the United States No. 60, (GPO ••. $0.10 to $0.25; price list on last two pages.)
Presents a short description of the climate (about 6 pages) and series of tables and maps of normal, mean and extremes of precipitation, temperature, wind, relative humidity.
1.5 "Monthly Normals of Temperature, Precipitation and Heating Degree Days, (name of State)," Climatography of the United States No. 81, (GPO • • • $ 0 . 0 5 )
Tabulations of station normals based on 1931-60 period.
2
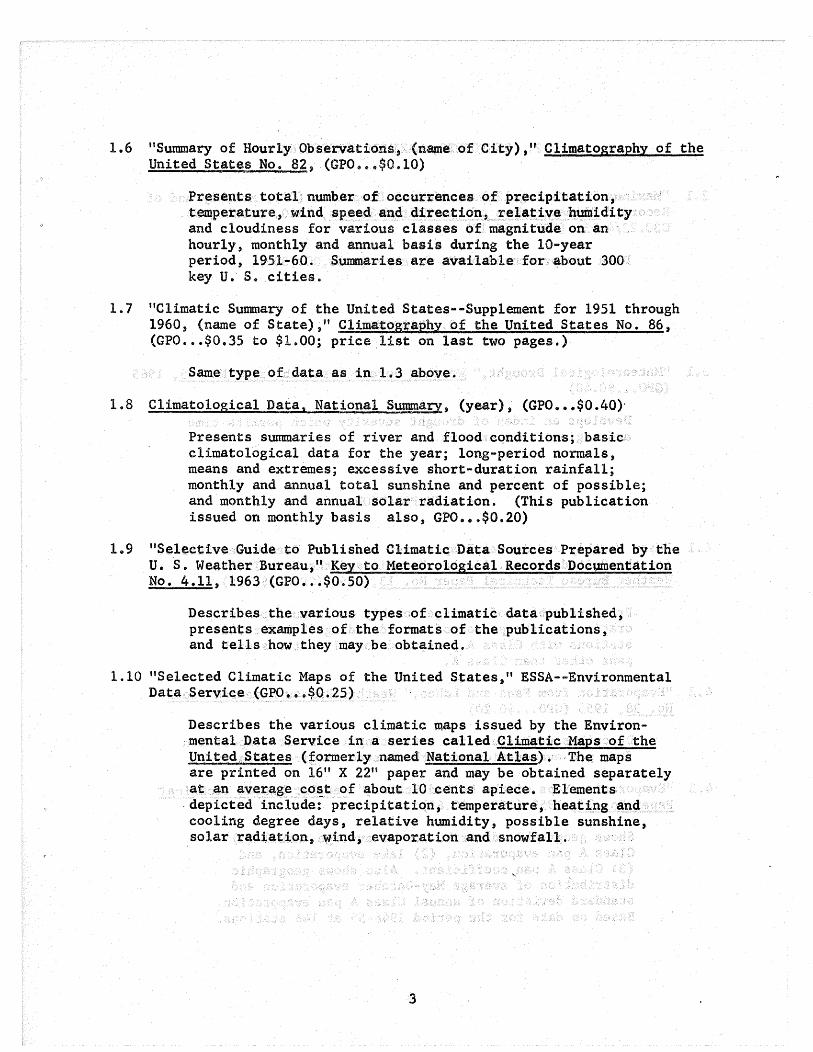
1.6 "Summary of Hourly Observations,, (name of City)," Climatography of the United States No. 82, (GPO ••• $0.10)
Presents total number of occurrences of precipitation, temperature, wind speed and d i r e c t i o n , relative humidity and cloudiness for various classes of magnitude on an hourly, monthly and annual basis during the 10-year period, 1951-60. Summaries are available for about 300· key U. s. cities.
1.7 "Climatic Summary of the United States--Supplement for 1951 through 1960, (name of State)," Climatography of the United States No. 86, (GP0 ••• $0.35 to $1~00; price list on last two pages.)
Same type of data as in 1.3 above.
1.8 Climatological Data, National Summary, (year), (GP0 ••• $0.40)·
Presents summaries of river and flood conditions; basic climatological data for the year; long-period normals, means and extremes; excessive short-duration rainfall; monthly and annual total sunshine and percent of possible; and monthly and annual solar radiation. (This publication issued on monthly basis also, GP0 ••• $0.20)
1.9 "Selective Guide to Published Climatic Data Sources Prepared by the U. S. Weather Bureau," Key to Meteorological Records Documentation . No. 4.11, 1963 (GP0 ••• $0~50)
Describes the various types of climatic data published, presents examples of the formats of the publications, and tells how they may be obtained.
1.10 "Selected Climatic Maps of the United States, 11 ESSA--Environmental Data Service (GPO ••• $0.25)
Describes the various climatic maps issued by the Environ-mentalData Service in a series called.Climatic Maps of·the United States (formerly named National Atlas). ,The maps are printed on 16" X 2211 paper and may be obtained separately at . .an average co~t of about 10 .cents apiece. Elements
.depicted include: precipitation, temperature, heating and cooling degree days, relative humidity, possible sunshine, . solar radiation, wind,. evaporation and snowfall.
3

2. DEWPOINTS, MAXIMUM PERSISTING
2 .. 1 "Maximum Persisting 12-hour 1000-mb Dewpoints·(°F), Monthly and of Record," Climatic Maps of•the United States, 1960, Catalog No. C30.22/4:D51 (GP0 •.. $0.10)
Data are presented on U. S. maps (1:30,000,000).
3. DROUGIIT
3.1 "Meteorological Drought," Weather Bureau Research Paper No. 45, 1965 (GPO ••• $0.40)
Develops an index of drought severity which permits time and regional comparisons.
4. EVAPORATION
4.1 "Mean Monthly and Annual Evaporation Data from Free Water Surface for the United States, Alaska, Hawaii, and the West Indies," Weather Bureau Technical Paper No. 13, 1950 (GP0 •.• $0.15)
Presents tables of average monthly and annual pan evap-oration for the period of record ending 1949 for 242 stations with Class A pans, and for 61 stations with pans other than Class A.
4.2 "Evaporation from Pans and Lakes," Weather Bureau Research Paper No. 38, 1955 (GP0 ••• $0.20)
Describes techniques for estimating reservoir evaporation from pan evaporation and other meteorological data.
4. 3 "Evaporation Haps of the United States,'' Weather Bureau Technical Paper No. 37, 1959 (GP0 ••• $0.65)
Shows geographic distribution of average annual (1) Class A pan evaporation,' (2) lake evaporation, and (3) Class A pan,coefficient. Al$o shows geographic distribution of average May-October evaporation and standard deviation of annual Class A pan evaporation. Based on data for the period 1946-55 at. 146 stations.
4

Data ptesented are .s.81lle. as ·those· ·described in 4.3 above~
:NOTE: Daily evaporation and wind movement are published in the monthly Climatological Data, and monthly and annual values in the annual issue.
5. FLOODS.
5.1 "Kansas-Missouri Floods of June-July 1951," :Weather B.ureau Technical Paper No. 17, 1952 (GPO ••. $0.60)
Descripes the storms and floods and presents flood scenes and tabulations of hourly and daily rainfall amounts and river stages.
5.2 "Floods of April 1952--Upper Mississippi, Missouri, Red River of the North," Weather Bureau Technical Paper No. 23, 1954 (GPO ••• $1.00)
Describes causes and development o~.the floods a.nd presents daily meteorological and river stage data and flood scenes.
5. 3 "Hurricane Rains and Floods of August 1955,. ·Carolinas to New England," Weather Bureau Technical Paper No. 26·, 1956 (GPO ••• $1.00) ..
Describes .the s.tonn and floods. and presents flood scenes .and tabulations of hourly and daily rainfall amo.unts fpr eastern States from South Carolina. to Maine.
5.4 "Rainfall and Floods of April, May and June 1957 in the South-Central States," Weather Bureau Technical PaperNo. 33, 1958 (GP0 ••• $1.75)
Describes the storms and floods and presents flood scenes and tabulations of hourly and daily rainfall amounts for stations in th~ storm area, Texas to. Missouri.
5. 5 "Meteorology of Hypothetical Flood Sequences in the Mi.ssissippi River Basin," Hydrometeorological Report No. 35, 1959 (WB)·
Describes meteorological situation~ associated with historical floods and derives hypothetical floods for design purposes by combining historical floods.
5
5.6 11 SnO'tvmelt Floods of Harch-.April 1960, Missouri and Upper Mississippi Basins,'' Heather Bureau Technical Paper No. 45, 1962 (GPO ••• $1.25)
Describes causes and development of the floods and presents precipitation and river stage data and flood scenes.
5. 7 11The Harch-May 1965 Floods in the Upper Hississippi, Missouri and Red River of the North Basin, 11 ESSA ·Professional Paper No.--, 1966 (in press)
Presents statistics on flood and crest stages, areas and periods of flooding, warnings issued and flood damages. Describes the meteorological events leading to these record-breaking floods.
Also see item 1.8.
6. NETH'ORKS, HYDROLOGIC
6 •. 1 "River Basin Maps Showing Hydrologic Stations," Notes on Hydrologic Activities Bulletin No. 11, Inter~Agency Committee on Water Resources Subcommittee on Hydrology, 1961 (GPO ••• $4.25)
A series of 89 contiguous river basin maps for the United States shO't'ling hydrologic networks as of early 1959. Most cf the maps are scaled at about 15 miles to the.inch and show locations of precipitation, temperature, evaporation,. snow survey, streamflo~-v, meteorological radar and water quality stations. Recording and non-recording instruments are identified. (This is not an ESSA publication, but was prepared under \~eather Bureau supervision.)
7. PRECIPITABLE HATER
7.1 11Hean Precipitable Hater in the United States,n Heather Bureau Technical Paper No. 10, (GP0 ••• $0.30}
Presents tabulations and maps showing average monthly and annual distribution of atmospheric moisture in the layers from the surface to 8 km., and from 2 to 8 km. over the 48 States. Based on period of record ending 1943.
6

7. 2 "Tables .. of Precipitable Water and Other Factors for a Saturated Pseudo-Adiabatic Atmosphere," Weather Bureau Technical Paper No.. 14, 1951 {X)
Presents tables showing variation with height of atmospheric moisture, pressure and temperature.
8. PRECIPITATION, DEPTH-AREA-DURATION ANALYSIS
8 .. 1 "Manual for Depth ... Area-Duration Analysis of Storm Precipitation," Weather Bureau Cooperative· Studies Technical Paper No• 1, 1946 (WB)
Describes the standard procedure u'sed by various Federal agencies for making these analyses.
9. PRECIPITATION, EXCESSIVE AND MAXIMUM OBSERVED
9.1 "Excessive Precipitation Techniques,"·Key to Meteorological Records Documentation No. 3.081, 1958 (GP0 ••• $0.10)
Discusses the various criteria used for defining excessive precipitation and the different ways the data were measured and published. Names the various periodicals in which these data were published.
NOTE: Excessive precipitation data are published in the annual issue of Climatological Data 2 National Summary (item 1.8 above).
9.2 "Maximum Recorded United States Point Rainfall for 5 Minutes to 24 Hours at 207 First-Order Stations," Weather Bureau Technical Paper No. 2, rev. 1963 (GP0 ••• $0.40)
Data are presented in tables and on maps.
9.3 "Maximum 24-Hour Precipitation in the United States,"..;.;...;;;..;;;..;;;.;,;;,;;.;;;.....;;;;.;;.;;;...;;..;;;;.;;; Technical Paper No. 16, 1952 (X)
Presents tables of maximum 24-hour amounts for the period of record ending 1949 for 7,355 stations.in the 48 States.
7
9.4 "Maximum Station Precipitation for 1, 2, 3, 6, 12 and 24 Hours,'' Weather Bureau Technical Paper No. 15, (GPO)
--Part I: Utah, 1951, .25; Pa~t II: Idaho, 1951, .25; Part III: Florida, 1952, .45; Part IV: M~ryland, Delaware, and District __
·of Columbia, 1953, .25; Part V: New Jersey, 1953, .25; Part VI: New England, 1953, .60; Part VII:- South Carolina, 1953, .25; Part VIII! Virginia, 1954, .50; Part_IXi Georgia, 1954, .40; Part X: New Y~rk, 1954, .60; Part XI: North_Carolina, 1955, .55; Part XII~ Oregon, 1955, ~55; Part XIII: _Kentucky, 1955, .45; Part XIV~ Louisiana, 1955, .35; Part XV: Ala~ama, 1955, .35; Part XVI: Pennsy~vania, 1956, .65; Part XVII: Missis~ippi, 1956, .40; Part XVIII: West V~rginia, 1956, .35; Part XIX: _ Tennessee, 1956, .45; Part XX: _Indiana, 1956, .55; Part XXI:_ Illinois, 1958, .50; Part XXII: Ohio, 1958, .65; Part XXIII: Californ~a, 1959, $1.50; Part XXIV:- Texa~, 1959, $1.00; Part XXV: Arkansas, 1960, .50; Part XXVI: Oklahoma, 1961, .45.
Presents tables of maximum amounts for the period 1940-50 for about 2,000 recording-gage stations in 27 States.
10. PRECIPITATION GAGES
10.1 "History of Weather Bureau Precipitation Gages," Key to Meteorological Records Documentation.No. 3.082, 1963 (GP0 ••• $0.15)
Describes the various gages that have been used or are now in use.
11. PRECIPITATION, MEAN AND NORMAL
11.1 "Mean Annual Precipitation in Millions of Gallons of Water Per Square Mile by State Climatic.Div~sions," Climatic Maps of the United States, 1959, Catalog No. C30.22/4:P91 (GP0 ••• $0.10)
Data based on period 1931-55 are shown on a 1:10,000,000 map. Reverse side shows mean annual precipitation in millions -of gallons of water per capita by State Climatic Divisions.
11.2 "Mean Monthly Total Precipitation, January-August," Climatic Maps of the United States, 1960, Catalog No. C30.22/4:P91/4 (GP0 .•. $0.10)
Maps (1:.20,000,000) show mean precipitation (in.) for each month by State climatic divisions over the United States. Based on period 1931-55.
8

11.3 "Mean Monthly TotalPrec;:ip:Ltat:ton, September•Dec~ber," Climatic Maps of the United. State,, 19.60, Catalog No. C30.22/4:P91/5 (GPO ••• $0.10)
Maps (1:20,000,000) show mean precipitation (in.) for each month·by State· climatic division.a over the United States. Based on period 1931-55. The ~everte side identifies the divisions by name on a 1:10,000,000 map.
11.4 "Mean Annual Total Snowfall (inches)," Climatic Maps of the.United States, rev. ~966, Catalog No. C30.22/4:Sn6, (GPO ••• $0.10) ·
Data based on per~od of record through 1960 are presented on au. s. map (1:10,000,000). Reverseside shows mean monthly snowfall for 75 selected stations.
. "
11.5 "Mean Annual Total Precipitation by State Climatic Divisions," Climatic Maps of the United States, 1960, Catalog No. C30.22/4iP91/2 (GPO ••• $0 .10)
Map (lilorooo,ooo) sh.owing average precipitation (in.)-for the period 1931-55 for each climatic division. The . reverse side shows the mean monthly total precipitation for selected climatic divisions.
11.6 "Normal Annual Total Precipitation," Clima.tic Maps of the United States, rev. 1966, CatalogNo. C30.22/4:P91/7 (GP0 •• ~$0.10)
Map (1:10,000,000) showing normal annual precipitation (in.) based on period 1931·60 for the UnitedStates. Reverse side shows normal total precipitation by months·, for 100 selected stations.
11.7 "Normal Monthly.Total Precipitat~on," Climatic ·Maps of.the.United States, 1965, Catalog No. C52.ll:P9lpt.l~3(GPO ••• set of 3 maps, $0.30)
Data, base~ on period, 1931·60, are presented on 12 maps of about 1:15,000,000 scale.
11.8 "Mean Number of Days with 0 .. 01 Inch or More of Precipitation, Monthly and Annual," ClimaticMaps of the-United States, 1963, Catalog No. C30.22/4:P91/6 (GP0.~.$0.10)
Data are presented on U. S. maps (li30,000,000).
11.9 "Normal Monthly Number of Days with Precipitation of 0.5, 1.0, 2.0 and 4.0 Inchet; or Mor.e ip the Contiguous United States," Weather Bureau Technical Paper No. 57, 1966 (GPO ••• $1.50) ·
Four series of 12 U. s. maps· each (1:-10,000,000) present data based on period 1931-60.
-9
11.9 Also see item 1.5 for monthly normals of precipitation.
12. PRECIPITATION, PROBABLE MAXIMUM
12.1 "Seasonal Variation of the Probable Maximum Precipitation East of . the 105th Meridian for Areas from 10 to 1,000 Square Miles and Durations of 6, 12, 24, and 48 Hours," Hydrometeorological Report No. 33, 1956 (WB)
Presents maps showing the 24-hour, 200-sq. mi. probable maximum precipitation and curves for adjusting those values for durations of 6, 12 and 48 hours and for areas from 10 to 1,000 sq. mi.
12.2 "Generalized Estimates of Probable Maximum Precipitation for the United States West of the 105th Meridian for Areas to 400 Square Miles and Durations to 24 Hours," Weather Bureau Technical Paper No. 38, 1960 (GP0 ••• $1.00)
Discusses major storms and presents maps showing 1-, 6-, and 24-hour probable maximum precipitation for 10 sq. mi. An interpolation diagram and area-reduction curves are provided for estimating values for intermediate durations and areas up to 400 sq. mi.
12.3 "Generalized Estimates of Probable Maximum Precipitation and Rainfall Frequency Data for Puerto Rico and Virgin Islands," Weather Bureau Technical Paper No. 42, 1961 (GP0 ••• $0.50)
Presents maps showing 1-, 6-, and 24-hour probable maximum point precipitation and provides an interpolation diagram and area-reduction curves for obtaining values for inter-mediate durations and for areas up to 400 sq. mi.
12.4 "Interim Report on Probable Maximum Precipitation in California," Hydrometeorological Report No. 36, 1962 (WB)
Provides a procedure for estimating probable maximum precipitation for durations up to 72 hours and for areas up to 5,000 sq. mi.
12.5 "Probable Maximum Precipitation and Rainfall-Frequency Data for Alaska for Areas to 400 Square Miles, Durations .to 24 Hours, and Return Periods from 1 to 100 Years," Weather Bureau Technical Paper No. 47, 1963 (GP0 ••• $1.00}
Same type of date described in 12.3 above.
10
12.6 "Probable Maxi1llUttl ;P:rec:Lpitation> in the Hawaiian Islands," Hxdrometeorologica.L Report Nc» •. 39, 1963 (WB)
Presents point values of 24-hour PMP on maps and a depth-areao.duration·relationfor reducing those values for durations down to 30 min •.. and for areas up to 200 sq. mi •
12.7 "Probable Maximum Precipitation over the Susquehanna River Basin above Harrisburg, Pa.,"Hydrometeorological Report No. 40, 1965 (WB)
Presents estimates for durations from 6 to 72 hours and for areas from 10 sq. mi. to total basin area (24,100 sq. mi) o
12.8 ''Probable Maximum and TVA Precipitation over the Tennessee River Basin aboveChattanooga," Hydrometeorological Report No. 41, 1965, (GPO ••• $0. 75)
Presents estimates for durations from 6 to 72 hours for the total basin (21,400 sq. mi.) and one sub-area (7,980 sq. mi.). Variation of PMP during March-September season is·also given.
12.9 "Meteorological Conditions for the Probable Maximum Flood on the Yukon River above Rampart, Alaska," Hydrometeorological Report No. 42, 1966 (GP0 ••• $0~70)
Presents estimates of probable maximum precipitation and critical values of temperature, wind, and snow cover for optimum snowmelt ~onditions.
12.10 "Probable Maximum Precipitation, Northwest States," Hydrometeorological Report No. 43, 1966 (in press)
Presents generalized estimates of probable maximum precipitation for areas up to 5,000 sq. mi. and durations to 72 hours. Also presents critical sequences of wind, temperature and dewpoint for optimum snowmelt conditi()ns ..
13. RADIATION, SOLAR AND SKY
13.1 "Sunshine and Cloudiness at Selected Stations in the United States, Alaska, Hawaii and Puerto Rico,u Weather Bureau Technical Paper· No. 12, 1951 (GP0 •• ~$0.15)
Average monthly values based on period of record ending 1948 are presented in tabular form for about 80 U. s. stations.
11

13.2 "Weekly Mean Values of Daily Total Solar and Sky Radiation," Weather Bureau Technical Paper No. 11, 1949 (GPO ••• $0.15) Supplement No. 1, 1955 (GP0 ••• $0.05)
Presents seasonal variation curves of radiation for 30 U. S. stations. The supplement presents data for an additional five stations.
13.3 111:1ean Daily Solar Radiation, Honthly andAnnual," Climatic Maps of the United States, 1964, Catalog No. C30.22/4iSo4 (GP0 ••• $0.10)
Data (in langleys) are sho\m on u.s. maps (l:-3o,ooo,ooo).
13.4 11Hean Total Hours of Sunshine, Monthly and Annual,ll Climatic Maps of the United States, 1963, Catalog No. C30.22/4iSu2 (GP0 ••• $0.10)
D~ta, based on period 1931-60, are presented on 1:30,000,000 maps.
13.5 11Mean Percentage of Possible Sunshine, Monthly and Annual," __ Climatic Maps of the United States, 1960, Catalog No. C30.22/4:Su7 (GPO ••• $0.10)
Data, based on 164 stations with 20 or m.ore years of record through 1959, are presented on 1:30,000,000 maps.
Also see item 1.8 for monthly and annual sunshine and percent of possible, and monthly and annual solar radiation.
14. RAINFALL FREQUENCY
14.1 "Rainfall Intensity-Duration ... Frequency Curves for Selected Stations in the United States, Alaska, Ha"t-laiian Islands and Puerto Rico," Weather Bureau T8chnical Paper No. 25, 1955 (X)
Curves for 203 stations show 5-min. to 24-hour intensities for return periods of 2, 5, 10, 25, 50 and 100 years.
1[: .• 2 "Rainfall Frequency Atlas of the United States for Durations from 30 Hinutes to 24 Hours and Return Periods from 1 to 100 years, 11
Weather Bureau Technical Paper No. 40, 1961, reprinted 1963, (GPO ••• $1. 25)
Includes 49 maps showing 30-min., 1-~ 2-, 3-, 6-, 12-and 24-hour point precipitation for return periods of 1, 2, 5, 10, 25, 50 and 100 years, and interpolation diagrams for obtaining values for intermediate durations and return periods. Ratios for obtaining 5-, 10- and
12

15-min, precipitation from 30-min, values are also presented. Area-reduction curves for reducing point values for areas up to 400 sq. mi. are included
14.3 "Generalized Estimates of Probable Maximum Precipitation and Rainfall-Frequency Data for Puerto Rico and Virgin Islands," Weather Bureau Technic.al Faper No, 42, 1961 (GPO., ,$0.50)
Pre$ents same type of data described in l4e2 above.
14.4 nRainfall-Frequency Atlas of the Hawaiian Islands for Areas to 200 Square Miles, Durations to 24 Hours, and Return Periods from 1 to 100 Years, n Weather Bureau Technical Paper No., .. 43, 1962 (GPO •• e $0.40)
Presents same type of data described in 14.2 above.
14.5 nprobable Maximum Precipitation and Rainfall-Frequency Data for Alaska for Areas to 400 Square Miles, Durations to 24 Hours, and Return Periods from 1 to 100 Years," Weather Bureau Technical Paper No. 47, 1963 (GP0.~.$1.00)
Presents same type of data described in 14.2 above.
14.6 "Two- to Ten-Day Precipitation for Return Periods of 2 to 100 Years in the Contiguous United States, 11 Weather Bureau Technical Paper No. 49, 1964 (GP0 ••• $1.00)
Includes 24 maps showing 2-, 4-, 7- and 10-day point precipitation for return periods of 2, 5, 10, 25, 50 and 100 years and interpolation diagrams for obtaining values for intermediate dura.tio.ns and return periods. Area-reduction curves for reducing point values for areas up to 400 sq. mi. are also included.
14.7 "Two- to Ten-Day Rainfall for Return Periods of 2 to 100 Years in the Hawaiian Islands, 11 Weather Bureau Technical Paper No. 51, 1965 (GPO •• ,$0.30)
Presents same type of data described in 14e6 above.
14 .. 8 "Two- to Ten-Day Precipitation for Return Periods of 2 to 100 Years in Alaska," Weather Bureau Technical Paper No. 52, 1965 (GPO .•• $0.60)
Presents same type of data described in 14.6 abovee
l4e9 "Two- to Ten-Day Rainfall for Return Periods of 2 to 100 Years in Puerto Rico and Virgin Islands," Weather Bureau. Technical Paper No@ 53, 1963 (GP0 ••• $0.30)
Presents same type of data described in 14.6 above.
13
15. RELATIVE HUMIDITY
15.1 "Mean Relative Humidity (%), Honth1y and AnnuC!l," Climatic Maps of the United States, 1966, Catalog No. C30.22/4:H88 (GP0 ••• $0.10)
Data, based on 236 stations with 20 yea~s or more of record through 1959, are presented on 1:30,000,000 maps.
16. RIVER .STAGES
16.1 Daily River Stages (year), (GPO.&.Issues_for years prior to 1950 are out of print. Price of available issues: 1950, 1956, 1957, 1958 are each $1.25; 1951, 1952, 1953, 1954, 1955, 1959, 1960, 1961, 1962 and 1963 are each $1.00).
Presents daily river gage data, highest stages of record, and descriptions of gage locations.
17. RUNOFF.
17.1 "Predicting the Runoff from Storm Rainfall," Weather Bureau Research Paper No. 34, 1951 (GP0 ••• $0.05)
Describes the technique for developing graphical rainfall-runoff relations.
17 .. 2 "Methods of Flow Frequency Analysis," (see item 22.1).
18. SNOW
18.1 "Frequency of Maximum Water Equivalent of March Snow Cover in North Central United States," Weather Bureau Technical Paper No. SO, 1964 (GPO ••• $0. 25)
Describes relationships between maximum snow depths and their water equivalents. Presents two sets of six maps each showing water equivalent for the first and second halves of March for return periods of 2, 5, 10, 25, 50 and 100 years.
14

18.2 "Mean Annual Total Snowfall;" Climatic Maps of the United States, rev. 1966, Catalog No. C30.22/4:Sn6 (GP0 ••• $0.10)
18.3
Data based on period of .rec~rd through 1960are presented on aU. s. map '(1:10,000,000). Reverse side of this map shows mean monthly snowfall for 75 selected:<stations.
(WB)
This annualreportpresents monthly data on snow depths and water equivalents for the season December through April. The data are for some 700 stations in New England, New York and Pennsylvania.
' ' . ., .
18.4 Storage-Gage Precipitation Data for Western United States (GPO ••• $0. 50)
This annual publication presents data from remote areas . from gages that require·. reading and maintenance only at monthly or seasonal intervals •
. 19. STATION HISTORY
19.1 "Substation History for·(name of State)," Key to Meteorological Records Documentation No. 1.1 (GP0 ••. $0.25 to $1.25; price list on last two pages.)
Summarizes information on substation locations, elevations, exposures, instrwnentations, records and observers from date station was established up to about 1955.
NOTE: Similar information· is provided for some Weather Bureau first-order stations in Local Climatological Data with Comparative Data (see·item 1.2) • ......,_,...... •' . .
19.2 "Decadal Census of Weather Stations, (name of State)," Key to Meteorological Records Documentation· No. 6 .11 (GPO;. •• $0 .05 to $0.15; price list ·on ·last two pages.)·
Presents seven maps showing weather stations in existence in January of the years 1890, 1900, 1910, 1920, 1930 and 1950.

20. STORMS
20.1 11Mean Number of Thunderstorm Days in the United States," Weather Bureau Technical Paper No. 19, 1952 (GPO •.• $0 .15)
Tabulations and maps show mean monthly and seasonal numbe~ of days with thunderstorms for 266 U. S. stations.
20.2 "Heteorology of Flood-Producing Storms in the Hississippi River Basin," Hydrometeorological Report No. 34, 1956 (WB)
Describes characteristics of outstanding storms.
20.3 "North Atlantic ~ropical Cyclones," tv eat her Bureau Technical Paper No. 36, 1959 (GP0 ••. $1.00)
Tracks and frequencies of hurricanes and tropical storms 1886-1958. Tracks are shown on maps for each year and by 10-day periods for each 10 years of record.
20.l~o "Meteorology of Hydrologically Critical Storms in California," Hydrometeorological Report No. 37, 1962 (till)
Describes characteristics of outstanding storms.
20.5 ''Three-Dimensional Wind Flmv and Resulting Precipitation in a Northern California Storm," Heather Bureau Research Paper No. 44, 1963 (GP0 ... $0.35)
A reconstruction of the temperature, wind, pressure and raoisture distributions in a major storm.
21. STOPJ1 SURGES
21.1 "Characteristics of the Hurricane Storm Surge," Weather Bureau Technical Paper No. 48, 1963 (GP0 ••. $0.70)
Describes development of storm .surges and presents data on outstanding hurricane-produced surges along the Gulf and Atlantic Coasts.
16
22. STREAMFLOW FREQUENCY ANALYSES
22.1 11Methods of Flow Frequency Analysis," Notes on Hydrologic Activities Bulletin No. 13, Inter-Agency Committee on Water Resources, Subcommittee on Hydrology, 1966 (GP0 ••• $0.35)
Describes the five methods most commonly used by Federal agencies for making frequency studies of runoff at individual streamflow stations. Some of these methods are also used for analysis of rainfall frequency.
NOTE: This is not an ESSA publication, but ESSA is represented in the Subcommittee on Hydrology.
23. TEMPERATURE
23.1 "Normal Daily Maximum, Minimum, Average, and Range of Temper'!ture," Climatic Maps of the United States, 1966, Catalog No. C52.ll:T24/pt. 1-12 (GPO ••• set of 12 maps, $1.25)
Da~a, based on period 1931-60, are presented on maps (1:20,000,000)-- ,4 maps on each of the 12 sheets (one for each month). Reverse side of each sheet presents graphs for about 80 stations showing the highest and lowest temperatures of record through 1964 and the normal m~imum, average and,minimU1ll temperatures. for the month.
23.2 "Mean Annual Number of Days Minimum Temperature 32°F and Below,_" Climatic Maps of the United States, 1962, Catalog No. C30.22/4:T24/9 (GPO ••• $0 .10)
Data are presented on a 1:10,000,000 map. Reverse side presents similar data for selected stations on a monthly basis.
23.3 "Mean Dates of Last 32 °F Temperature in Spring and First 32 °F Temp·erature in Aut\!IDn," Climatic Maps ,of the United States, 1966, Catalog No. C52.11:T24/3 (GP0 ••• $0.10)
Data based on 2565 station records, 1921-50, are presented on 1:10,000,000 maps.
23.4 "Mean Length of Freeze-Free Period 1 " Climatic Maps of the United States, 1962, Catalog No. C30.22/4:F87 (GP0 ••• $0.10)
Maps (1!10,000,000) based on 2565 station records for
17

period 1921-50, shows mean number of days between last 32°F in spring and first 32°F in autumn. Reverse side presents a tabulation of mean monthly number of days with minimum temperature 32°F and below for about 140 stations.
24. WATER SUPPLY FORECASTS
24.1 Water Supply Forecasts for the Western United States (WB)
Issued as of the first of each month from January to May. Presents estimates of water-year flow to be expected from numerous watersheds west of l040W.
25. WIND
25.1 "History of weather Bureau Wind Measurements, 11 Key to Meteorological Records Documentation No. 3.151, 1963 (GPO ••• $0.40)
Describes various types of anemometers that have been used or are now in use.
25.2 "Prevailing Direction, Mean Speed, and Fastest Mile of Wind," ClimaticMaps of the United States, 1964, Catalog No. C30.22/4iW72 (GPO ••• $0 .10)
Data are presented on monthly maps (1:30,000,000).
25.3 "Surface Wind Roses," Climatic Maps of the United States, 1966 (GPO ••• set of 2 sheets $0.20)
Wind roses, based on hourly observations .for the period 1~51-60 at about 80 stations, are presented on 13 1:15,000,000 maps (12 monthly, 1 annual). Resultant winds for middle months of each of the four seasons are shown also on separate maps.
18
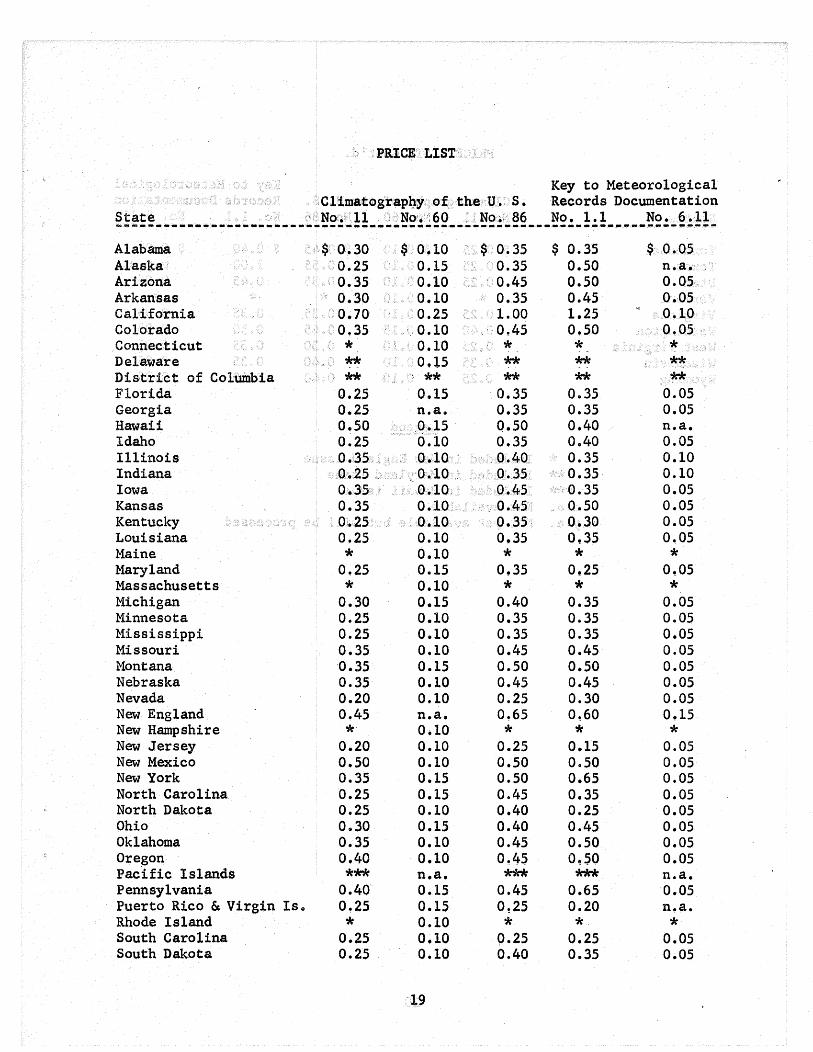
:PRICE· ··• LIST
Key to Meteorological .Cllmatogtaph,y· .of,. the U. S. Records Documentation
State · ·: No.'ll ·.· No·.··:60 .. ·No;.: 86 No. 1.1 No.·6.11 ------------------------~------------------------------------------------~--Alabama Alaska Arizona Arkansas California Colorado Connecticut Delaware District of Columbia Florida Georgia Hawaii Idaho Illinois Indiana Iowa Kansas Kentucky Louisiana Maine Maryland Massachusetts Michigan Minnesota Mississippi Missouri Montana Nebraska Nevada New England New Hampshire New Jersey New Mexico New York North Carolina North Dakota Ohio Oklahoma Oregon Pacific Islands Pennsylvania Puerto Rico & Virgin Is. Rhode Island South Carolina South Dakota
$'0.30 0.25 0.35 0.30 0.70 0~35
* ** ** 0.25
0.25 0.50 0.25 0.35· .
. 0.25 0.35 0.35 0:.25 0.25 * 0.25 * 0.30
0.25 0.25 0.35 ·0.35 0.35 0.20 0~45
* 0.20 0.50 0.35 0.25 0.25 0.30 0.35 0.40 *** 0.40 0~25
* 0.25 0.25
$ o.1o •0.15 0.10 0.10 0.25
' .. 0.10 0.10 0.15 ** 0.15
n.a. .0.15 0.10 0.10 o.·1o ..
. 0.10. 0.10
'0.10 0.10 0.10 0.15 0.10 0.15 0.10 0.10 0.10 0.15 0.10 0.10 n.a. o.1o 0.10 0.10 0.15 0.15 0.10 0.15 0.10 0.10 n.a. 0.15 0.15 0.10 0.10 0.10
19
$' 0.~35 '0.35
0.45 0.35 1.00
. 0~45 * ** ** 0.35
0.35 0.50 0.35 0.40. 0.35·
' 0.45 0.45 0.35 0.35 * 0.35 * 0.40
0.35 0.35 0.45 0.50 0.45 0.25 0~65
* 0.25 0.50 0.50 0.45 0.40 0.40 0.45 0.45 *** 0.45
0!25 * 0.25
0.40
$ 0.35 0.50 0.50 0.45 1.25 0.50 * ** ** 0.35
0.35 0.40 0.40 0.35 0.35 0.35
'. 0.50 0.30 0~35
* 0.25 * 0.35
0.35 0.35 0.45 0.50 0.45 0.30 0!60 * 0.15
0.50 0.65 0.35 0.25 0.45 0.50 o.so *** 0.65
0.20 * 0.25
0.35
$ 0 •. 05 n.a. 0.05 0.05 0.10 o~os
* ** **
0.05 0.05 n.a. 0.05 0.10 0.10 0.05 0.05 0.05 0.05 * o~o5
* 0.05 0.05 0.05 0.05 0.05 0.05 0.05 0.15 * 0.05
0.05 0.05 0.05 0.05 0.05 0.05 0.05 n.a. 0.05 n.a. * 0.05
0.05

PRICE LIST:~ C.ont • d.
Key to Meteorological Climatography of the U. S. Records Documentation
States No. 11 No •. 60 No. 86 No. 1.1 No. 6.11 -----------~----------------------------------------------------------------Tennessee Texas Utah Vermont Virginia Washington West Virginia Wisconsin Wyoming
$ 0.25 $ 0.10 $ 0.45 0.25 0.10 0.55 0~25 0.10 0.35 * 0.10 * 0.25 0.10 0.35
0.40 0.15 0.45 0.25 0.10 0.30 0.35 0.10 0.40 0.25 0.10 0.40
Legend
* Included in New England issue ** Included in Maryland issue
*** Included in Hawaii issue n.a. Not available
$ 0.40 1.00 0.45 * 0.35
0.50 0.35 0.35 0.40
n.y.a. Not yet available but will be processed
20
$ 0.05 n.y.a. 0.05 * 0.05
0.05 0.05 0.05 0.05