us coal sector - research-doc.credit-suisse.com
TRANSCRIPT

DISCLOSURE APPENDIX CONTAINS ANALYST CERTIFICATIONS AND THE STATUS OF NON-US ANALYSTS. U.S. Disclosure: Credit Suisse does and seeks to do business with companies covered in its research reports. As a result, investors should be aware that the Firm may have a conflict of interest that could affect the objectivity of this report. Investors should consider this report as only a single factor in making their investment decision.
13 April 2012Americas/United States
Equity ResearchDiversified Metals & Mining
US Coal Sector SECTOR FORECAST
Bouncing Along the Bottom After analyzing key trends for U.S. coal fundamentals over the next 12-24 months, and in conjunction with our global commodity team’s natural gas forecast revisions, we are revising estimates for all the coal companies, and downgrading Cloud Peak Energy (CLD) and Consol Energy (CNX) from Outperform to Neutral. We reiterate our Outperform rating on Peabody Energy (BTU), given its growing Australia asset base and exposure to met coal.
■ Are We Near the Bottom? The most common question that we expect to get from our earnings revisions is given the ~50% decline in the sector over the past year and the ~20% decline YTD, whether or not all the bad news is finally priced into the earnings, and are the stocks now nearing a bottom. In our view, the answer is probably, and that is why we are not downgrading the sector to underperform. But in our view street expectations are still too high, and earnings cuts in our view will be a headwind near-term.
■ U.S. Thermal Coal Fundamentals Unlikely to Improve Until 2H’13: While we have seen significant production cuts year to date, we see 3 signficant issues which will keep coal prices from moving higher over the next 12 months (and one of them is not low natural gas prices): 1) inventories, which we expect will remain well above levels of pricing power for the coal miners until 2H’13, 2) significant unpriced coal tonnage (50-55%) for 2013 and 3) spot prices which are at or below marginal cost, which suggests that 2013 contract negotiations will likely start at that level (ie: limited margin upside in 2013). The one bright spot is the export market, which will continue to grow after a flat 2012.
■ Still Expect a Met Coal Recovery: Conversely, we remain bullish on the prospects for met coal prices in the second half of 2012 (see full commodities team note for details). We believe the combination of 1) an acceleration in Chinese steel production, 2) supply constraints in Australia and 3) an improving global economy suggest that Q2 should mark the trough for met pricing in 2012. We again highlight BTU as our preferred way to play the met coal recovery.
■ Fairly Valued on Historical Valuations: On a historical multiples basis, we believe the coal stocks are fairly valued at our target prices, with only Peabody Energy (BTU) and Arch Coal (ACI) looking cheap on a relative basis vs. historical multiples (at a 10% discount to historical EV/EBITDA on our TP’s).
■ Downgrading CLD, CNX to Neutral: Given the weak thermal backdrop, we are downgrading both Cloud Peak Energy (CLD) and Consol Energy (CNX) from Outperform to Neutral. Using the CS HOLT framework tool also suggests both have limited upside from current levels. Reiterate Outperform Rating on Peabody Energy: Peabody Energy remains our top pick in the coal sector, due to BTU’s 1) Attractive Australian Asset Base, 2) Volume and Earnings Growth to 2015 and 3) its position as a Long-term Option proxy for the PRB.
Research Analysts
Richard Garchitorena, CFA 212 325 5809
Sean Wright, CPA 212 538 3284

13 April 2012
US Coal Sector 2
Executive Summary After analyzing key trends for U.S. coal fundamentals over the next 24-48 months, and in conjunction with our global commodity team’s reduction of natural gas price forecasts, we are downgrading both Cloud Peak Energy (CLD) and Consol Energy (CNX) from Outperform to Neutral. We maintain our Outperform rating on Peabody Energy (BTU).
Ratings Overview Exhibit 1: CS U.S. Coal Sector Coverage Universe
CurrentCompany Name Symbol Price Rating Revised Prior Upside 2013 2014Peabody Energy BTU 29.34$ OUTPERFORM $44.00 48.00$ 50.0% 6.2 5.5Cloud Peak CLD 15.41$ NEUTRAL $17.00 20.00$ 10.3% 4.2 4.4Consol Energy CNX 34.75$ NEUTRAL $40.00 45.00$ 15.1% 7.8 6.7Arch Coal ACI 10.63$ NEUTRAL $12.00 14.00$ 12.9% 6.5 6.1Alpha Natural Resources ANR 16.08$ NEUTRAL $18.00 22.00$ 11.9% 5.8 5.3
Target Price TP Multiple - EV/EBITDA
Source: Factset, Credit Suisse estimates
■ We have downgraded CLD and CNX from Outperform to Neutral, and lowered our target prices for each of the companies under coverage.
Exhibit 2: EPS Changes
Company Name Symbol Rating Revised Prior Var. Revised Prior Var. Revised Prior Var.Peabody Energy BTU OUTPERFORM $3.07 $3.48 -11.8% $4.31 $5.50 -21.7% $5.17 $6.33 -18.3%Cloud Peak CLD NEUTRAL $1.90 $1.90 0.0% $1.66 $1.98 -16.4% $1.48 $1.89 -21.8%Consol Energy CNX NEUTRAL $1.80 $2.00 -10.2% $2.15 $3.43 -37.3% $2.68 $4.47 -40.2%Arch Coal ACI NEUTRAL $0.59 $0.89 -33.6% $0.83 $1.31 -36.3% $0.99 $1.84 -46.1%Alpha Natural Resources ANR NEUTRAL -$0.11 $0.32 na -$0.01 $0.88 na $0.11 $1.05 -89.4%
20142012 2013
Source: Company data, our estimates
■ In conjunction with the global commodities team’s global revisions, as well as our adjustments to U.S. price forecasts, we have significantly lowered our earnings estimates for each of the coal companies under coverage for 2013 and 2014.
Exhibit 3: CS Estimates vs. Consensus
Company Name Symbol Rating CS Consensus Var. CS Consensus Var. CS Consensus Var.Peabody Energy BTU OUTPERFORM $3.07 $2.83 8.7% $4.31 $4.08 5.6% $5.17 $4.75 8.7%Cloud Peak CLD NEUTRAL $1.90 $2.01 -5.7% $1.66 $2.02 -18.0% $1.48 $1.66 -11.2%Consol Energy CNX NEUTRAL $1.80 $2.17 -17.1% $2.15 $2.75 -21.8% $2.68 $3.35 -20.1%Arch Coal ACI NEUTRAL $0.59 $0.76 -22.4% $0.83 $0.96 -13.3% $0.99 $1.37 -27.7%Alpha Natural Resources ANR NEUTRAL -$0.11 -$0.32 -64.7% -$0.01 $0.00 na $0.11 $0.51 -78.0%
2012 2013 2014
Source: Factset, Credit Suisse estimates
■ As a result, we are now below consensus for each of the coal companies under coverage from 2012 to 2014 with the exception of Peabody Energy, where we are above consensus.

13 April 2012
US Coal Sector 3
Are we There Yet? Exhibit 4: Share Performance (since Jan. 1, 2012) Exhibit 5: Share Performance (4/12/11 to 4/12/2012)
-8.1%
-17.5%
-22.2%
-28.4%-31.7%
-21.6%
-50%
-45%
-40%
-35%
-30%
-25%
-20%
-15%
-10%
-5%
0%
5%
10%
15%
CNX BTU CLD ANR ACI Group Avg.
-33.1%
-72.9%
-58.1%
-28.7%
-70.4%
-52.6%
-80%-75%-70%
-65%-60%
-55%-50%-45%
-40%-35%-30%
-25%-20%
-15%-10%
-5%
0%5%
10%
15%
CNX ANR BTU CLD ACI Group Avg.
Source: Factset, Credit Suisse estimates Source: Factset, Credit Suisse estimates
(as of April 12, 2012)
The most common question that we expect to get from our earnings revisions is given the ~50% decline in the sector over the past year and the ~20% decline YTD, whether or not all the bad news is finally priced into the earnings, and are the stocks now nearing a bottom. In our view, the answer is probably, and that is why we are not downgrading the sector to underperform. But in our view street expectations are way too high, and earnings cuts in our view will be a headwind near-term.
Additionally, we do not expect the fundamentals that impact the coal industry will recover until at least 12-18 months from now, and even then we expect the recovery to be slow and modest at best, with the signficant inventory build driven by the mild winter and low natural gas prices unlikely to reach normal levels until 2014 at the earliest. The one bright spot is the export market, which we do continue to grow and minimize the surpluses within the U.S. over time.
Historical Valuations Quantify This
Exhibit 6: Historical Multiples vs. Current (2013)
Share Price
Target Price
Historical Multiple
Current Multiple
Premium/Discount
TP Multiple
Premium/Discount
Historical Multiple
Current Multiple
Premium/Discount
TP Multiple
Premium/Discount
BTU 29.34$ 44.00$ 18.1 6.8 -62% 10.2 -44% 6.8 4.8 -30% 6.2 -10%CLD 15.41$ 17.00$ 8.9 9.3 4% 10.2 15% 4.2 3.8 -8% 4.2 0%CNX 34.75$ 40.00$ 18.3 16.1 -12% 18.6 2% 8.0 7.0 -12% 7.8 -2%ACI 10.63$ 12.00$ 16.1 12.8 -21% 14.4 -10% 7.3 6.2 -15% 6.5 -11%ANR 16.08$ 18.00$ 22.5 n/a n/a n/a n/a 6.0 5.4 -9% 5.8 -3%Avg. 16.8 11.3 -23% 13.4 -9% 6.5 5.5 -15% 6.1 -5%
P/E EV/EBITDA
Source: Company data, our estimates
We believe the best way to gauge what the shares are pricing in is by looking at historical valuation. On this metric, we note that on our target prices, the coal stocks now look fairly valued relative to historical multiples, with only Peabody Energy (BTU) and Arch Coal (ACI) looking cheap on a relative basis vs. historical multiples.
We also looked at these multiples based on assuming forward curve prices, and on this basis the names are trading at a discount. However as we highlight through this report, we do not think forward curve prices will be achievable in 2013, given the many headwinds facing the coal producers (low nat. gas prices, record inventory levels, signficant unpriced tonnage in 2013).

13 April 2012
US Coal Sector 4
Coal Price Forecast Changes Exhibit 7: Summary of Coal Forecast Changes
2014 LT
Q1 Q2 Q3 Q4 Yr Avg Q1 Q2 Q3 Q4 Yr Avg Yr Avg (real)
Coking Coal (contract)
Hard coking coal (US$/t) 235 210 225 235 226 245 240 235 235 239 235 170
previous 235 220 235 245 234 245 240 235 235 239 235 170
Semi hard coal (US$/t) 223 200 214 223 215 233 228 223 223 227 223 160
previous 223 209 223 233 222 233 228 223 223 227 223 160
Semi soft coal (US$/t) 157 141 151 157 151 164 161 157 157 160 157 134
previous 157 147 157 164 156 164 161 157 157 160 157 134
PCI coal (US$/t) 169 153 164 172 165 179 175 172 172 174 172 134
previous 169 158 169 176 168 176 173 169 169 172 169 134
Thermal Coal
US Thermal - PRB 8800 US$/ton 10 10 10 10 10 12 12 12 12 12 13 14
previous 10 10 10 10 10 13 13 13 13 13 15 14
US Thermal - NAPP/CAPP US$/ton 62 62 62 62 62 60 60 60 60 60 65 70
previous 62 62 62 62 62 70 70 70 70 70 75 70
US Thermal - Western Bit US$/ton 35 35 35 35 35 35 35 35 35 35 40 45
previous 40 40 40 40 40 40 40 40 40 40 40 45
US Thermal - Illinois Basin US$/ton 30 30 30 30 30 42 42 42 42 42 45 45
previous 40 40 40 40 40 42 42 42 42 42 45 45
Thermal Coal (Newcastle FOB) US$/t 113 110 115 115 113 120 125 125 130 125 130 120
previous 115 125 130 135 126 138 138 138 138 138 140 120
Thermal Coal (API#2 CIF) US$/t 100 105 110 110 106 115 120 120 125 120 125 120
previous 113 123 128 133 124 136 136 136 136 136 138 120
Thermal Coal (API#4 FOB) US$/t 105 105 110 110 108 115 120 120 125 120 125 120
previous 110 120 125 130 121 134 134 135 135 135 138 120
2012 2013
Source: Credit Suisse estimates

13 April 2012
US Coal Sector 5
U.S. Coal Industry Update Limited Downside Risk, in Our Opinion, but also Limited Upside While the weakness in thermal coal industry fundamentals is widely known, with the 22% decline YTD in the coal sector a clear reflection of this, given our commodities team’s reduction of natural gas price forecasts to levels well below the theoretical coal to gas switching price (which for Capp is ~$4.50/mmbtu), we thought it was appropriate to revisit the recent drivers of coal price weakness from 1) a supply/demand perspective, 2) a sustainability perspective, and 3) an earnings implications perspective. Specifically, we looked at the downside based on the assumption that marginal cost of coal production will set the floor for pricing (assuming that coal producers that are operating above that marginal cost disappear due to basic economics).
Conclusion: What we found was that 1) actual EIA production data suggests the cuts are greater than what has been announced, but even then the production cuts are still not enough to balance the oversupplied market, 2) inventories are 30-40% above normal levels (ie: where coal producers have pricing power) and will likely stay there until at least 2H’2013, and 3) this suggests that price negotiations for 2013 will likely start around the marginal cost of production level (ie: limited margin upside). With over 50-55% of thermal production still not contracted for 2013, in our view the likelihood is that the coal producers will not be able to capture current forward curve prices until 2014 at the earliest.
Stock Implications: Given the potential risks of 1) reduced 2012 production volumes, 2) reduced 2013 thermal price expectations, 3) the potential for natural gas prices to continue to surprise to the downside, and 4) the potential for reduced drilling schedules for natural gas as a result (see Arun Jayaram, Stefan Reveille and Jan Stuart’s note titled “US Natural Gas Reservoir: Fuel Switching to Cheap Gas”, published April 10 for more details), we believe consensus estimates remain too high for the bulk of the U.S. coal producers. As a result we are downgrading CNX and CLD to Neutral. We maintain our relative preference for Peabody Energy, given its Australia exposure, attractive growth profile and longer-term PRB upside.
Exhibit 8: 2012 EPS Estimates – CS vs Consensus Exhibit 9: 2013 EPS Estimates – CS vs Consensus
-$0.50
$0.00
$0.50
$1.00
$1.50
$2.00
$2.50
$3.00
$3.50
PeabodyEnergy
Cloud Peak Consol Energy Arch Coal Alpha NaturalResources
CS Estimates Consensus
-$0.50
$0.00
$0.50
$1.00
$1.50
$2.00
$2.50
$3.00
$3.50
$4.00
$4.50
$5.00
PeabodyEnergy
Cloud Peak Consol Energy Arch Coal Alpha NaturalResources
CS Estimates Consensus
Source: Company data, our estimates Source: Company data, our estimates

13 April 2012
US Coal Sector 6
Supply/Demand Perspective Surpluses Expected to At Least 2015
Exhibit 10: US Coal Supply-Demand Through 2015
-70,000
-60,000
-50,000
-40,000
-30,000
-20,000
-10,000
0
10,000
20,000
30,000
40,000
50,000
60,000
1990
1992
1994
1996
1998
2000
2002
2004
2006
2008
2010
2012
E20
14E
(in th
ousa
nd to
ns)
Source: EIA, our estimates
While there are a multitude of variables that impact the market balance, our Base Case Assumptions for Supply/Demand suggest that the U.S. coal market will remain in a modest surplus of 10m to 20m tons until 2015, unless we get more significant production cuts.
Supply: Better, But More Production Cuts Still Needed
It appears that the coal producers have already started to show production discipline, with EIA data to the end of March suggesting a run rate of over 66m tons (or ~6%) of lower production vs. 2011, vs. only approximately 25m tons of total announced production cuts from public companies since last November. We believe this difference is a function of reduced utilization at existing mines by public producers, as well as unannounced production cuts taken by private coal producers.
Exhibit 11: Announced Coal Production Cuts from Public
Companies
Exhibit 12: Implied Production Cuts from EIA Production
Data Date Company Ticker Total4-Nov-11 Arch Coal ACI 1.513-Jan-12 Patriot Coal PCX 113-Jan-12 Walter Energy WLT 1.2524-Jan-12 Teco Energy TE 1.36-Feb-12 Alpha Natural Resources ANR 410-Feb-12 Arch Coal ACI 3.524-Feb-12 Alpha Natural Resources ANR 5.528-Feb-12 Consol Energy CNX 4.31-Mar-12 Rhino Resources RNO 16-Mar-12 Consol Energy CNX 1.8
Total 25.15
Region 3/31/2012 3/31/2011 % Change
Appalachian 81,305 87,311 -6,006 -6.9%Interior 39,814 41,483 -1,669 -4.0%Western 135,963 144,829 -8,866 -6.1%U.S. Total 257,082 273,623 -16,541 -6.0%
Region % ChangeAppalachian 325,220 349,244 -24,024 -6.9%Interior 159,256 165,932 -6,676 -4.0%Western 543,852 579,316 -35,464 -6.1%U.S. Total 1,028,328 1,094,492 -66,164 -6.0%
Year To Date Coal Production
Implied 2012 Production Lost
Source: Company data, our estimates Source: EIA, our estimates

13 April 2012
US Coal Sector 7
Will Supply Decline further?
Will production cuts intensify to down 10% for 2012? If they did, then we would view this as signficantly bullish, as it would put the U.S. market into deficit. However, while some additional thermal cuts from higher cost private producers are possible, we believe significantly larger cuts are unlikely, given the almost fully contracted positions of the thermal coal producers with the utilities (90-100% on average). Additionally, the resilience in U.S. exports so far this year, as well as the recent pickup in met coal pricing globally (spot met coal prices to China recently indicated at $214/tonne vs. $210/tonne last week) suggest that met coal demand may be starting to rebound, which could bring back some of the hot idled met coal production (estimated at 6-7m tons) on line.
Demand Unlikely to Rebound Near-term
While we acknowledge that ~66m tons of annualized production cuts is significant, we saw higher levels of production cuts in 2009, at 97 million tons. Additionally, there is no guarantee that this run rate will be maintained through the rest of the year, especially if met coal prices start to rally in 2H’12 as we are forecasting. Nonetheless, excluding met coal gains we believe thermal coal prices will remain under pressure, and as such expect modest surpluses through 2015. We are assuming coal demand to decline -7% in 2012, -1.3% in 2013, -2% in 2014 and -1.5% in 2015.
For 2012, we expect 60-80m tons of lower demand vs. 2011 from the combination of 1) additional coal to gas switching, which we estimate at roughly 30-40m tons vs. 2011, 2) lost demand from scheduled coal-fired power plant retirements, which for 2012 is roughly 10-20m tons, and 3) deferred tonnage by the utilities due to force majeure, renegotiated terms, or refusal of delivery to make up the difference.
Secular Demand Declines Unlikely to Reverse
Our CS Utilities team (Dan Eggers, Kevin Cole and team) expect the secular decline for coal demand from coal fired power plants to continue through 2025, as already announced coal-fired retirements and stricter EPA regulations continue to shift utiliities away from coal to alternative fuel sources. The team estimates that 38 GW of coal-fired plants are already slated to retirement, but expect additional announcements in the coming quarters to take the total to 60 GW of capacity to be shut in by 2025. This is likely to be somewhat offset by some 10 GW of announced coal plant additions (primarily to be completed by next year). As a result, we estimate the overall net thermal coal demand should be between 20 to 60m tons lower by 2016 (ie: 2 to 6% below 2011 levels), and 30 to 65m tons by 2025 (or close to 100m tons if the new coal plants do not end up being completed).
Exhibit 13: Estimated tons lost from Coal-fired plant Retirements (to 2016) 2011 2012 2013 2014 2015 2016 Total 2017-2025 Total
Announced Coal-fired GW lost (to 38 GW) 3.9 7.8 3.2 8.5 6.7 0.7 30.8 7.0 37.7Implied tons (milllions) 6.3 12.7 5.1 13.8 10.8 1.2 49.8 11.3 61.1
Additional Potential Lost Coal-fired GW 0.0 4.0 4.0 5.0 5.0 4.0 22.0 0.0 22.0Implied tons (milllions) 0.0 6.5 6.5 8.1 8.1 6.5 35.6 0.0 35.6
l Potential Lost Coal Demand (No New Plants) 6.3 19.1 11.6 21.9 18.9 7.6 85.5 11.3 96.8Announced Coal-fired GW Additions 0.0 0.0 6.0 1.7 1.7 0.0 9.4 1.2 10.6
Implied tons (milllions) 0.0 0.0 18.3 5.1 5.1 0.0 28.5 3.7 32.2Total Potential Lost Coal Demand (@ 38GW) 6.3 12.7 -13.2 8.7 5.7 1.2 21.3 7.6 28.9Total Potential Lost Coal Demand (@ 60GW) 6.3 19.1 -6.7 16.8 13.8 7.6 56.9 7.6 64.5
Source: CS Utilities team, our estimates
Exports: The Lone Bright Spot
As mentioned earlier, amid this weak domestic backdrop, we believe the one bright spot for coal demand will remain exports (both met and thermal), which we expect will rebound in the coming years due to our house view of continued global coal demand growth for both thermal and met coal over to 2015 (thermal demand to grow by 29% from 2011 to 2015, and met coal demand to grow by 29% from 2011 to 2015).

13 April 2012
US Coal Sector 8
Exhibit 14: Global Seaborne Thermal Coal Demand Exhibit 15: Global Seaborne Met Coal Demand
0.0
200.0
400.0
600.0
800.0
1000.0
1200.0
2011 2012e 2013e 2014e 2015e
0.0
50.0
100.0
150.0
200.0
250.0
300.0
350.0
400.0
2011 2012e 2013e 2014e 2015e
Source: Company data, our estimates Source: Company data, our estimates
As a result, while we are assuming a 3% reduction in U.S. net exports in 2012, we expect 6-14% annual growth in net exports from 2013 to 2015 to drive total exports to over 135m tons by 2015 (net exports to 123m tons).
Exhibit 16: Total US Coal Exports 1973-2015E
-
10,000
20,000
30,000
40,000
50,000
60,000
70,000
80,000
90,000
100,000
110,000
120,000
130,000
140,000
Source: EIA, our estimates
We believe U.S. port capacity will be able to keep pace, given the current expansions and announced capacity additions planned over the next 3 years.

13 April 2012
US Coal Sector 9
Exhibit 17: US Coal Export Terminal Capacity
Terminal Location Owner Capacity2 - 5 Year
ExpansionsEast CoastLamberts Point Pier XI Norfolk, VA N-S 30Pier IX Newport News, VA Kinder Morgan 12 3Dominion Terminal Associates Newport News, VA ANR, ACI, BTU 19CNX Marine Terminal Baltimore, Md CNX 14 14Chesapeake Bay Piers Maryland CSX 4Fairless Hills Pennsylvania Kinder Morgan 3Charleston, SC South Carolina State of South Carolina 3Subtotal 82 20
Gulf/MexicoIMT Myrtle Grove, La Kinder Morgan 6 6Convent Marine Terminal Convent, La Foresight Energy 5 3United Bulk Terminal Davant, LA United Marine Group 17McDuffie/State-owned Coal Terminals Mobile, AL State of Alabama 10 6Corpus Christi Corpus Christine, TX State of Texas 0 2Burnside Terminal Burnside, Missisippi Trafigura 0 10Port of Houston Houston, Tx Kinder Morgan 0 2Port of Lazaro, Mexico Cardenas, Mexico Terminales Portuarias del Pacifico 0 3Subtotal 38 32
West/BC**Gateway Pacific Terminal Bellingham, WA BTU and SSA Marine 24Oxbow Long Beach, CA Oxbow 2Seward Coal Terminal Seward, Alaska Alaska Railroad Corp 2Ridley Terminal Prince Rupert, BC, Canada Govt. of Canada 3 4Westshore Terminal Roberts Bank, BC, Canada Westshore 6Subtotal 12 28
Total 131 79 Source: Company data, our estimates
Are Low Prices Sustainable? Given our expectation of significant production cuts narrowing the surplus, the question is will a tighter market will result in a better negotiating position for the coal producers, resulting in higher coal prices in 2013? In our view, the short answer is no.
We see 3 signficant issues which will keep coal prices from moving higher for the next 12 months (and one of them is not low natural gas prices): 1) inventories which we expect will remain well above normal, above levels of producer pricing power until the end of 2013, 2) significant unpriced coal tonnage for 2013 and 3) marginal costs which are essentially at current CS price assumptions (ie: below the forward curve).

13 April 2012
US Coal Sector 10
1) Coal Inventories Unlikely to Destock to Pricing Power Levels
Exhibit 18: Historical Avg. Coal Inventories at the Utilities (with 2012-2013E)
148 146
182
126127
138142
140
131125 125
130 132 130126
125
132
142138
134136
142147
142
171166
172
182 183
174
159
150154
166
176 175
191
201
212 213207
194
179175 177
182 181
90
100
110
120
130
140
150
160
170
180
190
200
210
220
230
240Ja
n
Feb
Mar
Apr
May Jun
Jul
Aug Se
p
Oct
Nov
Dec
(in m
illio
n to
ns)
1990-2002 average 2003-2010 average 2010-2011 average 2012 Forecast 2013 Forecast
2012 Forecasts
Source: Company data, our estimates
Due to the combined negative impacts of 1) a milder than normal winter and 2) as a function, weak natural gas prices, we ended January with coal inventories were at 182m tons, or 32% above normal inventory levels over the past 10 years. With the end of winter remaining abnormally mild (~5% above normal temps for Q1’12), we expect coal inventories continued to build to 200m tons by March, nearing the record high of 204m tons seen in Nov. 2009.
Based on our supply/demand expectations, we believe inventories will reach maximium capacity levels at the utilities by April/May (roughly 210-215m tons), before declining through the back half of the summer to more reasonable levels during the Fall shoulder season. However at 175m tons inventories would still be 20-25% above normal levels, with pricing power not seen until inventories dropped to ~130-140m tons, or 50-60 days of supply (vs. current at 76 days). Thus, even if we only look at inventories alone as a proxy for pricing power, we do not expect prices to materially improve until at least 2013. This brings us to the second problem, which is the significant level of unpriced tonnage still open for 2013.
2) 2013 Unpriced Thermal Tons Will Keep a Ceiling on Price
Exhibit 19: US Coal Companies – 2012/2013 Volume Percentage Priced and Committed
Thermal Met Total Thermal Met Total Thermal Met Total Thermal Met TotalArch Coal 89% 54% 86% 47% 0% 43% 122 5 127 63 - 63 Consol Energy 100% 45% 93% 49% 3% 41% 48 4 52 24 0 24 Alpha Natural Resources 100% 53% 92% 50% 2% 39% 89 11 101 43 0 43 Peabody Energy (US only) 100% 21% 95% 50% 0% 46% 195 3 198 96 - 96 Cloud Peak 93% na 93% 62% na 62% 89 na 89 58 na 58
Percentage Priced Tons Committed (Estimated)2012 2013 2012 2013
Source: Company data, our estimates *Based on CS volume assumptions for 2012 and 2013

13 April 2012
US Coal Sector 11
As Exhibit 19 shows, the U.S. coal producers have signficant tonnage still left unpriced for 2013, ranging from an average 50-53% unpriced for each (with the exception of CLD at 38% priced). We believe that this will also play a factor in the negotiated prices that coal producers will be able to lock in with utilities, as the advantage is clearly in the hands of the buyers.
3) Marginal Costs: A Floor or a Ceiling?
The third factor which we expect will limit the upside in thermal coal prices is the theoretical concept of marginal cost acting as a floor for pricing over time. While this would normally be supportive of the fact that prices are nearing a floor, given the ample supplies of coal both from an inventory perspective and a potential supply response perspective, we see little reason to expect a scenario other than negotiated prices ending up at that level of marginal costs, and not where the forward curve is currently suggesting.
Exhibit 20: PRB Coal Production by Company Type Exhibit 21: Appalachian (Capp and Napp) Coal Production
by Company Type
86.6%
13.4%
% Public% Private
65%
35%
% Public
% Private
Source: Company data, our estimates Source: Company data, our estimates
In Exhibits 22 and 23, we attempt to estimate the level of marginal cost of production in 2 basins represented by public companies: 1) the PRB, whose production basis is 87% represented by the public coal companies, and 2) Appalachia (CAPP and NAPP), which is comprised of the 65% of public coal producers that report.
Exhibit 22: PRB Marginal Costs and Prices Exhibit 23: CAPP/NAPP Marginal Costs and Prices
$11.48
$8.40
$11.25
$13.75
$-
$2
$4
$6
$8
$10
$12
$14
$16
$18
$20
PRB
2012 Cash Cost Est. Current Spot 2013 Forward Price 2014 Forward Price
$60.19 $58.50
$68.75
$75.90
$30
$40
$50
$60
$70
$80
$90
CAPP/NAPP
2012 Cash Cost Est. Current Spot 2013 Forward Price 2014 Forward Price
Source: Company data, our estimates. Based on cash cost data for
ACI, ANR, BTU and CLD
Source: Company data, our estimates. Based on cash cost data for
ACI, ANR, CNX, JRCC, RNO, ALRP
Exhibits 22 and 23 show our estimates for the current cash cost for all of the public companies with available disclosure. We conclude that at current PRB spot prices (which

13 April 2012
US Coal Sector 12
in our view is illiquid and not representative of meaningful transactions), even the largest producers (BTU, ACI, CLD are actually operating below marginal cash cost. This would suggest that the 2013 forward curve price would be representative of the likely negotiated price level for 2013 commitments.
However in Appalachia, we estimate that the average cash cost for the 65% of production represented by public companies is roughly $60/ton, which is 20% below the current 2013 forward curve price of almost $70/ton. Again, given the signficant excess inventory levels, relatively weak natural gas prices (ie: still uneconomic to burn CAPP coal at $3.60/mcf) and significant unpriced positions, we believe that utilities will likely take advantage of the situation and pay just enough to keep the coal producers afloat, but nothing more. Thus, in this situation the high cost, private producers will likely be under pressure to survive as we believe the top quartile of coal producers would be operating at cash costs in excess of $65/ton, which could result in further production cuts due to bankruptcies if prices remain at depressed levels. Either way, we do not see significant upside in 2013 price settlements relative to marginal cost.
Earnings Implications/Scenario Analysis One question we expect to get is the question of whether all this negative sentiment is already priced in. To answer this, and taking the previous analysis on marginal costs a step further, we thought it would be useful to look at earnings scenarios for 3 different scenarios: 1) current CS estimate, 2) marginal cost price, and 3) forward curve prices.
Exhibit 24: CS Scenario Analysis – Pricing Assumptions
Price Assumptions Marginal Cost Current Est. Forward Curve Marginal Cost Current Est. Forward CurveNAPP/CAPP $60.00 $60.00 $69.75 $60.00 $65.00 $77.00PRB (8800) $11.50 $12.00 $11.40 $11.50 $13.00 $14.00Western Bit $32.25 $35.00 $37.00 $32.25 $40.00 $44.00Illinois Basin $32.50 $42.00 $45.00 $32.50 $45.00 $48.00
2013 2014
Source: Company data, our estimates
Exhibit 24 has our price assumptions for the analysis. For simplicity and given our more positive view on met coal, in each of these scenarios we are keeping our met coal price forecasts constant at the CS benchmark assumption of $239/tonne in 2013 and $235/tonne in 2014.
Exhibit 25: 2013 EPS Scenario Analysis Exhibit 26: 2014 EPS Scenario Analysis
$(3.00)
$(2.00)
$(1.00)
$-
$1.00
$2.00
$3.00
$4.00
$5.00
$6.00
BTU CLD CNX ACI ANR
Marginal Cost Current Estimates Forward Curve
$(3.00)
$(2.00)
$(1.00)
$-
$1.00
$2.00
$3.00
$4.00
$5.00
$6.00
BTU CLD CNX ACI ANR
Marginal Cost Current Estimates Forward Curve
Source: Company data, our estimates Source: Company data, our estimates

13 April 2012
US Coal Sector 13
Exhibit 27: 2013 EBITDA Scenario Analysis Exhibit 28: 2014 EBITDA Scenario Analysis
$-
$500
$1,000
$1,500
$2,000
$2,500
$3,000
$3,500
$4,000
BTU CLD CNX ACI ANR
Marginal Cost Current Estimates Forward Curve
$-
$500
$1,000
$1,500
$2,000
$2,500
$3,000
$3,500
$4,000
BTU CLD CNX ACI ANR
Marginal Cost Current Estimates Forward Curve
Source: Company data, our estimates Source: Company data, our estimates
Exhibit 29: CS Scenario Analysis – Multiples 2013/2014
Marginal Cost
Current Est.
Forward Curve
Marginal Cost
Current Est.
Forward Curve
Marginal Cost
Current Est.
Forward Curve
Marginal Cost
Current Est.
Forward Curve
BTU 8.3 6.3 6.1 5.4 4.6 4.5 10.1 5.3 4.9 5.9 4.1 3.9CLD 12.6 9.1 9.9 4.6 3.8 3.9 n/a 10.2 8.4 14.4 4.0 3.5CNX 17.0 15.7 11.7 7.1 6.9 5.9 15.0 12.6 8.9 6.4 5.9 4.9ACI n/a 11.9 20.1 10.3 6.1 6.1 n/a 10.0 5.5 9.3 5.7 4.6ANR n/a n/a 21.8 7.1 5.1 4.3 n/a 131.5 12.2 11.0 4.7 3.7Avg. 12.6 10.7 13.9 6.9 5.3 4.9 12.6 33.9 8.0 9.4 4.9 4.1
EV/EBITDA2013 2014
P/E EV/EBITDA P/E
Source: Company data, our estimates
Historical Valuation
Finally, we look at historical multiples, and conclude that even in our conservative price forecast assumptions (ie: CS Base case), each of the companies (with the exception of CLD and BTU) look fairly priced. If prices drop to marginal cost in 2013, then each of the coal companies under coverage look expensive on a multiples basis relative to historicals and current. Only when assuming the forward curve prices do the stocks look cheap relative to historical EV/EBITDA multiples of 5.0 to 7.0x 1 year forward (Exhibit 30).
Exhibit 30: Historical 1 year forward multiples vs scenario analysis multiples
Share Price
Historical Multiple
Marginal Cost
CS Estimate
Forward Curve
TP Multiple
Historical Multiple
Marginal Cost
CS Estimate
Forward Curve
TP Multiple
BTU 29.34$ 18.1 8.9 6.8 6.6 10.2 6.8 5.6 4.8 4.7 6.2CLD 15.41$ 8.9 12.9 9.3 10.2 10.2 4.2 4.7 3.8 4.0 4.2CNX 34.75$ 18.3 17.5 16.1 12.0 18.6 8.0 7.3 7.0 6.0 7.8ACI 10.63$ 16.1 n/a 12.8 21.6 14.4 7.3 10.6 6.2 6.3 6.5ANR 16.08$ 22.5 n/a n/a 23.9 n/a 6.0 7.5 5.4 4.5 5.8Avg. 16.8 13.1 11.3 14.8 13.4 6.5 7.1 5.5 5.1 6.1
EV/EBITDAP/E2013
Source: Company data, our estimates

13 April 2012
US Coal Sector 14
Americas / United StatesDiversified Metals & Mining
CONSOL Energy Inc. (CNX)
A Tale of Two (Weak) Markets ■ Downgrading to Neutral: We are downgrading CNX from Outperform to Neutral,
and lowering our target price from $45 to $40. While the shares have outperformed its coal peers by ~12% YTD, we believe 1) weaker near-term natural gas prices, 2) the ongoing idling at Buchanan and 3) 2012/2013 earnings guidance risk suggest the shares are likely rangebound near-term.
■ EPS and TP Revisions: We are lowering our 2012 estimate from $2.00 to $1.80, our 2013 estimate from $3.43 to $2.15, and our 2014 estimate from $4.47 to $2.68 to reflect the revised natural gas and coal price forecasts. We are lowering our target price from $45 to $40, which reflects 7.8x our 2013 and 6.7x our 2014 EBITDA estimate.
Reasons for the Neutral Rating:
■ 1) Lower Natural Gas Prices For a While: As our Commodities Team details in their note, the outlook for natural gas prices remains weak for the foreseeable future. The CS Global Commodities Research team revised its 2012 natural gas price forecast from $3.50/Mcf to $2.64/Mcf, its 2013 estimate from $4.70/Mcf to $3.70/Mcf and Lterm from $5.50/Mcf to $4.50/Mcf.
■ 2) Near-term Earnings Risk: We believe the street is too optimistic on results, given our view on near-term coal and nat gas fundamentals, higher costs from the Buchanan idling and the risk of further reductions to natural gas drilling schedules. As a result, we think it is unlikely the stock will outperform its peers near-term (especially its met coal peers), given the recent strength in met coal, and a nat gas environment which remains challenging.
■ 3) Multiemployer Pension Could Pose a Greater Risk than Perceived: Given our bearish view on coal fundamentals, we believe the multiemployer pension issue could result in CNX potentially getting stuck with a greater portion than it is currently responsible for, and is an issue with other peers do not have to deal with. Increase in Contributions: Additionally, we expect modest cost increases related to the coal pension trust could come as soon as Q3.
Share price performance
3136414651
Apr-11 Jul-11 Oct-11 Jan-12
Daily Apr 14, 2011 - Apr 12, 2012, 4/14/11 = US$50.28
Price Indexed S&P 500 INDEX
On 04/12/12 the S&P 500 INDEX closed at 1387.57
Quarterly EPS Q1 Q2 Q3 Q4 2011A 0.84 0.75 0.72 0.70 2012E 0.55 0.32 0.33 0.60 2013E 0.62 0.54 0.41 0.58
Financial and valuation metrics
Year 12/11A 12/12E 12/13E 12/14EEPS (CS adj.) (US$) 3.03 1.80 2.15 2.68Prev. EPS (US$) — 2.00 3.43 4.47P/E (x) 11.5 19.3 16.1 13.0P/E rel. (%) 79.1 144.5 136.2 121.9Revenue (US$ m) 5,896.7 4,758.3 5,274.5 5,784.5EBITDA (US$ m) 1,778.7 1,358.0 1,539.8 1,796.5OCFPS (US$) 6.00 4.24 4.90 5.82P/OCF (x) 6.1 8.2 7.1 6.0EV/EBITDA (current) 6.0 7.9 7.0 6.0Net debt (US$ m) 2,822 2,934 2,471 2,228ROIC (%) 14.29 8.79 9.77 11.40
Number of shares (m) 227.54 IC (current, US$ m) 6,433.26BV/share (Next Qtr., US$) 16.3 EV/IC (x) 1.6Net debt (Next Qtr., US$ m) 2,853.0 Dividend (Next Qtr., US$) 0.13Net debt/tot cap (Next Qtr., %) 76.9 Dividend yield (%) 0.36
Source: Company data, Credit Suisse estimates.
*Stock ratings are relative to the relevant country benchmark. ¹Target price is for 12 months.
Research Analysts
Richard Garchitorena, CFA 212 325 5809
Sean Wright, CPA 212 538 3284
Rating (from Outperform) NEUTRAL* Price (12 Apr 12, US$) 34.75 Target price (US$) (from 45.00) 40.00¹ 52-week price range 54.82 - 31.70 Market cap. (US$ m) 7,907.05 Enterprise value (US$ m) 10,840.85

13 April 2012
US Coal Sector 15
Investment Thesis Reasons for the Neutral
(1) Most Exposed to Weak Natural Gas: As our Commodities Team details in their note (Click here for note), the outlook for natural gas prices remains weak for the foreseeable future. With CNX’s rising exposure to natural gas production (from 150Bcf in 2011 to 350Bcf by 2015), and our cautious view on prices, we do not see a near-term catalyst the shares other than a hotter than normal summer. We also believe that the company’s 2015 production target of 350 bcf is also at risk, with the potential of a slower rig count acceleration as not priced into the shares.
Exhibit 31: Credit Suisse NYMEX Henry Hub price forecasts
2011 Q1 Q2 Q3 Q4 Yr Avg Q1 Q2 Q3 Q4 Yr Avg Q1 Q2 Q3 Q4 Yr Avg LTForecast 4.04 2.77 2.20 2.50 3.10 2.64 3.60 3.40 3.80 4.00 3.70 4.40 4.20 4.20 4.35 4.29 4.50Previous 4.04 3.20 3.30 3.60 3.90 3.50 4.60 4.50 4.80 4.90 4.70 5.10 5.50Net Change -0.43 -1.10 -1.10 -0.80 -0.86 -1.00 -1.10 -1.00 -0.90 -1.00 -0.81 -1.00% Change -13.4% -33.3% -30.6% -20.5% -24.6% -21.7% -24.4% -20.8% -18.4% -21.3% -15.9% -18.2%
Consensus 3.24 3.30 3.73 3.33 4.50 4.00 3.80 4.50Net Change -1.04 -0.80 -0.63 -0.69 -0.90 -0.60 -0.10 -0.21% Change -32.1% -24.2% -16.9% -20.7% -20.0% -15.0% -2.6% -4.7%
Fwd Curve 2.19 2.45 2.85 2.57 3.57 3.37 3.5 3.69 3.53 4.10 3.85 3.92 4.09 3.99Net Change 0.01 0.05 0.25 0.07 0.03 0.03 0.30 0.31 0.17 0.30% Change 0.5% 2.0% 8.8% 2.7% 0.8% 0.9% 8.6% 8.4% 4.8% 7.5%
2012 2013 2014
Source: Bloomberg, our estimates
(2) Near-term Earnings Risk: We believe the street is too optimistic on results, given our bearish view on near-term coal and nat gas fundamentals, higher costs from the Buchanan idling and the risk of further reductions to natural gas drilling schedules. The shares of CNX have outperformed its peers by ~12% YTD, and ~12% since the beginning of March. Finally on a valuation basis, CNX is trading at 7.0x our 2013 EBITDA estimate, or a ~27% premium vs. its peers. As a result, we believe the stock is priced for perfection, and if we are right about the direction of natural gas prices over the next couple of months, we think the stock’s relative Outperformance vs. its coal peers will narrow. We look to the company’s next production report, due mid-April as a potential catalyst.
(3) Multiemployer Pension Could Pose a Greater Risk than Perceived:
■ Concentration Risk: As we highlighted in our March 26 report “Multiemployer Pensions, Add Coal to the Pile”, we would highlight the significant concentration risk within the coal industry, with CNX, ANR, Patriot Coal (PCX, NOT RATED) as some of the primary contributors to the 1974 Pension Trust. This concentration increases the interdependence of these companies to remain solvent and contributors to the plan. Given our bearish view on coal fundamentals, any financial concerns from one of the big contributors could result in a “house of cards scenario”, with CNX potentially getting stuck with a greater portion than it is currently responsible for.
■ Potential Increase in Contributions: Additionally, we expect modest cost increases related to the coal pension trust could come as soon as Q3, as the 1974 Pension trust requires a funding improvement plan to be put in place by May 25, 2012. Additionally, the 1974 Pension Trust, is already considered “seriously endangered” (ie: 65-80% funded), with fair market values

13 April 2012
US Coal Sector 16
Exhibit 32: Estimated Share of Multiemployer Pension Plan Underfunding More than 5% of
Market Cap1 US$ in millions
Company Ticker
Multiemployer Pension
Contribution 2011
Estimated Share of
Multiemployer Underfunding
After-Tax Multiemployer
Underfunding / Market Cap Safeway Inc SWY $263 $(6,954) (76.1%)
Dean Foods Co DF 30 (721) (21.2%)
United Parcel Service Inc B UPS 1,243 (21,505) (18.6%)
Quanta Services Inc PWR 47 (1,042) (14.8%)
CONSOL Energy Inc CNX 36 (1,186) (10.0%)
United States Steel Corp X 63 (576) (8.7%)
Alpha Natural Resources ANR 15 (388) (6.6%)
Patriot Coal PCX 24 (847) (95%) 1Market cap as of March 16, 2012
Note: We did not include multiemployer OPEB and foreign multiemployer pension plans in our analysis.
Source: CS Accounting & Tax Team, Company data, Form 5500 filings, Credit Suisse estimates
(4) HOLT Valuation suggest a Neutral Rating: CFROI® is an approximation of the economic return, or an estimate of the average real internal rate of return earned by a firm on the portfolio of projects that constitute its operating assets. In the exhibit below, we look at the HOLT™ methodology to get a sense of whether a firm is creating economic wealth. Economic wealth is created if CFROI is greater than the discount rate (which is a measure of a firm’s real cost of capital).
Using Credit Suisse’s Holt Framework, Consol Energy appears fully valued at current levels, with a warranted price of $35.85 based on a forecast CFROI of 7.13%. We believe this assumption is fair, given the current uncertainty around the long-term natural gas price, and the level at which coal prices will find a bottom relative to historical levels (average CFROI for most recent 5 years was 6.9%).
Exhibit 33: CNX HOLT Relative Wealth Chart
Source: Credit Suisse HOLT, Credit Suisse estimates
Based on consensus estimates, HOLT assumes a warranted price of $35.85 for CNX, based on a forecast CFROI of 7.13%. We feel this assumption is fair, given the company’s historical 5 year CFROI of 6.9%.

13 April 2012
US Coal Sector 17
(5) Target Price Reflects Historical Multiples: Assuming our $40 target price, CNX would be at 7.8x 2013 EBITDA, which is only a 3% discount to its historical EV/EBITDA multiple of 8.0x. As such, we believe upside is limited assuming historical multiples.
(6) Valuation: CNX is currently trading at 7.9x and 7.0x our 2012/13 EBITDA estimates, respectively. We are lowering our target price from $45 to $40, which reflects 7.8 our 2013 EBITDA estimate of $1.5b.
■ Where we Could be Wrong? 1) Nat gas prices start rising aggressively, 2) announcement of Buchanan restart sooner than expected, 3) positive Marcellus/Utica well results, potentially in next week’s production report (estimated).
Tables Exhibit 34: Operating Summary
Q1'11 Q4'11 Q1'12E Q1'11 Q4'11 2011 2012E % Chg. 2013E % Chg. 2014E % Chg.Coal SegmentProduction (million tons) 17.2 15.3 15.1 -12.2% -1.3% 62.6 56.6 -9.6% 58.2 2.8% 59.5 2.2%Sales (million tons) 16.7 15.3 14.6 -12.6% -4.6% 63.3 56.2 -11.2% 58.2 3.5% 59.5 2.2%Realized Price (US$/ton) $68.14 $71.92 $72.35 6.2% 0.6% $72.52 $71.03 -2.1% $73.96 4.1% $75.37 1.9%Operating Cost (US$/ton) $46.41 $54.72 $53.51 15.3% -2.2% $52.25 $53.73 2.8% $56.48 5.1% $58.32 3.2%Margins (US$/ton) $21.73 $17.20 $18.84 -13.3% 9.5% $20.27 $17.30 -14.6% $17.47 1.0% $17.05 -2.4%
Gas SegmentProduction (bcf) 35.9 39.7 37.1 3.3% -6.6% 153.5 159.9 4.2% 199.8 24.9% 252.0 26.1%Realized Price (US$/Mcf) $4.93 $4.68 $3.93 -20.3% -16.0% $4.90 $3.87 -21.1% $4.04 4.6% $4.46 10.4%Operating Cost (US$/Mcf) $3.77 $3.86 $3.91 3.7% 1.3% $3.86 $3.91 1.4% $3.75 -4.1% $3.55 -5.3%
Total Cap. Ex. ($ '000) $254,778 $384,908 $400,000 57.0% 3.9% $1,382,371 $1,500,000 8.5% $1,200,000 -20.0% $1,350,000 12.5%
Q1'12 vs.
Source: Company data, our estimates
Exhibit 35: Income Statement
Q1'11 Q4'11 Q1'12E Q1'11 Q4'11 2011 2012E % Chg. 2013E % Chg. 2014E % Chg.Sales - Outside 1,385,478 1,367,646 1,202,033 -13.2% -12.1% 5,660,813 4,610,976 -18.5% 5,111,944 10.9% 5,607,050 9.7%Sales - Related Parties 0 0 0 n.m. n.m. 0 0 n.m. 0 n.m. 0 n.m.Freight-Outside 36,868 75,225 36,061 -2.2% -52.1% 231,536 138,329 -40.3% 153,358 10.9% 168,211 9.7%Freight-Related Parties 0 0 0 n.m. n.m. 0 0 n.m. 0 n.m. 0 n.m.Purchased gas sales 980 1,047 2,250 n.m. n.m. 4,344 9,000 107.2% 9,200 2.2% 9,200 0.0%Other income 23,216 83,552 28,000 20.6% -66.5% 153,620 112,000 -27.1% 112,000 0.0% 112,000 0.0%Total Revenue 1,465,377 1,542,208 1,284,594 -12.3% -16.7% 6,117,242 4,935,306 -19.3% 5,450,503 10.4% 5,960,461 9.4% Gross Margin 41% 36% 38% -7.9% 6.8% 38% 37% -4.2% 37% 0.3% 38% 4.1%Cost of goods Sold 813,709 880,813 745,154 -8.4% -15.4% 3,501,189 2,925,467 -16.4% 3,238,366 10.7% 3,467,926 7.1%Freight Expense 36,679 75,225 36,061 -1.7% -52.1% 231,347 138,329 -40.2% 153,358 10.9% 168,211 9.7%Purchased gas costs 676 981 1,000 n.m. n.m. 3,831 4,000 4.4% 4,000 0.0% 4,000 0.0%SG&A 40,196 45,265 42,071 4.7% -7.1% 175,576 161,384 -8.1% 168,694 4.5% 173,819 3.0%DD&A 149,062 151,785 139,028 -6.7% -8.4% 618,397 558,656 -9.7% 629,440 12.7% 721,294 14.6%Interest expense 66,482 58,381 58,542 -11.9% 0.3% 248,344 234,168 -5.7% 234,168 0.0% 234,168 0.0%Taxes other than income 90,689 79,339 77,076 -15.0% -2.9% 344,460 296,118 -14.0% 294,327 -0.6% 298,023 1.3%non-recurring items 0 0 0 n.m. n.m. 146,814 0 n.m. 0 n.m. 0 n.m.Total costs 1,197,493 1,291,789 1,098,931 -8.2% -14.9% 5,269,958 4,318,122 -18.1% 4,722,353 9.4% 5,067,441 7.3%(EBT) 251,077 237,670 172,663 n.m. n.m. 787,953 565,184 -28.3% 676,150 19.6% 841,020 24.4%Income taxes 58,928 42,035 46,619 n.m. n.m. 155,456 152,600 -1.8% 182,560 19.6% 227,075 24.4%Minority Interest 0 0 0 n.m. n.m. 0 0 n/a 0 n/a 0 n/aNet Income (loss) 192,149 195,635 126,044 n.m. n.m. 632,497 412,584 -34.8% 493,589 19.6% 613,945 24.4%Reported EPS $0.84 $0.85 $0.55 n.m. -35.6% $2.76 $1.80 -34.8% $2.15 19.6% $2.68 24.4%Non-Recurring Items $0.00 $0.15 $0.00 n.m. n.m. -$0.27 $0.00 n.m. $0.00 n.m. $0.00 n.m.Operating EPS $0.84 $0.70 $0.55 n.m. n.m. $3.03 $1.80 -40.6% $2.15 19.6% $2.68 24.4%Avg. Shares Out. 228,815 229,314 229,314 0.2% 0.0% 229,108 229,314 0.1% 229,314 0.0% 229,314 0.0%Tax Rate 23.5% 17.7% 27.0% n.m. n.m. 19.7% 27.0% 36.9% 27.0% 0.0% 27.0% 0.0%EBIT 317,559 296,051 231,205 n.m. n.m. 1,036,297 799,351 -22.9% 910,317 13.9% 1,075,188 18.1%EBITDA 466,621 398,836 370,233 n.m. -7.2% 1,778,694 1,358,007 -23.7% 1,539,757 13.4% 1,796,482 16.7%
Q1'12 vs.
Source: Company data, our estimates

13 April 2012
US Coal Sector 18
Americas / United StatesDiversified Metals & Mining
Cloud Peak Energy (CLD)
No Signs of a Catalyst ■ We are downgrading the shares from Outperform to Neutral with a $17
target price. While we believe CLD is relatively better positioned than its coal producer peers to withstand the weak current thermal coal environment (given its high contracted position for 2012 and 2013), we see a lack of near-term catalysts as the primary reason for the Neutral rating.
■ EPS and TP Revisions: We are lowering our 2013 est from $1.98 to $1.66 and our 2014 estimate from $1.89 to $1.48. We are lowering our target price from $20 to $17, representing 4.2x our 2013 and 4.4x our 2014 EBITDA estimates.
■ What Gets us More Positive? 1) Nat gas prices above $4/mmbtu, 2) PRB production cuts, 3) Increasing Export Terminal Capacity, 4) CSAPR ruling.
Reasons for the Neutral Rating:
■ 1) Weak Thermal Coal Outlook: While CLD is relatively protected to weaker pricing (CLD is 100% sold in ’12, ~61% sold in ‘13), given the signficant rise in inventories and prolonged period of excess inventories/low natural gas prices expected, we believe prices will remain depressed through at least 2013.
■ 2) Limited Growth Profile: Relative to the other coal producers, CLD does not have significant growth in the pipeline at this time, and is unlikely to do so given its signficant lease/cash flow commitments.
■ 3) Limited Seaborne Export/Met Exposure: While CLD expects to export roughly 4.5m tons in 2012, its exposure to the stronger seaborne export markets is limited compared to its peers due to the lack of terminal infrastructure and rail on the west coast. This lack of export opportunities limits CLD’s ability to sell tons away from the weak US market. Additionally, given our more optimistic view on met coal prices (due to our positive view of steel production 2H’12), we prefer more met exposed names on a relative basis.
5) HOLT Valuation supports a Neutral Rating: Using Credit Suisse’s Holt Framework, CLD appears fully valued at current levels, with a warranted price of $15.59 based on a forecast CFROI of 4.26%.
Share price performance
14
19
24
Apr-11 Jul-11 Oct-11 Jan-12
Daily Apr 14, 2011 - Apr 12, 2012, 4/14/11 = US$20.64
Price Indexed S&P 500 INDEX
On 04/12/12 the S&P 500 INDEX closed at 1387.57
Quarterly EPS Q1 Q2 Q3 Q4 2011A 0.44 0.55 0.61 0.70 2012E 0.46 0.47 0.49 0.47 2013E 0.40 0.42 0.43 0.42
Financial and valuation metrics
Year 12/11A 12/12E 12/13E 12/14EEPS (CS adj.) (US$) 2.30 1.90 1.66 1.48Prev. EPS (US$) — — 1.98 1.89P/E (x) 6.7 8.1 9.3 10.4P/E rel. (%) 46.2 60.8 78.4 98.0Revenue (US$ m) 1,553.7 1,552.8 1,461.7 1,478.5EBITDA (US$ m) 351.8 320.3 293.1 278.9OCFPS (US$) 4.92 3.78 3.49 3.36P/OCF (x) 3.9 4.1 4.4 4.6EV/EBITDA (current) 3.5 3.8 4.2 4.4Net debt (US$ m) 294 276 278 288ROIC (%) 25.21 12.19 9.93 8.30
Number of shares (m) 60.92 IC (current, US$ m) 1,044.42BV/share (Next Qtr., US$) 13.0 EV/IC (x) 1.2Net debt (Next Qtr., US$ m) 291.2 Dividend (Next Qtr., US$) —Net debt/tot cap (Next Qtr., %) 37.4 Dividend yield (%) —
Source: Company data, Credit Suisse estimates.
*Stock ratings are relative to the relevant country benchmark. ¹Target price is for 12 months.
Research Analysts
Richard Garchitorena, CFA 212 325 5809
Sean Wright, CPA 212 538 3284
Rating (from Outperform) NEUTRAL* Price (12 Apr 12, US$) 15.41 Target price (US$) (from 20.00) 17.00¹ 52-week price range 24.02 - 14.93 Market cap. (US$ m) 938.81 Enterprise value (US$ m) 1,214.43

13 April 2012
US Coal Sector 19
Investment Thesis
Cloud Peak (CLD, NEUTRAL, TP $17) Reasons for the Neutral:
(7) Weak Thermal Coal Outlook: While CLD is relatively protected to weaker pricing (CLD is 100% priced and committed for 2012, ~61% priced and committed for 2013), given the signficant rise in inventories and limited production cutbacks so far, the combination of low nat gas prices and regulatory headwinds will likely keep prices at depressed levels through at least 2013. Even then, we do not expect meaningful improvement in PRB prices until new export terminal capacity gets built in the West, which is unlikely until 2015-2016 at the earliest.
(8) Limited Free Cash Flow Upside: Due to CLD’s significant leaseback agreement payments over the next 4 years (we estimate ~$391m from 2012 to 2015), CLD has virtually no positive free cash flow. Additionally, with 2013 and 2014 prices unlikely to recover to previous highs near-term, and minimal organic growth prospects, we do not see this issue improving until pricing improves.
Exhibit 36: CS Scenario Analysis – FCF Yields 2013/2014
Marginal Cost
Current Est.
Forward Curve
Marginal Cost
Current Est.
Forward Curve
Marginal Cost
Current Est.
Forward Curve
Marginal Cost
Current Est.
Forward Curve
BTU 680.6 849.2 962.8 945.0 1,301.3 1,485.6 9.2% 11.5% 13.0% 12.8% 17.6% 20.1%CLD (21.7) (2.2) (7.3) (125.2) (10.2) 10.1 -2.4% -0.2% -0.8% -13.8% -1.1% 1.1%CNX 60.9 (163.8) (1.9) 215.5 (17.6) 154.2 0.8% -2.1% 0.0% 2.8% -0.2% 2.0%ACI (147.6) (27.9) (40.3) (27.3) 8.8 224.3 -7.0% -1.3% -1.9% -1.3% 0.4% 10.6%ANR 388.7 211.7 452.7 97.4 306.2 578.8 12.4% 6.8% 14.5% 3.1% 9.8% 18.5%Avg 2.6% 2.9% 4.9% 0.7% 5.3% 10.5%
20132013 2014Free Cash Flow YieldFree Cash Flow
2014
Source: Company data, our estimates
(9) Limited Growth Profile: Relative to the other coal producers, CLD does not have significant growth plans in the pipeline at this time due to its commitment to increase its reserve life through reserve bids (a positive), as well its focus on the PRB region. We prefer Peabody Energy for its strong pipeline of Australian growth, with 30-40% production growth by 2016.
(10) Limited Seaborne Export/Met Exposure: While CLD expects to export roughly 4.5m tons in 2012, its exposure to the stronger seaborne export markets is relatively limited compared to its peers due to lack of terminal infrastructure and rail on the west coast. The lack of export opportunities limits CLD’s ability to sell tons away from the weak US market. Additionally, given our more optimistic view on met coal prices (due to our positive view of steel production 2H’12), we prefer more met exposed names on a relative basis.
(11) HOLT Valuation suggest a Neutral Rating: CFROI® is an approximation of the economic return, or an estimate of the average real internal rate of return earned by a firm on the portfolio of projects that constitute its operating assets. In the exhibit below, we look at the HOLT™ methodology to get a sense of whether a firm is creating economic wealth. Economic wealth is created if CFROI is greater than the discount rate (which is a measure of a firm’s real cost of capital).
Using Credit Suisse’s Holt Framework, Cloud Peak appears fully valued at current levels, with a warranted price of $15.59 based on a forecast CFROI of 4.26%. We believe this assumption is fair, given the current uncertainty around the long-term natural gas price, and the level at which coal prices will find a bottom relative to historical levels (average historical CFROI is 8.8%).

13 April 2012
US Coal Sector 20
Exhibit 37: CLD HOLT Relative Wealth Chart
Source: Credit Suisse HOLT, Credit Suisse estimates
■ Valuation: CLD is currently trading at 3.8x and 4.0x our 2013/14 EBITDA estimates, respectively. We are lowering our target price from $20 to $17, which reflects 4.2x our 2013 EBITDA estimate.
■ What Gets us Positive? 1) Nat gas prices above $4/mmbtu, 2) PRB production cuts, 3) Increasing West Export Terminal Capacity, 4) favorable CSAPR ruling.
Based on consensus estimates, HOLT assumes a warranted price of $15.59 for CLD, based on a forecast CFROI of 4.26%. While the historical median CFROI is 8.8%, 2011 CFROI was 5.9%, and we believe future growth rates will continue to decline.

13 April 2012
US Coal Sector 21
Tables Exhibit 38: Operating Summary
Q1'11 Q4'11 Q1'12E Q1'11 Q4'11 2011 2012E % chg. 2013E % chg. 2014E % chg.
Sales Volumes (million tons)
Antelope 9.1 9.9 9.0 na -9.5% 37.1 36.0 -2.8% 35.3 -2.0% 35.6 1.0%
Cordero Rojo 10.2 10.1 9.3 na -7.6% 39.4 37.3 -5.2% 36.6 -2.0% 36.9 1.0%
Spring Creek 3.9 5.2 4.2 na -18.6% 19.2 19.0 -1.1% 18.6 -2.0% 18.8 1.0%
Decker 0.3 0.5 0.3 na -36.6% 1.6 1.6 3.2% 1.6 -2.0% 1.6 1.0%
Other 0.3 0.0 0.5 na na 0.8 2.0 157.1% 2.0 -2.0% 0.0 -100.0%
Total Sales 23.7 25.7 23.3 -1.7% -9.2% 98.0 95.9 -2.1% 94.0 -2.0% 94.9 1.0%
Estimated average sales price per ton $12.73 $13.06 $13.27 4.3% 1.6% $12.91 $13.27 2.8% $13.25 -0.1% $13.30 0.3%
Estimated average Cost per ton* $8.94 $9.15 $9.67 8.2% 5.7% $9.12 $9.67 6.0% $9.91 2.4% $10.17 2.6%
Cash operating margin (US$/ton) $3.79 $3.91 $3.60 -5.1% -8.0% $3.79 $3.60 -5.1% $3.34 -7.0% $3.13 -6.5%
% chg. versus
Source: Company data, our estimates
Exhibit 39: Income Statement
Q1'11 Q4'11 Q1'12E Q1'11 Q4'11 2011 2012E % chg. 2013E % chg. 2014E % chg.
Revenues 356,545 402,487 379,236 6.4% -5.8% 1,553,661 1,552,777 -0.1% 1,461,724 -5.9% 1,478,460 1.1%
Total Revenue 356,545 402,487 379,236 6.4% -5.8% 1,553,661 1,552,777 -0.1% 1,461,724 -5.9% 1,478,460 1.1%
Costs and Expenses:
Cost of product sold 261,181 295,566 288,410 10.4% -2.4% 1,151,117 1,179,761 2.5% 1,119,445 -5.1% 1,149,594 2.7%
D&D 25,115 28,590 24,465 -2.6% -14.4% 87,127 100,695 15.6% 96,801 -3.9% 98,719 2.0%
Amortization 0 0 0 n/m n/m 0 0 na 0 na 0 na
Accretion 3,340 3,049 2,796 -16.3% -8.3% 12,469 11,508 -7.7% 11,278 -2.0% 12,340 9.4%
Exploration Costs 0 0 0 n/m n/m 0 0 na 0 na 0 na
SG&A 13,027 13,575 13,463 3.3% -0.8% 52,480 55,124 5.0% 52,622 -4.5% 53,225 1.1%
Asset impairment 0 0 0 n/m n/m 0 0 na 0 na 0 na
Other 0 0 0 na na 0 0 na 0 na 0 na
Total Expenses 302,663 340,780 329,134 8.7% -3.4% 1,303,193 1,347,088 3.4% 1,280,146 -5.0% 1,313,877 2.6%
Income from Ops 53,882 61,707 50,102 -7.0% -18.8% 250,468 205,689 -17.9% 181,578 -11.7% 164,583 -9.4%
Interest Income 135 133 133 -1.5% 0.0% 592 532 -10.1% 532 0.0% 532 0.0%
Interest Expense (12,218) (6,346) (7,500) n/m n/m (33,866) (30,000) -11.4% (30,000) 0.0% (30,000) 0.0%
Other, net 162 2,140 0 n/m n/m (17,749) 0 -100.0% 0 #DIV/0! 0 #DIV/0!
Earnings before taxes 41,961 57,634 42,735 1.8% -25.9% 199,445 176,221 -11.6% 152,110 -13.7% 135,115 -11.2%
Income tax expense (15,293) (13,474) (15,384) 0.6% 14.2% (11,449) (63,440) 454.1% (54,759) -13.7% (48,641) -11.2%
Earnings of unconsol. Affil. 105 (341) 456 na na 1,801 2,432 na 3,408 na 3,219 na
MI, net of tax 0 0 0 na na 0 0 na 0 na 0 na
Net Income 26,773 43,819 27,806 n.m. n.m. 189,797 115,214 -39.3% 100,758 -12.5% 89,693 -11.0%
Earnings Per Share:
Reported Basic $0.45 $0.73 $0.46 3.8% -36.5% $3.16 $1.92 -39.3% $1.68 -12.5% $1.49 -11.0%
Reported Diluted $0.44 $0.72 $0.46 3.7% -36.5% $3.13 $1.90 -39.4% $1.66 -12.5% $1.48 -11.0%
$0.00 $0.02 $0.00 na na $0.83 $0.00 na $0.00 na $0.00 na
Operating - Basic $0.45 $0.71 $0.46 3.8% -34.8% $2.33 $1.92 -17.7% $1.68 -12.5% $1.49 -11.0%
Operating - Diluted $0.44 $0.70 $0.46 3.7% -34.7% $2.30 $1.90 -17.5% $1.66 -12.5% $1.48 -11.0%
Shares Outstanding
Basic 60,000 60,007 60,007 0.0% 0.0% 60,004 60,007 0.0% 60,007 0.0% 60,007 0.0%
Diluted 60,663 60,741 60,741 0.1% 0.0% 60,662 60,741 0.1% 60,741 0.0% 60,741 0.0%
EBIT 53,882 61,707 50,102 -7.0% -18.8% 250,468 205,689 -17.9% 181,578 -11.7% 164,583 -9.4%
EBITDA 82,604 92,945 77,819 -5.8% -16.3% 351,766 320,324 -8.9% 293,065 -8.5% 278,861 -4.8%
% chg. vs.
Source: Company data, our estimates

13 April 2012
US Coal Sector 22
Americas / United StatesDiversified Metals & Mining
Peabody Energy Corp (BTU)
The Pacific Basin Play ■ In conjunction with the Credit Suisse Global Metals & Mining team’s coal
price revisions, we are lowering our estimates and Target Price for Peabody Energy. We maintain our Outperform rating on the shares. BTU remains our top pick within the US coal space.
■ EPS and TP Revisions - We are lowering our 2012 estimate from $3.48 to $3.07, our 2013 estimate from $5.50 to $4.31 and our 2014 estimate from $6.33 to $5.17. We are lowering our target price from $48 to $44, which represents 6.2x and 5.5x our 2013 and 2014 EBITDA estimates.
Reasons for the Outperform:
■ 1) Attractive Australian Asset Base Provides Direct Exposure to the Most Attractive Markets – Global Thermal and Met: BTU remains the preferred global coal play, with the company’s Australian assets currently comprising 60% of EBITDA today, but approximately 75% of EBITDA by 2015. Additionally, the drivers of earnings in Australia remains China and India, which continue to build out coal-fired capacity, contrary to the continued secular decline in the U.S.
■ 2) Volume and Earnings Growth to 2015: We believe BTU’s significant growth profile in Australia remains underappreciated by investors that continue to focus on near-term headwinds. With 30-40% production growth targeted by 2015 not including the potential Macarthur Coal projects, we believe this earnings growth will be rewarded by investors as the company continues to execute.
■ 3) Option on PRB: In addition to the strong Pacific Basin story, BTU still has the largest reserve and production base in the PRB. We believe the PRB is the one basin in the United States that has the cost position, the product composition (low sulfur, low BTU content but cheap) and the regulatory conditions (CSAPR) to compete with natural gas over time.
Share price performance
27
47
67
Apr-11 Jul-11 Oct-11 Jan-12
Daily Apr 13, 2011 - Apr 12, 2012, 4/13/11 = US$65.18
Price Indexed S&P 500 INDEX
On 04/12/12 the S&P 500 INDEX closed at 1387.57
Quarterly EPS Q1 Q2 Q3 Q4 2011A 0.67 1.11 0.87 1.49 2012E 0.49 0.50 0.92 1.16 2013E 1.07 1.09 1.06 1.10
Financial and valuation metrics
Year 12/11A 12/12E 12/13E 12/14EEPS (CS adj.) (US$) 4.08 3.07 4.31 5.17Prev. EPS (US$) — 3.48 5.50 6.33P/E (x) 7.2 9.5 6.8 5.7P/E rel. (%) 49.6 71.5 57.5 53.3Revenue (US$ m) 8,042.4 9,035.4 9,820.8 10,786.4EBITDA (US$ m) 2,207.0 2,393.4 2,868.7 3,213.8OCFPS (US$) 5.71 5.76 7.17 8.13P/OCF (x) 5.8 5.1 4.1 3.6EV/EBITDA (current) 6.3 5.8 4.8 4.3Net debt (US$ m) 5,858 5,693 4,806 3,461ROIC (%) 14.95 10.32 12.86 14.70
Number of shares (m) 272.26 IC (current, US$ m) 11,374.20BV/share (Next Qtr., US$) 20.8 EV/IC (x) 1.2Net debt (Next Qtr., US$ m) 5,892.5 Dividend (Next Qtr., US$) 0.09Net debt/tot cap (Next Qtr., %) 104.7 Dividend yield (%) 0.29
Source: Company data, Credit Suisse estimates.
*Stock ratings are relative to the relevant country benchmark. ¹Target price is for 12 months. [V] = Stock considered volatile (see Disclosure Appendix).
Research Analysts
Richard Garchitorena, CFA 212 325 5809
Sean Wright, CPA 212 538 3284
Rating OUTPERFORM* [V] Price (12 Apr 12, US$) 29.34 Target price (US$) (from 48.00) 44.00¹ 52-week price range 66.82 - 27.30 Market cap. (US$ m) 7,987.97 Enterprise value (US$ m) 13,681.36

13 April 2012
US Coal Sector 23
Investment Thesis Reasons for the Outperform:
(12) Attractive Australian Asset Base Provides Direct Exposure to the Most Attractive Markets – Global Thermal and Met: BTU remains our preferred global coal play, with the company’s Australian assets currently comprising 60% of EBITDA today, but approximately 75% of EBITDA by 2015. Additionally, the drivers of earnings in Australia remain China and India which continue to build out coal-fired capacity, contrary to the continued secular decline in the U.S.
Exhibit 40: US & Australia EBITDA % of Total 2011 Exhibit 41: US & Australia EBITDA % of Total 2015E
50.0%
50.0%
US
Australia
34.6%
65.4%
US
Australia
Source: Company data, Credit Suisse estimates Source: Company data, Credit Suisse estimates
(13) Volume and Earnings Growth to 2015: We believe BTU’s significant growth profile in Australia remains underappreciated by investors that continue to focus on near-term headwinds. With 30-40% production growth targeted by 2015 not included the potential Macarthur Coal projects, we believe this earnings growth will be rewarded by investors as the company continues to execute.
Exhibit 42: Australian Segment EBITDA 2011-2015E Exhibit 43: Australian Coal Volumes 2011-2015E
0
500
1000
1500
2000
2500
3000
2011 2012 2013 2014 2015
Australia
0
5
10
15
20
25
30
35
40
45
50
2011 2012 2013 2014 2015
Australia
Source: Company data, Credit Suisse estimates Source: Company data, Credit Suisse estimates
(14) Free Option on PRB Story: In addition to the strong Pacific Basin story, BTU still has the largest reserve and production base in the PRB. We believe the PRB is the one basin in the United States that has the cost position and the product composition (low sulfur, low BTU content but cheap) to compete with natural gas over time.
(15) Holt Valuation Supports an Outperform Rating: CFROI® is an approximation of the economic return, or an estimate of the average real internal rate of return earned by a firm on the portfolio of projects that constitute its operating assets. In the exhibit below, we look at the HOLT™ methodology to get a sense of whether a firm is creating economic wealth. Economic wealth is created if CFROI is greater than the discount rate (which is a measure of a firm’s real cost of capital).

13 April 2012
US Coal Sector 24
Using Credit Suisse’s Holt Framework, Peabody Energy appears attractive at current levels, with a warranted price of $34.04 based on a forecast CFROI of 7.72%. We believe this assumption is probably conservative, given the company’s history of consistently generating returns above its cost of capital (average CFROI for most recent 5 years was 9.45%). We also believe HOLT does not factor in the potential longer-term accretive impact from higher met and thermal coal prices, as well as the significant volume growth from organic projects and the synergies from the Macarthur acquisition.
Exhibit 44: BTU HOLT Relative Wealth Chart
Source: Credit Suisse HOLT, Credit Suisse estimates
■ Valuation: Shares of BTU are trading at y.yx and y.yx our 2013/14 EBITDA estimates, respectively. We are lowering our target price from $48 to $44, which reflects 6.2x our 2013 EBITDA estimate.
Based on consensus estimates, HOLT assumes a warranted price of $34.04 for BTU, based on a forecast CFROI of 7.72%. We feel this assumption is conservative, given the company’s historical CFROI of 9.45% and expect actual CFROI to be above the CFROI forecast, given our more bullish view on met coal prices longer-term.

13 April 2012
US Coal Sector 25
Tables Exhibit 45: Operating Summary
Q1'11 Q4'11 Q1'12E Q1'11 Q4'11 2011 2012E % chg. 2013E % chg. 2014E % chg.Tons sold (in millions) Midwestern 7.6 8.0 6.5 -14.5% -18.8% 30.3 30.0 -1.0% 29.1 -3.0% 29.1 0.0% West 43.8 46.4 40.0 -8.7% -13.8% 173.6 165.0 -5.0% 161.7 -2.0% 163.3 1.0% Australia 5.6 7.1 6.8 21.4% -4.2% 26.2 32.5 23.9% 36.0 10.9% 42.5 18.1% Trading 4.2 7.0 6.0 42.9% -14.3% 21.4 24.0 12.1% 24.0 0.0% 20.0 -16.7%Total tons sold 61.2 68.5 59.3 -3.1% -13.4% 251.5 251.5 0.0% 250.8 -0.3% 254.9 1.6%Revenues per ton Midwestern $48.36 $50.98 $50.00 3.4% -1.9% $49.10 $50.00 1.8% $46.00 -8.0% $45.00 -2.2% West $16.07 $16.73 $17.03 6.0% 1.8% $16.72 $17.03 1.9% $18.62 9.4% $19.03 2.2% Australia $102.94 $125.52 $132.13 28.4% 5.3% $118.78 $129.25 8.8% $137.21 6.2% $139.59 1.7%Wtd. Avg total revenues/ton $28.91 $33.74 $35.74 23.6% 5.9% $32.60 $37.39 14.7% $40.96 9.5% $44.06 7.6%Operating costs per ton Midwestern $33.88 $36.63 $37.11 9.5% 1.3% $35.54 $36.41 2.4% $38.32 5.2% $39.32 2.6% West $11.97 $11.69 $12.60 5.3% 7.8% $12.17 $12.32 1.2% $12.84 4.2% $13.09 2.0%Average - U.S. operations $15.21 $15.30 $16.03 5.4% 4.8% $15.64 $16.03 2.5% $16.72 4.3% $17.06 2.0% Australia $69.16 $70.59 $82.65 19.5% 17.1% $72.99 $79.11 8.4% $77.89 -1.5% $80.48 3.3%Average cost per ton $20.51 $21.73 $24.53 19.6% 12.9% $22.17 $25.03 12.9% $26.43 5.6% $28.53 7.9%Margins per ton Midwestern $14.48 $14.35 $12.89 -11.0% -10.2% $13.56 $13.59 0.2% $7.68 -43.5% $5.68 -26.0% West $4.10 $5.04 $4.43 7.9% -12.2% $4.55 $4.71 3.6% $5.79 22.9% $5.94 2.7%Average - U.S. operations $5.63 $6.39 $5.61 -0.4% -12.2% $5.89 $6.08 3.2% $6.08 0.0% $5.90 -2.8% Australia $33.78 $54.93 $49.48 n/a n/a $45.79 $50.15 9.5% $59.31 18.3% $59.11 -0.3%Average margin per ton $8.40 $12.01 $11.21 33.4% -6.7% $10.43 $12.36 18.5% $14.53 17.5% $15.53 6.9%Coal revenues by segment Midwestern $368 $408 $325 -11.6% -20.3% $1,488 $1,500 0.8% $1,339 -10.8% $1,310 -2.2% West $704 $776 $681 -3.2% -12.2% $2,902 $2,810 -3.2% $3,012 7.2% $3,108 3.2% Australia $576 $891 $898 n/a n/a $3,112 $4,194 34.8% $4,939 17.8% $5,932 20.1% Implied Trading and other $97 $178 ($389) -501.0% -318.2% $540 $531 -1.7% $531 0.0% $436 -17.9%Total revenues $1,745 $2,254 $1,516 -13.1% -32.7% $8,042 $9,035 12.3% $9,821 8.7% $10,786 9.8%Operating costs by segment Midwestern $257 $293 $241 -6.3% -17.7% $1,077 $1,092 1.4% $1,115 2.1% $1,144 2.6% West $524 $542 $504 -3.8% -7.0% $2,113 $2,033 -3.8% $2,076 2.1% $2,138 3.0% Australia $85 $109 $109 28.0% 0.3% $1,912 $2,567 34.2% $2,804 9.2% $3,420 22.0% Implied Trading and other $486 $704 $708 45.7% 0.6% $557 $586 5.0% $586 0.0% $488 -16.7%Total operating costs $1,268 $1,540 $1,454 14.6% -5.6% $5,660 $6,278 10.9% $6,581 4.8% $7,190 9.3%
% Chg vs.
Source: Company data, our estimates

13 April 2012
US Coal Sector 26
Exhibit 46: Income Statement
Q1'11 Q4'11 Q1'12E Q1'11 Q4'11 2011 2012E % Chg. 2013E % Chg. 2014E % Chg.
Coal and trading sales 1,735 2,248 2,029 17.0% -9.7% 8,005 9,003 12.5% 9,789 8.7% 10,766 10.0%Other 10 6 8 n.m. 45.5% 37 32 -13.5% 32 0.0% 20 -37.5% Total Revenue 1,745 2,254 2,037 16.8% -9.6% 8,042 9,035 12.3% 9,821 8.7% 10,786 9.8%Costs and Expenses: Operating costs & expenses 1,268 1,540 1,454 14.6% -5.6% 5,660 6,278 10.9% 6,581 4.8% 7,190 9.3% DD&A 109 160 181 66.6% 13.6% 487 726 49.0% 714 -1.6% 740 3.6% SG&A 62 86 91 47.8% 6.0% 277 364 31.3% 372 2.0% 383 3.0% Total Expenses 1,439 1,785 1,726 20.0% -3.3% 6,424 7,368 14.7% 7,667 4.0% 8,313 8.4%Net Gain on ppty. Disp.+_Asset retirement obl. 12 50 17 n.m. n.m. 72 62 n.m. 60 n.m. 60 n.m.Operating Profit 294 418 294 0.0% -29.6% 1,547 1,605 3.8% 2,094 30.5% 2,414 15.3%Interest Expense 51 80 107 108.8% 34.0% 239 426 78.4% 426 0.0% 426 0.0%Interest Income (4) (7) (2) -51.2% -72.2% (19) (8) -57.7% (8) 0.0% (8) 0.0% Net interest expense 47 72 105 122.8% 44.6% 220 418 90.1% 418 0.0% 418 0.0%Earnings before taxes 247 346 190 -23.2% -45.1% 1,327 1,187 -10.5% 1,676 41.2% 1,996 19.1%Income Tax provision (benefit) 68 108 52 -23.0% -51.4% 317 330 4.3% 471 42.7% 559 18.5%Minority Interests 2 (28) 5 127.3% -117.6% (11) 26 -328.1% 40 53.8% 40 0.0%Income From Continuing Operations 177 267 133 -25.2% -50.3% 1,021 831 -18.7% 1,165 40.2% 1,397 19.9% Discontinued Operations/Chg. In Acct. Prin. 0 (29) 0 n.m. n.m. 0 0 n.m. 0 n.m. 0 n.m. (income) loss from dis. operations 1 0 0 n.m. n.m. 4 0 n.m. 0 n.m. 0 n.m. Loss (gain) from disposal of dis. operations 0 16 0 n.m. n.m. 31 0 n.m. 0 n.m. 0 n.m.Net Income 177 222 133 -24.8% -40.3% 986 831 -15.8% 1,165 40.2% 1,397 19.9%Earnings Per Share:Reported Basic $0.65 $0.82 $0.49 -24.1% -40.3% $3.64 $3.07 -15.5% $4.31 40.2% $5.17 19.9%Reported Diluted $0.65 $0.82 $0.49 -24.1% -40.3% $3.64 $3.07 -15.5% $4.31 40.2% $5.17 19.9%Non-recurring items, Diluted -$0.02 -$0.50 $0.00 n.m. n.m. -$0.44 $0.00 n.m. $0.00 n.m. $0.00 n.m.Operating - Basic $0.67 $1.32 $0.49 -26.4% -62.9% $4.08 $3.07 -24.7% $4.31 40.2% $5.17 19.9%Operating - Diluted $0.67 $1.32 $0.49 -26.4% -62.9% $4.08 $3.07 -24.7% $4.31 40.2% $5.17 19.9%Diluted Shares Outstanding 272.8 270.3 270.3 -0.9% 0.0% 271.1 270.3 -0.3% 270.3 0.0% 270.3 0.0%Income Tax Rate 27% 31% 28% nm nm 24% 28% 28% 28%
EBT $247 $346 $190 -23.2% -45.1% 1,327 1,187 -10.5% 1,676 41.2% 1,996 19.1%EBIT $294 $418 $294 0.0% -29.6% 1,547 1,605 3.8% 2,094 30.5% 2,414 15.3%EBITDA $416 $673 $493 18.4% -26.8% 2,207 2,393 8.4% 2,869 19.9% 3,214 12.0%
% Chg vs.
Source: Company data, our estimates

13 April 2012
US Coal Sector 27
Americas / United StatesDiversified Metals & Mining
Alpha Natural Resources (ANR)
Adjusting for Lower Coal Prices ■ In conjunction with the Credit Suisse Global Metals & Mining team’s
coal price revisions, we are lowering our estimates and Target Price for Alpha Natural Resources. We maintain our Neutral rating on the shares.
■ EPS and TP Revisions - We are lowering our 2012 estimate from $0.32 to a loss of $0.11, our 2013 estimate from $0.88 to a loss of $0.01 and our 2014 estimate from $1.05 to $0.11. We are lowering our target price from $22 to $18, which represents 5.8x and 5.3x our 2013 and 2014 EBITDA estimates.
■ CS Global Seaborne Coking Coal Price Forecast: We are lowering our forecasts for US met coal prices in conjunction with our global met coal price revisions, accounting for differences in quality and contracted tonnage within the models. For global benchmarks, we are lowering our 2012 forecast from $234/tonne to $226/tonne, while our 2013 forecast of $239/tonne remains unchanged.
■ CAPP/NAPP Price Forecast – Our 2012 forecast of $62/ton remains unchanged, while we are lowering our 2013 forecast from $70/ton to $60/ton.
■ PRB Coal Price Forecast - Our 2012 forecast remains unchanged at $10/ton (ANR is completely sold-out for 2012). We are lowering our 2013 forecast from $13/ton to $12/ton. Our long-term PRB price of $14/ton remains unchanged.
■ ANR will likely report Q1’12 results sometime in early-May.
Share price performance
14
34
54
Apr-11 Jul-11 Oct-11 Jan-12
Daily Apr 13, 2011 - Apr 12, 2012, 4/13/11 = US$53.89
Price Indexed S&P 500 INDEX
On 04/12/12 the S&P 500 INDEX closed at 1387.57
Quarterly EPS Q1 Q2 Q3 Q4 2011A 0.65 0.96 0.35 -0.07 2012E -0.02 -0.15 -0.12 0.17 2013E 0.10 0.10 -0.20 -0.01
Financial and valuation metrics
Year 12/11A 12/12E 12/13E 12/14EEPS (CS adj.) (US$) 1.88 -0.11 -0.01 0.11Prev. EPS (US$) — 0.32 0.88 1.05P/E (x) 8.5 -142.1 -1,933.1 144.5P/E rel. (%) 58.9 -1,063.3 -16,312.9 1,357.3Revenue (US$ m) 7,099.6 7,376.0 7,426.9 7,767.9EBITDA (US$ m) 1,212.7 1,037.9 1,086.0 1,183.3OCFPS (US$) 10.09 3.94 4.16 4.59P/OCF (x) 2.0 4.1 3.9 3.5EV/EBITDA (current) 4.9 5.7 5.5 5.0Net debt (US$ m) 2,382 2,167 1,956 1,650ROIC (%) 20.55 1.45 1.73 1.97
Number of shares (m) 220.26 IC (current, US$ m) 9,810.40BV/share (Next Qtr., US$) 33.9 EV/IC (x) 0.60Net debt (Next Qtr., US$ m) 2,318.5 Dividend (Next Qtr., US$) —Net debt/tot cap (Next Qtr., %) 31.2 Dividend yield (%) —
Source: Company data, Credit Suisse estimates.
*Stock ratings are relative to the relevant country benchmark. ¹Target price is for 12 months. [V] = Stock considered volatile (see Disclosure Appendix).
Research Analysts
Richard Garchitorena, CFA 212 325 5809
Sean Wright, CPA 212 538 3284
Rating NEUTRAL* [V] Price (12 Apr 12, US$) 16.08 Target price (US$) (from 22.00) 18.00¹ 52-week price range 58.17 - 14.06 Market cap. (US$ m) 3,541.71 Enterprise value (US$ m) 5,709.15

13 April 2012
US Coal Sector 28
Tables Exhibit 47: Operating Summary
Q1'11 Q4'11 Q1'12E Q1'11 Q4'11 2011 2012E % chg. 2013E % chg. 2014E % chg.Tons sold (in millions)West 13.4 12.6 13.9 4.0% 10.7% 49.9 47.0 -5.9% 46.1 -1.9% 46.6 1.1%Eastern Steam 5.8 12.7 11.9 106.6% -6.2% 37.2 41.5 11.6% 39.5 -4.8% 39.9 1.0%Eastern Met 3.0 5.9 5.3 77.5% -10.3% 19.2 21.2 10.5% 24.5 15.6% 26.5 8.2%Total tons sold 22.1 31.2 31.1 40.7% -0.2% 106.3 109.7 3.2% 110.1 0.4% 113.0 2.6%Revenue per tonWest $10.94 $11.98 $11.96 9.3% -0.2% $11.94 $12.78 7.0% $12.60 -1.4% $13.20 4.8%Eastern Steam $67.04 $67.07 $66.93 -0.2% -0.2% $66.91 $67.77 1.3% $61.64 -9.0% $65.00 5.5%Eastern Met $114.87 $168.49 $156.48 36.2% -7.1% $161.86 $137.76 -14.9% $137.40 -0.3% $132.00 -3.9%Wtd Avg $39.61 $64.08 $57.62 45.5% -10.1% $58.22 $57.73 -0.8% $57.96 0.4% $59.35 2.4%Cost per TonWest $7.87 $10.34 $9.44 19.9% -8.7% $9.99 $11.09 11.0% $11.14 0.4% $11.35 1.9%Eastern (wtd avg) 64.18 75.81 $78.49 22.3% 3.5% $74.89 $74.92 0.0% $74.04 -1.2% $74.66 0.8%Wtd Avg $30.17 $49.44 $47.67 58.0% -3.6% $44.40 $47.57 7.1% $47.70 0.3% $48.55 1.8%Margins per TonWest $3.07 $1.64 $2.52 -17.9% 53.7% $1.95 $1.69 -13.4% $1.46 -13.4% $1.85 26.6%Eastern (wtd avg) 19.15 23.39 $15.95 -16.7% -31.8% $24.33 $16.51 -32.1% $16.60 0.5% $17.08 2.9%Total (wtd avg) $9.44 $14.63 $9.96 5.5% -32.0% $13.82 $10.16 -26.4% $10.26 1.0% $10.80 5.3%
% Chg vs.
Source: Company data, our estimates
Exhibit 48: Income Statement
Q1'11 Q4'11 Q1'12E Q1'11 Q4'11 2011 2012E % chg. 2013E % chg. Coal Revenues 876,042 1,997,934 1,793,630 204.7% -10.2% 6,189,434 6,333,439 2.3% 6,381,937 0.8% Freight and Handling Revenues 92,173 213,834 181,478 na -15.1% 662,238 725,912 9.6% 725,912 0.0% Other Revenues 24,900 93,010 95,535 na 2.7% 247,925 316,672 27.7% 319,097 0.8%Total Revenues 993,115 2,304,778 2,070,643 208.5% -10.2% 7,099,597 7,376,023 3.9% 7,426,945 0.7%
Cost of Coal Sold 669,836 1,675,209 1,553,897 150.1% -7.2% 5,070,754 5,218,492 2.9% 5,251,902 0.6% (Increase) decrease in FV of contracts - - - - - - Freight & Handling 92,173 213,834 181,478 132.0% -15.1% 662,238 725,912 9.6% 725,912 0.0% Cost of other Revenues 29,404 58,063 34,268 97.5% -41.0% 156,281 174,170 11.4% 175,503 0.8% DD&A 90,667 242,699 285,452 167.7% 17.6% 760,558 1,069,575 40.6% 1,073,475 0.4% SG&A 45,371 72,701 49,411 60.2% -32.0% 379,067 217,597 -42.6% 185,674 -14.7% Amort. of Coal Supply Agreements 52,805 (73,274) (50,537) -238.8% -31.0% (107,434) (180,000) (160,000) Other - - 745,325 - - - Total costs and expenses 980,256 2,189,232 2,799,294 123.3% 27.9% 7,666,789 7,225,746 -5.8% 7,252,466 0.4%Operating Income 12,859 115,546 (728,651) 798.6% -730.6% (567,192) 150,276 -126.5% 174,480 16.1%
Interest Expense (15,005) (49,148) (47,188) 227.5% -4.0% (141,805) (180,000) 26.9% (180,000) 0.0%Interest Income 963 931 991 -3.3% 6.4% 3,979 5,600 40.7% 5,600 0.0%Miscellaneous Income (1,604) (4,903) 44 205.7% -100.9% (9,391) (2,000) -78.7% (2,000) 0.0%Total Other Income (Expense) (15,646) (53,120) (46,153) 239.5% -13.1% (147,217) (176,400) 19.8% (176,400) 0.0%Income Before Taxes (2,787) 62,426 (774,804) na na (714,409) (26,124) -96.3% (1,920) -92.7%
Income Tax Expense (13,792) (4,002) (41,470) -71.0% 936.2% (40,999) (1,306) -96.8% (96) -92.7%Minority Interest 166 - - - - - Net Income 10,839 66,428 (733,334) 512.9% -1204.0% (673,410) (24,817) -96.3% (1,824) -92.7%
Earnings Per Share $0.09 $0.29 ($3.34) 229.7% na (3.01)$ ($0.11) -96.2% ($0.01) -92.7%Non Recurring Items $0.18 $0.06 $3.27 -66.7% na 4.89$ $0.00 $0.00Basic $0.27 $0.36 ($0.07) 31.6% -120.9% 1.89$ ($0.11) -106.0% ($0.01) -92.7%Diluted $0.27 $0.35 ($0.07) 31.4% -121.0% 1.88$ ($0.11) -106.0% ($0.01) -92.7%
Basic Shares 119,649 224,394 219,280 87.5% -2.3% 179,732 219,280 22.0% 219,280 0.0%Diluted Shares 121,731 226,282 219,280 85.9% -3.1% 180,709 219,280 21.3% 219,280 0.0%Effective income tax rate 494.9% -6.4% 5.4% 5.7% 5.0% 5.0%
EBIT 11,255 110,643 (728,607) na na (576,583) 148,276 -125.7% 172,480 16.3%EBITDA 163,428 373,118 261,308 128.3% -30.0% 1,212,341 1,037,851 -14.4% 1,085,955 4.6%Reported adjusted EBITDA 163,428 373,050 260,820 128.3% -30.1% 183,975 1,037,851 464.1% 1,085,955 4.6%
% Chg vs.
Source: Company data, our estimates

13 April 2012
US Coal Sector 29
Americas / United StatesDiversified Metals & Mining
Arch Coal, Inc. (ACI)
Adjusting for Lower Coal Prices ■ In conjunction with the Credit Suisse Global Metals & Mining team’s
coal price revisions, we are lowering our estimates and Target Price for Arch Coal. We maintain our Neutral rating on the shares.
■ EPS and TP Revisions - We are lowering our 2012 estimate from $0.89 to $0.59, our 2013 estimate from $1.31 to $0.83 and our 2014 estimate from $1.84 to $0.99. We are lowering our target price from $14 to $12, which represents 6.5x our 2013 EBITDA estimate and 6.1x our 2014 EBITDA estimate.
■ CS Global Seaborne Coking Coal Price Forecast: We are lowering our forecasts for US met coal prices in conjunction with our global met coal price revisions, accounting for differences in quality and contracted tonnage within the models. For global benchmarks, we are lowering our 2012 forecast from $234/tonne to $226/tonne, while our 2013 forecast of $239/tonne remains unchanged.
■ CAPP/NAPP Price Forecast – Our 2012 forecast of $62/ton remains unchanged, while we are lowering our 2013 forecast from $70/ton to $60/ton.
■ PRB Coal Price Forecast - Our 2012 forecast remains unchanged at $10/ton. We are lowering our 2013 forecast from $13/ton to $12/ton. Our long-term PRB price of $14/ton remains unchanged.
■ ACI will likely report Q1’12 results sometime in late-April.
Share price performance
9
19
29
Apr-11 Jul-11 Oct-11 Jan-12
Daily Apr 14, 2011 - Apr 12, 2012, 4/14/11 = US$33.35
Price Indexed S&P 500 INDEX
On 04/12/12 the S&P 500 INDEX closed at 1387.57
Quarterly EPS Q1 Q2 Q3 Q4 2011A 0.34 0.44 0.08 0.29 2012E 0.19 0.14 0.07 0.19 2013E 0.20 0.20 0.17 0.27
Financial and valuation metrics
Year 12/11A 12/12E 12/13E 12/14EEPS (CS adj.) (US$) 1.16 0.59 0.83 0.99Prev. EPS (US$) — 0.89 1.31 1.84P/E (x) 9.2 18.0 12.8 10.7P/E rel. (%) 63.3 134.8 107.9 100.8Revenue (US$ m) 4,285.5 3,922.9 3,937.1 4,152.8EBITDA (US$ m) 921.7 933.6 991.1 1,059.4OCFPS (US$) 7.58 3.15 3.38 3.56P/OCF (x) 1.9 3.4 3.1 3.0EV/EBITDA (current) 6.7 6.6 6.2 5.8Net debt (US$ m) 3,905 3,792 3,819 3,098ROIC (%) 8.75 6.07 6.32 6.41
Number of shares (m) 212.08 IC (current, US$ m) 7,494.57BV/share (Next Qtr., US$) 17.0 EV/IC (x) 0.82Net debt (Next Qtr., US$ m) 3,856.9 Dividend (Next Qtr., US$) 0.10Net debt/tot cap (Next Qtr., %) 106.9 Dividend yield (%) 0.94
Source: Company data, Credit Suisse estimates.
*Stock ratings are relative to the relevant country benchmark. ¹Target price is for 12 months. [V] = Stock considered volatile (see Disclosure Appendix).
Research Analysts
Richard Garchitorena, CFA 212 325 5809
Sean Wright, CPA 212 538 3284
Rating NEUTRAL* [V] Price (12 Apr 12, US$) 10.63 Target price (US$) (from 14.00) 12.00¹ 52-week price range 34.64 - 9.91 Market cap. (US$ m) 2,254.37 Enterprise value (US$ m) 6,045.92

13 April 2012
US Coal Sector 30
Tables Exhibit 49: Operating Summary
Q1'11 Q4'11 Q1'12E Q1'11 Q4'11 2011 2012E % Chg. 2013E % Chg. 2014ERevenue Per Ton (US$'s)
Central App. 71.91 86.50 86.12 19.8% -0.4% 87.12 92.02 5.6% 100.55 9.3% 106.12 PRB 12.51 13.62 13.65 9.1% 0.2% 13.62 13.83 1.5% 13.21 -4.5% 13.20 Western Bituminous 28.79 36.09 36.40 26.4% 0.9% 34.96 38.31 9.6% 38.37 0.1% 40.00
Total 18.66 27.70 25.94 39.0% -6.4% 25.14 26.80 6.6% 27.09 1.1% 28.34 Cost Per Ton (US$'s)
Central App. 57.78 76.62 76.66 32.7% 0.1% 73.01 76.78 5.2% 77.05 0.3% 79.69 PRB 10.92 12.16 11.69 7.1% -3.9% 11.95 12.68 6.2% 12.68 0.0% 12.85 Western Bituminous 24.79 30.29 30.21 21.9% -0.3% 28.00 32.28 15.3% 33.45 3.6% 34.11
Total 15.88 24.43 22.54 41.9% -7.8% 21.33 23.27 9.1% 23.12 -0.6% 23.93 Margins Per Ton (US$'s)
Central App. 14.13 9.88 9.46 n.m. -4.3% 14.12 15.24 8.0% 23.50 54.2% 26.42 PRB 1.59 1.46 1.96 n.m. 34.2% 1.68 1.14 -31.8% 0.52 -54.1% 0.35 Western Bituminous 4.00 5.80 6.19 n.m. 6.7% 6.96 6.03 -13.3% 4.92 -18.5% 5.89
Total 2.79 3.27 3.41 22.2% 4.1% 3.81 3.53 -7.4% 3.97 12.4% 4.41 Sales Volumes (k tons)
Central App. 3,200 6,300 5,900 84.4% -6.3% 19,200 19,900 3.6% 19,150 -3.8% 19,750 PRB 34,600 28,800 32,200 -6.9% 11.8% 117,800 112,500 -4.5% 112,500 0.0% 112,500 Western Bituminous 4,200 4,200 3,900 -7.1% -7.1% 17,000 14,000 -17.6% 13,700 -2.1% 14,300
Total 42,000 39,300 42,000 0.0% 6.9% 154,000 146,400 -4.9% 145,350 -0.7% 146,550 Implied Total:Revenues (k US$'s)
Central App. 230,112 544,950 508,108 120.8% -6.8% 1,672,736 1,831,144 9.5% 1,925,462 5.2% 2,095,806 PRB 432,846 392,256 439,530 1.5% 12.1% 1,604,474 1,555,320 -3.1% 1,486,026 -4.5% 1,485,000 Western Bituminous 120,918 151,578 141,960 17.4% -6.3% 594,245 536,393 -9.7% 525,615 -2.0% 572,000
Total 783,876 1,088,784 1,089,598 39.0% 0.1% 3,871,455 3,922,857 1.3% 3,937,103 0.4% 4,152,806
Costs (k US$'s)Central App. 184,896 482,706 452,294 144.6% -6.3% 1,401,712 1,527,888 9.0% 1,475,428 -3.4% 1,573,968 PRB 377,832 350,208 376,418 -0.4% 7.5% 1,407,154 1,426,716 1.4% 1,427,017 0.0% 1,445,256 Western Bituminous 104,118 127,218 117,819 13.2% -7.4% 475,980 451,947 -5.0% 458,264 1.4% 487,837
Total 666,846 960,132 946,531 41.9% -1.4% 3,284,846 3,406,551 3.7% 3,360,708 -1.3% 3,507,062
Margin (k US$'s)Central App. 45,216 62,244 55,814 n.m. -10.3% 271,024 303,256 11.9% 450,034 48.4% 521,837 PRB 55,014 42,048 63,112 n.m. 50.1% 197,320 128,604 -34.8% 59,009 -54.1% 39,744 Western Bituminous 16,800 24,360 24,141 n.m. -0.9% 118,265 84,446 -28.6% 67,351 -20.2% 84,163
Total 117,030 128,652 143,067 22.2% 11.2% 586,609 516,306 -12.0% 576,395 11.6% 645,744
% chg vs.
Source: Company data, our estimates
Exhibit 50: Income Statement
Q1'11 Q4'11 Q1'12E Q1'11 Q4'11 2011 2012E % Chg. 2013E % Chg. 2014ERevenue Per Ton (US$'s)
Central App. 71.91 86.50 86.12 19.8% -0.4% 87.12 92.02 5.6% 100.55 9.3% 106.12 PRB 12.51 13.62 13.65 9.1% 0.2% 13.62 13.83 1.5% 13.21 -4.5% 13.20 Western Bituminous 28.79 36.09 36.40 26.4% 0.9% 34.96 38.31 9.6% 38.37 0.1% 40.00
Total 18.66 27.70 25.94 39.0% -6.4% 25.14 26.80 6.6% 27.09 1.1% 28.34 Cost Per Ton (US$'s)
Central App. 57.78 76.62 76.66 32.7% 0.1% 73.01 76.78 5.2% 77.05 0.3% 79.69 PRB 10.92 12.16 11.69 7.1% -3.9% 11.95 12.68 6.2% 12.68 0.0% 12.85 Western Bituminous 24.79 30.29 30.21 21.9% -0.3% 28.00 32.28 15.3% 33.45 3.6% 34.11
Total 15.88 24.43 22.54 41.9% -7.8% 21.33 23.27 9.1% 23.12 -0.6% 23.93 Margins Per Ton (US$'s)
Central App. 14.13 9.88 9.46 n.m. -4.3% 14.12 15.24 8.0% 23.50 54.2% 26.42 PRB 1.59 1.46 1.96 n.m. 34.2% 1.68 1.14 -31.8% 0.52 -54.1% 0.35 Western Bituminous 4.00 5.80 6.19 n.m. 6.7% 6.96 6.03 -13.3% 4.92 -18.5% 5.89
Total 2.79 3.27 3.41 22.2% 4.1% 3.81 3.53 -7.4% 3.97 12.4% 4.41 Sales Volumes (k tons)
Central App. 3,200 6,300 5,900 84.4% -6.3% 19,200 19,900 3.6% 19,150 -3.8% 19,750 PRB 34,600 28,800 32,200 -6.9% 11.8% 117,800 112,500 -4.5% 112,500 0.0% 112,500 Western Bituminous 4,200 4,200 3,900 -7.1% -7.1% 17,000 14,000 -17.6% 13,700 -2.1% 14,300
Total 42,000 39,300 42,000 0.0% 6.9% 154,000 146,400 -4.9% 145,350 -0.7% 146,550 Implied Total:Revenues (k US$'s)
Central App. 230,112 544,950 508,108 120.8% -6.8% 1,672,736 1,831,144 9.5% 1,925,462 5.2% 2,095,806 PRB 432,846 392,256 439,530 1.5% 12.1% 1,604,474 1,555,320 -3.1% 1,486,026 -4.5% 1,485,000 Western Bituminous 120,918 151,578 141,960 17.4% -6.3% 594,245 536,393 -9.7% 525,615 -2.0% 572,000
Total 783,876 1,088,784 1,089,598 39.0% 0.1% 3,871,455 3,922,857 1.3% 3,937,103 0.4% 4,152,806
Costs (k US$'s)Central App. 184,896 482,706 452,294 144.6% -6.3% 1,401,712 1,527,888 9.0% 1,475,428 -3.4% 1,573,968 PRB 377,832 350,208 376,418 -0.4% 7.5% 1,407,154 1,426,716 1.4% 1,427,017 0.0% 1,445,256 Western Bituminous 104,118 127,218 117,819 13.2% -7.4% 475,980 451,947 -5.0% 458,264 1.4% 487,837
Total 666,846 960,132 946,531 41.9% -1.4% 3,284,846 3,406,551 3.7% 3,360,708 -1.3% 3,507,062
Margin (k US$'s)Central App. 45,216 62,244 55,814 n.m. -10.3% 271,024 303,256 11.9% 450,034 48.4% 521,837 PRB 55,014 42,048 63,112 n.m. 50.1% 197,320 128,604 -34.8% 59,009 -54.1% 39,744 Western Bituminous 16,800 24,360 24,141 n.m. -0.9% 118,265 84,446 -28.6% 67,351 -20.2% 84,163
Total 117,030 128,652 143,067 22.2% 11.2% 586,609 516,306 -12.0% 576,395 11.6% 645,744
% chg vs.
Source: Company data, our estimates
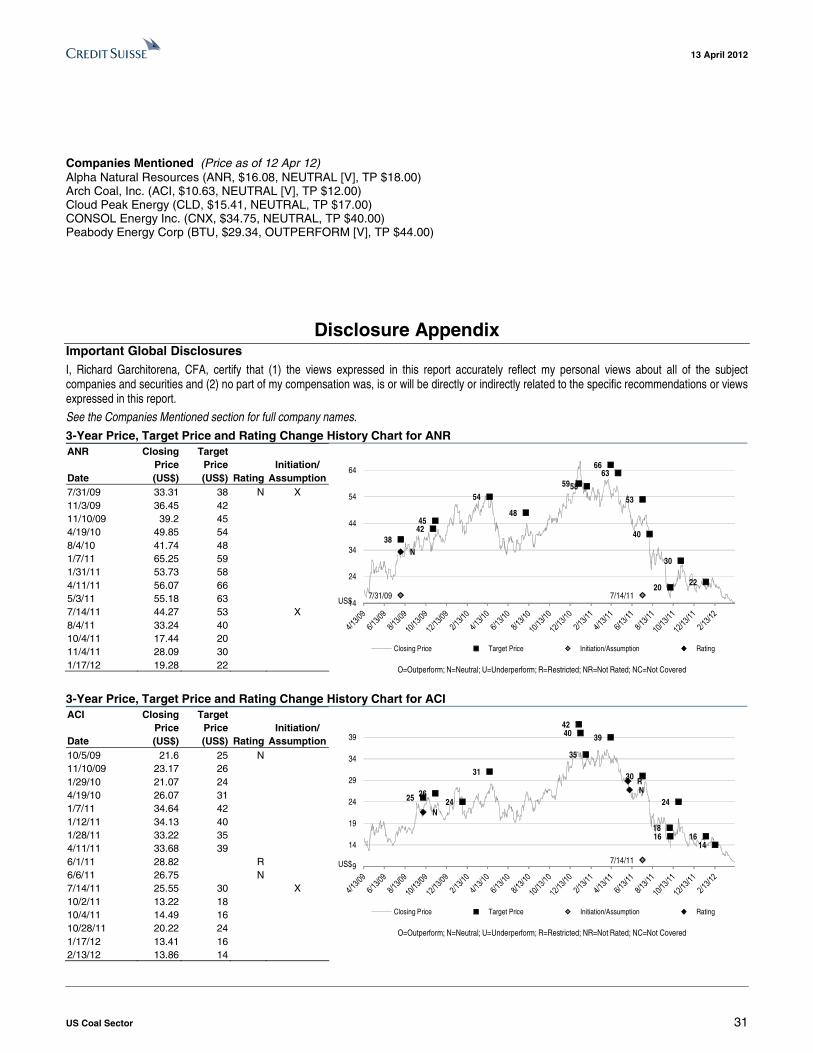
13 April 2012
US Coal Sector 31
Companies Mentioned (Price as of 12 Apr 12) Alpha Natural Resources (ANR, $16.08, NEUTRAL [V], TP $18.00) Arch Coal, Inc. (ACI, $10.63, NEUTRAL [V], TP $12.00) Cloud Peak Energy (CLD, $15.41, NEUTRAL, TP $17.00) CONSOL Energy Inc. (CNX, $34.75, NEUTRAL, TP $40.00) Peabody Energy Corp (BTU, $29.34, OUTPERFORM [V], TP $44.00)
Disclosure Appendix
Important Global Disclosures I, Richard Garchitorena, CFA, certify that (1) the views expressed in this report accurately reflect my personal views about all of the subject companies and securities and (2) no part of my compensation was, is or will be directly or indirectly related to the specific recommendations or views expressed in this report.
See the Companies Mentioned section for full company names. 3-Year Price, Target Price and Rating Change History Chart for ANR ANR Closing
Price Target
Price
Initiation/ Date (US$) (US$) Rating Assumption 7/31/09 33.31 38 N X 11/3/09 36.45 42 11/10/09 39.2 45 4/19/10 49.85 54 8/4/10 41.74 48 1/7/11 65.25 59 1/31/11 53.73 58 4/11/11 56.07 66 5/3/11 55.18 63 7/14/11 44.27 53 X 8/4/11 33.24 40 10/4/11 17.44 20 11/4/11 28.09 30 1/17/12 19.28 22
384245
54
48
5958
6663
53
40
20
30
22
7/31/09 7/14/11
N
14
24
34
44
54
64
Closing Price Target Price Initiation/Assumption Rating
US$
O=Outperform; N=Neutral; U=Underperform; R=Restricted; NR=Not Rated; NC=Not Covered
3-Year Price, Target Price and Rating Change History Chart for ACI ACI Closing
Price Target
Price
Initiation/ Date (US$) (US$) Rating Assumption 10/5/09 21.6 25 N 11/10/09 23.17 26 1/29/10 21.07 24 4/19/10 26.07 31 1/7/11 34.64 42 1/12/11 34.13 40 1/28/11 33.22 35 4/11/11 33.68 39 6/1/11 28.82 R 6/6/11 26.75 N 7/14/11 25.55 30 X 10/2/11 13.22 18 10/4/11 14.49 16 10/28/11 20.22 24 1/17/12 13.41 16 2/13/12 13.86 14
25 2624
31
4240
35
39
30
1816
24
1614
7/14/11
N
RN
9
14
19
24
29
34
39
Closing Price Target Price Initiation/Assumption Rating
US$
O=Outperform; N=Neutral; U=Underperform; R=Restricted; NR=Not Rated; NC=Not Covered

13 April 2012
US Coal Sector 32
3-Year Price, Target Price and Rating Change History Chart for CLD CLD Closing
Price Target
Price
Initiation/ Date (US$) (US$) Rating Assumption 1/11/10 16.8 21 O X 5/3/10 16.05 R 5/12/10 14.9 O 5/14/10 14.6 R 6/15/10 14.61 O 8/5/10 16.67 22 11/4/10 18.3 24 11/22/10 20.97 R 12/16/10 19.9 30 O 1/7/11 22.46 32 2/25/11 19.84 30 5/4/11 20.18 26 7/14/11 X 10/4/11 16.91 24 10/27/11 23.26 30 1/17/12 19.17 26 2/16/12 17.49 20
2122
24
30
32
30
26
24
30
26
20
1/11/10 7/14/11
OROR O
RO
12
17
22
27
32
Closing Price Target Price Initiation/Assumption Rating
US$
O=Outperform; N=Neutral; U=Underperform; R=Restricted; NR=Not Rated; NC=Not Covered
3-Year Price, Target Price and Rating Change History Chart for CNX CNX Closing
Price Target
Price
Initiation/ Date (US$) (US$) Rating Assumption 10/22/09 49 55 10/23/09 47.42 55 11/10/09 48.5 57 3/15/10 48.85 55 3/22/10 44.69 50 4/19/10 42.71 55 7/29/10 36.77 51 10/29/10 36.76 44 1/7/11 50.9 60 1/27/11 48.45 57 4/11/11 50.34 62 7/14/11 X 7/28/11 53.47 65 10/4/11 34.43 45 10/27/11 45.23 58 1/17/12 33.37 48 1/26/12 36.14 45
555557
55
50
55
51
44
6057
6265
45
58
4845
7/14/1124
29
34
39
44
49
54
59
64
Closing Price Target Price Initiation/Assumption Rating
US$
O=Outperform; N=Neutral; U=Underperform; R=Restricted; NR=Not Rated; NC=Not Covered
3-Year Price, Target Price and Rating Change History Chart for BTU BTU Closing
Price Target
Price
Initiation/ Date (US$) (US$) Rating Assumption 4/15/09 25.96 34 7/21/09 33.02 37 10/20/09 43.81 48 11/10/09 43.89 52 4/19/10 45.42 58 1/7/11 62.07 75 3/3/11 69.32 80 4/11/11 66.43 90 4/19/11 63.67 80 7/14/11 X 10/4/11 33.62 55 1/17/12 35.3 52 1/25/12 37.33 48
3437
4852
58
7580
90
80
555248
7/14/1124
34
44
54
64
74
84
Closing Price Target Price Initiation/Assumption Rating
US$
O=Outperform; N=Neutral; U=Underperform; R=Restricted; NR=Not Rated; NC=Not Covered
The analyst(s) responsible for preparing this research report received compensation that is based upon various factors including Credit Suisse's total revenues, a portion of which are generated by Credit Suisse's investment banking activities.

13 April 2012
US Coal Sector 33
Analysts’ stock ratings are defined as follows: Outperform (O): The stock’s total return is expected to outperform the relevant benchmark* by at least 10-15% (or more, depending on perceived risk) over the next 12 months. Neutral (N): The stock’s total return is expected to be in line with the relevant benchmark* (range of ±10-15%) over the next 12 months. Underperform (U): The stock’s total return is expected to underperform the relevant benchmark* by 10-15% or more over the next 12 months. *Relevant benchmark by region: As of 29th May 2009, Australia, New Zealand, U.S. and Canadian ratings are based on (1) a stock’s absolute total return potential to its current share price and (2) the relative attractiveness of a stock’s total return potential within an analyst’s coverage universe**, with Outperforms representing the most attractive, Neutrals the less attractive, and Underperforms the least attractive investment opportunities. Some U.S. and Canadian ratings may fall outside the absolute total return ranges defined above, depending on market conditions and industry factors. For Latin American, Japanese, and non-Japan Asia stocks, ratings are based on a stock’s total return relative to the average total return of the relevant country or regional benchmark; for European stocks, ratings are based on a stock’s total return relative to the analyst's coverage universe**. For Australian and New Zealand stocks, 12-month rolling yield is incorporated in the absolute total return calculation and a 15% and a 7.5% threshold replace the 10-15% level in the Outperform and Underperform stock rating definitions, respectively. The 15% and 7.5% thresholds replace the +10-15% and -10-15% levels in the Neutral stock rating definition, respectively. **An analyst's coverage universe consists of all companies covered by the analyst within the relevant sector. Restricted (R): In certain circumstances, Credit Suisse policy and/or applicable law and regulations preclude certain types of communications, including an investment recommendation, during the course of Credit Suisse's engagement in an investment banking transaction and in certain other circumstances. Volatility Indicator [V]: A stock is defined as volatile if the stock price has moved up or down by 20% or more in a month in at least 8 of the past 24 months or the analyst expects significant volatility going forward.
Analysts’ coverage universe weightings are distinct from analysts’ stock ratings and are based on the expected performance of an analyst’s coverage universe* versus the relevant broad market benchmark**: Overweight: Industry expected to outperform the relevant broad market benchmark over the next 12 months. Market Weight: Industry expected to perform in-line with the relevant broad market benchmark over the next 12 months. Underweight: Industry expected to underperform the relevant broad market benchmark over the next 12 months. *An analyst’s coverage universe consists of all companies covered by the analyst within the relevant sector. **The broad market benchmark is based on the expected return of the local market index (e.g., the S&P 500 in the U.S.) over the next 12 months. Credit Suisse’s distribution of stock ratings (and banking clients) is:
Global Ratings Distribution Outperform/Buy* 46% (60% banking clients) Neutral/Hold* 42% (57% banking clients) Underperform/Sell* 10% (51% banking clients) Restricted 2%
*For purposes of the NYSE and NASD ratings distribution disclosure requirements, our stock ratings of Outperform, Neutral, and Underperform most closely correspond to Buy, Hold, and Sell, respectively; however, the meanings are not the same, as our stock ratings are determined on a relative basis. (Please refer to definitions above.) An investor's decision to buy or sell a security should be based on investment objectives, current holdings, and other individual factors.
Credit Suisse’s policy is to update research reports as it deems appropriate, based on developments with the subject company, the sector or the market that may have a material impact on the research views or opinions stated herein.
Credit Suisse's policy is only to publish investment research that is impartial, independent, clear, fair and not misleading. For more detail please refer to Credit Suisse's Policies for Managing Conflicts of Interest in connection with Investment Research: http://www.csfb.com/research-and-analytics/disclaimer/managing_conflicts_disclaimer.html
Credit Suisse does not provide any tax advice. Any statement herein regarding any US federal tax is not intended or written to be used, and cannot be used, by any taxpayer for the purposes of avoiding any penalties.
See the Companies Mentioned section for full company names. Price Target: (12 months) for (ANR) Method: Our 12-month price objective of $18 per share for ANR represents 5.8x our 2013 EBITDA (earnings before interest, taxes, depreciation and amortization) estimate, which we believe represents a reasonable one-year forward EBITDA multiple given the current market environment. Risks: Similar to other coal companies, the primary risk to our $18 target price for ANR is weaker than expected coal prices, higher operating costs, lower exports and/or lower sales volumes. The business of mining involves risks related to operational efficiency, which could lead to lower than expected production and sales volumes. Operational costs such as raw material costs, labor, energy and fuel costs could also pressure margins. While we expect strong near-term cash flow and earnings due to the nature of longer-term contract pricing in the industry, current price assumptions may not be attained in the future. Price Target: (12 months) for (ACI) Method: Our $12 target price for ACI represents 6.5x our 2013 EBITDA (earnings before interest, taxes, depreciation and amortization) estimate, in line with the peer group average implied mutliple. Risks: Similar to other coal producers, the primary risk to our $12 target price for Arch Coal is lower than expected pricing, company-specific mining challenges, and/or higher than expected operating costs. Price Target: (12 months) for (CLD)

13 April 2012
US Coal Sector 34
Method: Our $17 target price for CLD is 4.2x our 2013 EBITDA (earnings before interest, taxes, depreciation, and amortization) estimate, a discount to the peer group because of weaker near-term market fundamentals vs. eastern US thermal and metallurgical coal, and limited growth/FCF (free cash flow) opportunities vs. the peers. Risks: We see several risks to our $17 target price for CLD. The primary is that underlying PRB coal prices do not achieve our estimates of $13/ton in 2012 and $13/ton in 2013. The primary engine behind our positive thesis towards CLD is our expectation for a rebound in PRB prices. To this end, if PRB prices decline further than our current 2012 base case assumption of $13/ton, and/or remain at $13/ton for longer than our current expectations, this would affect our target price. We also see company-specific risks of substantial cash outflow in 2012-14 in federal mining leases for rights to mine coal. Price Target: (12 months) for (CNX) Method: Our $40 price target for CNX represents 7.8x our 2013 EBITDA (earnings before interest, taxes, depreciation and amortization) estimate. Our multiple is in-line with the historical group average. Risks: Similar to other coal companies, the primary risk to our $40 target price for CNX is weaker than expected coal prices, higher operating costs, lower exports and/or lower sales volumes. The business of mining involves risks related to operational efficiency, which could lead to lower than expected production and sales volumes. Operational costs such as raw material costs, labor, energy and fuel costs could also pressure margins. While we expect strong near-term cash flow and earnings due to the nature of longer-term contract pricing in the industry, current price assumptions may not be attained in the future. Specific to CNX, natural gas prices will also influence results going forward given their signficant gas business. Price Target: (12 months) for (BTU) Method: Our 12 month target price of $44 for Peabody Energy is based on 6.2x our 2013 EBITDA (earnings before interest, taxes, depreciation & amortization) estimate, which represents the mid-point of what we consider a reasonable one-year forward range for the coal group. Risks: Primary risks to our $44 target price for Peabody Energy are: 1. lower than expected realized prices or sales volumes, 2. higher than expected operating costs, 3. operational issues at mining operations, 4.negative currency movements and 5. potential environmental and safety litigation. Please refer to the firm's disclosure website at www.credit-suisse.com/researchdisclosures for the definitions of abbreviations typically used in the target price method and risk sections.
See the Companies Mentioned section for full company names. The subject company (ANR, ACI, CLD, CNX, BTU) currently is, or was during the 12-month period preceding the date of distribution of this report, a client of Credit Suisse. Credit Suisse provided investment banking services to the subject company (ANR, ACI, CLD, CNX, BTU) within the past 12 months. Credit Suisse provided non-investment banking services, which may include Sales and Trading services, to the subject company (ACI, CLD, BTU) within the past 12 months. Credit Suisse has managed or co-managed a public offering of securities for the subject company (ACI) within the past 12 months. Credit Suisse has received investment banking related compensation from the subject company (ACI, CNX) within the past 12 months. Credit Suisse expects to receive or intends to seek investment banking related compensation from the subject company (ANR, ACI, CLD, CNX, BTU) within the next 3 months. Credit Suisse has received compensation for products and services other than investment banking services from the subject company (ACI, CLD, BTU) within the past 12 months. As of the date of this report, Credit Suisse Securities (USA) LLC makes a market in the securities of the subject company (ANR, ACI, CLD, CNX, BTU). Important Regional Disclosures Singapore recipients should contact a Singapore financial adviser for any matters arising from this research report.
The analyst(s) involved in the preparation of this report have not visited the material operations of the subject company (ANR, ACI, CLD, CNX, BTU) within the past 12 months.
Restrictions on certain Canadian securities are indicated by the following abbreviations: NVS--Non-Voting shares; RVS--Restricted Voting Shares; SVS--Subordinate Voting Shares. Individuals receiving this report from a Canadian investment dealer that is not affiliated with Credit Suisse should be advised that this report may not contain regulatory disclosures the non-affiliated Canadian investment dealer would be required to make if this were its own report. For Credit Suisse Securities (Canada), Inc.'s policies and procedures regarding the dissemination of equity research, please visit http://www.csfb.com/legal_terms/canada_research_policy.shtml.
As of the date of this report, Credit Suisse acts as a market maker or liquidity provider in the equities securities that are the subject of this report.
Principal is not guaranteed in the case of equities because equity prices are variable. Commission is the commission rate or the amount agreed with a customer when setting up an account or at anytime after that. Taiwanese Disclosures: This research report is for reference only. Investors should carefully consider their own investment risk. Investment results are the responsibility of the individual investor. Reports may not be reprinted without permission of CS. Reports written by Taiwan-based analysts on non-Taiwan listed companies are not considered recommendations to buy or sell securities under Taiwan Stock Exchange Operational Regulations Governing Securities Firms Recommending Trades in Securities to Customers. To the extent this is a report authored in whole or in part by a non-U.S. analyst and is made available in the U.S., the following are important disclosures regarding any non-U.S. analyst contributors:

13 April 2012
US Coal Sector 35
The non-U.S. research analysts listed below (if any) are not registered/qualified as research analysts with FINRA. The non-U.S. research analysts listed below may not be associated persons of CSSU and therefore may not be subject to the NASD Rule 2711 and NYSE Rule 472 restrictions on communications with a subject company, public appearances and trading securities held by a research analyst account. For Credit Suisse disclosure information on other companies mentioned in this report, please visit the website at www.credit-suisse.com/researchdisclosures or call +1 (877) 291-2683. Disclaimers continue on next page.

13 April 2012Americas / United States
Equity Research
US Coal Market Update Q2'12 v10.doc
This report is not directed to, or intended for distribution to or use by, any person or entity who is a citizen or resident of or located in any locality, state, country or other jurisdiction where such distribution, publication, availability or use would be contrary to law or regulation or which would subject Credit Suisse AG, the Swiss bank, or its subsidiaries or its affiliates (“CS”) to any registration or licensing requirement within such jurisdiction. All material presented in this report, unless specifically indicated otherwise, is under copyright to CS. None of the material, nor its content, nor any copy of it, may be altered in any way, transmitted to, copied or distributed to any other party, without the prior express written permission of CS. All trademarks, service marks and logos used in this report are trademarks or service marks or registered trademarks or service marks of CS or its affiliates. The information, tools and material presented in this report are provided to you for information purposes only and are not to be used or considered as an offer or the solicitation of an offer to sell or to buy or subscribe for securities or other financial instruments. CS may not have taken any steps to ensure that the securities referred to in this report are suitable for any particular investor. CS will not treat recipients as its customers by virtue of their receiving the report. The investments or services contained or referred to in this report may not be suitable for you and it is recommended that you consult an independent investment advisor if you are in doubt about such investments or investment services. Nothing in this report constitutes investment, legal, accounting or tax advice or a representation that any investment or strategy is suitable or appropriate to your individual circumstances or otherwise constitutes a personal recommendation to you. CS does not offer advice on the tax consequences of investment and you are advised to contact an independent tax adviser. Please note in particular that the bases and levels of taxation may change. CS believes the information and opinions in the Disclosure Appendix of this report are accurate and complete. Information and opinions presented in the other sections of the report were obtained or derived from sources CS believes are reliable, but CS makes no representations as to their accuracy or completeness. Additional information is available upon request. CS accepts no liability for loss arising from the use of the material presented in this report, except that this exclusion of liability does not apply to the extent that liability arises under specific statutes or regulations applicable to CS. This report is not to be relied upon in substitution for the exercise of independent judgment. CS may have issued, and may in the future issue, a trading call regarding this security. Trading calls are short term trading opportunities based on market events and catalysts, while stock ratings reflect investment recommendations based on expected total return over a 12-month period as defined in the disclosure section. Because trading calls and stock ratings reflect different assumptions and analytical methods, trading calls may differ directionally from the stock rating. In addition, CS may have issued, and may in the future issue, other reports that are inconsistent with, and reach different conclusions from, the information presented in this report. Those reports reflect the different assumptions, views and analytical methods of the analysts who prepared them and CS is under no obligation to ensure that such other reports are brought to the attention of any recipient of this report. CS is involved in many businesses that relate to companies mentioned in this report. These businesses include specialized trading, risk arbitrage, market making, and other proprietary trading. Past performance should not be taken as an indication or guarantee of future performance, and no representation or warranty, express or implied, is made regarding future performance. Information, opinions and estimates contained in this report reflect a judgement at its original date of publication by CS and are subject to change without notice. The price, value of and income from any of the securities or financial instruments mentioned in this report can fall as well as rise. The value of securities and financial instruments is subject to exchange rate fluctuation that may have a positive or adverse effect on the price or income of such securities or financial instruments. Investors in securities such as ADR’s, the values of which are influenced by currency volatility, effectively assume this risk. Structured securities are complex instruments, typically involve a high degree of risk and are intended for sale only to sophisticated investors who are capable of understanding and assuming the risks involved. The market value of any structured security may be affected by changes in economic, financial and political factors (including, but not limited to, spot and forward interest and exchange rates), time to maturity, market conditions and volatility, and the credit quality of any issuer or reference issuer. Any investor interested in purchasing a structured product should conduct their own investigation and analysis of the product and consult with their own professional advisers as to the risks involved in making such a purchase. Some investments discussed in this report have a high level of volatility. High volatility investments may experience sudden and large falls in their value causing losses when that investment is realised. Those losses may equal your original investment. Indeed, in the case of some investments the potential losses may exceed the amount of initial investment, in such circumstances you may be required to pay more money to support those losses. Income yields from investments may fluctuate and, in consequence, initial capital paid to make the investment may be used as part of that income yield. Some investments may not be readily realisable and it may be difficult to sell or realise those investments, similarly it may prove difficult for you to obtain reliable information about the value, or risks, to which such an investment is exposed. This report may provide the addresses of, or contain hyperlinks to, websites. Except to the extent to which the report refers to website material of CS, CS has not reviewed the linked site and takes no responsibility for the content contained therein. Such address or hyperlink (including addresses or hyperlinks to CS’s own website material) is provided solely for your convenience and information and the content of the linked site does not in any way form part of this document. Accessing such website or following such link through this report or CS’s website shall be at your own risk. This report is issued and distributed in Europe (except Switzerland) by Credit Suisse Securities (Europe) Limited, One Cabot Square, London E14 4QJ, England, which is regulated in the United Kingdom by The Financial Services Authority (“FSA”). This report is being distributed in Germany by Credit Suisse Securities (Europe) Limited Niederlassung Frankfurt am Main regulated by the Bundesanstalt fuer Finanzdienstleistungsaufsicht ("BaFin"). This report is being distributed in the United States by Credit Suisse Securities (USA) LLC ; in Switzerland by Credit Suisse AG; in Canada by Credit Suisse Securities (Canada), Inc.; in Brazil by Banco de Investimentos Credit Suisse (Brasil) S.A. or its affiliates; in Mexico by Banco Credit Suisse (México), S.A. (transactions related to the securities mentioned in this report will only be effected in compliance with applicable regulation); in Japan by Credit Suisse Securities (Japan) Limited, Financial Instrument Firm, Director-General of Kanto Local Finance Bureau (Kinsho) No. 66, a member of Japan Securities Dealers Association, The Financial Futures Association of Japan, Japan Securities Investment Advisers Association, Type II Financial Instruments Firms Association; elsewhere in Asia/Pacific by whichever of the following is the appropriately authorised entity in the relevant jurisdiction: Credit Suisse (Hong Kong) Limited, Credit Suisse Equities (Australia) Limited , Credit Suisse Securities (Thailand) Limited, Credit Suisse Securities (Malaysia) Sdn Bhd, Credit Suisse AG, Singapore Branch, Credit Suisse Securities (India) Private Limited regulated by the Securities and Exchange Board of India (registration Nos. INB230970637; INF230970637; INB010970631; INF010970631), having registered address at 9th Floor, Ceejay House,Dr.A.B. Road, Worli, Mumbai - 18, India, T- +91-22 6777 3777, Credit Suisse Securities (Europe) Limited, Seoul Branch, Credit Suisse AG, Taipei Securities Branch, PT Credit Suisse Securities Indonesia, Credit Suisse Securities (Philippines ) Inc., and elsewhere in the world by the relevant authorised affiliate of the above. Research on Taiwanese securities produced by Credit Suisse AG, Taipei Securities Branch has been prepared by a registered Senior Business Person. Research provided to residents of Malaysia is authorised by the Head of Research for Credit Suisse Securities (Malaysia) Sdn. Bhd., to whom they should direct any queries on +603 2723 2020. In jurisdictions where CS is not already registered or licensed to trade in securities, transactions will only be effected in accordance with applicable securities legislation, which will vary from jurisdiction to jurisdiction and may require that the trade be made in accordance with applicable exemptions from registration or licensing requirements. Non-U.S. customers wishing to effect a transaction should contact a CS entity in their local jurisdiction unless governing law permits otherwise. U.S. customers wishing to effect a transaction should do so only by contacting a representative at Credit Suisse Securities (USA) LLC in the U.S. Please note that this report was originally prepared and issued by CS for distribution to their market professional and institutional investor customers. Recipients who are not market professional or institutional investor customers of CS should seek the advice of their independent financial advisor prior to taking any investment decision based on this report or for any necessary explanation of its contents. This research may relate to investments or services of a person outside of the UK or to other matters which are not regulated by the FSA or in respect of which the protections of the FSA for private customers and/or the UK compensation scheme may not be available, and further details as to where this may be the case are available upon request in respect of this report. Any Nielsen Media Research material contained in this report represents Nielsen Media Research's estimates and does not represent facts. NMR has neither reviewed nor approved this report and/or any of the statements made herein. If this report is being distributed by a financial institution other than Credit Suisse AG, or its affiliates, that financial institution is solely responsible for distribution. Clients of that institution should contact that institution to effect a transaction in the securities mentioned in this report or require further information. This report does not constitute investment advice by Credit Suisse to the clients of the distributing financial institution, and neither Credit Suisse AG, its affiliates, and their respective officers, directors and employees accept any liability whatsoever for any direct or consequential loss arising from their use of this report or its content. Copyright 2012 CREDIT SUISSE AG and/or its affiliates. All rights reserved.