u.s. census and american community survey overview open a web browser and go to:
TRANSCRIPT

U.S. Census and American Community Survey Overview
Open a web browser and go to:
http://tinyurl.com/tufts-census

US Census Bureau Collection Methods
Three basic methods of collection Census (100%) Survey (sample) Administrative records

Two Types of Census by the US Decennial census: population and housing
On the 0’s (2000, 2010) Economic census: business and industry
On the 2’s and 7’s (2002, 2007, 2012)
Census = the enumeration of entire population or universe of collection units such as housing units or businesses
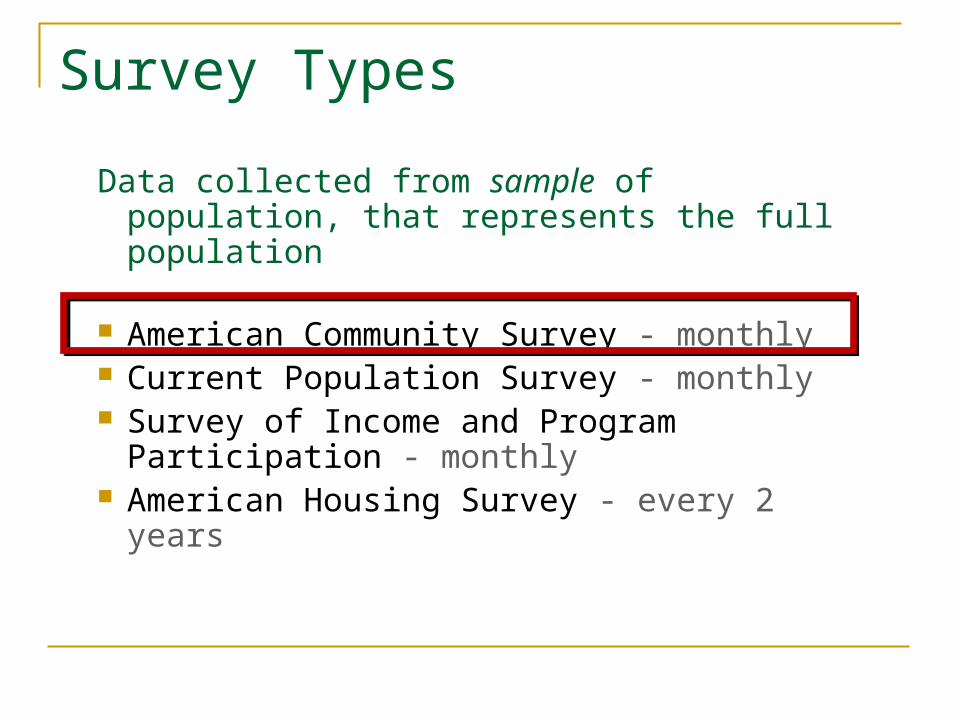
Survey Types
Data collected from sample of population, that represents the full population
American Community Survey - monthly Current Population Survey - monthly Survey of Income and Program
Participation - monthly American Housing Survey - every 2
years

Administrative Records
Some programs use administrative records (e.g., births and deaths, Medicare, Social Security, IRS, Customs Service)
Population estimates and projections County Business Patterns Exports/Imports

Most important for you:
Decennial Census
Once every 10 years 100% count* Very small sampling error Basic information on
population, race/Hispanic ethnicity, age, family structure, housing units, owner/renter housing tenure
American Community Survey Released yearly with
rolling multi-year averages Sample survey High sampling error for
small areas (e.g., neighborhood level)
Detailed information on income, education, commute, place of birth, etc.

We will focus on:
The 2010 Census
The American Community Survey (ACS)
How to map census / ACS data in Social Explorer
Understanding sampling error for the ACS

Let’s take a look at the 2010 Census form…

Why does the government ask these questions?
This book is a good guide…

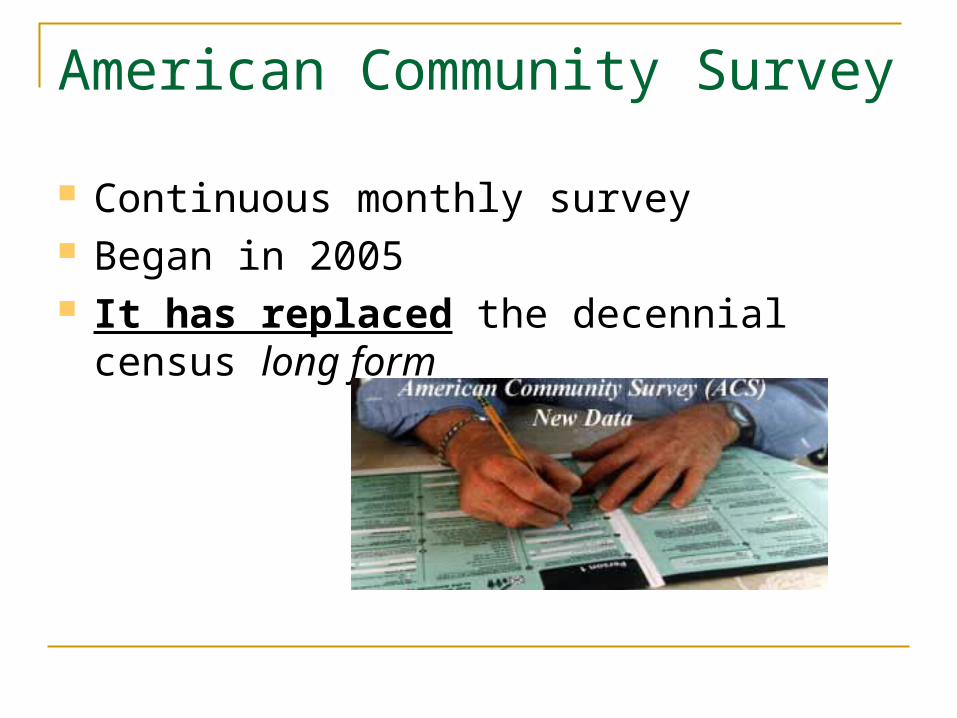
American Community Survey
Continuous monthly survey Began in 2005 It has replaced the decennial census long
form

Look at the American Community Survey Questionnaire


What have we learned so far?

Open Social Explorer

Open Social Explorer

Open Social Explorer

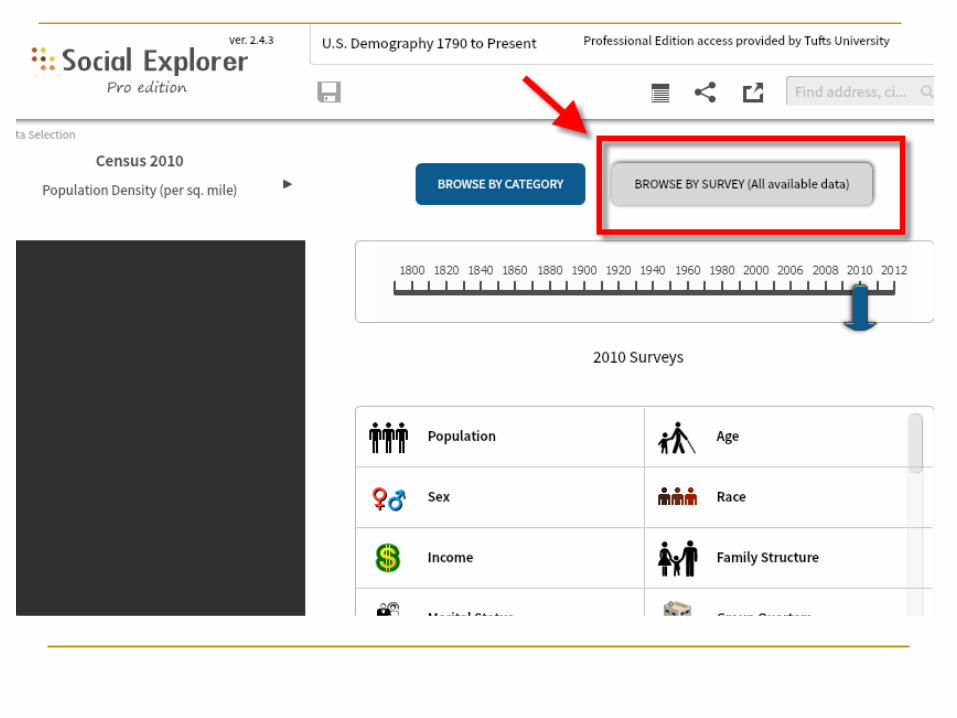

Basic types of information from the Census 100% SF1 data

Explore the basic types of information from the Census 2010 100% data

More Census 2010….
This is all data from the 100% Census

Explore mapping population 85 and older

Explore mapping population 85 and older…

Explore mapping population 85 and older…

Explore mapping population 85 and older…

Population 85+ by state…

Change preferred geography to census tracts

Population 85+ by census tract…
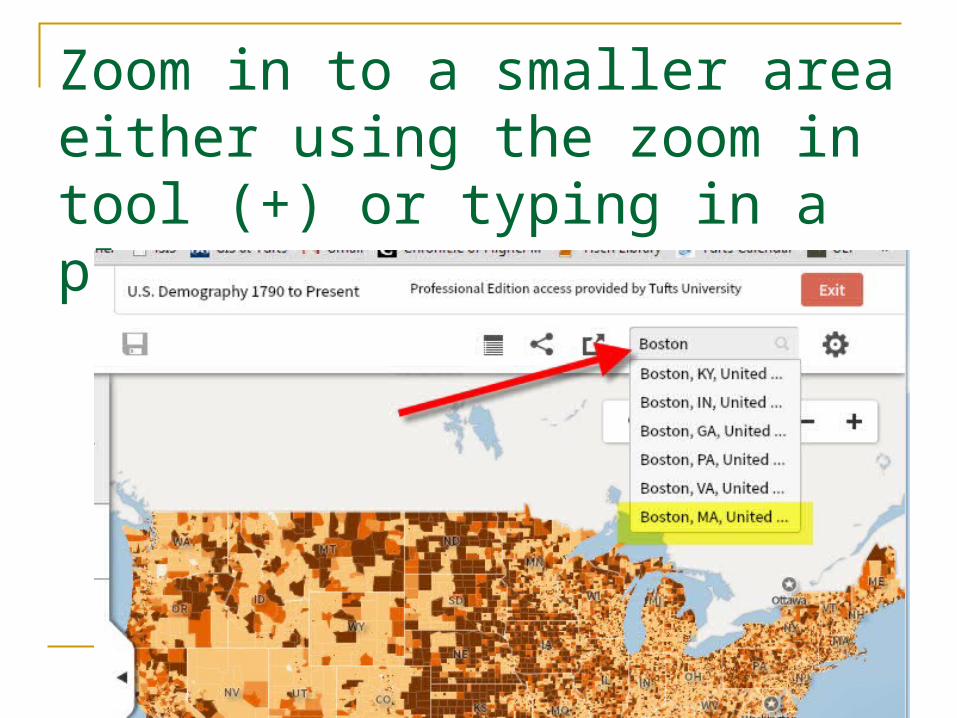
Zoom in to a smaller area either using the zoom in tool (+) or typing in a place name
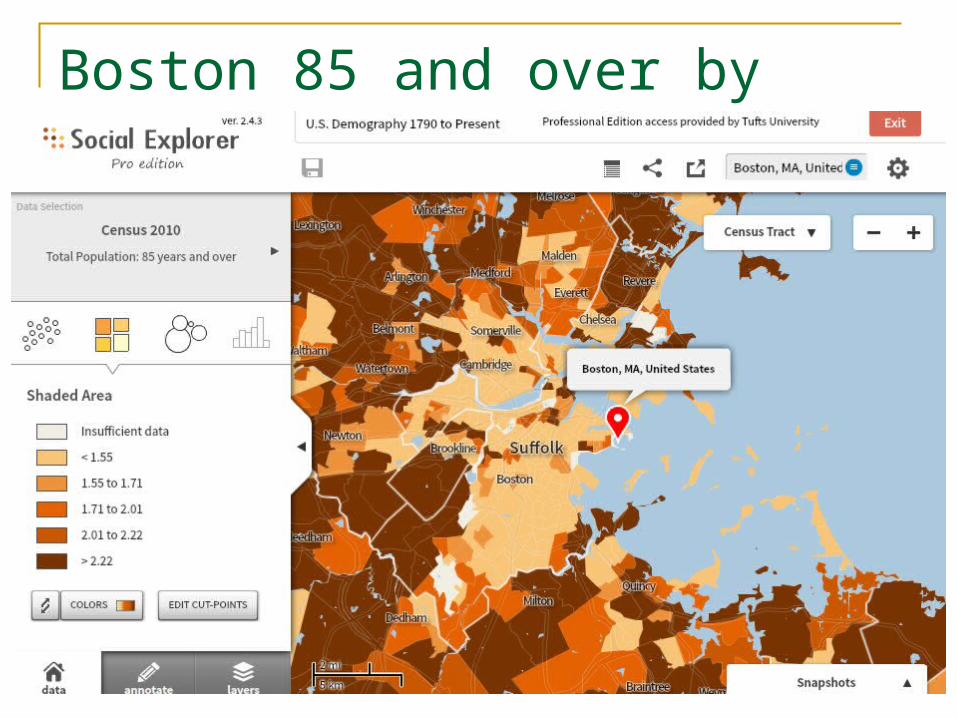
Boston 85 and over by census tract…

Now let’s look at ACS data…
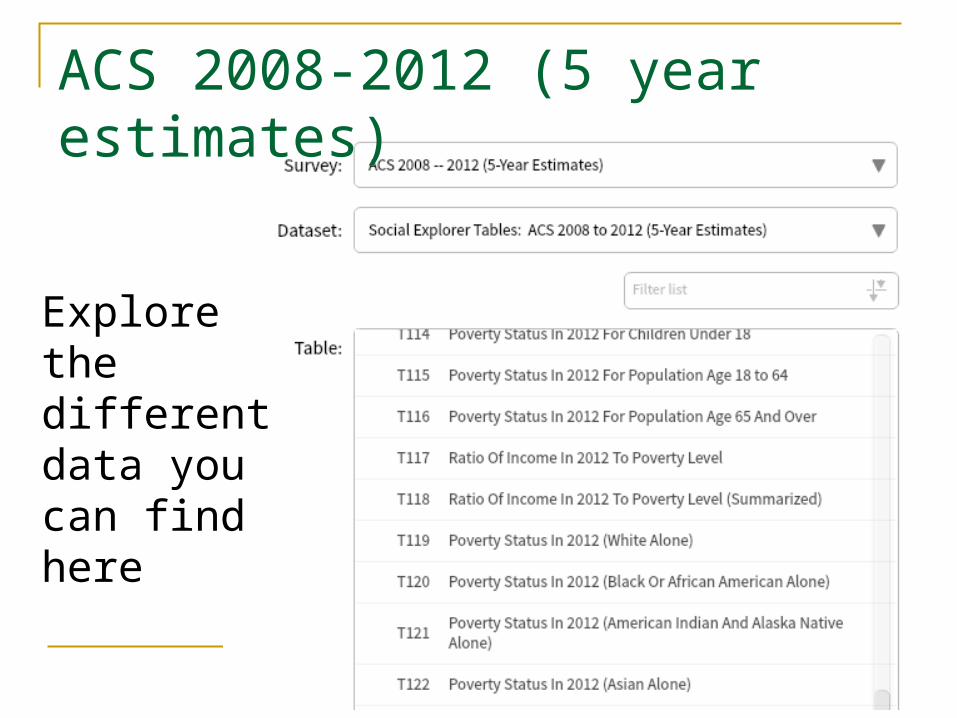
ACS 2008-2012 (5 year estimates)
Explore the different data you can find here
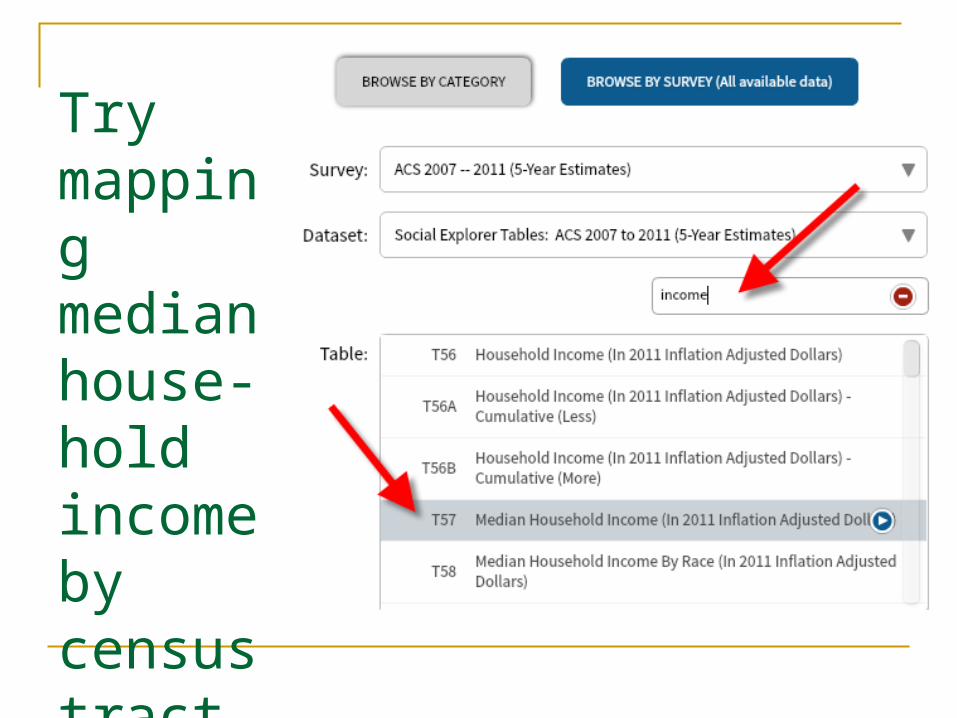
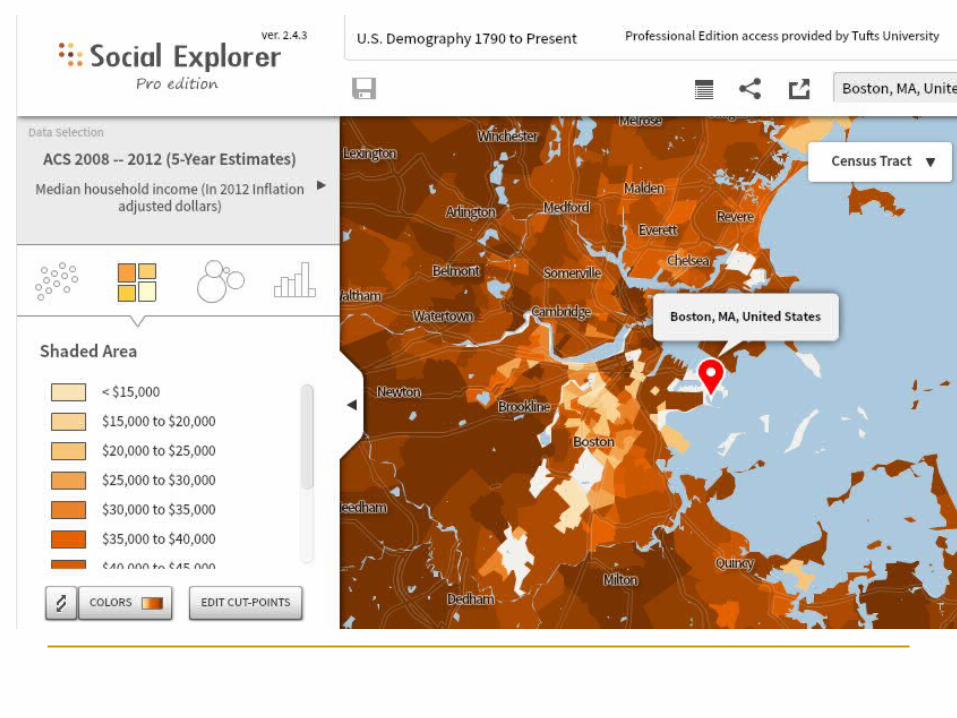
Try mapping median house-hold incomeby census tract
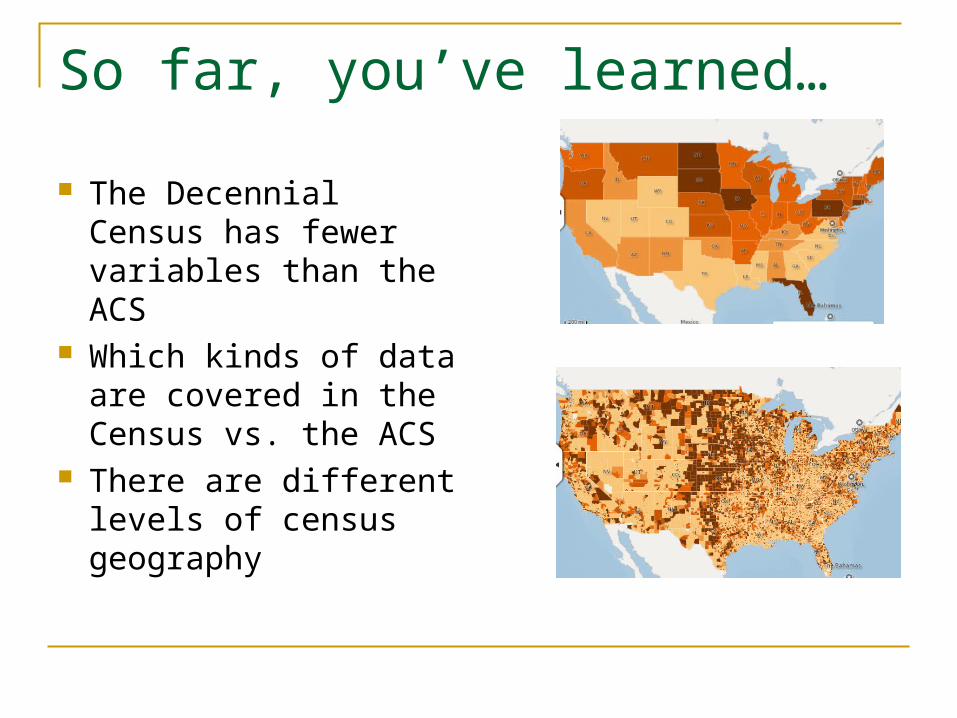
So far, you’ve learned…
The Decennial Census has fewer variables than the ACS
Which kinds of data are covered in the Census vs. the ACS
There are different levels of census geography

Census Tabulations
The Census Bureau makes the data accessible by releasing tabulations tabulations are aggregations of the data in ways
that are useful for most users The tabulations are for various levels of
geography, e.g., Census block, blockgroup, tract City, County Metropolitan areas States

Census Geography

Census Blocks

Census Block Groups

Census Tracts

Blocks
Smallest units of data tabulation Cover the entire nation Do not cross census tracts or counties Generally bounded by visible features and
legal boundaries Size: average about 100 people
Block Groups
Groups of blocks sharing the same first digit Smallest areas for which sample data
available Size: optimally 1,500 people, range between
300 to 3,000

Census Tracts
For the first time for Census 2000: Cover the nation
Relatively homogenous population characteristics
65,000 Census tracts across U.S. Size: optimally 4,000 people, range between
1,000 and 8,000

Census Blocks

Census Block Groups

Census Tracts

Census Geography

Census Geography

Some other important definitions and concepts

Housing Unit
A house, an apartment, a mobile home or trailer, a group of rooms, or a single room occupied as separate living quarters, or if vacant, intended for occupancy as separate living quarters.
Separate living quarters are those in which the occupants live separately from any other individuals in the building and which have direct access from outside the building or through a common hall. For vacant units, the criteria of separateness and direct access are applied to the intended occupants whenever possible.

Living Quarters
Housing unit: unit occupied as separate living quarters, or, if vacant, is intended for occupancy as a separate living quarters
Group quarters Institutionalized population (such as
correctional institutions, nursing homes, and juvenile institutions)
Noninstitutionalized population (such as college dormitories, military quarters, and group homes)

Household
Household: all persons who occupy a housing unit
Householder: the member of a household who lives at the housing unit and owns or rents the living quarters
Important: housing unit and household are TWO different things! Don’t get them confused!

Two Types of Households
Family Household: householder plus all persons in the household related by blood, marriage, or adoptionCan also include: Subfamily Example: householder’s son and
daughter-in-law Nonrelative Example: roomers, boarders
Nonfamily Household: persons living alone or with nonrelatives only

The “universe” for each variable The total number of units, e.g., individuals,
households, businesses, in the population of interest.
This is important for understanding percentages
Know your “universe”! Make sure you understand what is the universe.

Barnstable County, MA

Barnstable County, MA
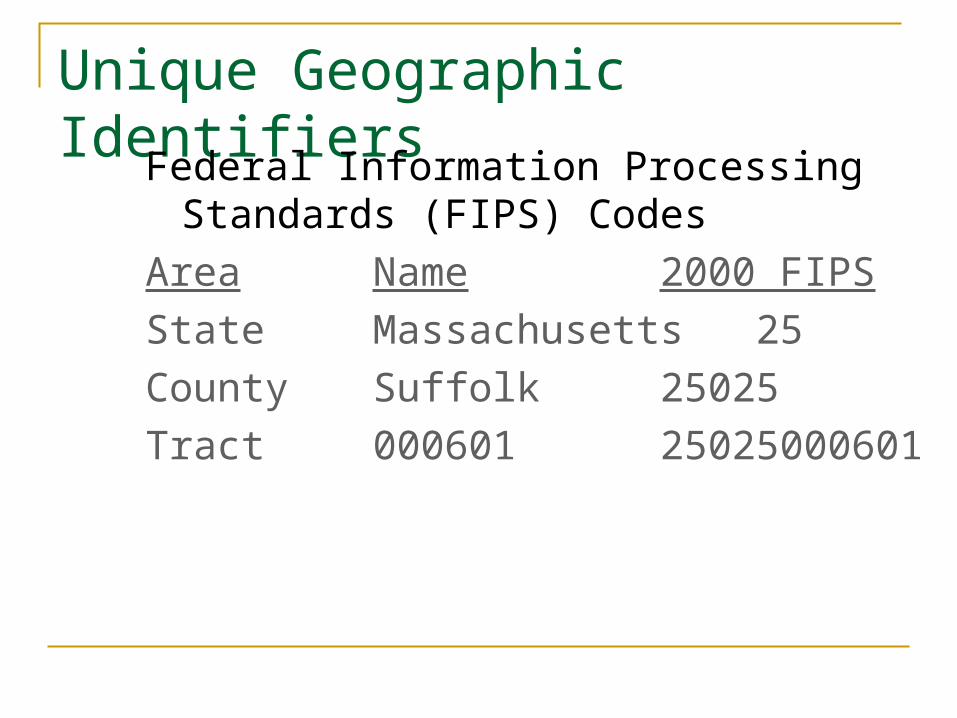
Unique Geographic Identifiers
Federal Information Processing Standards (FIPS) Codes
Area Name 2000 FIPS
State Massachusetts 25
CountySuffolk 25025
Tract 000601 25025000601

Use Social Explorer to map data at different census geography levels

IMPORTANT: ACS Release Schedule – data is released as averages: 1 Year – areas with a population 65,000+ 3 Years – areas with a population 20,000+ 5 Years - all other areas (including census
tracts and blockgroups)
E.g., average median household income for 2008-2012 (released December, 2013)

Huh????

Let’s see an ACS 1-year estimate…
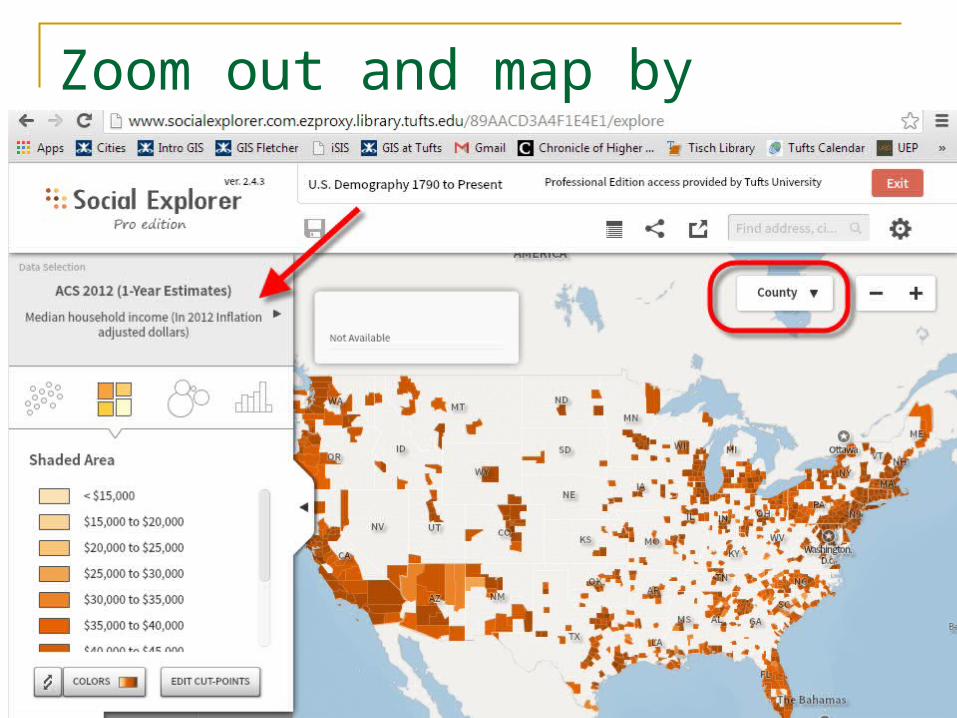
Zoom out and map by County…

Lots of counties have less than 65,000 people!

IMPORTANT: ACS Release Schedule – data is released as averages: 1 Year – areas with a population 65,000+ 3 Years – areas with a population 20,000+ 5 Years - all other areas (including census
tracts and blockgroups)
E.g., average median household income for 2008-2012 (released December, 2013)

Try mapping the most recent ACS 3-year estimates
Median household income by county

More counties are mapped…the ones with at least 20,000 people

IMPORTANT: ACS Release Schedule – data is released as averages: 1 Year – areas with a population 65,000+ 3 Years – areas with a population 20,000+ 5 Years - all other areas (including census
tracts and blockgroups)
E.g., average median household income for 2008-2012 (released December, 2013)

Now map median household by county using the ACS 5-year 2008-2012 estimates…

And while you’re at it, map 5 classes by quantiles…
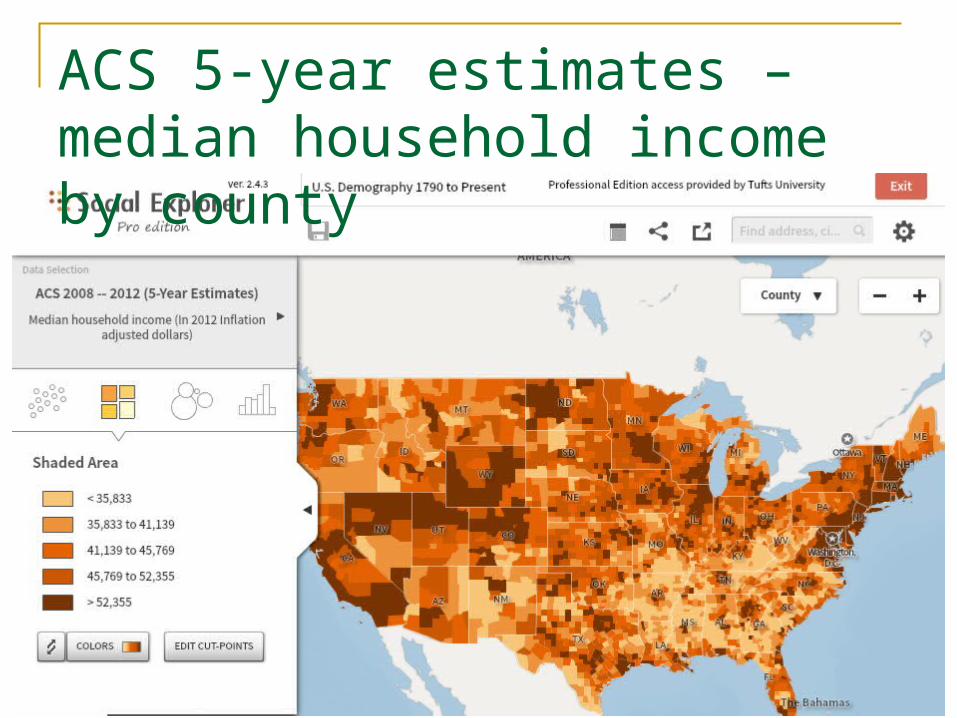
ACS 5-year estimates – median household income by county

ACS 5-year estimates – all counties have data

IMPORTANT: ACS Release Schedule – data is released as averages: 1 Year – areas with a population 65,000+ 3 Years – areas with a population 20,000+ 5 Years - all other areas (including census
tracts and blockgroups)
E.g., average median household income for 2008-2012 (released December, 2013)

To map by tract you HAVE to use the ACS 5-year estimates!!

If you don’t believe me, you can try…

Warning: there is a BIG problem for neighborhood level analysis…

The decennial census data at the census block, block group and tract level is very reliable – why?

But the ACS is very problematic for those small areas. Why?

ACS and Margin of Error
Means of transportation for commute – Tract Level - ACS 2005-2009 5 year estimatesUniverse is workers 16 and over
Workers 16 and Over

From 1940 to 2000Each census had two types of questionnaires A short form
“100-Percent” data 7 basic questions Called SF1 data
A long form (now replaced by the American Community Survey) Sample data 54 detailed questions 1 in 6 households Called SF3 data

Comparison of old way and new wayLong Form Once a decade, with
decennial census Went to 1 in 6 houses Smaller MOE MOE was not published Got out of date Data was a snapshot of
one time (April 1st of the census year)
ACS Continuous survey Goes to 1 in ?? Houses Larger MOE MOE is published (so we
know, yikes!) More up to date Data is averaged over
time (e.g., 5 year rolling estimates)

So let’s understand the margin of error…

What is Sampling Error?
Definition
The uncertainty associated with an estimate that is based on data gathered from a sample of the population rather than the full population
88

Illustration of Sampling ErrorEstimate average number of children per household for a population with 3 households living in a block:
Household A has 1 child
Household B has 2 children
Household C has 3 children
The block average based on the full population is two children per household: (1+2+3)/3
89

Conceptualizing Sampling ErrorThree different samples of 2 households:
1. Households A and B (1 child, 2 children)
2. Households B and C (2 children, 3 children)3. Households A and C (1 child, 3 children)
Three different averages based on which sample is used:
1. (1 + 2) / 2 = 1.5 children
2. (2 + 3) / 2 = 2.5 children
3. (1 + 3) / 2 = 2 children
90

Sampling Error
Census 2010 is a 100% survey so has smaller error
ACS data is based on samples – error is larger
The smaller the geography, the larger the error (because the sample is smaller)
Especially true for variables that sample a small number of people, e.g., bike commuters
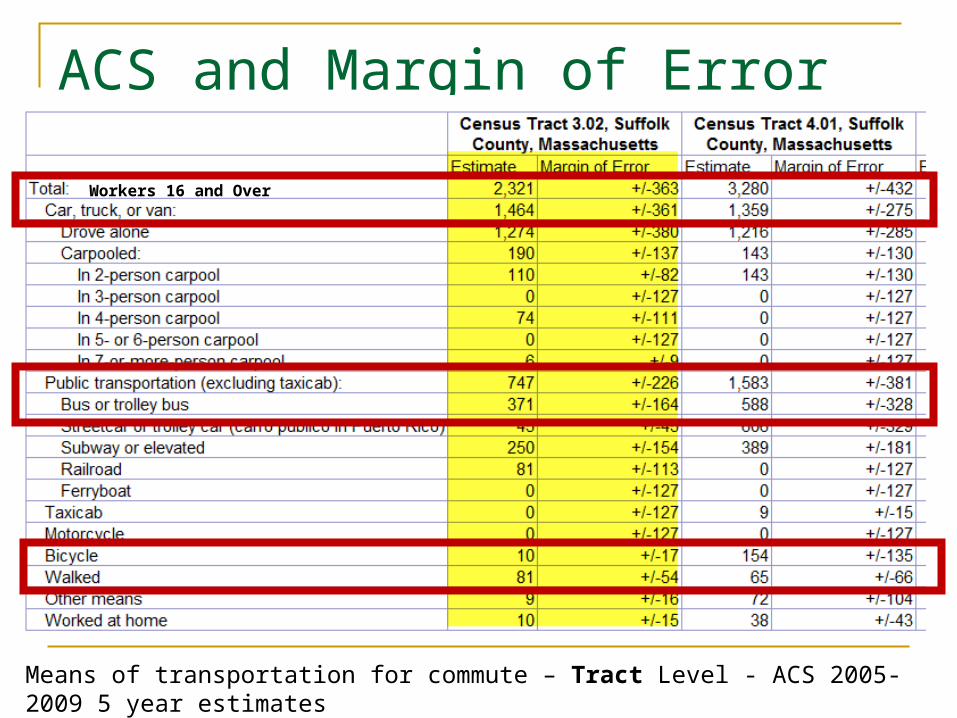
ACS and Margin of Error
Means of transportation for commute – Tract Level - ACS 2005-2009 5 year estimatesUniverse is workers 16 and over
Workers 16 and Over

Bottom line for ACS More up to date information Continuous versus point in time
measurement 5 year estimates are the most reliable
because they have the largest samples But…
Poorer precision at finer scales (e.g., census tract) or areas of low population (rural areas)
Poorer precision for variables with low numbers (e.g., people who bike to work)

How can I see the margin of error? Go to the Census web site (census.gov)
Click on the Data Tab and choose American Fact Finder


Choose a topic…

Click Next when you’ve chosen a topic…


Bottom line…ACS data at the tract level can be highly unreliable!

Researchers are just beginning to understand the implications of this…

What have you learned?

Take home points There are two major Census Bureau products
used for neighborhood analysis: The Decennial Census
Basic data By block, block group, and tract Once a decade, one point in time
The American Community Survey Lots of interesting data By block group and tract – but likely unreliable at those
levels! More up to date – 5-year rolling estimates

Policy Map is another mapping tool…
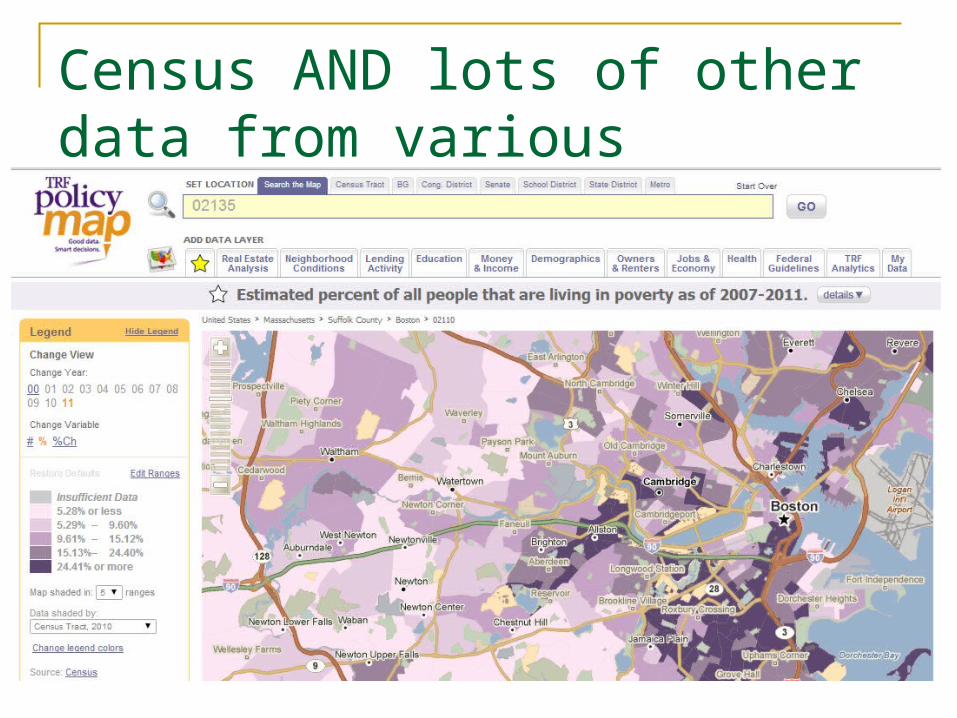
Census AND lots of other data from various agencies and organizations…
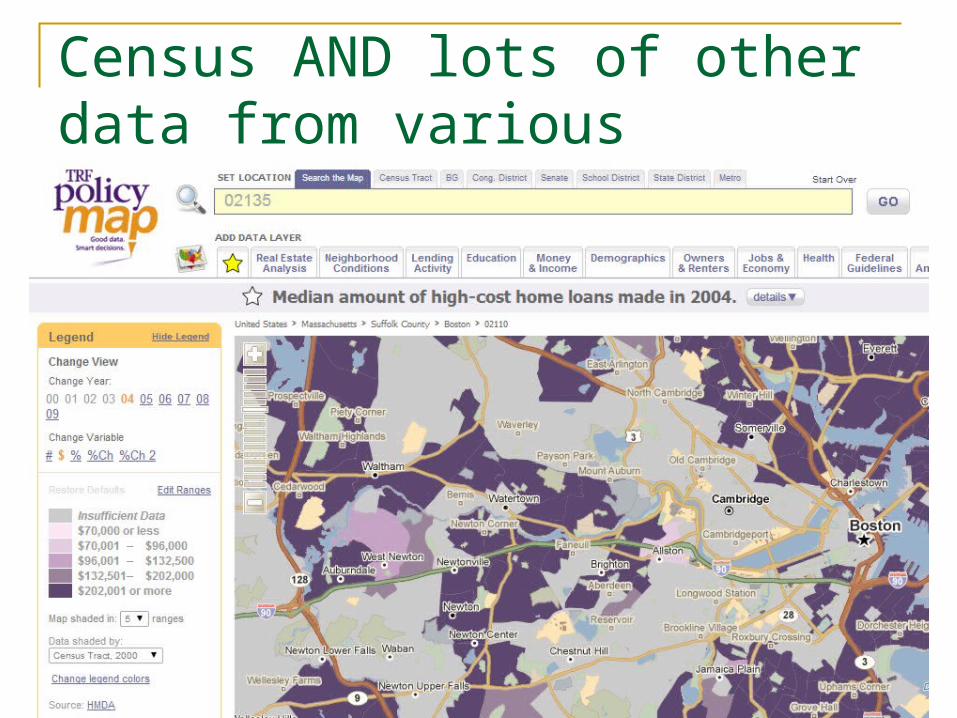
Census AND lots of other data from various agencies and organizations…
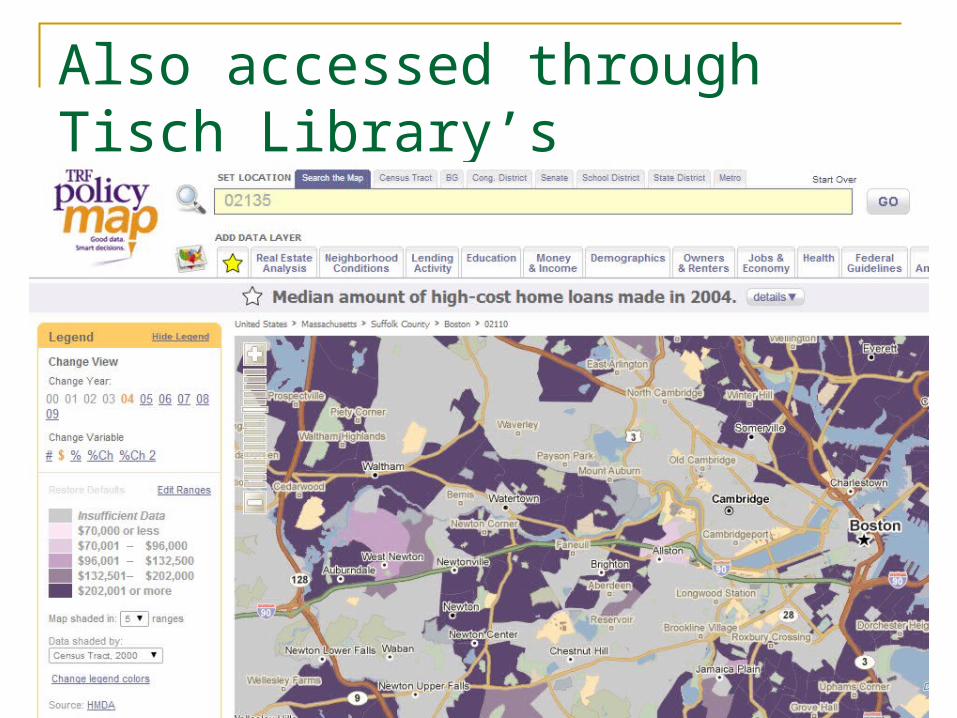
Also accessed through Tisch Library’s databases…

Take home points Social Explorer is a useful mapping,
presentation, and reporting tool for current and historical census data
Policy Map is another interesting tool for current and recent census data, as well as other policy-related data
So far, only the Census web site via American Fact Finder will show the margin of error information