u.s. – canada trade: opportunities through nafta and beyond
DESCRIPTION
U.S. – Canada Trade: Opportunities Through NAFTA and Beyond. Andrew I. Rudman Office of NAFTA & Inter-American Affairs International Trade Administration U.S. DEPARTMENT OF COMMERCE Northern Networks Trade Conference Duluth, MN October 18, 2006. TOP 10 U.S. TRADING PARTNERS 2005. - PowerPoint PPT PresentationTRANSCRIPT
U.S. – Canada Trade: Opportunities Through NAFTA and Beyond
Andrew I. RudmanOffice of NAFTA & Inter-American Affairs
International Trade AdministrationU.S. DEPARTMENT OF COMMERCE
Northern Networks Trade ConferenceDuluth, MN
October 18, 2006

TOP 10 U.S. TRADING PARTNERS2005
211.3
41.8 55.4 34.1 38.6 27.7 22 22.4 10.4
287.9
170.2
243.5
138.1
84.843.8 34.8 33.8
33.7
120.0 51.1
$0
$100
$200
$300
$400
$500
$600
BIL
LIO
N D
OLLARS
EXPORTS IMPORTS Source: U.S. Bureau of Census
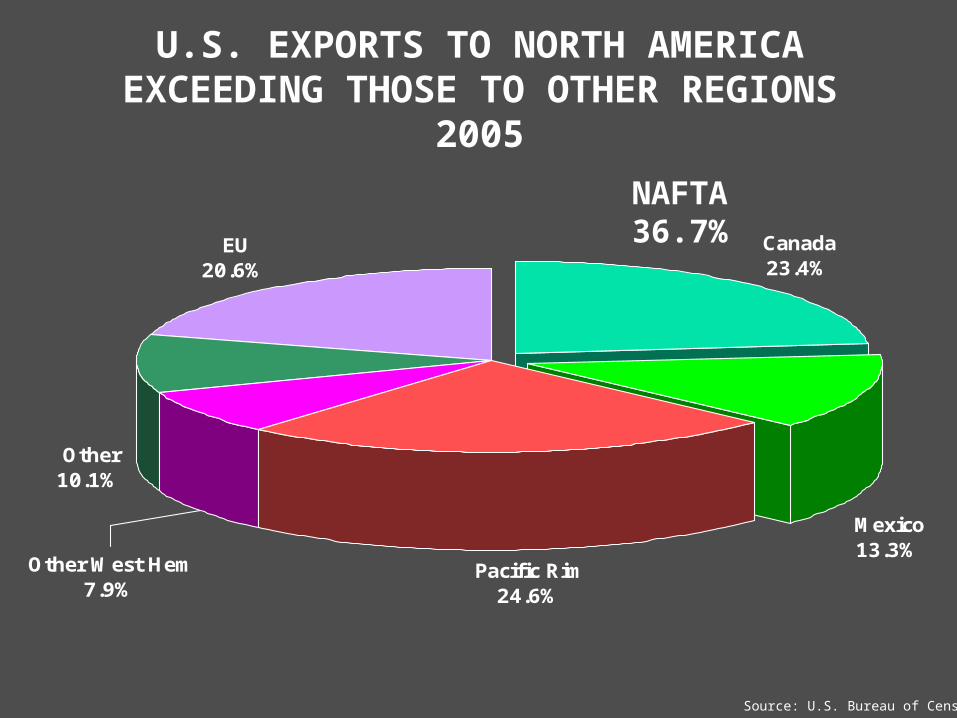
U.S. EXPORTS TO NORTH AMERICAEXCEEDING THOSE TO OTHER REGIONS
2005
Canada23.4%
Pacific Rim24.6%
Other10.1%
EU20.6%
Mexico13.3%
Other West Hem7.9%
Source: U.S. Bureau of Census
NAFTA 36.7%
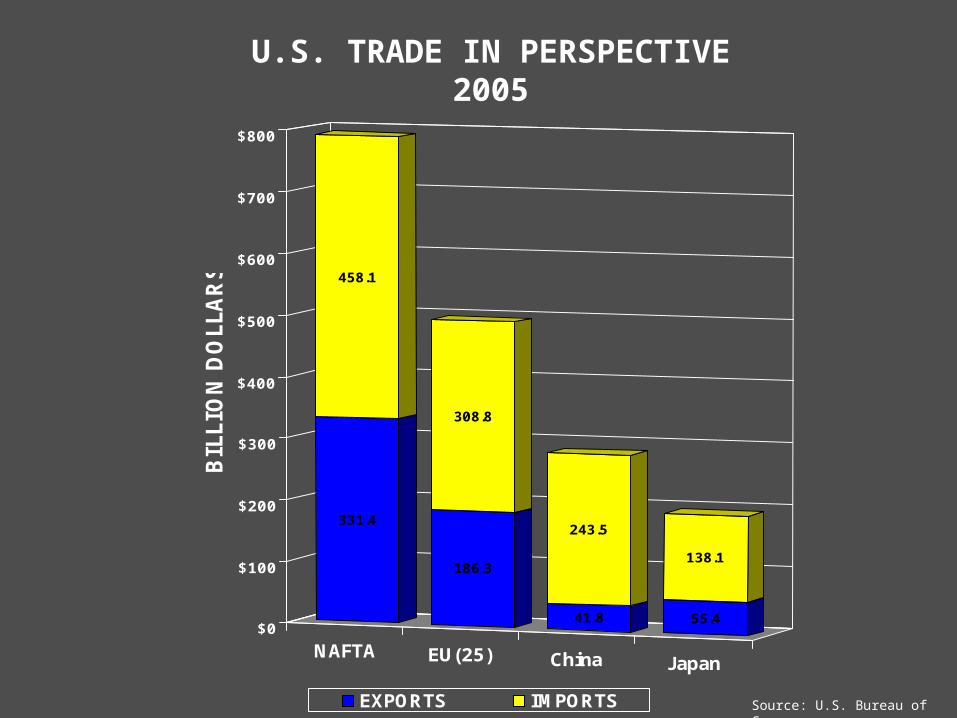
U.S. TRADE IN PERSPECTIVE2005
NAFTA EU(25) China Japan
331.4
458.1
186.3
308.8
41.8
243.5
55.4
138.1
$0
$100
$200
$300
$400
$500
$600
$700
$800
BIL
LIO
N D
OLL
AR
S
EXPORTS IMPORTS Source: U.S. Bureau of Census
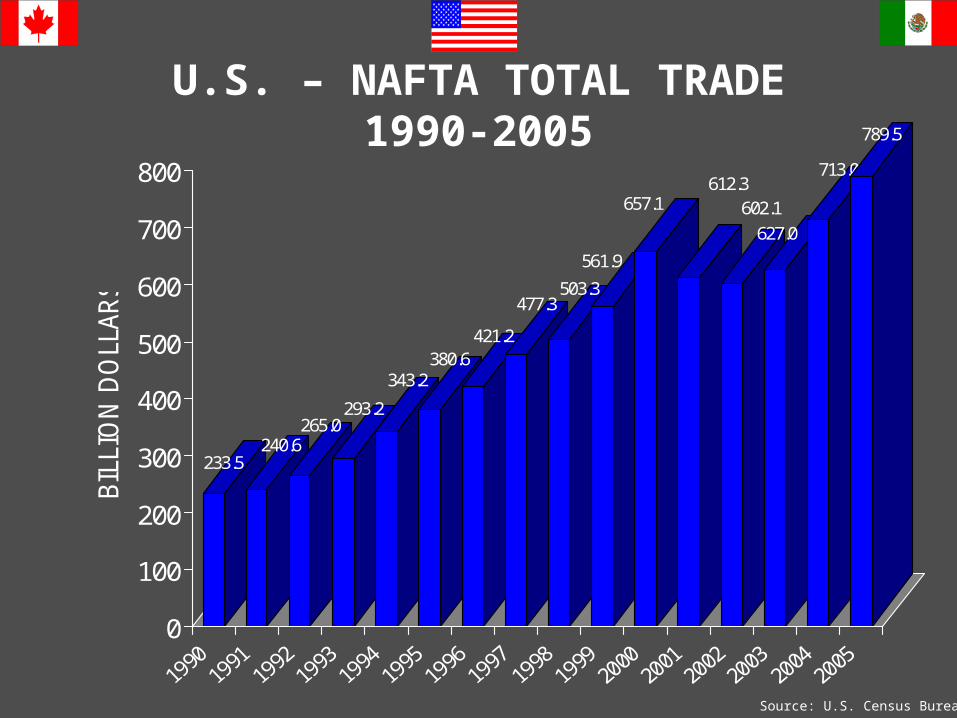
U.S. – NAFTA TOTAL TRADE1990-2005
Source: U.S. Census Bureau
233.5240.6
265.0293.2
343.2380.6
421.2
477.3503.3
561.9
657.1612.3
602.1
627.0
713.0
789.5
0
100
200
300
400
500
600
700
800
BIL
LIO
N D
OLL
ARS

Most comprehensive Regional Trade Agreement signed by the United States
Exports to NAFTA are outpacing rest of world NAFTA trade has increased by over $496 billion since 1993 to
$789.5 billion in 2005 Combined trade is $2.2 billion a day between NAFTA partners,
that’s $1.5 million a minute U.S. two-way merchandise trade with Canada and Mexico more
than exceeds U.S. two-way merchandise trade with the European Union (25) and Japan combined
U.S. exports to Mexico are greater than U.S. exports to Mercosur and the Andean region combined.
NAFTA TRADE IN PERSPECTIVE
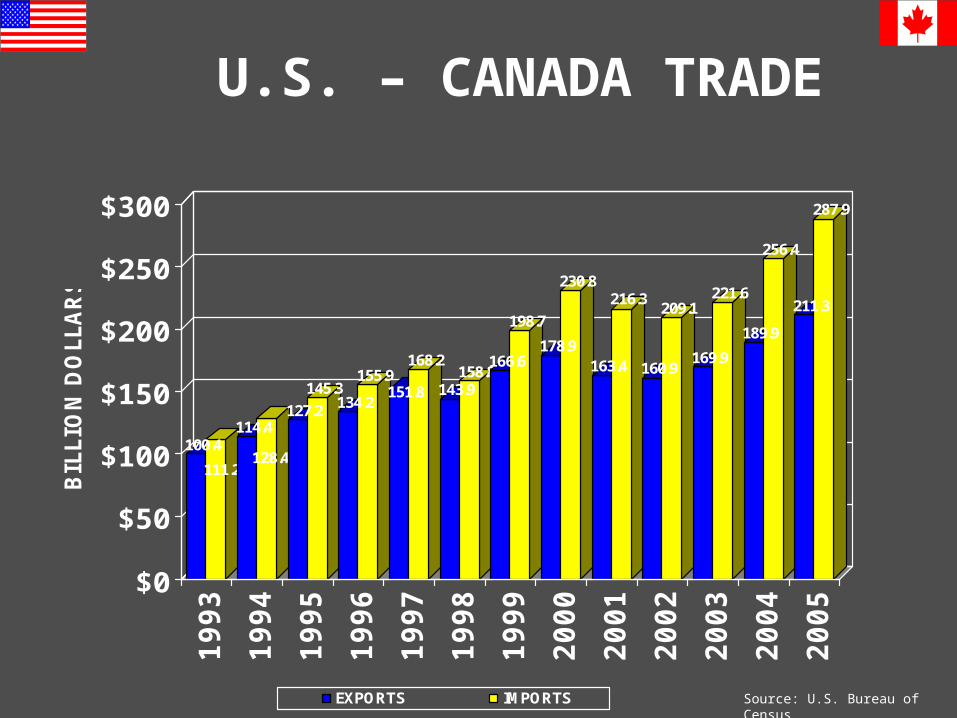
U.S. – CANADA TRADE
100.4
111.2
114.4
128.4
127.2
145.3134.2
155.9151.8
168.2
143.9158.8
166.6
198.7
178.9
230.8
163.4
216.3
160.9
209.1
169.9
221.6
189.9
256.4
211.3
287.9
$0
$50
$100
$150
$200
$250
$300
BIL
LIO
N D
OLL
AR
S
1993
1994
1995
1996
1997
1998
1999
2000
2001
2002
2003
2004
2005
EXPORTS IMPORTS Source: U.S. Bureau of Census
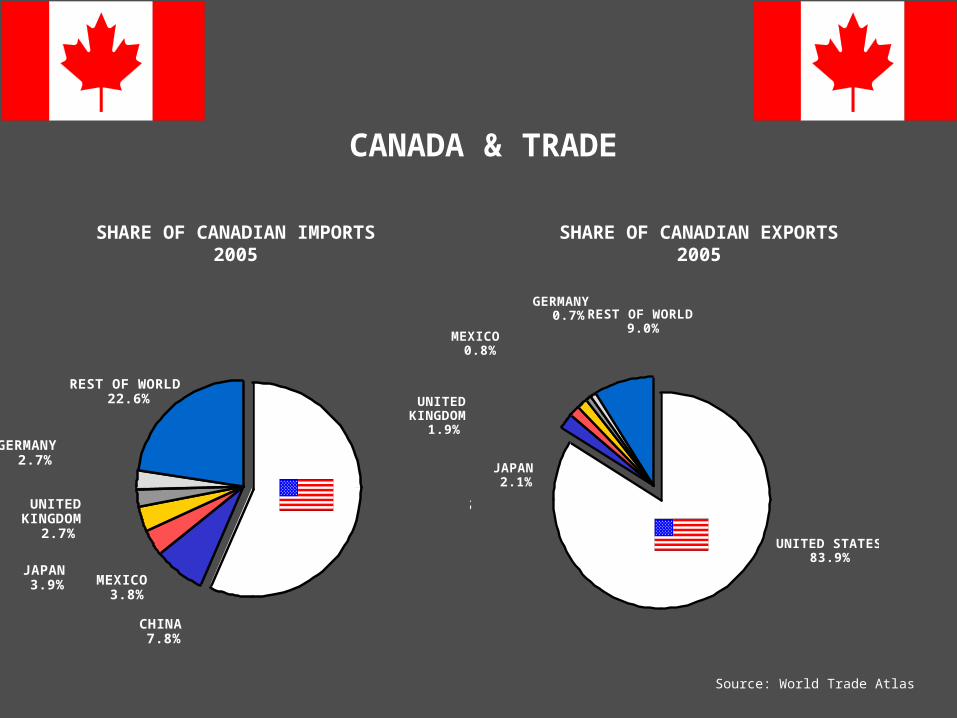
CHINA1.6%
REST OF WORLD9.0%
GERMANY0.7%
MEXICO0.8%
UNITED STATES83.9%
UNITED KINGDOM
1.9%
JAPAN2.1%
UNITED STATES56.5%
REST OF WORLD22.6%
MEXICO3.8%
JAPAN3.9%
UNITED KINGDOM
2.7%
GERMANY2.7%
CHINA7.8%
CANADA & TRADE
SHARE OF CANADIAN IMPORTS2005
SHARE OF CANADIAN EXPORTS2005
Source: World Trade Atlas

CANADA & ENERGY
In 2005, Canada had a reported 178.8 billion barrels of proven oil reserves, second only to Saudi Arabia.
However, the bulk of these reserves (over 95%) are oil sands deposits in Alberta.
Nevertheless, during January-November 2005, the top supplier in the world of crude oil to the United States was Canada (1.6 million bbl/d).
More than 80 percent of U.S. natural gas imports come from Canada, mainly from the western provinces of Alberta, British Columbia, and Saskatchewan.
Canada enjoys a vigorous electricity trade with the U.S., and the electricity networks of the two countries are heavily integrated.
Source: U.S. Department of Energy

NAFTA SUCCESSES
LEVELED THE PLAYING FIELD CANADA: Duty-free in 1998 MEXICO: Virtually duty-free; average Mexican tariff has fallen
from 10% to 2% all tariffs to be eliminated by 2008
STIMULATED TRADE GROWTH U.S. exports to NAFTA partners have grown by 133% For Canada up 110% for Mexico up 188%

MINNESOTA & TRADE

MINNESOTA & TRADE
NAFTA: Exports from Minnesota to Canada & Mexico reached $4.1 billion in 2005, an increase of 101% since 1993 when exports were $2.1 billion.
NAFTA: Over 28% of Minnesota’s exports go to the NAFTA region.
CANADA: Canada is Minnesota’s #1 export market 24.4 percent of its exports go to Canada. In 2005 it exported $3.6 billion.
CAFTA-DR: Exports from Minnesota reached $81.4 million in 2005.
U.S. Peru TPA: Exports from Minnesota reached $19.8 million in 2005.
U.S.-Colombia TPA: Exports from Minnesota reached $38.9 million.

SHARE OF MINNESOTA’S MERCHANDISE EXPORTS , 2005
28 PERCENT WENT TO NAFTA
NAFTA28.1%
IRELAND9.3%
JAPAN6.0%
REST OF WORLD51.6%
CHINA5.0%
Source: U.S. Bureau of Census

The SPP- What Is It?
The Goal: ensure North America- Best and safest place to live, work and do business Maintains NORTH AMERICAN ADVANTAGE in era of global
sourcing
Builds on the NAFTA, P4P, and border initiatives to: Better protect citizens from man-made and natural threats Promote safe and efficient movement of people and goods
The SPP consists of an economic and a security component
Based on the principle that our common prosperity depends on our mutual security
Expands economic opportunities by reducing barriers and making our businesses more competitive in the global marketplace

The SPP- What Is It?
The SPP is meant to:
Cut red tape, lower costs for manufacturers by eliminating unnecessary barriers
Enhance our mutual efforts to: improve our quality of life, protect our environment, improve food safety and consumer choice, combat infectious diseases, and develop responses to cross-border man-made/natural
disasters
Economic (‘Prosperity’) Component Working Groups
Manufactured Goods (DOC) Lower production costs for North American manufacturers by
eliminating unnecessary regulatory barriers, ensuring compatibility of regulations and by eliminating redundant testing requirements
Provide consumers with cheaper, safer, and more diversified and innovative products
The Other Nine: E-Commerce and ICT (DOC) Energy (DOE) Movement of Goods (USTR) Transportation (DOT) Food and Agriculture (USDA) Business Facilitation (DOS) Financial Services (Treas.) Environment (DOS) Health (HHS)
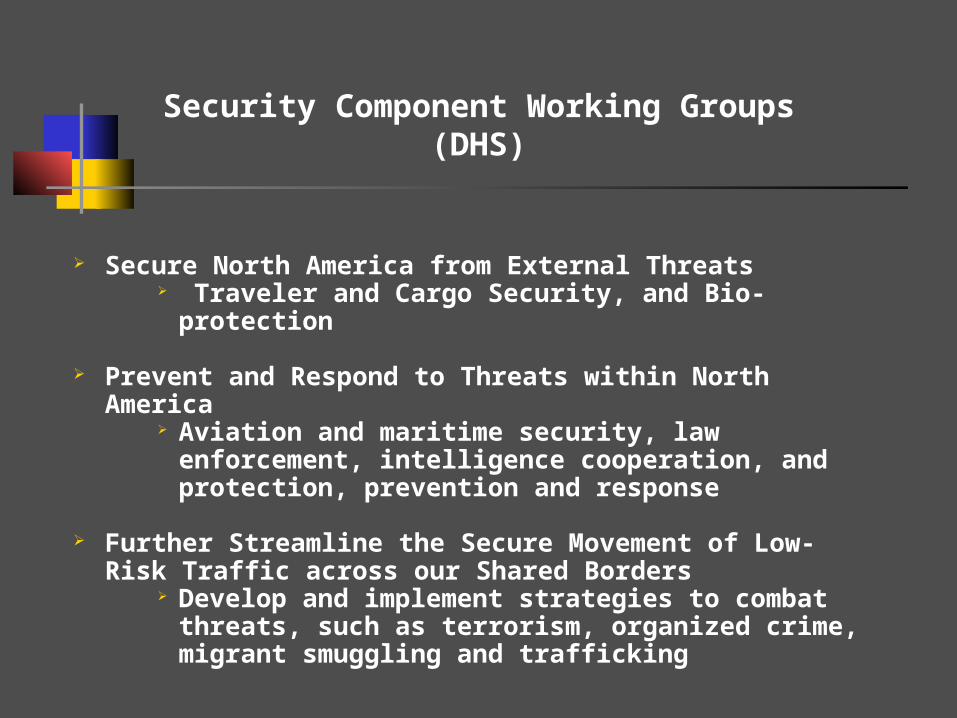
Security Component Working Groups(DHS)
Secure North America from External Threats Traveler and Cargo Security, and Bio-protection
Prevent and Respond to Threats within North America Aviation and maritime security, law enforcement,
intelligence cooperation, and protection, prevention and response
Further Streamline the Secure Movement of Low-Risk Traffic across our Shared Borders
Develop and implement strategies to combat threats, such as terrorism, organized crime, migrant smuggling and trafficking
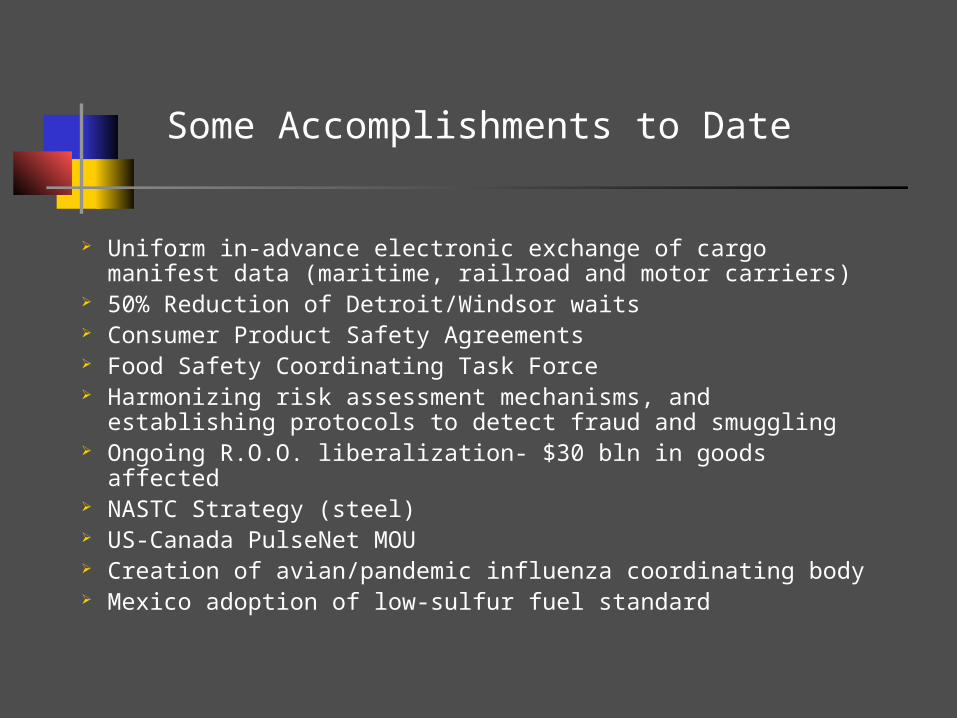
Some Accomplishments to Date
Uniform in-advance electronic exchange of cargo manifest data (maritime, railroad and motor carriers)
50% Reduction of Detroit/Windsor waits Consumer Product Safety Agreements Food Safety Coordinating Task Force Harmonizing risk assessment mechanisms, and establishing
protocols to detect fraud and smuggling Ongoing R.O.O. liberalization- $30 bln in goods affected NASTC Strategy (steel) US-Canada PulseNet MOU Creation of avian/pandemic influenza coordinating body Mexico adoption of low-sulfur fuel standard
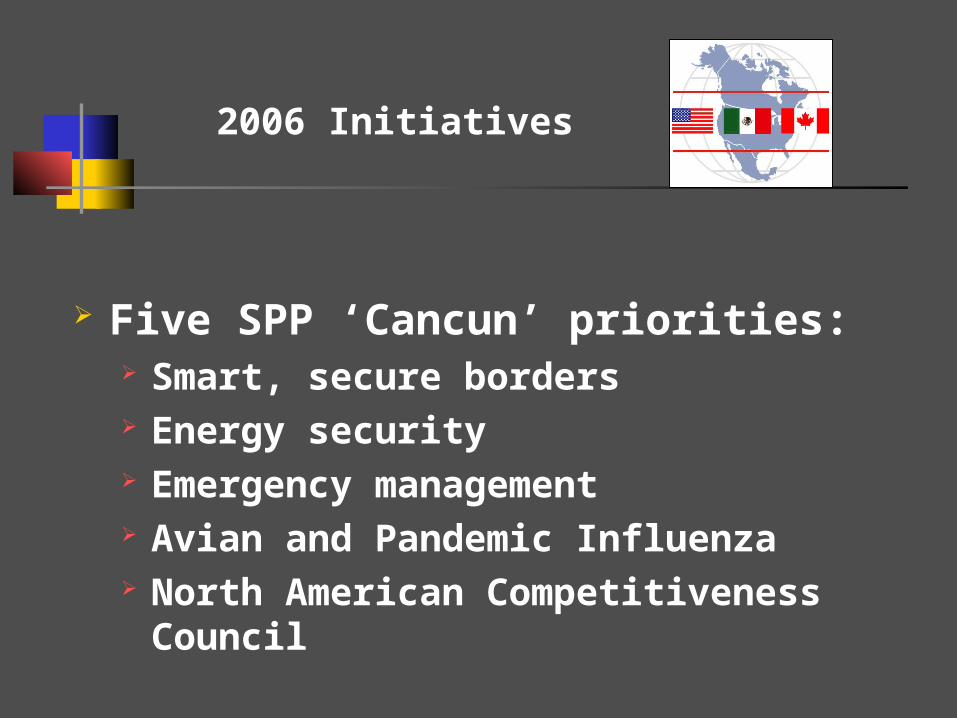
2006 Initiatives
Five SPP ‘Cancun’ priorities: Smart, secure borders Energy security Emergency management Avian and Pandemic Influenza North American Competitiveness Council

North American Competitiveness Council(NACC)
Membership- 10 private sector representatives from each country
U.S. Secretariat- Council of the Americas and U.S. Chamber of Commerce
Organization varies in each country
Purpose: provide recommendations on N. American competitiveness that could be addressed through the SPP
Value of high-level private sector input
Recommendations AND solutions to SPP Ministers

Next Steps
NACC priorities to Ministers
SPP Ministers Meeting early 2007
Working groups to continue existing projects and identify new deliverables

• Highly developed transportation infrastructure
• Sophisticated telecommunications infrastructure integrated with the U.S.
• Stable, mature financial markets• No restrictions on the movement of
funds into or out of the country• Efficient Marketing Channels
• Common language
• Culture
• Canadians are very familiar with U.S. products and services
• Geographic proximity
• Congruent time zone
• High standard of living
• Supportive Government
• Roaring Canadian Dollar
•US$ 1.00 = C$ 1.1357
Why Canada First?Why Canada First?

Understanding CanadaUnderstanding CanadaYour key to making a loonie or a toonie north of the borderYour key to making a loonie or a toonie north of the border
• Realize the significance of the U.S.-Canada trading relationship
• In 2005, two-way trade amounted to US $479 billion - up 12% from 2004 and is larger than the sum of 15 European Union countries
• Look at regional differences in Canada
• Canada and the U.S. are similar in many ways, but understanding what makes Canada different and unique is important for U.S. exporters
• Look to the U.S. Commercial Service for assistance in understanding the Canadian market and selling your products or services in Canada

80% of Canada’s 80% of Canada’s PopulationPopulation
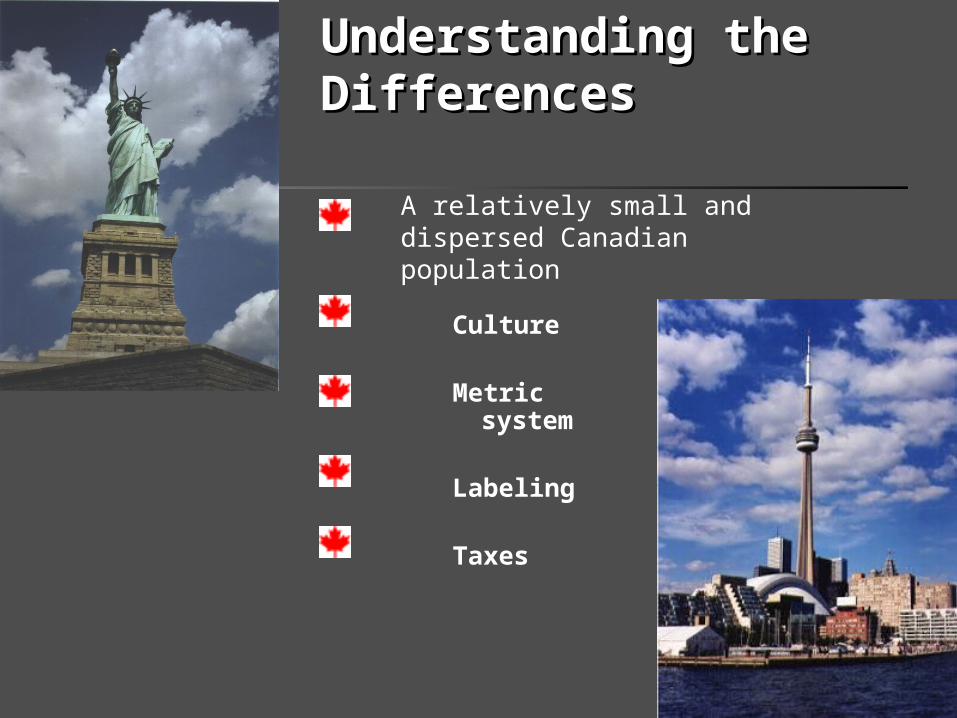
Culture
Metric system
Labeling
Taxes
A relatively small and dispersed Canadian population
Understanding the Understanding the DifferencesDifferences
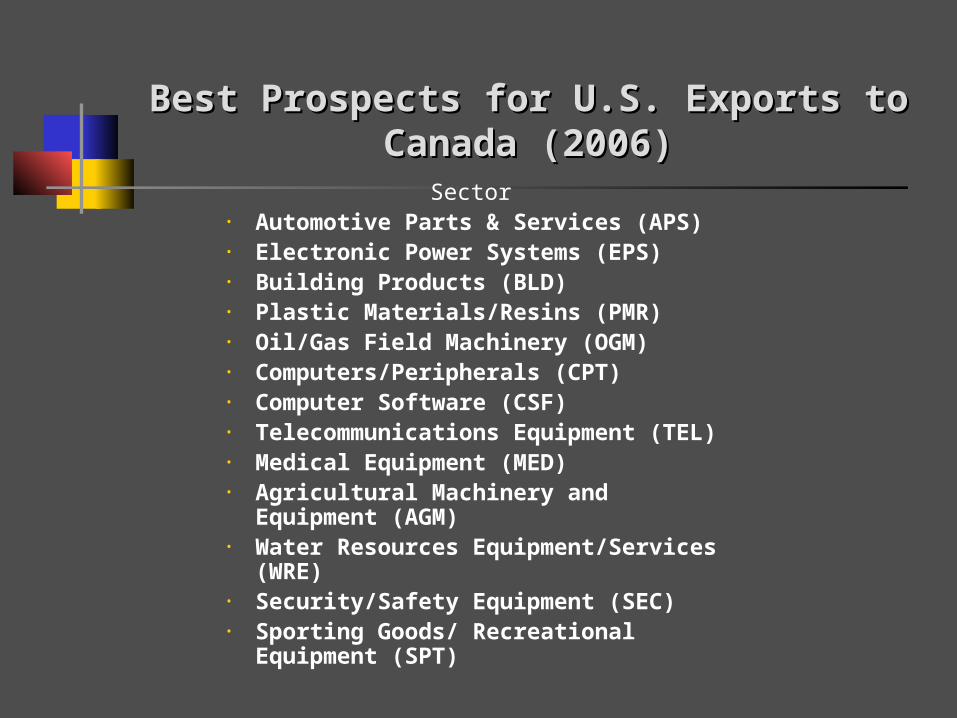
Best Prospects for U.S. Exports to Canada (2006)Best Prospects for U.S. Exports to Canada (2006)Sector
• Automotive Parts & Services (APS)• Electronic Power Systems (EPS)• Building Products (BLD)• Plastic Materials/Resins (PMR)• Oil/Gas Field Machinery (OGM)• Computers/Peripherals (CPT)• Computer Software (CSF)• Telecommunications Equipment (TEL)• Medical Equipment (MED)• Agricultural Machinery and Equipment
(AGM)• Water Resources Equipment/Services
(WRE)• Security/Safety Equipment (SEC)• Sporting Goods/ Recreational Equipment
(SPT)

Canadian Market Entry StrategiesCanadian Market Entry Strategies
APPOINT AGENT
APPOINT DISTRIBUTOR
FORM STRATEGIC ALLIANCES ESTABLISH BRANCH OFFICE IN CANADA

ITA Can Help
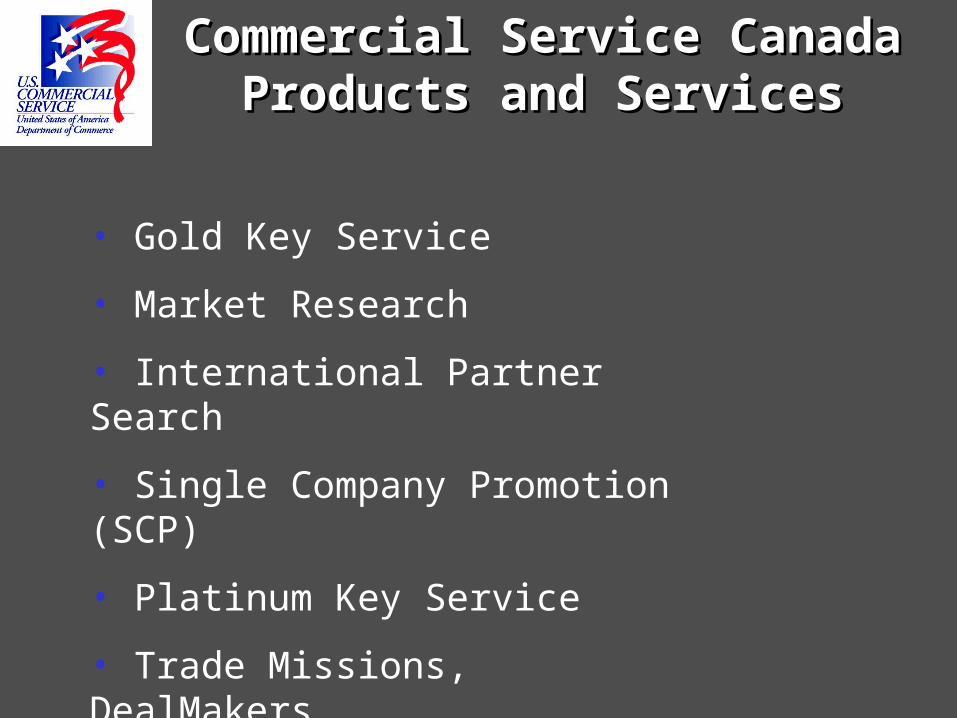
Commercial Service Canada Commercial Service Canada Products and ServicesProducts and Services
• Gold Key Service
• Market Research
• International Partner Search
• Single Company Promotion (SCP)
• Platinum Key Service
• Trade Missions, DealMakers
• Business Service Provider (BSP)

Upcoming Trade Schedule Upcoming Trade Schedule
Trade Events scheduled from 2006 – 2008 include:
• Industrial/Maritime Security Event
• Canadian Solid Waste & Recycling Expo
• Meet the Buyers Seminar
• Plastics Executive Service Trade Mission
• Smart Building Seminar
For a complete listing of all trade events occurring from 2006 – 2008, please refer to our website.
http://www.buyusa.gov/canada/en
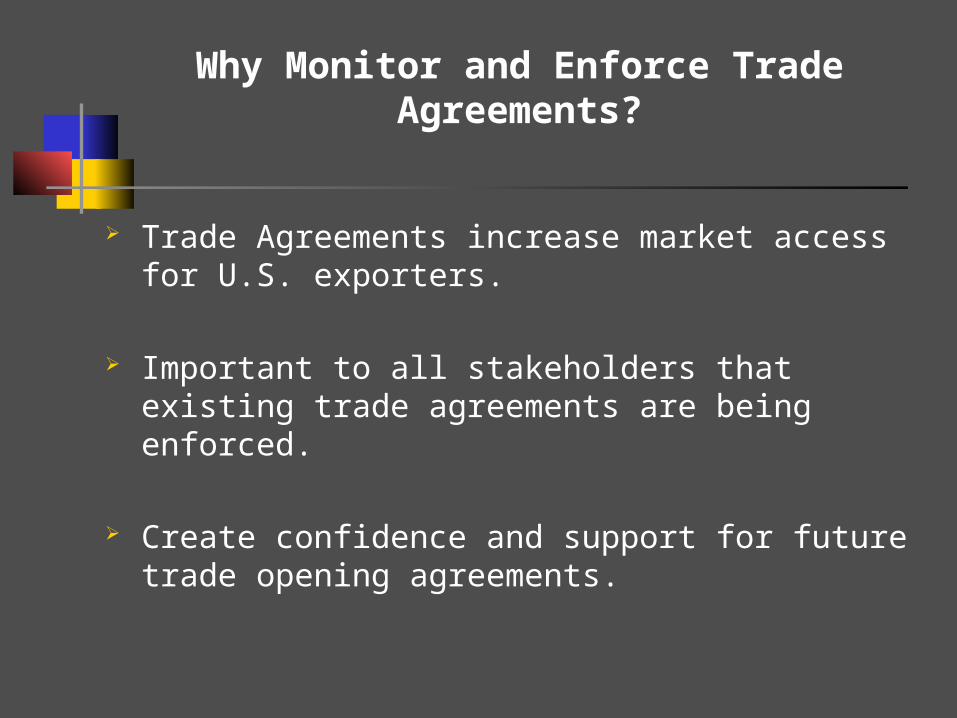
Why Monitor and Enforce Trade Agreements?
Trade Agreements increase market access for U.S. exporters.
Important to all stakeholders that existing trade agreements are being enforced.
Create confidence and support for future trade opening agreements.

What Kinds of Barriers do Firms Face?
Tariff and Customs Barriers
Rules of Origin, Certificates of Origin
Import Licensing
Standards, Testing, Labeling, or Certification
Lack of Intellectual Property Rights Protection
Government Procurement Contracts

ITA COMPLIANCE ACTIONWhat we do?
Identify unfair treatment
Form Compliance Team COUNTRY, INDUSTRY, AND AGREEMENT SPECIALISTS, GENERAL
COUNSEL, FOREIGN POST, OTHER – NIST, PTO
Apply FTA/WTO Analysis
Craft Action Plan to Resolve Issue

USEFUL LINKS
• COMMERCE NAFTA SITE – www.mac.doc.gov/nafta/index.htmwww.mac.doc.gov/nafta/index.htm
• SECURITY & PROSPERITY PARTNERSHIP – www.spp.gov
• US & FCS (Minnesota) - www.buyusa.gov/minnesota/
• US & FCS (Canada) – www.buyusa.gov/canada/en
• TRADE STATISTICS BY STATE – tse.export.gov
• TRADE INFORMATION CENTER – www.trade.gov/td/tic/www.trade.gov/td/tic/
• NORTH AMERICAN DEVELOPMENT BANK - www.nadbank.orgwww.nadbank.org
• NORTH AMERICAN COMMISSION FOR ENVIRONMENTAL COOPERATION – www.cec.orgwww.cec.org
• UNITED STATES TRADE REPRESENTATIVE –www.ustr.govwww.ustr.gov
• EXPORT INFORMATION – www.export.gov
• MARKET ACCESS OR COMPLIANCE PROBLEMS – MARKET ACCESS OR COMPLIANCE PROBLEMS – www.tcc.mac.doc.gov www.tcc.mac.doc.gov
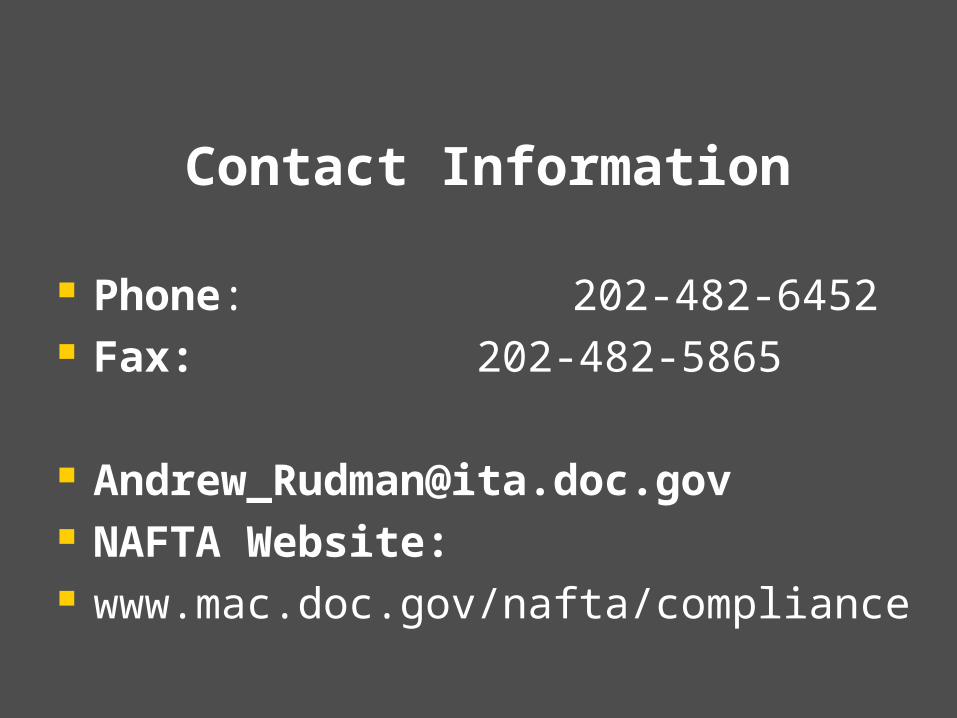
Contact Information
Phone: 202-482-6452 Fax: 202-482-5865
[email protected] NAFTA Website: www.mac.doc.gov/nafta/compliance