us brokers & asset managers - credit suisse
TRANSCRIPT

US Brokers & Asset ManagersBeyond the Pandemic - Special Valuation Analysis Initiating Coverage (FOCS, IBKR, LAZ, SF, SCU)
DISCLOSURE APPENDIX AT THE BACK OF THIS REPORT CONTAINS IMPORTANT DISCLOSURES, ANALYST CERTIFICATIONS, LEGAL ENTITY DISCLOSUREAND THE STATUS OF NON-US ANALYSTS. US Disclosure: Credit Suisse does and seeks to do business with companies covered in its research reports. As a result, investorsshould be aware that the Firm may have a conflict of interest that could affect the objectivity of this report. Investors should consider this report as only a single factor in makingtheir investment decision.
22 June 2020
Research Analysts
Craig Siegenthaler, [email protected]
Gautam Sawant, [email protected]
Samantha [email protected]
Kareem [email protected]
Equity Research Americas

Coverage Expansion: Deepening Our Broker CoverageWe have significantly expanded our Capital Markets coverage since 2018
2Craig Siegenthaler | 212.325.3104 | [email protected]
Source: Credit Suisse Estimates, Company Data,

Top Longs
Investment Conclusions
In our view, FOCS is the best way to play the secular growth of the RIA business
IBKR is expanding across all segments (individual, advisor, hedge fund…) and in Asia/Europe where competition is weaker.
Remain bullish on LPLA due to launches of its pure RIA and employee channels
We are bullish on the long-term growth prospects for the US RIA channel (FOCS)
Mergers will remove competition from the e-broker segment - benefits IBKR
Normalization of economic activity in 2021-22 should benefit the investment banking franchises (LAZ, SF)
Key Takeaways
COVID-19 UpdateThe Golden Age of US Wealth Management
We believe new technologies, improved client service, and lower fees are leading to a better overall client experience for US retail investors
The fragmented US wealth management channel will continue to migrate to both independent advisors (RIAs) and low cost digital brokers (e-brokers).
Expect a short-term slowdown in the breakaway broker theme / organic growth (our 2Q broker survey highlighted that 78% of advisors saw their client prospecting effort disrupted).
Advisors could re-allocate their excess cash into active equity given uncertain/volatile backdrop
3Craig Siegenthaler | 212.325.3104 | [email protected]
Source: Credit Suisse Estimates, Company Data,

How Our Research Process Is Differentiated Broad background across financial services: Craig spent the past 15 years covering the
financial services sector, including the brokers, asset managers, regional banks, life insurance,and financial guarantors. Earlier in his career, he also worked in macroeconomic/portfoliostrategy. Craig and his team were ranked #1 in the Institutional Investor survey in 2019.
Regulatory perspective: We’ve hosted several Washington DC trips in recent years,including meetings with the SEC, DoL, US Treasury, Federal Reserve, CFTC, Congress, andDC-based firms (law, consultants, lobbyists). These contacts helped us form our long-termviews on newer regulations (DoL Rule, MiFID2, Reg BI, State Fid Rules).
Channel Checks: Our Proprietary Broker Survey + industry contacts: We publish aquarterly financial advisor survey to obtain a bottom-up read on key issues. We have alsohosted calls with contacts at trading venues (market-makers, ATS, exchanges) on payment fororder flow and with RIAs and independent broker-dealers.
Our process is grounded in our two-part valuation framework: (1) price tonormalized cash earnings; (2) EV to EBITDA.
Leveraging new digital technologies: For the past three years, we have used a datascraping robot to monitor cash sweep rates across the industry.
Beyond the Pandemic – Special Valuation Analysis: In this slide deck, we include ourperspective on how the stocks could trade in 2-3 years when economic conditions normalize.
4Craig Siegenthaler | 212.325.3104 | [email protected]
Source: Credit Suisse Estimates, Company Data,
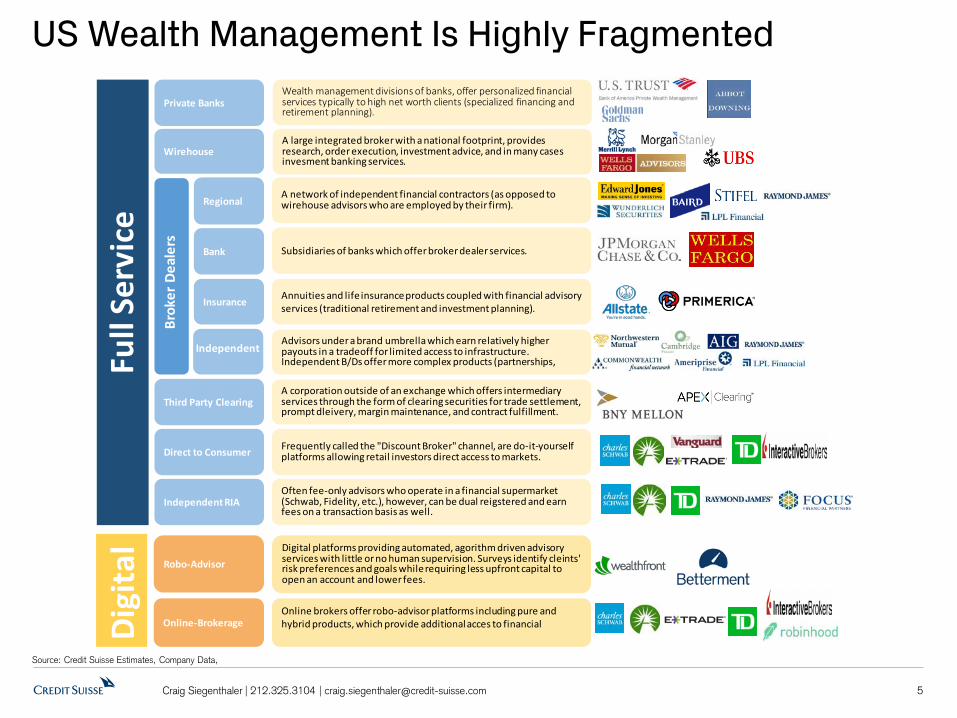
US Wealth Management Is Highly Fragmented
5Craig Siegenthaler | 212.325.3104 | [email protected]
Source: Credit Suisse Estimates, Company Data,
Digi
tal
Full
Serv
ice
Robo-Advisor
Private Banks
Wirehouse
Brok
er D
eale
rs
Insurance
Third Party Clearing
Independent
Regional
Bank
Insurance
Wealth management divisions of banks, offer personalized financial services typically to high net worth clients (specialized financing and retirement planning).
A large integrated broker with a national footprint, provides research, order execution, investment advice, and in many cases invesment banking services.
A network of independent financial contractors (as opposed to wirehouse advisors who are employed by their firm).
Subsidiaries of banks which offer broker dealer services.
Annuities and life insurance products coupled with financial advisory services (traditional retirement and investment planning).
Advisors under a brand umbrella which earn relatively higher payouts in a tradeoff for limited access to infrastructure. Independent B/Ds offer more complex products (partnerships,
A corporation outside of an exchange which offers intermediary services through the form of clearing securities for trade settlement, prompt dleivery, margin maintenance, and contract fulfillment.
Online-Brokerage
Digital platforms providing automated, agorithm driven advisory services with little or no human supervision. Surveys identify cleints' risk preferences and goals while requiring less upfront capital to open an account and lower fees.
Online brokers offer robo-advisor platforms including pure and hybrid products, which provide additional acces to financial
Direct to Consumer Frequently called the "Discount Broker" channel, are do-it-yourself platforms allowing retail investors direct access to markets.
Independent RIAOften fee-only advisors who operate in a financial supermarket (Schwab, Fidelity, etc.), however, can be dual reigstered and earn fees on a transaction basis as well.

6Craig Siegenthaler | 212.325.3104 | [email protected]
We forecast significant upside to consensus 2021 EPS estimates for both FOCS and IBKR, whichis partly driven by robust organic growth. Both stocks are Outperform-rated.
Additionally, we believe FOCS is undervalued given its strong long-term growth prospects in the RIAchannel (including EPS accretive acquisitions) and a misunderstanding of its actual financialleverage (debt) by investors.
We forecast 10-15% total returns for LAZ and SF after strong QTD returns, which supports ourNeutral ratings for both names. We could be positively surprised from SF if it finds an attractiveacquisition candidate over the short term.
EPS Estimates and 12-Month Target Prices
Source: Credit Suisse Estimates, Company Data, Factset, Prices as on 6/19/20200
Consensus EPS Growth Total Return2020/2021 Current CS Target Est 12-Mo Returns
Ticker Company Name CS Consensus % Up/Down CS Consensus % Up/Down FY2020 FY2021 % Change Price Price Incl DividendFOCS Focus Financial Partners $2.93 $2.77 6% $3.41 $3.08 11% $2.77 $3.08 11% $30 $39 30%IBKR Interactive Brokers $1.86 $1.72 8% $1.79 $1.6 9% $1.72 $1.64 -5% $42 $53 29%LPLA LPL Financial Holdings Inc $6.17 $5.94 4% $6.10 $5.90 3% $5.94 $5.90 -1% $81 $91 14%LAZ Lazard Ltd. $1.56 $1.64 -5% $2.60 $2.8 -5% $1.64 $2.75 68% $30 $32 12%SF Stifel Financial Corp $4.08 $4.15 -2% $4.69 $4.51 4% $4.15 $4.51 9% $47 $52 11%RJF Raymond James Financial Inc $5.24 $5.13 2% $5.64 $5.4 5% $5.13 $5.38 5% $74 $76 5%ETFC E*TRADE Financial Corp $2.70 $2.75 -2% $2.42 $2.48 -3% $2.75 $2.48 -10% $48 $49 2%AMTD TD Ameritrade Holding Corp R R R R R R $2.94 $2.09 -29% $40 R RSCHW Charles Schwab Corp R R R R R R $2.05 $1.82 -11% $37 R RSCU Sculptor Capital $0.93 $1.09 -15% $2.64 $2.88 -8% $1.09 $2.88 165% $13 $15 21%
EPS Estimates2020 EPS 2021 EPS
Price Estimates

7
Revenue Contribution by Business Asset & Wealth Management AUM ($,Tn)
Online Brokers: AMTD, ETFC, IBKR, and SCHW operate (1) e-brokers, which interactdirectly with the retail customer and (2) RIA custodians (SCHW, AMTD are large).
Wealth Managers: LPLA is the largest independent broker-dealer in the US, while SFoperates a large employee channel. Alternatively, RJF manages both a large independentand employee wealth management business and FOCS is concentrated on RIAs.
Bank subsidiaries: The retail brokers are highly asset-sensitive to interest rates owing totheir cash sweep-related revenues. ETFC, RJF, SCHW, and SF each operate proprietarybanks, while AMTD, FOCS, IBKR, and LPLA leverage third-party banks.
Craig Siegenthaler | 212.325.3104 | [email protected]
Source: Credit Suisse Estimates, Company Data, Other revenues below 3% not labelled
Two Major Retail Broker Segments
95%
43% 39%
27%
14%
12%
8%
14%
56%
61% 54%
40%
32% 43%
38%
7%
35%
29% 58%
6%
9%
18% 11%
50%
6%
21%
50%
5% 6% 4% 5%
0%
25%
50%
75%
100%
FOCS RJF LPLA SF SCHW ETFC AMTD IBKR LAZ
Wealth Management (Advisory) NII/Client Cash Mgmnt Trading/ Brokerage Asset Management Investment Banking Other
012345678
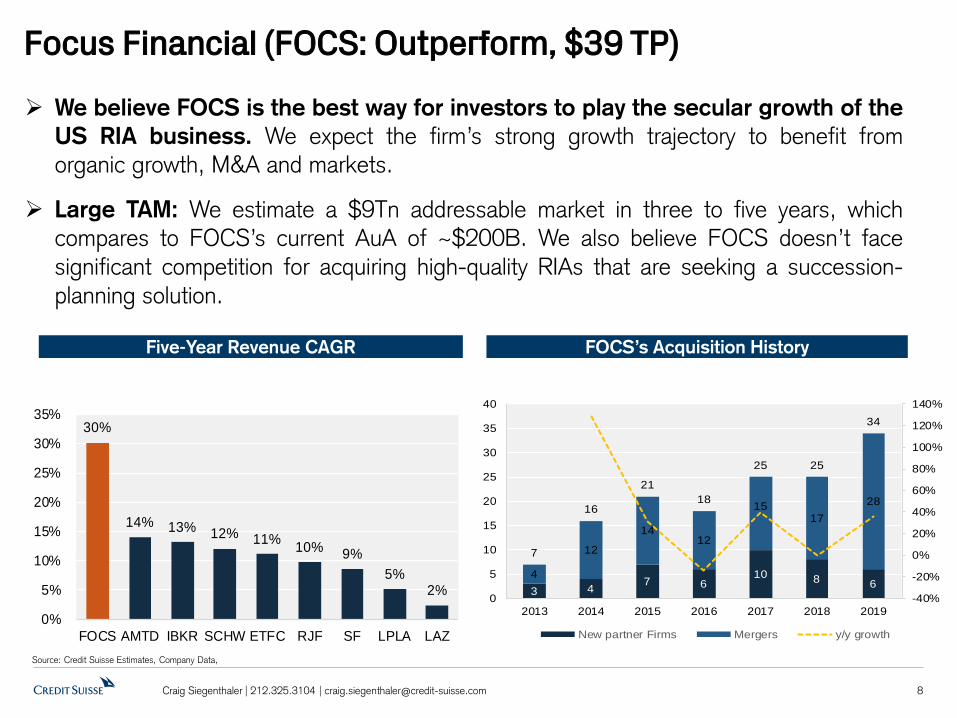
We believe FOCS is the best way for investors to play the secular growth of theUS RIA business. We expect the firm’s strong growth trajectory to benefit fromorganic growth, M&A and markets.
Large TAM: We estimate a $9Tn addressable market in three to five years, whichcompares to FOCS’s current AuA of ~$200B. We also believe FOCS doesn’t facesignificant competition for acquiring high-quality RIAs that are seeking a succession-planning solution.
Focus Financial (FOCS: Outperform, $39 TP)
Five-Year Revenue CAGR FOCS’s Acquisition History
8Craig Siegenthaler | 212.325.3104 | [email protected]
Source: Credit Suisse Estimates, Company Data,
30%
14% 13% 12% 11% 10% 9% 5%
2%
0%
5%
10%
15%
20%
25%
30%
35%
FOCS AMTD IBKR SCHW ETFC RJF SF LPLA LAZ
3 4 7 610 8 6
4
12
1412
1517
28
7
16
2118
25 25
34
-40%
-20%
0%
20%
40%
60%
80%
100%
120%
140%
0
5
10
15
20
25
30
35
40
2013 2014 2015 2016 2017 2018 2019
New partner Firms Mergers y/y growth
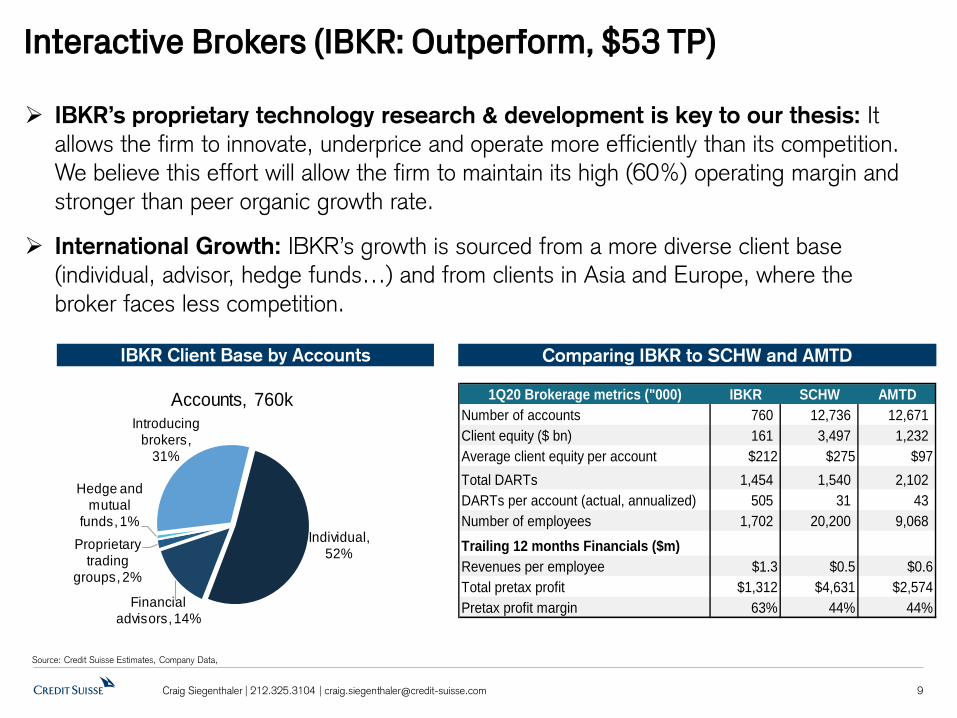
Interactive Brokers (IBKR: Outperform, $53 TP)
IBKR Client Base by Accounts Comparing IBKR to SCHW and AMTD
9Craig Siegenthaler | 212.325.3104 | [email protected]
Source: Credit Suisse Estimates, Company Data,
IBKR’s proprietary technology research & development is key to our thesis: It allows the firm to innovate, underprice and operate more efficiently than its competition. We believe this effort will allow the firm to maintain its high (60%) operating margin and stronger than peer organic growth rate.
International Growth: IBKR’s growth is sourced from a more diverse client base (individual, advisor, hedge funds…) and from clients in Asia and Europe, where the broker faces less competition.
1Q20 Brokerage metrics ("000) IBKR SCHW AMTDNumber of accounts 760 12,736 12,671 Client equity ($ bn) 161 3,497 1,232 Average client equity per account $212 $275 $97Total DARTs 1,454 1,540 2,102 DARTs per account (actual, annualized) 505 31 43 Number of employees 1,702 20,200 9,068 Trailing 12 months Financials ($m)Revenues per employee $1.3 $0.5 $0.6Total pretax profit $1,312 $4,631 $2,574Pretax profit margin 63% 44% 44%
Individual, 52%
Financial advisors, 14%
Proprietary trading
groups, 2%
Hedge and mutual
funds, 1%
Introducing brokers,
31%
Accounts, 760k

Lazard Ltd. (LAZ: Neutral, $32 TP)
Lazard’s Market Share vs. Volumes
10Craig Siegenthaler | 212.325.3104 | [email protected]
Source: Credit Suisse Estimates, Company Data,
Lazard’s Fee Rate vs. EM Index
Lazard is, we believe, best positioned to benefit from a resurgence of European M&A activity: Lazard should benefit from a rebound in Europe given its stable ~15% market share in the region and 48% of its M&A fees are generated from non-US transactions.
Macro and secular headwinds: The macro headwinds include the rise of geopolitical uncertainty (Brexit, Trade-war), increased regulatory scrutiny on mega-mergers, and a concentration of transactions within North America. The secular headwinds include shift from actively managed strategies to passive and the relative investment outperformance ofUS-centric growth strategies
0%
5%
10%
15%
20%
25%
30%
35%
$0
$500
$1,000
$1,500
$2,000
North American Deal Volumes ($B) European Deal Volumes ($B)
LAZ Noth American Market Share (RHS) LAZ European Market Share (RHS)
47
48
49
50
51
52
53
900
1000
1100
1200
MXEF Index Average price (LHS) Lazard Fee Rate (ex Incentive fees, Bps)

Stifel has been an active consolidator of small and mid-sized financial services firms: We look for the firm to continue to acquire out-of-favor wealth management and investment banking businesses which will provide the firm earnings accretion.
Business headwinds: We believe the firm is facing several headwinds including new regulations (SEC Reg BI, State Fiduciary Rules), active-to-passive migration and the wealth management shift to independent advisory firms. Alternatively, these headwinds may provide SF more attractive M&A candidates.
Stifel Financial (SF: Neutral, $52 TP)
Five-Year EPS CAGR 2020 Revenue Contribution
11Craig Siegenthaler | 212.325.3104 | [email protected]
Source: Credit Suisse Estimates, Company Data,
37%
21%
24%3%
1%
14%
BrokeragerevenuesInvestment banking
Advisory
Asset management& Service feesOther income
Net Interest Income
33%
28% 24% 23%
21% 17%
16%
1% 0%
5%
10%
15%
20%
25%
30%
35%
IBKR ETFC AMTD SCHW LPLA SF RJF LAZ

Turnaround plan nearing completion: There is only one remaining case relating toits legal issues with its former Africa subsidiary, and this could be resolved over the nextsix months. A resolution of this issue could open the door to large client inflows, butalso trigger a monetary payment.
Net flow outlook improving: Its flagship multi-strat hedge fund just had a positiveinflection in net flows, and we look for the firm’s distressed credit funds to generatepositive organic growth in 2020. And while the CLO market is partially closed, thisbusiness should provide AuM growth over the long-term.
Sculptor Capital (SCU: Neutral, $15 TP)
Net Returns (2015-2020) Sculptor Capital’s Net Flows by Business
12Craig Siegenthaler | 212.325.3104 | [email protected]
Source: Credit Suisse Estimates, Company Data, Factset , NOTES: Master Fund as of 5/31/20, Credit Opps as of 4/30/20, S&P500 and BarCap annualized through 6/11/20

Our Valuation Methodology
13Craig Siegenthaler | 212.325.3104 | [email protected]
Source: Credit Suisse Estimates, Company Data, Factset ; Prices as on closing 6/19/20200
Brokers Valuation Method #1 Valuation Method #2Price to Cash Earnings EV to EBITDA
Ticker Company Name RatingCurrent
PriceCapital
AdjustmentTarget Price
Upside to TP
Total Return
(incl div)CY2022
EarningsEarnings Multiple
2020 Dividend
Yield
FOCS Focus Financial Partners O $30 $39 30% 30% $3.91 10.0x 11.7x 0%IBKR Interactive Brokers Group O $42 $53 28% 29% $2.13 25.0x 1.0x 1%LPLA LPL Financial Holdings Inc O $81 $91 12% 14% $6.49 14.0x 11.9x 1%LAZ Lazard N $30 $32 8% 12% $3.24 10.0x 7.8x 5%SF Stifel Financial N $47 $52 10% 11% $5.18 10.0x 7.0x 1%RJF Raymond James Financial Inc N $74 $76 3% 5% $6.30 12.0x 7.7x 2%ETFC E*TRADE Financial Corp N $48 $49 1% 2% $2.44 20.0x 11.8x 1%AMTD TD Ameritrade Holding Corp R $40 RestrictedSCHW Charles Schwab Corp R $37 Restricted
10% 12% 12.0x
Traditional Asset Managers Valuation Method #1 Valuation Method #2Price to Cash Earnings EV to EBITDA
Ticker Company Name RatingCurrent
PriceCapital
AdjustmentTarget Price
Upside to TP
Total Return
(incl div)
CY2022Cash
Earnings
Cash Earnings Multiple
2020 Dividend
Yield
BLK BlackRock Inc O $555 $552 -1% 2% $31.53 17.5x 14.5x 3%TROW T. Rowe Price Group Inc O $113 $14.0 $108 -4% -1% $7.55 12.5x 12.3x 3%BSIG Brightsphere Investment Group O $10 -$1.0 $10 -3% -3% $2.15 5.0x 4.1x 0%AB AllianceBernstein Holding LP N $27 $1.0 $22 -18% -10% $2.77 7.5x 8.8x 9%EV Eaton Vance Corp N $40 $35 -14% -10% $3.45 10.0x 8.9x 4%WETF Wisdom Tree Investments Inc O $3.6 $2.9 -21% -17% $0.19 15.0x 13.5x 4%IVZ Invesco Ltd N $11 -$1.0 $8 -28% -21% $1.80 5.0x 3.8x 7%BEN Franklin Resources Inc U $22 $1.0 $16 -28% -23% $1.97 7.5x 10.7x 5%AMG Affiliated Managers Group Inc N $75 -$5.0 $57 -24% -24% $12.40 5.0x 5.0x 0%JHG Janus Henderson Group U $22 $12 -49% -42% $2.30 5.0x 7.5x 7%
Median -18% -10% 7.5x 8.9x
EV/EBITDA
7.8x
EV/EBITDA
Alternative Asset Managers Valuation Method #1 Valuation Method #2 Valuation Method #2Price to Cash Earnings SOTPs - Bear SOTPs - Bull
Ticker Company Name RatingCurrent
PriceTarget Price
Upside to TP
Total Return
(incl div)5Yr
Average
Cash Earnings Multiple TP Bear Downside
Aggressive Case Upside
2020 Dividend
Yield
ARES Ares Management LP O $39 $46 18% 23% $2.31 20.0x $37 -4% $56 43% 4%SCU Sculptor Capital Management N $13 $15 16% 21% $2.44 6.0x $10 -18% $19 49% 5%BX Blackstone Group O $59 $63 6% 9% $3.13 20.0x $39 -33% $68 14% 3%APO Apollo Global Mgmt O $53 $54 1% 4% $2.98 18.0x $38 -29% $65 23% 3%KKR KKR & Co LP N $32 $32 0% 2% $2.12 15.0x $18 -43% $33 3% 2%CG Carlyle Group LP N $30 $29 -3% 0% $1.93 15.0x $19 -37% $33 9% 3%Median 4% 7% 15.0x -31% 23%

14Craig Siegenthaler | 212.325.3104 | [email protected]
Beyond the Pandemic – Special Valuation AnalysisRevenue Contribution by Business
Source: Credit Suisse Estimates, Company Data, other revenues below 3% not labelled
2020 Revenue Contribution
95%
43% 39%
27%
14%
12%
8%
14%
56%
61% 54%
40%
32% 43%
38%
7%
35%
29% 58%
6%
9%
18% 11%
50%
6%
21%
50%
5% 6% 4% 5%
0%
25%
50%
75%
100%
FOCS RJF LPLA SF SCHW ETFC AMTD IBKR LAZ
Wealth Management (Advisory) NII/Client Cash Mgmnt Trading/ Brokerage Asset Management Investment Banking Other

15Craig Siegenthaler | 212.325.3104 | [email protected]
Historical Valuation RangesCyclical Stocks Should Trade at Peak Multiples on Trough EPS
Source: Credit Suisse Estimates, Company Data, Factset
US Retail Broker NTM P/E Relative to the S&P 500: Large discount vs. history
US Retail Broker NTM P/E: Slightly below the historical average

16Craig Siegenthaler | 212.325.3104 | [email protected]
Quantifying the Worst Case Downside Risk to EPSLower Interest Rates and Commission Cuts Driving Delta
Source: Credit Suisse Estimates, Company Data, Factset;
% Upside from 2019
Worst case profitability
EPS 2019 2020E 2021E 2022E 2021E Worst caseE*TRADE Financial Corp $3.84 $2.70 $2.42 $2.44 $2.31Interactive Brokers $2.13 $1.86 $1.79 $2.13 $1.64LPL Financial Holdings Inc $7.14 $6.17 $6.10 $6.49 $5.41Raymond James Financial Inc (FY) $7.41 $5.24 $5.64 $6.14 $4.55Stifel $6.10 $4.08 $4.69 $5.18 $3.52Focus Financial $2.39 $2.93 $3.41 $3.91 $2.89Lazard $3.28 $1.56 $2.60 $3.24 $1.35TD Ameritrade Holding Corp (FY) $4.13 R R R RCharles Schwab Corp $2.67 R R R R
%Upside from 2019 2019 2020E 2021E 2022E 2021E Worst caseE*TRADE Financial Corp -1% -30% -37% -36% -40%Interactive Brokers 1% -13% -16% 0% -23%LPL Financial Holdings Inc 33% -14% -15% -9% -24%Raymond James Financial Inc (FY) 15% -29% -24% -17% -39%Stifel 16% -33% -23% -15% -42%Focus Financial 30% 23% 43% 64% 21%Lazard -21% -52% -21% -1% -59%TD Ameritrade Holding Corp (FY) 24% R R R RCharles Schwab Corp 9% R R R R

17Craig Siegenthaler | 212.325.3104 | [email protected]
Evaluating the Worst Case Scenarios for the stocksZero Rate Backdrop Can’t Get Much Worse
Source: Credit Suisse Estimates, Company Data, Factset; ; Prices as on closing 6/19/20 for Total Return
LPLA Valuation Matrix
Raymond James Valuation Matrix
EPS $5.41 $5.41 $5.41 EPS $4.55 $4.55 $4.55Multiple 16.0x 12.0x 8.0x Multiple 14.0x 11.0x 8.0x
Implied Price $87 $65 $43 Implied Price $64 $50 $36Current Price $81 $81 $81 Current Price $74 $74 $74Total Return 8% -18% -45% Total Return -12% -30% -49%
Stifel Valuation Matrix
Interactive Brokers Valuation Matrix
EPS $3.52 $3.52 $3.52 EPS $1.64 $1.64 $1.64Multiple 12.0x 9.0x 6.0x Multiple 35.0x 27.5x 20.0x
Implied Price $42 $32 $21 Implied Price $57 $45 $33Current Price $47 $47 $47 Current Price $42 $42 $42Total Return -9% -32% -54% Total Return 39% 9% -20%
LazardValuation Matrix
Focus Financial Valuation Matrix
EPS $1.35 $1.35 $1.35 EPS $2.89 $2.89 $2.89Multiple 15.0x 11.0x 7.0x Multiple 18.0x 14.0x 10.0x
Implied Price $20 $15 $9 Implied Price $52 $40 $29Current Price $30 $30 $30 Current Price $30 $30 $30Total Return -26% -44% -62% Total Return 73% 34% -4%
Valuation Ranges Valuation Ranges
Valuation RangesValuation Ranges
Valuation Ranges Valuation Ranges

18Craig Siegenthaler | 212.325.3104 | [email protected]
Core Financial Metrics - Assumptions
Source: Credit Suisse Estimates, Company Data, Factset, Note: FOCS is 3Yr average;
AuA growth rate EPS
Operating Margin ROCA
EPS Blue Median Grey
Last 5 Year
averageLPL Financial Holdings Inc $17.02 $12.47 $8.27 $3.97E*TRADE Financial Corp $6.74 $4.38 $2.82 $2.58Raymond James Financial Inc (FY) $13.24 $9.83 $7.18 $5.46Stifel $10.66 $7.46 $5.27 $3.94Lazard $6.05 $4.01 $2.46 $3.58Interactive Brokers $3.69 $2.84 $2.34 $1.48Focus Financial $4.24 $3.53 $2.96 $1.72TD Ameritrade Holding Corp (FY) R R R $2.43Charles Schwab Corp R R R $1.81
AUA Growth Rate Blue Median Grey
Last 5 Year
averageLPL Financial Holdings Inc 13% 10% 7% 10%E*TRADE Financial Corp 14% 10% 6% 13%Raymond James Financial Inc (FY) 12% 8% 4% 12%Stifel 10% 6% 2% 13%Lazard 5% 0% -5% 6%Interactive Brokers n/a n/a n/a n/aFocus Financial n/a n/a n/a n/aTD Ameritrade Holding Corp (FY) R R R 16%Charles Schwab Corp R R R 11%
Op Margin
2019 Operating
Margin Blue Median Grey
Last 5 Year
averageLPL Financial Holdings Inc 16% 19% 17% 14% 12%E*TRADE Financial Corp 44% 50% 46% 42% 39%Raymond James Financial Inc (FY) 18% 20% 18% 16% 17%Stifel 20% 22% 20% 18% 16%Lazard 23% 30% 24% 18% 26%Interactive Brokers 60% 64% 60% 56% 55%Focus Financial 6% 10% 7% 4% 3%TD Ameritrade Holding Corp (FY) 52% R R R 45%Charles Schwab Corp 45% R R R 42%
ROCA 2019 ROCA Blue Median Grey
Last 5 Year
averageLPL Financial Holdings Inc 0.81% 0.87% 0.77% 0.67% 0.83%E*TRADE Financial Corp 0.85% 0.66% 0.55% 0.46% 0.83%Raymond James Financial Inc (FY) 0.95% 0.95% 0.85% 0.75% 1.00%Stifel 1.10% 1.10% 1.00% 0.90% 1.12%Lazard 0.49% 0.51% 0.46% 0.41% 0.52%Interactive Brokers n/a n/a n/a n/a n/aFocus Financial n/a n/a n/a n/a n/aTD Ameritrade Holding Corp (FY) 0.47% R R R 0.46%Charles Schwab Corp 0.29% R R R 0.28%
19Craig Siegenthaler | 212.325.3104 | [email protected]
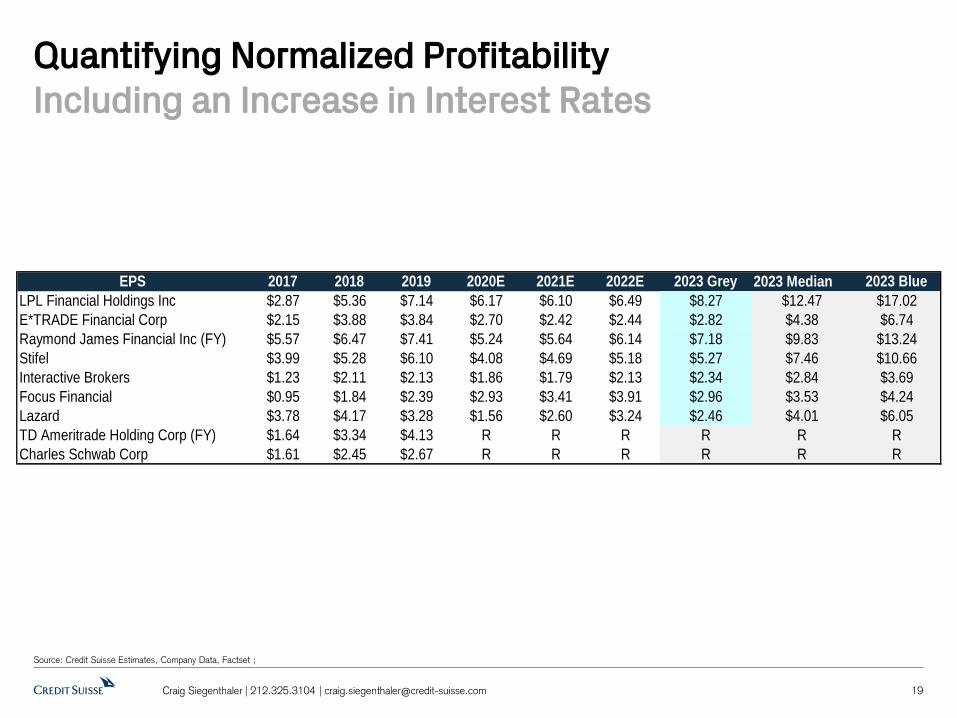
Quantifying Normalized Profitability Including an Increase in Interest Rates
Source: Credit Suisse Estimates, Company Data, Factset ;
EPS 2017 2018 2019 2020E 2021E 2022E 2023 Grey 2023 Median 2023 BlueLPL Financial Holdings Inc $2.87 $5.36 $7.14 $6.17 $6.10 $6.49 $8.27 $12.47 $17.02E*TRADE Financial Corp $2.15 $3.88 $3.84 $2.70 $2.42 $2.44 $2.82 $4.38 $6.74Raymond James Financial Inc (FY) $5.57 $6.47 $7.41 $5.24 $5.64 $6.14 $7.18 $9.83 $13.24Stifel $3.99 $5.28 $6.10 $4.08 $4.69 $5.18 $5.27 $7.46 $10.66Interactive Brokers $1.23 $2.11 $2.13 $1.86 $1.79 $2.13 $2.34 $2.84 $3.69Focus Financial $0.95 $1.84 $2.39 $2.93 $3.41 $3.91 $2.96 $3.53 $4.24Lazard $3.78 $4.17 $3.28 $1.56 $2.60 $3.24 $2.46 $4.01 $6.05TD Ameritrade Holding Corp (FY) $1.64 $3.34 $4.13 R R R R R RCharles Schwab Corp $1.61 $2.45 $2.67 R R R R R R

20Craig Siegenthaler | 212.325.3104 | [email protected]
Potential Upside to Long-Term Investors (Base Case) This Is in-line with Our Published Estimates
Source: Credit Suisse Estimates, Company Data, Factset, Prices as on closing 6/19/20 for Total Return
Best caseMedian Case
Worst Case Best case
Median Case
Worst Case
EPS $12.47 $12.47 $12.47 EPS $9.83 $9.83 $9.83Multiple 16.0x 12.0x 8.0x Multiple 14.0x 11.0x 8.0x
Implied Price $200 $150 $100 Implied Price $138 $108 $79Total Return 151% 89% 27% Total Return 93% 53% 13%
Best caseMedian Case
Worst Case Best case
Median Case
Worst Case
EPS $7.46 $7.46 $7.46 EPS $2.84 $2.84 $2.84Multiple 12.0x 9.0x 6.0x Multiple 35.0x 27.5x 20.0x
Implied Price $89 $67 $45 Implied Price $99 $78 $57Total Return 93% 46% -1% Total Return 142% 91% 39%
Best caseMedian Case
Worst Case Best case
Median Case
Worst Case
EPS $4.01 $4.01 $4.01 EPS $3.53 $3.53 $3.53Multiple 15.0x 11.0x 7.0x Multiple 18.0x 14.0x 10.0x
Implied Price $60 $44 $28 Implied Price $63 $49 $35Total Return 122% 69% 15% Total Return 111% 64% 17%
LPLA Valuation Matrix
Valuation RangesRaymond James Valuation Matrix
Valuation Ranges
Stifel Valuation Matrix
Valuation RangesInteractive Brokers
Valuation Matrix
Valuation Ranges
LazardValuation Matrix
Valuation RangesFocus Financial Valuation Matrix
Valuation Ranges

21Craig Siegenthaler | 212.325.3104 | [email protected]
Potential Upside to Long-Term Investors (Blue Sky)Blue Sky = More Bullish than Our View
Source: Credit Suisse Estimates, Company Data, Factset; Prices as on closing 6/19/20 for Total Return
Best caseMedian Case
Worst Case Best case
Median Case
Worst Case
EPS $17.02 $17.02 $17.02 EPS $13.24 $13.24 $13.24Multiple 16.0x 12.0x 8.0x Multiple 14.0x 11.0x 8.0x
Implied Price $272 $204 $136 Implied Price $185 $146 $106Total Return 241% 157% 72% Total Return 158% 104% 50%
Best caseMedian Case
Worst Case Best case
Median Case
Worst Case
EPS $10.66 $10.66 $10.66 EPS $3.69 $3.69 $3.69Multiple 12.0x 9.0x 6.0x Multiple 35.0x 27.5x 20.0x
Implied Price $128 $96 $64 Implied Price $129 $102 $74Total Return 175% 107% 39% Total Return 214% 147% 81%
Best caseMedian Case
Worst Case Best case
Median Case
Worst Case
EPS $6.05 $6.05 $6.05 EPS $4.24 $4.24 $4.24Multiple 15.0x 11.0x 7.0x Multiple 18.0x 14.0x 10.0x
Implied Price $91 $67 $42 Implied Price $76 $59 $42Total Return 224% 143% 62% Total Return 154% 97% 41%
LazardValuation Matrix
Valuation RangesFocus Financial Valuation Matrix
Valuation Ranges
Stifel Valuation Matrix
Valuation RangesInteractive Brokers
Valuation Matrix
Valuation Ranges
LPLA Valuation Matrix
Raymond James Valuation Matrix
Valuation Ranges Valuation Ranges

22Craig Siegenthaler | 212.325.3104 | [email protected]
Potential Downside to Long-Term Investors (Grey Sky)Grey Sky = Analysis of Bad Economic Scenario
Source: Credit Suisse Estimates, Company Data, Factset; Prices as on closing 6/19/20 for Total Return
Best caseMedian Case
Worst Case Best case
Median Case
Worst Case
EPS $8.27 $8.27 $8.27 EPS $7.18 $7.18 $7.18Multiple 16.0x 12.0x 8.0x Multiple 14.0x 11.0x 8.0x
Implied Price $132 $99 $66 Implied Price $100 $79 $57Total Return 68% 27% -14% Total Return 42% 13% -16%
Best caseMedian Case
Worst Case Best case
Median Case
Worst Case
EPS $5.27 $5.27 $5.27 EPS $2.34 $2.34 $2.34Multiple 12.0x 9.0x 6.0x Multiple 35.0x 27.5x 20.0x
Implied Price $63 $47 $32 Implied Price $82 $64 $47Total Return 38% 4% -29% Total Return 100% 57% 15%
Best caseMedian Case
Worst Case Best case
Median Case
Worst Case
EPS $2.46 $2.46 $2.46 EPS $2.96 $2.96 $2.96Multiple 15.0x 11.0x 7.0x Multiple 18.0x 14.0x 10.0x
Implied Price $37 $27 $17 Implied Price $53 $41 $30Total Return 45% 12% -21% Total Return 77% 37% -2%
LazardValuation Matrix
Valuation RangesFocus Financial Valuation Matrix
Valuation Ranges
Stifel Valuation Matrix
Valuation RangesInteractive Brokers
Valuation Matrix
Valuation Ranges
LPLA Valuation Matrix
Valuation RangesRaymond James Valuation Matrix
Valuation Ranges
Disclosure Appendix
23Craig Siegenthaler | 212.325.3104 | [email protected]
Companies Mentioned (Price as of 22-Jun-2020) Affiliated Managers Group (AMG.N, $75.23) AllianceBernstein (AB.N, $26.66) Apollo Global Management LLC (APO.N, $53.08) Ares Management (ARES.N, $39.02) Bank of America Corp. (BAC.N, $25.25) BlackRock (BLK.N, $555.37) Blackstone (BX.N, $59.0) BrightSphere Investment Group plc (BSIG.N, $10.07) E*Trade Financial Corp (ETFC.OQ, $48.43) Eaton Vance (EV.N, $40.23) Focus Financial Partners (FOCS.OQ, $30.13) Franklin Resources (BEN.N, $21.95) Interactive Brokers Group, Inc. (IBKR.OQ, $41.56) Invesco (IVZ.N, $11.09) JPMorgan Chase & Co. (JPM.N, $97.81) Janus Henderson Group (JHG.AX, A$32.86) Janus Henderson Group (JHG.N, $22.45) KKR and Co. Inc. (KKR.N, $31.8) LPL Financial Services (LPLA.OQ, $80.83) Lazard ltd. (LAZ.N, $30.1) Legg Mason (LM.N, $49.65) Morgan Stanley (MS.N, $46.93) Raymond James Financial (RJF.N, $73.66) Sculptor Capital Management (SCU.N, $12.58) Stifel Financial (SF.N, $47.27) T. Rowe Price Group (TROW.OQ, $128.61) TD Ameritrade (AMTD.OQ, $39.51) The Carlyle Group (CG.OQ, $29.85) The Charles Schwab Corp (SCHW.N, $36.67) WisdomTree Investments (WETF.OQ, $3.61)
Disclosure Appendix Analyst Certification Craig Siegenthaler, CFA, and Gautam Sawant, CFA, each certify, with respect to the companies or securities that the individual analyzes, that (1) the views expressed in this report accurately reflect his or her personal views about all of the subject companies and securities and (2) no part of his or her compensation was, is or will be directly or indirectly related to the specific recommendations or views expressed in this report.
3-Year Price and Rating History for Sculptor Capital Management (SCU.N)
SCU.N Closing Price Target Price Date (US$) (US$) Rating 07-Jul-17 28.80 40.00 N 30-Nov-17 29.50 NC * Asterisk signifies initiation or assumption of coverage. Effective July 3, 2016, NC denotes termination of coverage.
Target Price Closing Price SCU.N
01- Jan- 2018 01- Jan- 2019 01- Jan- 20200
10
20
30
40
N EU T RA L
N O T C O V ERED
As of December 10, 2012 Analysts’ stock rating are defined as follows: Outperform (O) : The stock’s total return is expected to outperform the relevant benchmark* over the next 12 months. Neutral (N) : The stock’s total return is expected to be in line with the relevant benchmark* over the next 12 months. Underperform (U) : The stock’s total return is expected to underperform the relevant benchmark* over the next 12 months. *Relevant benchmark by region: As of 10th December 2012, Japanese ratings are based on a stock’s total return relative to the analyst's coverage universe which consists of all companies covered by the analyst within the relevant sector, with Outperforms representing the most attractive, Neutrals the less attractive, and Underperforms the least attractive investment opportunities. As of 2nd October 2012, U.S. and Canadian as well as European (excluding Turkey) ratings are based on a stock’s total return relative to the analyst's coverage universe which consists of all companies covered by the analyst within the relevant sector, with Outperforms representing the most attractive, Neutrals the less attractive, and Underperforms the least attractive investment opportunities. For Latin America, Turkey and Asia (excluding Japan and Australia), stock ratings are based on a stock’s total return relative to the average total return of the relevant country or regional benchmark (India - S&P BSE Sensex Index); prior to 2nd October 2012 U.S. and Canadian ratings were based on (1) a stock’s absolute total return potential to its current share price and (2) the relative attractiveness of a stock’s total return potential within an analyst’s coverage universe. For Australian and New Zealand stocks, the expected total return (ETR) calculation includes 12-month rolling dividend yield. An Outperform rating is assigned where an ETR is greater than or equal to 7.5%; Underperform where an ETR less than or equal to 5%. A Neutral may be assigned where the ETR is between -5% and 15%. The overlapping rating range allows analysts to assign a rating that puts ETR in the context of associated risks. Prior to 18 May 2015, ETR ranges for Outperform and Underperform ratings did not overlap with Neutral thresholds between 15% and 7.5%, which was in operation from 7 July 2011. Restricted (R) : In certain circumstances, Credit Suisse policy and/or applicable law and regulations preclude certain types of communications, including an investment recommendation, during the course of Credit Suisse's engagement in an investment banking transaction and in certain other circumstances. Not Rated (NR) : Credit Suisse Equity Research does not have an investment rating or view on the stock or any other securities related to the company at this time. Not Covered (NC) : Credit Suisse Equity Research does not provide ongoing coverage of the company or offer an investment rating or investment view on the equity security of the company or related products.
Volatility Indicator [V] : A stock is defined as volatile if the stock price has moved up or down by 20% or more in a month in at least 8 of the past 24 months or the analyst expects significant volatility going forward.
Analysts’ sector weightings are distinct from analysts’ stock ratings and are based on the analyst’s expectations for the fundamentals and/or valuation of the sector* relative to the group’s historic fundamentals and/or valuation: Overweight : The analyst’s expectation for the sector’s fundamentals and/or valuation is favorable over the next 12 months. Market Weight : The analyst’s expectation for the sector’s fundamentals and/or valuation is neutral over the next 12 months. Underweight : The analyst’s expectation for the sector’s fundamentals and/or valuation is cautious over the next 12 months. *An analyst’s coverage sector consists of all companies covered by the analyst within the relevant sector. An analyst may cover multiple sectors.
Credit Suisse's distribution of stock ratings (and banking clients) is:
Global Ratings Distribution
Rating Versus universe (%) Of which banking clients (%) Outperform/Buy* 50% (32% banking clients) Neutral/Hold* 37% (28% banking clients) Underperform/Sell* 12% (21% banking clients) Restricted 1% *For purposes of the NYSE and FINRA ratings distribution disclosure requirements, our stock ratings of Outperform, Neutral, and Underperform most closely correspond to Buy, Hold, and Sell, respectively; however, the meanings are not the same, as our stock ratings are determined on a relative basis. (Please refer to definitions above.) An investor's decision to buy or sell a security should be based on investment objectives, current holdings, and other individual factors.
Important Global Disclosures Credit Suisse’s research reports are made available to clients through our proprietary research portal on CS PLUS. Credit Suisse research products may also be made available through third-party vendors or alternate electronic means as a convenience. Certain research products are only made available through CS PLUS. The services provided by Credit Suisse’s analysts to clients may depend on a specific client’s preferences regarding the frequency and manner of receiving communications, the client’s risk profile and investment, the size and scope of the overall client relationship with the Firm, as well as legal and regulatory constraints. To access all of Credit Suisse’s research that you are entitled to receive in the most timely manner, please contact your sales representative or go to https://plus.credit-suisse.com . Credit Suisse’s policy is to update research reports as it deems appropriate, based on developments with the subject company, the sector or the market that may have a material impact on the research views or opinions stated herein. Credit Suisse's policy is only to publish investment research that is impartial, independent, clear, fair and not misleading. For more detail please refer to Credit Suisse's Policies for Managing Conflicts of Interest in connection with Investment Research: https://www.credit-suisse.com/sites/disclaimers-ib/en/managing-conflicts.html . Any information relating to the tax status of financial instruments discussed herein is not intended to provide tax advice or to be used by anyone to provide tax advice. Investors are urged to seek tax advice based on their particular circumstances from an independent tax professional. Credit Suisse has decided not to enter into business relationships with companies that Credit Suisse has determined to be involved in the development, manufacture, or acquisition of anti-personnel mines and cluster munitions. For Credit Suisse's position on the issue, please see https://www.credit-suisse.com/media/assets/corporate/docs/about-us/responsibility/banking/policy-summaries-en.pdf . The analyst(s) responsible for preparing this research report received compensation that is based upon various factors including Credit Suisse's total revenues, a portion of which are generated by Credit Suisse's investment banking activities
Target Price and Rating Valuation Methodology and Risks: (12 months) for LPL Financial Services (LPLA.OQ)
Method: Our $91 target price and Outperform rating are based on 14x our 2022 EPS. We continue to believe LPLA is positioned for (1) increasing operating leverage and (2) capital management.
Risk: Risks to our $91 target price and Outperform rating for LPLA are regulatory pressures, declines in the overall equity market and customer asset inflows, declines in retail investor trading activity and declines in commission levels due to industry pricing pressure.
Please refer to the firm's disclosure website at https://rave.credit-suisse.com/disclosures/view/selectArchive for the definitions of abbreviations typically used in the target price method and risk sections.
See the Companies Mentioned section for full company names Credit Suisse currently has, or had within the past 12 months, the following as investment banking client(s): IVZ.N, LM.N, BLK.N, BEN.N, BX.N, SCHW.N, WETF.OQ, ARES.N, TROW.OQ, EV.N, KKR.N, APO.N, ETFC.OQ, CG.OQ, AB.N, JPM.N Credit Suisse provided investment banking services to the subject company (IVZ.N, LM.N, BLK.N, BEN.N, BX.N, SCHW.N, WETF.OQ, ARES.N, TROW.OQ, EV.N, KKR.N, APO.N, ETFC.OQ, CG.OQ, AB.N, JPM.N) within the past 12 months. Within the last 12 months, Credit Suisse has received compensation for non-investment banking services or products from the following issuer(s): IBKR.OQ, LAZ.N, SCU.N, SF.N, IVZ.N, JHG.AX, LM.N, AMG.N, BLK.N, RJF.N, BEN.N, BX.N, SCHW.N, WETF.OQ, AMTD.OQ, ARES.N, TROW.OQ, EV.N, KKR.N, APO.N, ETFC.OQ, BSIG.N, CG.OQ, JHG.N, LPLA.OQ, AB.N, BAC.N, JPM.N, MS.N Credit Suisse has managed or co-managed a public offering of securities for the subject company (IVZ.N, BLK.N, BX.N, SCHW.N, KKR.N, APO.N, CG.OQ, AB.N) within the past 12 months. Within the past 12 months, Credit Suisse has received compensation for investment banking services from the following issuer(s): IVZ.N, LM.N, BLK.N, BEN.N, BX.N, SCHW.N, ARES.N, TROW.OQ, EV.N, KKR.N, APO.N, ETFC.OQ, CG.OQ, AB.N, JPM.N

Credit Suisse expects to receive or intends to seek investment banking related compensation from the subject company (FOCS.OQ, SCU.N, IVZ.N, LM.N, BLK.N, BEN.N, BX.N, SCHW.N, WETF.OQ, ARES.N, TROW.OQ, EV.N, KKR.N, APO.N, ETFC.OQ, BSIG.N, CG.OQ, LPLA.OQ, AB.N, BAC.N, JPM.N, MS.N) within the next 3 months. Credit Suisse currently has, or had within the past 12 months, the following issuer(s) as client(s), and the services provided were non-investment-banking, securities-related: IBKR.OQ, LAZ.N, SCU.N, SF.N, IVZ.N, JHG.AX, LM.N, AMG.N, BLK.N, RJF.N, BEN.N, BX.N, SCHW.N, WETF.OQ, AMTD.OQ, ARES.N, TROW.OQ, EV.N, KKR.N, APO.N, ETFC.OQ, BSIG.N, CG.OQ, JHG.N, LPLA.OQ, AB.N, BAC.N, JPM.N, MS.N Credit Suisse currently has, or had within the past 12 months, the following issuer(s) as client(s), and the services provided were non-investment-banking, non securities-related: IBKR.OQ, LAZ.N, SCU.N, IVZ.N, JHG.AX, LM.N, AMG.N, BLK.N, RJF.N, BEN.N, BX.N, SCHW.N, WETF.OQ, AMTD.OQ, TROW.OQ, EV.N, APO.N, ETFC.OQ, BSIG.N, CG.OQ, JHG.N, AB.N, BAC.N, JPM.N, MS.N Credit Suisse or a member of the Credit Suisse Group is a market maker or liquidity provider in the securities of the following subject issuer(s): AMG.N, AB.N, APO.N, ARES.N, BAC.N, BLK.N, BX.N, BSIG.N, ETFC.OQ, EV.N, FOCS.OQ, BEN.N, IBKR.OQ, IVZ.N, JPM.N, JHG.AX, JHG.N, KKR.N, LPLA.OQ, LAZ.N, LM.N, MS.N, RJF.N, SCU.N, SF.N, TROW.OQ, AMTD.OQ, CG.OQ, SCHW.N, WETF.OQ A member of the Credit Suisse Group is party to an agreement with, or may have provided services set out in sections A and B of Annex I of Directive 2014/65/EU of the European Parliament and Council ("MiFID Services") to, the subject issuer (IVZ.N, LM.N, BLK.N, BEN.N, BX.N, SCHW.N, WETF.OQ, ARES.N, TROW.OQ, EV.N, KKR.N, APO.N, ETFC.OQ, CG.OQ, AB.N, JPM.N) within the past 12 months. As of the date of this report, Credit Suisse beneficially own 1% or more of a class of common equity securities of (LM.N, AMTD.OQ, ETFC.OQ). Credit Suisse Securities (USA) LLC served as financial advisor to The Charles Schwab Corporation (SCHW.N) on their announced acquisition of TD Ameritrade (AMTD.OQ). Toronto-Dominion Bank (TD.TO) will have an ownership stake in the new entity. Credit Suisse Securities (USA) LLC served as financial advisor to The Charles Schwab Corporation (SCHW.N) on their announced acquisition of TD Ameritrade (AMTD.OQ). Toronto-Dominion Bank (TD.TO) will have an ownership stake in the new entity. Credit Suisse is acting as a financial advisor to KKR (KKR.N) on the announced sale of their 33.33% stake in Acciona Energia International to AXA (AXAF.PA).
For date and time of production, dissemination and history of recommendation for the subject company(ies) featured in this report, disseminated within the past 12 months, please refer to the link: https://rave.credit-suisse.com/disclosures/view/report?i=527827&v=-4nnwziyqal80zaoudvlt4ovn6 .
Important Regional Disclosures Singapore recipients should contact Credit Suisse AG, Singapore Branch for any matters arising from this research report. The analyst(s) involved in the preparation of this report may participate in events hosted by the subject company, including site visits. Credit Suisse does not accept or permit analysts to accept payment or reimbursement for travel expenses associated with these events. For Credit Suisse Securities (Canada), Inc.'s policies and procedures regarding the dissemination of equity research, please visit https://www.credit-suisse.com/sites/disclaimers-ib/en/canada-research-policy.html. Investors should note that income from such securities and other financial instruments, if any, may fluctuate and that price or value of such securities and instruments may rise or fall and, in some cases, investors may lose their entire principal investment. I, Craig Siegenthaler, CFA, certify that (1) The views expressed in this report solely and exclusively reflect my personal opinions and have been prepared independently, including with respect to Banco de Investimentos Credit Suisse (Brasil) S.A. or its affiliates ("Credit Suisse"). (2) Part of my compensation is based on various factors, including the total revenues of Credit Suisse, but no part of my compensation has been, is, or will be related to the specific recommendations or views expressed in this report. In addition, Credit Suisse declares that: Credit Suisse has provided, and/or may in the future provide investment banking, brokerage, asset management, commercial banking and other financial services to the subject company/companies or its affiliates, for which they have received or may receive customary fees and commissions, and which constituted or may constitute relevant financial or commercial interests in relation to the subject company/companies or the subject securities. This research report is authored by: Credit Suisse Securities (USA) LLC ............................................................................................. Craig Siegenthaler, CFA ; Gautam Sawant, CFA
Important disclosures regarding companies that are the subject of this report are available by calling +1 (877) 291-2683. The same important disclosures, with the exception of valuation methodology and risk discussions, are also available on Credit Suisse’s disclosure website at https://rave.credit-suisse.com/disclosures . For valuation methodology and risks associated with any recommendation, price target, or rating referenced in this report, please refer to the disclosures section of the most recent report regarding the subject company.

This report is produced by subsidiaries and affiliates of Credit Suisse operating under its Global Markets Division. For more information on our structure, please use the following link: https://www.credit-suisse.com/who-we-are This report may contain material that is not directed to, or intended for distribution to or use by, any person or entity who is a citizen or resident of or located in any locality, state, country or other jurisdiction where such distribution, publication, availability or use would be contrary to law or regulation or which would subject Credit Suisse or its affiliates ("CS") to any registration or licensing requirement within such jurisdiction. All material presented in this report, unless specifically indicated otherwise, is under copyright to CS. None of the material, nor its content, nor any copy of it, may be altered in any way, transmitted to, copied or distributed to any other party, without the prior express written permission of CS. All trademarks, service marks and logos used in this report are trademarks or service marks or registered trademarks or service marks of CS or its affiliates.The information, tools and material presented in this report are provided to you for information purposes only and are not to be used or considered as an offer or the solicitation of an offer to sell or to buy or subscribe for securities or other financial instruments. CS may not have taken any steps to ensure that the securities referred to in this report are suitable for any particular investor. CS will not treat recipients of this report as its customers by virtue of their receiving this report. The investments and services contained or referred to in this report may not be suitable for you and it is recommended that you consult an independent investment advisor if you are in doubt about such investments or investment services. Nothing in this report constitutes investment, legal, accounting or tax advice, or a representation that any investment or strategy is suitable or appropriate to your individual circumstances, or otherwise constitutes a personal recommendation to you. Please note in particular that the bases and levels of taxation may change. Information and opinions presented in this report have been obtained or derived from sources believed by CS to be reliable, but CS makes no representation as to their accuracy or completeness. CS accepts no liability for loss arising from the use of the material presented in this report, except that this exclusion of liability does not apply to the extent that such liability arises under specific statutes or regulations applicable to CS. This report is not to be relied upon in substitution for the exercise of independent judgment. CS may have issued, and may in the future issue, other communications that are inconsistent with, and reach different conclusions from, the information presented in this report. Those communications reflect the different assumptions, views and analytical methods of the analysts who prepared them and CS is under no obligation to ensure that such other communications are brought to the attention of any recipient of this report. Some investments referred to in this report will be offered solely by a single entity and in the case of some investments solely by CS, or an associate of CS or CS may be the only market maker in such investments. Past performance should not be taken as an indication or guarantee of future performance, and no representation or warranty, express or implied, is made regarding future performance. Information, opinions and estimates contained in this report reflect a judgment at its original date of publication by CS and are subject to change without notice. The price, value of and income from any of the securities or financial instruments mentioned in this report can fall as well as rise. The value of securities and financial instruments is subject to exchange rate fluctuation that may have a positive or adverse effect on the price or income of such securities or financial instruments. Investors in securities such as ADR's, the values of which are influenced by currency volatility, effectively assume this risk. Structured securities are complex instruments, typically involve a high degree of risk and are intended for sale only to sophisticated investors who are capable of understanding and assuming the risks involved. The market value of any structured security may be affected by changes in economic, financial and political factors (including, but not limited to, spot and forward interest and exchange rates), time to maturity, market conditions and volatility, and the credit quality of any issuer or reference issuer. Any investor interested in purchasing a structured product should conduct their own investigation and analysis of the product and consult with their own professional advisers as to the risks involved in making such a purchase. Some investments discussed in this report may have a high level of volatility. High volatility investments may experience sudden and large falls in their value causing losses when that investment is realised. Those losses may equal your original investment. Indeed, in the case of some investments the potential losses may exceed the amount of initial investment and, in such circumstances, you may be required to pay more money to support those losses. Income yields from investments may fluctuate and, in consequence, initial capital paid to make the investment may be used as part of that income yield. Some investments may not be readily realisable and it may be difficult to sell or realise those investments, similarly it may prove difficult for you to obtain reliable information about the value, or risks, to which such an investment is exposed. This report may provide the addresses of, or contain hyperlinks to, websites. Except to the extent to which the report refers to website material of CS, CS has not reviewed any such site and takes no responsibility for the content contained therein. Such address or hyperlink (including addresses or hyperlinks to CS's own website material) is provided solely for your convenience and information and the content of any such website does not in any way form part of this document. Accessing such website or following such link through this report or CS's website shall be at your own risk. This report is issued and distributed in European Union (except Germany and Spain): by Credit Suisse Securities (Europe) Limited, One Cabot Square, London E14 4QJ, England, which is authorised by the Prudential Regulation Authority and regulated by the Financial Conduct Authority and the Prudential Regulation Authority; Spain: Credit Suisse Securities, Sociedad de Valores, S.A. (“CSSSV”) regulated by the Comision Nacional del Mercado de Valores; Germany: Credit Suisse (Deutschland) Aktiengesellschaft regulated by the Bundesanstalt fuer Finanzdienstleistungsaufsicht ("BaFin"). United States: Credit Suisse Securities (USA) LLC; Canada: Credit Suisse Securities (Canada), Inc.; Switzerland: Credit Suisse AG; Brazil: Banco de Investimentos Credit Suisse (Brasil) S.A or its affiliates; Mexico: Banco Credit Suisse (México), S.A., Institución de Banca Múltiple, Grupo Financiero Credit Suisse (México) and Casa de Bolsa Credit Suisse (México), S.A. de C.V., Grupo Financiero Credit Suisse (México) ("Credit Suisse Mexico"). This document has been prepared for information purposes only and is exclusively distributed in Mexico to Institutional Investors. Credit Suisse Mexico is not responsible for any onward distribution of this report to non-institutional investors by any third party. The authors of this report have not received payment or compensation from any entity or company other than from the relevant Credit Suisse Group company employing them; Japan: by Credit Suisse Securities (Japan) Limited, Financial Instruments Firm, Director-General of Kanto Local Finance Bureau ( Kinsho) No. 66, a member of Japan Securities Dealers Association, The Financial Futures Association of Japan, Japan Investment Advisers Association, Type II Financial Instruments Firms Association; Hong Kong: Credit Suisse (Hong Kong) Limited; Australia: Credit Suisse Equities (Australia) Limited; Thailand: Credit Suisse Securities (Thailand) Limited, regulated by the Office of the Securities and Exchange Commission, Thailand, having registered address at 990 Abdulrahim Place, 27th Floor, Unit 2701, Rama IV Road, Silom, Bangrak, Bangkok10500, Thailand, Tel. +66 2614 6000; Malaysia: Credit Suisse Securities (Malaysia) Sdn Bhd; Singapore: Credit Suisse AG, Singapore Branch; India: Credit Suisse Securities (India) Private Limited (CIN no.U67120MH1996PTC104392) regulated by the Securities and Exchange Board of India as Research Analyst (registration no. INH 000001030) and as Stock Broker (registration no. INZ000248233), having registered address at 9th Floor, Ceejay House, Dr.A.B. Road, Worli, Mumbai - 18, India, T- +91-22 6777 3777; South Korea: Credit Suisse Securities (Europe) Limited, Seoul Branch; Taiwan: Credit Suisse AG Taipei Securities Branch; Indonesia: PT Credit Suisse Sekuritas Indonesia; Philippines:Credit Suisse Securities (Philippines ) Inc., and elsewhere in the world by the relevant authorised affiliate of the above. Additional Regional Disclaimers Australia: Credit Suisse Securities (Europe) Limited ("CSSEL") and Credit Suisse International ("CSI") are authorised by the Prudential Regulation Authority and regulated by the Financial Conduct Authority ("FCA") and the Prudential Regulation Authority under UK laws, which differ from Australian Laws. CSSEL and CSI do not hold an Australian Financial Services Licence ("AFSL") and are exempt from the requirement to hold an AFSL under the Corporations Act (Cth) 2001 ("Corporations Act") in respect of the financial services provided to Australian wholesale clients (within the meaning of section 761G of the Corporations Act) (hereinafter referred to as “Financial Services”). This material is not for distribution to retail clients and is directed exclusively at Credit Suisse's professional clients and eligible counterparties as defined by the FCA, and wholesale clients as defined under section 761G of the Corporations Act. Credit Suisse (Hong Kong) Limited ("CSHK") is licensed and regulated by the Securities and Futures Commission of Hong Kong under the laws of Hong Kong, which differ from Australian laws. CSHKL does not hold an AFSL and is exempt from the requirement to hold an AFSL under the Corporations Act in respect of providing Financial Services. Investment banking services in the United States are provided by Credit Suisse Securities (USA) LLC, an affiliate of Credit Suisse Group. CSSU is regulated by the United States Securities and Exchange Commission under United States laws, which differ from Australian laws. CSSU does not hold an AFSL and is exempt from the requirement to hold an AFSL under the Corporations Act in respect of providing Financial Services. Credit Suisse Asset Management LLC (CSAM) is authorised by the Securities and Exchange Commission under US laws, which differ from Australian laws. CSAM does not hold an AFSL and is exempt from the requirement to hold an AFSL under the Corporations Act in respect of providing Financial Services. This material is provided solely to Institutional Accounts (as defined in the FINRA rules) who are Eligible Contract Participants (as defined in the US Commodity Exchange Act). Credit Suisse Equities (Australia) Limited (ABN 35 068 232 708) ("CSEAL") is an AFSL holder in Australia (AFSL 237237). Malaysia: Research provided to residents of Malaysia is authorised by the Head of Research for Credit Suisse Securities (Malaysia) Sdn Bhd, to whom they should direct any queries on +603 2723 2020. Singapore: This report has been prepared and issued for distribution in Singapore to institutional investors, accredited investors and expert investors (each as defined under the Financial Advisers Regulations) only, and is also distributed by Credit Suisse AG, Singapore Branch to overseas investors (as defined under the Financial Advisers Regulations). Credit Suisse AG, Singapore Branch may distribute reports produced by its foreign entities or affiliates pursuant to an arrangement under Regulation 32C of the Financial Advisers Regulations. Singapore recipients should contact Credit Suisse AG, Singapore Branch at +65-6212-2000 for matters arising from, or in connection with, this report. By virtue of your status as an institutional investor, accredited investor, expert investor or overseas investor, Credit Suisse AG, Singapore Branch is exempted from complying with certain compliance requirements under the Financial Advisers Act, Chapter 110 of Singapore (the “FAA”), the Financial Advisers Regulations and the relevant Notices and Guidelines issued thereunder, in respect of any financial advisory service which Credit Suisse AG, Singapore Branch may provide to you. EU: This report has been produced by subsidiaries and affiliates of Credit Suisse operating under its Global Markets Division In jurisdictions where CS is not already registered or licensed to trade in securities, transactions will only be effected in accordance with applicable securities legislation, which will vary from jurisdiction to jurisdiction and may require that the trade be made in accordance with applicable exemptions from registration or licensing requirements. This material is issued and distributed in the U.S. by CSSU, a member of NYSE, FINRA, SIPC and the NFA, and CSSU accepts responsibility for its contents. Clients should contact analysts and execute transactions through a Credit Suisse subsidiary or affiliate in their home jurisdiction unless governing law permits otherwise. CS may provide various services to US municipal entities or obligated persons ("municipalities"), including suggesting individual transactions or trades and entering into such transactions. Any services CS provides to municipalities are not viewed as "advice" within the meaning of Section 975 of the Dodd-Frank Wall Street Reform and Consumer Protection Act. CS is providing any such services and related information solely on an arm's length basis and not as an advisor or fiduciary to the municipality. In connection with the provision of the any such services, there is no agreement, direct or indirect, between any municipality (including the officials,management, employees or agents thereof) and CS for CS to provide advice to the municipality. Municipalities should consult with their financial, accounting and legal advisors regarding any such services provided by CS. In addition, CS is not acting for direct or indirect compensation to solicit the municipality on behalf of an unaffiliated broker, dealer, municipal securities dealer, municipal advisor, or investment adviser for the purpose of obtaining or retaining an engagement by the municipality for or in connection with Municipal Financial Products, the issuance of municipal securities, or of an investment adviser to provide investment advisory services to or on behalf of the municipality. If this report is being distributed by a financial institution other than Credit Suisse AG, or its affiliates, that financial institution is solely responsible for distribution. Clients of that institution should contact that institution to effect a transaction in the securities mentioned in this report or require further information. This report does not constitute investment advice by Credit Suisse to the clients of the distributing financial institution, and neither Credit Suisse AG, its affiliates, and their respective officers, directors and employees accept any liability whatsoever for any direct or consequential loss arising from their use of this report or its content. No information or communication provided herein or otherwise is intended to be, or should be construed as, a recommendation within the meaning of the US Department of Labor’s final regulation defining "investment advice" for purposes of the Employee Retirement Income Security Act of 1974, as amended and Section 4975 of the Internal Revenue Code of 1986, as amended, and the information provided herein is intended to be general information, and should not be construed as, providing investment advice (impartial or otherwise). Copyright © 2020 CREDIT SUISSE AG and/or its affiliates. All rights reserved. When you purchase non-listed Japanese fixed income securities (Japanese government bonds, Japanese municipal bonds, Japanese government guaranteed bonds, Japanese corporate bonds) from CS as a seller, you will be requested to pay the purchase price only.