urbann mobility y management - home / senatsverwaltung
TRANSCRIPT

ommommiissssii
World Association of the Major Metropolises
ononommommiissssiionon
UUrrbbaann MMoobbiilliittyy MMaannaaggeemmeenntt
Urban Commercial Transport
Background Paper for the Commission 4 Meeting on
22nd October 2008
9th Metropolis World Congress Sydney


44CCC4C4omomomommmmmiiiissssssssiiiionononon
Metropolis 2008
Commission 4: Urban Mobility Management
Urban Commercial Transport
Background Paper in Preparation of the Metropolis Conference
Sydney, 22 October 2008
Issued in August 2008
Cover Picture: Kuala Lumpur Courtesy of GTZ: GTZ Transport Photo DVD, November 2006 Photographer: Roland Haas

44CCC44Commommomommmiiiissssssssiiiionononon
Metropolis Commission 4
Presidency Berlin: Ingeborg Junge-Reyer Mayor and Senator for Urban Development, Berlin
Vice Presidency Seoul: Sangbum Kim Assistant Mayor of City Transportation Headquarters
Cities: Abidjan, Antananarivo, Barcelona, Belo Horizonte, Berlin, Brussels, Bucharest, Casablanca, Esfahan, Gwuangju, Hangzhou, Istanbul, Kinshasa, Kolkata, La Habana, Mashhad, Mexico (State of), Montreal, Moscow, Puebla de Zaragoza, Seoul, Sofia, Stockholm, Tehran, Toronto
Berlin Working Group in the Senate Department for Urban Development: Barbara Berninger Metropolis Commission 4 Coordinator Senate Department for Urban Development, Head of the Office for EU and International Affairs, Berlin
Lutz Paproth Executive Officer Metropolis Commission 4 Senate Department for Urban Development, EU and International Affairs, Berlin
Dr. Friedemann Kunst, Senate Department for Urban Development, Head of Transportation Division
Authors: Diana Runge & Hans-Joachim Becker Technical University Berlin, Department for Integrated Transport Planning
with the support of: Urte Schwedler & Michael Abraham Technical University Berlin, Department for Integrated Transport Planning
Metropolis: Secretariat General Ajuntament de Barcelona Avinyó 15 08002 Barcelona (Spain) www.metropolis.org

Urban Commercial Transport Background Paper for the Meeting in Sydney, October 2008
Contents
0. Instead of an introduction: „Commercial transport? So what?”...............................1
1. Commercial transport – moving the world, keeping cities alive. ..............................2
1.1. A world in motion .......................................................................................................3
1.2. Global trade with local impacts..............................................................................5
1.3. Go with the flow? .......................................................................................................7
2. Let’s get moving ...............................................................................................................10
2.1. Urban logistics ...........................................................................................................12
2.1.1. The Intelligent Commercial Vehicle Approach ..................................................... 14
2.1.2. The clean vehicle technology approach............................................................... 16
2.1.3. The incentives approach ........................................................................................... 21
Access Strategies....................................................................................................... 21
Parking strategies....................................................................................................... 24
2.1.4. Technology and ICT.................................................................................................... 28
2.2. Certainly not least: the last mile.............................................................................29
2.3. Shifting the mode .....................................................................................................32
2.3.1. By foot, by bike, on cart, on time: Non-motorised goods transportation .......... 32
Hauling and rolling in cities of the developing world .......................................... 33
Pedalling and speeding in cities of the developed world ................................. 38
2.3.2. Combining public and freight transportation ........................................................ 41
A historian’s memory is a futurologist’s dream: underground freight networks41
Historic concepts made fit for the future: cargo trams....................................... 43
2.4. Work in progress. Construction site logistics.........................................................45
2.5. Mutual dependence, common interests? Ports and their hinterland ............48
3. Wrapping things up..........................................................................................................52
Annex 1: List of Abbreviations .......................................................................................54
Annex 2: Overview of Cited European Projects ........................................................55
Annex 3: Picture credits..................................................................................................56
Annex 4: Endnotes (References) ..................................................................................57

Association of the Major Metropolises Commission4: Urban Mobility Management
List of Figures
Figure 1: Types of commercial transport .............................................................................................. 2
Figure 2: Inter- and Intra Urban Freight Distribution ............................................................................ 3
Figure 3: Spatial patterns of freight flows entering a city without or with a UDC ........................ 16
Figure 4: The last mile in the transport chain...................................................................................... 29
Figure 5: Development of the port of Rotterdam............................................................................. 51
List of Tables
Table 1: Estimates of the severity of urban transport problems (5=great problem; 0 = no problem).................................................................................................................................................... 6
Table 2: Actor-related problems ........................................................................................................... 7
Table 3: Actor-related objectives.......................................................................................................... 9
Table 4: Urban commercial transport measures for public actors................................................. 11
Table 5: Urban commercial transport measures for private actors ............................................... 12
Table 6: Commercial transport strategies, measures and approaches applied in 20 CIVITAS cities ......................................................................................................................................................... 13
Table 7: Overview of evolvement of emission standards in Europe since 1996........................... 17
Table 8: Evolvement of emission standards for new vehicles (light duty) in different countries 18
Table 9: Alternative fuels and vehicle propulsion technologies..................................................... 19
Table 10: Comparison of likely effects of access strategies in cities.............................................. 24
Table 11: Advantages and limits of cargo trams ............................................................................. 45

Urban Commercial Transport Background Paper for the Meeting in Sydney, October 2008
0. Instead of an introduction: “Commercial transport? So what?”
Commercial urban transport is not a widely discussed issue in urban transport planning and management. Why then, one could ask, should it be a topic for the Mobility Commission of one of the world’s largest network of metropolises?
The formal answer to this is: The Commission has devoted itself to dealing with the subject when adopting the Declaration for Sustainable Urban Mobility Management during the 8th World Congress of Metropolis in Berlin, 2005. The relevant paragraph on urban freight / commercial transport stated the following:
“For many years, freight transportation has been neglected in transport planning and policy and thus, practices and routines have been established, which now cause major problems for our cities. We therefore recommend that each city assesses the ways freight transport is being handled at the moment and the implications this might have in the future. We strongly support the co-ordination of freight movements, the strengthening of rail and water-bound transportation of goods, and the establishment, implementation and strategic use of innovative ways of handling freight. In order to do so, all possibilities should be explored and implemented according to the existing conditions and most pressing challenges.”1
A second possible answer is related to the first one: the declared intentions have as yet to expand into real life.
A third option to answer the question is that commercial transport is vital for cities all over the world. It keeps them alive and functioning, yet it also causes a lot of problems, which are not easy to remedy and avoid. It is both a fascinating and a challenging subject to deal with.
The paper at hand attempts to provide an overview of commercial transport and the various issues related to it. In addition, it is attempted to take stock of the situation in cities around the world, the distinct problems and the different solutions including their expected and achieved outcome. The idea behind this approach is to provide the ground for the discussions to be held during the upcoming meeting of Commission 4 during the 9th World Congress of Metropolis in Sydney, October 2008. There, selected speakers, representatives from international institutions and delegates from cities from all over the world will add more details and facts to the overview provided here.
In dealing with the subject of commercial transport, Commission 4 will fulfil the agenda it had set itself in Berlin in 2005. Thus, it will keep the promise to its members that all areas of urban mobility will be considered, and that there shall be no shying away from the difficult ones.
In the first chapter of this paper, some more general information on commercial urban transportation will be provided, including definitions and interrelations with other global and local developments. It is thereby attempted to approach the subject from various perspectives, thus raising awareness for the multitude of aspects related to it.
The second and main part of the paper will present some possible solutions to urban commercial transport issues. Moreover, case studies from selected cities will be cited in order to illustrate how theoretical concepts may be adjusted to fit the requirements of implementation real life. Thereby, numerous sources of information have been consulted. Most noteworthy a number of research and implementation projects on international level were reviewed in order to have their main conclusions compiled on the following pages. References are provided in the Annex, which may also be used as a starting point for further investigations into the subject. Lastly, the final chapter will attempt to summarise the state of the art regarding commercial transport and will conclude in some suggestions for the discussions to be held in Sydney.
1

Association of the Major Metropolises Commission4: Urban Mobility Management
1. Commercial transport – moving the world, keepingcities alive.
The attempt to state what commercial transport is, why it is important, why it causes problems and what should and could be done about it is fit to fill book shelves by the meter. However, for the purpose of this paper merely a couple of pages are available, which is why some quick glancing over some of important aspects of the present debate will have to do.
The present chapter will briefly outline three of those aspects. Thereby, the purpose is to provide sufficient background information to allow for a better understanding of the following case studies. Furthermore, it is attempted to draw a picture of the many facets, which make commercial transport both a difficult and a fascinating topic to deal with.
By and large, commercial transport can be subdivided into two domains: the transporting of goods (freight transport) and the transporting of people for business and commercial reasons (see figure 1).
Figure 1: Types of commercial transport2
ComCommmeerrccial Tial Trransansporportt
GGoodsoods // FFrreighteight SerServviciceses / People/ People
�� �� �� �� �� ��
DelDeliveriveriesies ffoorr rreetail and wtail and whhole sole saaleingleing PosPosttal sal shhippingippingss ((lletteretterss,, pacpackkageagess,, etcetc..)) TTrrananssppoorrting oting off halfhalf--//ffinisinishehedd pprroducoducttss TTrrananssppoorrting oting off rraaww mmaaterteriialsals MovemMovementsents ooff cconsonstrtruucctiotionn sseeccttoror DisDispatcpatchheess ffrroomm rreetailertailerss
�� �� �� ��
CrCrafaftsmtsmen, tren, traderaderss CosCostutummeerr,, cclientlient and rand repairepair sseerrvviciceses SalesSalesmmenen OOttherher trtraaffffiicc rreessuulting flting frroomm exexerercciissiing a jng a joobb ((iincncludludiing bng buussiinesnesss trtripsips))
�� ��
DisDisposposal (garal (garbage,bage, wwaasstte, road ce, road clleanseansing, etcing, etc..)) TTrrananssppoorrt ot off eenernerggyy ssourourcceess ((ooil,il, ccoal,oal, wwood,ood, eettcc..))
The focus of this paper, and the focus of projects dealing with commercial transport in general, is on the freight component of commercial transport. However, the transporting of people should not be underestimated. While data availability is scarce, basic estimations show that the transporting of people for business reasons causes more traffic than the transporting of goods in urban areas. Cautious estimations assume that 20-30 per cent of daytime urban traffic is caused people’s business-related mobility demands.3
As shown in the figure above, freight distribution includes a broad variety of possible loads. As a result, the flow of freight transports originates from a range of sources, it uses different modes in order to reach numerous locations in the city. Thereby, urban boundaries may be crossed more than just once, and both long and close distance haulage (including the terminal functions in nodes between long haulage transport and city distribution) need to be considered. What is more, the following also needs to be taken into account:
“The overall system consists of various actors (transport providers, transport receivers, authorities, residents, visitors) interacting according to their own interests, influencing and being influenced by the urban environment in which land use, economics, environmental issues, safety issues, infrastructure and transport issues play a role. This highly dynamic, integrated and complex process finally generates flows (goods, waste, return shipments, money, information) between different groups of actors, creates general economic efficiency and new land use patterns but also causes conflicts and problems in many … cities.”4
2

Retail storesOther
companies
Public SectorHouseholds
CompaniesAuthoritiesInhabitants
Environment, Land use, Econ.
efficiency, Service level
Intra-City Transport
IndustryImporters
WholesalersCentral
warehouses
Intermediary warehouses,
terminals
Environ-ment
External effects
Information flows
Return and recycling flows
Mone flows
City Logistics Development Measures
Urban Commercial Transport Background Paper for the Meeting in Sydney, October 2008
Figure 2: Inter- and Intra Urban Freight Distribution5
y
Inter-CityTransport
Retail stores Other
companies
Public Sector Households
Companies Authorities Inhabitants
Environment, Land use, Econ.
efficiency, Service level
Intra-City Transport
Industry Importers
Wholesalers Central
warehouses
Intermediary warehouses,
terminals
Environ-ment
External effects
Information flows
Return and recycling flows
Money flows
City Logistics Development Measures
Inter-City Transport
The continuous flow of goods is essential for cities, their local economies and their citizens. Materials, goods, products and services need to be brought from those who provide them to those who need them. Without commercial transport of all the different kinds, cities would soon lose their ability to house, feed, employ, entertain and care for their citizens. So, it is commercial transport that keeps cities functioning – and thriving. Even more so as profound changes in national and global economic systems as well as perpetual urban growth lead to the continuous growth in commercial transport streams, as will be explored in the following.
1.1.A world in motion
The dynamics in freight transportation as such may be traced back to overall economic developments, which are often subsumed under the term globalisation. Globalisation may be understood as an economic phenomenon, involving the increasing interaction, or integration, of national economic systems through the growth in international trade, investment and capital flows. In addition, it also generates a rapid increase in cross-border social, cultural and technological exchange.6 However, globalisation is not an entirely new phenomenon. According to the World Bank, the following should be kept in mind:
“Indeed, at a basic level, it has been an aspect of the human story from earliest times, as widely scattered populations gradually became involved in more extensive and complicated economic relations. In the modern era, globalization saw an earlier flowering towards the end of the 19th century, mainly among the countries that are today developed or rich. For many of these countries trade and capital market flows relative to GDP were close to or higher than in recent years. That earlier peak of globalization was reversed in the first half of the 20th century.”7
In the past 50 years various developments in international relations provided a framework for unprecedented strong international economic integration again. What is more, the opening up of local markets was also supported by a generally stronger reliance on ‘the’ market and private enterprises.
3

Association of the Major Metropolises Commission4: Urban Mobility Management
A boost in trading made the division of labour, production and services not only possible, it was also an inevitable consequence that the flows of physical goods and services would increase together with non-physical flows of capital, investments and information. For example, the tonnes of goods traded around the world have grown by 16 times since 1950, reflecting the lowering of tariff barriers. The growth of trade in services is even greater.8
Global trade by a modern containership
Trading is, to a large degree, related to freight mobility. From raw materials to high-end technology products, the majority of items for consumption and a large fraction of materials for manufacturing is moved around the globe by ship, on roads, in planes or on rails. Freight mobility has allowed many countries to improve their incomes, standards of living and quality of life. Exporting nations, like Japan, China, Germany, etc., rely on inexpensive, reliable movement of freight. What is more, freight can also save societies from starvation and remedy the effects of natural disaster, such as earthquakes, floodings or hurricanes, if and when food and aid deliveries quickly and efficiently reach their needy recipients.
Modern railways, highways, ports and airports are essential for integrating a nation’s economy and for reaching world markets. What is more, good national and regional freight systems support economic growth and world trade by giving manufacturers and consumers numerous and cheap choices of materials and products. 9 Within national boundaries, goods and services are transported from manufacturers to wholesalers, to traders, to dealers and salesmen, to shops and vendors and lastly to the consumers.
Therefore, in urban areas, the primary function of the freight system is to support the local population by distributing food, water, energy, information (such as mail, newspapers, magazines, catalogues), clothing, and housing, and other areas of the economy. This involves bringing fuel for homes and businesses, re-supply stores and markets, distribute food and other goods to households, restock inventories and inputs for local businesses, and remove garbage and waste. Freight relations to fulfil these tasks connect the city, its markets, shopping and business areas to larger supply areas, to rural hinterlands and – over cargo hubs, et cetera – to national and again international economies.
Changing spatial and functional structures of cities lead to increasing distances that need to be overcome by freight as well as passenger transportation. Most noteworthy, the abandonment of the traditional mix of uses and its replacement by single-purpose quarters (mono-functional business districts or suburban housing estates) cause distances to become longer and transport demands to increase.
4

Urban Commercial Transport Background Paper for the Meeting in Sydney, October 2008
In virtually all cities cargo and freight movements as well as service provision on regional and local level rely heavily on trucks in all shapes and sizes. Other transport means may also play a distinct role, but the heavy dependence on motorised movements increasingly causes commercial transport to be a problem for transport planners – and a problem for itself.
In the same manner, service providers also move around urban areas. Roofers, plumbers, doctors, cleaners, cable and telecommunication providers, lawyers, and real estate managers, in fact all businesses that involve visiting clients at home, add to the daily commercial and mainly car-based transport streams in cities. These are subject to another overall trend, the impact of which is as yet difficult to analyse. In conjunction with globalised production, working hours become more flexible and less distinguishable from other times. Thus, the life of – and in – the city is in many cases no longer governed by natural rhythms or by traditional nine-to-five working hours.10 As a consequence, service and delivery hours are no longer clearly distinguishable, yet they are transformed to all-day traffic heights.
1.2.Global trade with local impacts
Some of the positive effects of local commercial transport have already been mentioned. Additionally, many agglomerations were once founded along trade lines and crossroads and have either managed to continue this tradition or else try to make use of possible geographic and logistic advantages. The transportation of goods on the urban scale is also an important source of income for many people. Last but not least, the ability to transport goods and products into the city is crucial for those producing them: be it multi-lateral international corporations or the small-area farmer in the urban hinterland.
With transportation gaining an increasing importance, the number of traffic movements, both in distances travelled and tonnage transported, show rapid rates of growth. When it comes to modal split, air freight and waterways take on the leading role in global transportation. National haulage is usually done by rail, water and road, yet on the urban scale road transportation takes on the leading role. This is due partly to the availability of infrastructure, but moreover to the character of the goods transported on local and regional scale. Freight transport distances in urban areas are usually too short for rail or water transport to be economically viable. The demand for specialised goods transported in small units as well as flexible delivery is a further driver of road transportation.
Additionally, developing countries often maintain freight links with their rural hinterlands, out of which mainly food, agriculture goods and products from local production are being delivered into the city. These deliveries are often carried out by small transport companies, by individual entrepreneurs or even by the farmers themselves. Since no co-ordination and management of the transport movements take place, over-crowding of the access roads and the inner city market places are drawbacks frequently complained about. Changes in the economic situation of a city generally lead to changes in freight transport, the results of which are often not sufficiently anticipated. Consequently, road congestion, noise and dust emissions caused by trucks and delivery vans become more and more of a problem for metropolitan areas.
Thus, it can be stated that keeping businesses supplied, shops stocked, people employed, and costumers happy are achievements that come at a cost.
Both as a consequence and an indicator for that one might refer back to a survey conducted by Metropolis Commission 4 in 2003, asking for typical developments and problems as well as solution approaches in Metropolis member cities. Freight transport by road was named as a highly sever problem by most of the cities in their replies, together with follow-up effects, such as congestion, noise and air pollution (see following table 1 for the detailed results).11
5

Association of the Major Metropolises Commission4: Urban Mobility Management
Table 1: Estimates of the severity of urban transport problems (5=great problem; 0 = no problem)12
Bar
celo
na
Belo
Hor
izont
e
Berli
n
Brus
sels
Lisbo
n
Lond
on
Mas
hhad
Mex
ico
City
Mos
cow
Paris
Freight transport by road 4 1 5 4 5 3 5 5 4 4
Congestion 3 3 3 3 n.s. 3 3 5 5 3
Noise / Air Pollution 3 3 5 4 5 3 4 5 2 4
Despite awareness for the problems resulting from commercial and freight transport, these do not constitute main targets of transport planning in the cities. Likewise, cases of best practise are also hard to come by. 13
In 2003, most Commission 4 cities reported an increase in freight transport, which mainly took place in the road based sector.
In Abidjan, commercial traffic for provisioning the markets with food increasingly leads to the crowding of main artery roads, especially during rush hours. Even though heavy goods vehicles are not permitted into the inner city during peak times, the noise and pollution arising from trucks, vans and other means of local freight transport negatively affect the life in the city.
Belo Horizonte, Berlin and London have experienced a decline in the use of water and railway freight transportation, which in turn led to an increase in road bound goods traffic. Changing consumption patterns, supported for example by on-demand ordering online cause a trend towards flexible and short-time delivery of small units of goods, which again is almost exclusively handled as a matter of road based freight transportation.
Freight transport by road is a serious problem for many cities
Numerous negative impacts are linked to the ever increasing flows of commercial transport. Roads get crowded, and commercial vehicles that park in second or even third row, on footpaths and in emergency exits block the flow of traffic even further. Dust, noise, and pollutant emissions as well as the deterioration of urban space impede with the quality of life in urban areas. Regarding social aspects, underpaid labourers in tedious working conditions and a high rate of accidents caused by commercially used vehicles complete the canon of negative impacts at.
It is neither possible nor proper to assign blame to one side or another. Likewise, the mentioned problems affect all people, institutions and transport related actors, albeit in a different way and to different degrees as the following table illustrates.
6

Urban Commercial Transport Background Paper for the Meeting in Sydney, October 2008
Table 2: Actor-related problems14
Actors Problems
Publ
ic
Gen
era
lPu
blic Residents, Visitors,
Tourists, Employees hindrances from decreased accessibility, physical hindrances of vehicles blocking the roads, air pollution, nuisance
Aut
horit
ies
(Dep
artm
ents
) Economics
Land Use Transport
Infrastructure
Safety Environment
in addition to those problems experienced by general public and (partly by) companies:
� external factors: national government regulation, legislation, policy, international (e.g. EU) directives, etc.;
� internal factors: issues of private transport and matters not related to transport that impede with freight transport issues
Com
pani
es
Catering industry
Retail outlets
Service providers
Builders
late, wrong, damaged deliveries, out of stock problems, air and noise pollution from freight vehicles, accessibility problems (see public)
Tran
spor
t Cha
in Con
signe
es
(dem
and
go
ods) Companies, Public,
Construction Sites similar to companies on side of the city
Producers/ shippers (supply goods)
Road blockings (due to maintenance activities, terraces, advertising materials, congestions), too narrow streets for used types of vehicles, no parking place at delivery-location; specific rules and regulations for delivery vehicles (time windows, vehicle restrictions)
Transport Companies / logistic providers (deliver goods) similar to companies on side of the city
What holds generally true for most cities is that they have now acknowledged and started to address the central dilemma of freight transportation. This dilemma results from the convergent and partly contradictory interests of businesses (reduction of costs), clients and consumers (flexible supply, low prices), and municipalities (reduction of negative impacts, increase of quality of life). Thus, it appears that commercial transport is gradually becoming a ‘problem child’ of urban transport, since it develops according to rules that differ from those governing passenger traffic and, therefore, it defies conventional management efforts. Also, the power of public entities to steer developments in the commercial transport sector is somewhat limited.
1.3.Go with the flow?
Commercial transport appears to be a most heterogeneous topic. Regrettably, relatively little is known about commercial transport in comparison to the transporting of people. This is to a large degree also due to the increasing complexity of this particular segment of urban transportation.15
7

Association of the Major Metropolises Commission4: Urban Mobility Management
Declining transport costs and a change in production and distribution processing, furthered by the advanced use of communication and information technologies, have led to fundamental changes in the past decades. Local spatial conditions and proximity of entities have lost in relevance. Instead, ongoing globalisation and the development and strengthening of international political and economic ties lead to the internationalisation of production chains. Thus, it gets increasingly difficult to grasp the phenomenon of commercial transport or to even break it down to manageable analytical units. The diversity of influences that exists in the different economic branches pluralizes, as the number of actors as well as the influence of politics that need to be considered in the different national contexts increase. Already mentioned before was the heterogeneity of commercial transport in relation to the different kinds of goods (and services) that need to be transported, each requiring different transport conditions and handling modes.16
The complexity, the growth dynamics and the multitude of actors with their partly diverging economic as well as social interests increasingly spark the attention of both researchers and practicing experts in commercial transport. Thereby, researchers are often interested in the overall coherences and determinants of commercial transport. Nevertheless, this area of transport research is only to a limited degree suited for theoretical studies. Thus, research on the subject often tends to have a practical component, be the analysis of case studies of the conducting empirical studies that give way to concrete policy recommendations. Some of these studies also have quite an entertaining – or, seen from another perspective, frightening – edge to it, as the following two examples point out.
When published in the early 1990s as the first of its kind, the story of the German strawberry yogurt made headlines all over the world. A follow-up of the entire transport chain of the ingredients and packaging parts revealed that the yoghurt travels for nearly 7,000 km before reaching ones breakfast table as its final destination.17
A more recent study incorporates the global sphere even more by following the production and transportation chain of a personal computer from its various production sites to the final consumer. The study concludes that the individual parts of a PC and, lastly, the final device travel overwhelming 234,881 km, in the course of which they generate about 46 kg of CO2 emissions.18
Both of these studies conclude in similar recommendations for policy makers and manufacturers: In addition, the yoghurt-case study calls on the consumer him-/herself to become more aware of the transport and environment related consequences of daily supplies, and to adjust his/her behaviour in compliance with the often cited sustainable lifestyle. Policy makers are challenged to create the appropriate regulations for manufacturers, producers and transported, for example by internalising external costs, by taxing measures and implementing more fundamental approaches like the creation of urban settlement and economic structures that allow for short distances.19
Yet the outcome and, indeed, the feasibility of these recommendations are a different story all together.
While these and other studies of the kind are of high interest and relevance, they often fail to meet the needs of local decision makers attempting to remedy negative impacts of urban commercial traffic. Also, they bypass the interests of commercial transport providers, manufacturers and other links in the transport chain. Public and private interests can be very different from each other, which is pointed up to in the following comparative overview.
8

Urban Commercial Transport Background Paper for the Meeting in Sydney, October 2008
Table 3: Actor-related objectives20
Public objectives Private Objectives
�
�
�
Quality of life
- Safety (accidents, crime level, atmosphere)
- Environment (noise, emission, nuisance)
- Facilities (recreational facilities: parks, hotel and catering facilities, etc.)
Economic vitality (mix of economic activities that serve the public needs in terms of offering goods and services, employment and income)
Accessibility (time needed to travel to, within and from the city for different modalities and for both freight and persons)
�
�
… are primarily related to turnover levels
- sales levels
- costumer levels
- cost levels
- service levels
- competition
… include public objectives that are of immediate relevance for the private sector, such as
- accessibility
Even though commercial transport is a complex issue that remains to large parts outside the realms of public transport policy, this does not imply that cities should merely ‘go with the flow’, i.e. let the system develop unattended and unguided.
Despite partly diverging interests and limited steering power, both the public and the private sector comprise the means to shape not the overall system, but individual segments, like for example the vehicle fleet, times and places for commercial transport, environmental standards, etc.
Thereby, a prime objective for cities is to safeguard supply, but reduce the negative impacts of freight and goods transportation. However, the ways to achieve this aim depend on the situation in the city and the mechanisms and instruments available to those in charge.
Before taking a closer look at possible approaches, it is necessary to address another reason that sometimes makes it difficult for those who should deal with commercial transport to actually take up the task.
Commercial transport sometimes appears to be an unattractive and unrewarding sector of transport planning. This notion is furthered by what is sometimes termed “Freight’s Public Relation Problem”. In its core, the PR-problem relates to the fact that the relation between the truck on the road and the goods in the supermarket is not commonly understood in societies where production, distribution and consumption are dispersed – both spatially and time wise.21 Citizens, interests and environmental groups, political parties, and others who pressure local transport planners to reduce and interfere with commercial traffic do generally not consider the consequences to local economies and personal freight mobility. As an example, one can easily imagine citizens to protest against deliveries in supermarkets near residential areas at night time, since they cause a lot of noise and disturbances. Nevertheless, the very same citizens want to have their shop well stocked in the morning, with supplies lasting all day. In fact, they would probably even more protest when deliveries would have to be made for example midday. In order to do so, the shop would need to closed and shopping hours would, therefore, be reduced. While this is only one example, others are easily imaginable.
Thus, the task falls to the planners to keep a balance between local transport goals and economic considerations usually voiced by businesses and commercial transport providers as well as the requirements of citizens.
9

Association of the Major Metropolises Commission4: Urban Mobility Management
2. Let’s get moving
To sum up the previous chapter, the following may be used as a starting point for dealing with commercial transport in cities:
� Commercial transport comprises of various segments, including goods, people, long-and shortdistance transportation, etc.
� Commercial transport streams strongly depend on overall economic developments, on urban and functional structures, and on consumption and demand patterns of costumers.
� The supply of goods to and within a city is of major importance to local economies and determines also the quality of life in cities. Commercial transport, thus, fulfils the important role of keeping cities thriving and developing.
� The heavy dependence on road transportation causes a variety of negative impacts, such as air and noise pollution, accidents, disturbances to traffic and space, which affect everyone.
� Along the transport chain a number of actors both public and private are involved, yet their interests and their notion as to what good commercial transport is might differ.
� Out of the ‘toolbox’ of urban transport planning, the matching mix of instruments and measures must be chosen and applied in order to shape commercial transport in such a way as to maximise its benefits and limit its negative impacts.
� Because of its character as a privately organised transport chain, which is mainly focussed on maximising turnovers, urban freight and service transfer defies traditional planning and management approaches.
The present chapter will now take a closer look at the aforementioned ‘toolbox’. To stick with this metaphor, the aim is to show which tools have proved suitable for adjusting loose screws, for shaping frames and mending dents. Thereby, it is neither attempted to suggest a set of one-fits-all tools, nor is it envisage to ‘sell’ best practice examples. Instead, the aim is to show the range of available instruments as well as different ways of using them. Moreover, the presented case studies should dwell not so much on the theory, but on the concrete outcomes of their implementation, both positive and negative.
The presented case studies are not exhaustive, and they do not cover every last detail. Even more striking, they focus on certain parts of the world and certain types of cities while leaving others out of its focus. In fact, the Eurocentric character of the following chapter is a result mainly of the fact that commercial transport has for some decades now been a specific area of European urban transport policy. The European Union is strongly involved in the funding of research and demonstration projects in the sector, with encouraging results and many lessons learnt that are of interest to cities worldwide. Thereby, it is not implied that other parts of the world neglect commercial transport. In fact, it is endeavoured to cite commercial transport approaches from around the world. However, many projects outside the European Union or indeed outside the realm of any international (funding and support) body are not always well documented, which may probably be seen as a symptom of the casual attitude, with which the subject is often being treated.
The chapter will start with an overview of targets and solutions aimed at and applied by first, the public, and second, the private sector. The following chapters will then take a closer look at the different concepts and related practical examples. Thereby, a wide range of approaches is covered. This part of the paper may, thus, be understood as a compendium of options rather than as being of recommendatory character.
10

Association of the Major Metropolises Commission4: Urban Mobility Management
Table 4: Urban commercial transport measures for public actors22
Public
Policy Themes
� Land use policy � Transport and Infrastructure Policy
� Economic Policy � Environmental and safety policy
supported by instruments, e.g.
� Framework development � Rules and regulations
� ‘Stimulating’ policies (subsidies, grants, etc.) � Reprimanding policies
Most relevant solutions Main target Side effects / Drawbacks
increase capacity of roads to overcome bottlenecks interference with other urban policies
restrictions in access to cities and parking restrictions - inner-city or pedestrian streets - restrictions posed to vehicle size and access time by
implementing access control systems
avoid congestion in inner cities during opening hours of shops, avoid damage to infrastructure and buildings
difficulties for transport operators to get their shipping to clients at demanded time
urban distribution centres / zones - transport companies to drop their shipments at a
distribution centre where the goods are consolidated and then delivered in full-loaded vehicles instead of many less-than-truck loads
reduce number of delivery vehicles (and their generated impacts) in urban area
number of vehicles might actually increase due to substitution of small number of heavy trucks with increased number of lighter delivery vans, negative environmental balance probable
environmentally friendly vehicles reduce pollution levels and save energy extra costs for transport operators who have to adapt their equipment
out-of-hours delivery fighting peak-time congestion production of disturbances, mainly noise, at (sensitive) night times when residents are sleeping
modal shift - shifting transport from roads to water, bi-or tricycles
and underground systems; - separate passenger traffic from freight traffic
- to forego environmental and spatial problems resulting from dominance of road based delivery streams
- avoid mutual hindrances
new infrastructure needed, possible interference with other urban policies
expand the number of loading / unloading areas remedy problems resulting from limited parking space in cities interference with other urban policies
shift retail outlets to less congested areas - relates especially to large surface outlets that move to
suburbs
reduce deliveries and, thus, freight related traffic to and in dense and congested urban areas
negative impacts on economic function and attractiveness of the city generation of additional (customer) transport, mainly car based
11
Background Paper: Urban Commercial Transport as of 18/08/08
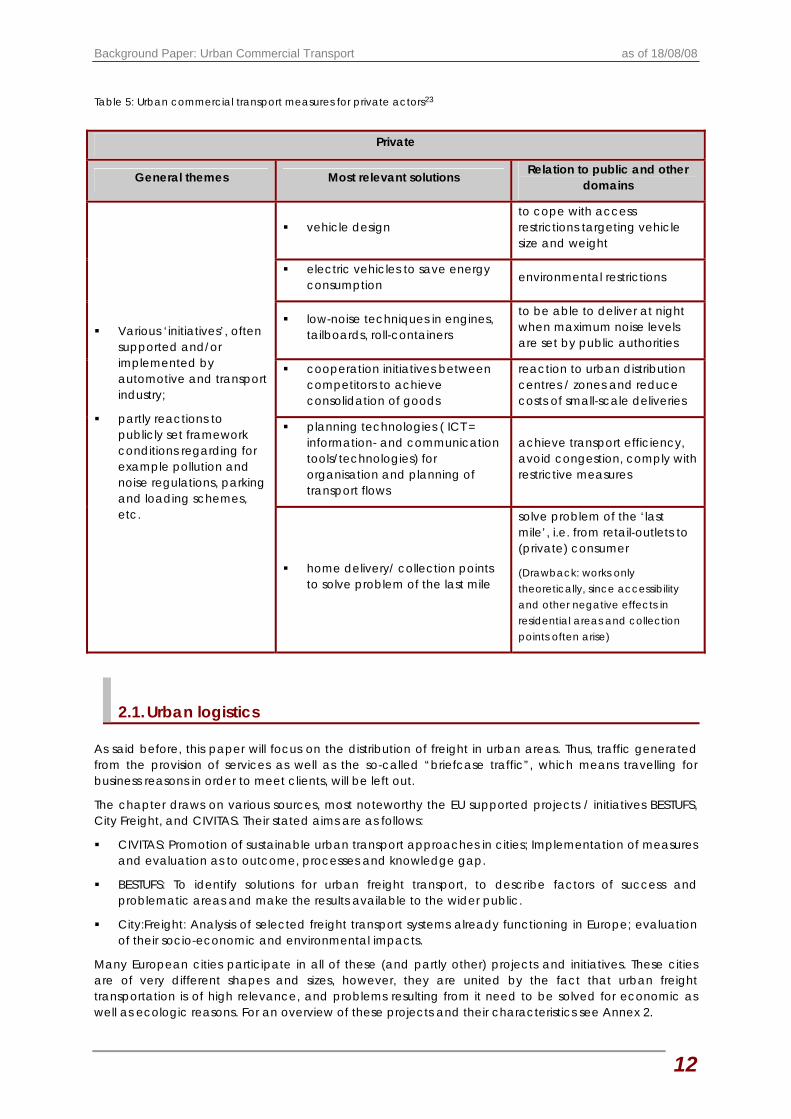
Table 5: Urban commercial transport measures for private actors23
Private
General themes Most relevant solutions Relation to public and other domains
�
�
Various ‘initiatives’, often supported and/or implemented by automotive and transport industry;
partly reactions to publicly set framework conditions regarding for example pollution and noise regulations, parking and loading schemes, etc.
� vehicle design to cope with access restrictions targeting vehicle size and weight
� electric vehicles to save energy consumption environmental restrictions
� low-noise techniques in engines, tailboards, roll-containers
to be able to deliver at night when maximum noise levels are set by public authorities
� cooperation initiatives between competitors to achieve consolidation of goods
reaction to urban distribution centres / zones and reduce costs of small-scale deliveries
� planning technologies ( ICT = information- and communication tools/technologies) for organisation and planning of transport flows
achieve transport efficiency, avoid congestion, comply with restrictive measures
� home delivery/ collection points to solve problem of the last mile
solve problem of the ‘last mile’, i.e. from retail-outlets to (private) consumer
(Drawback: works only theoretically, since accessibility and other negative effects in residential areas and collection points often arise)
2.1.Urban logistics
As said before, this paper will focus on the distribution of freight in urban areas. Thus, traffic generated from the provision of services as well as the so-called “briefcase traffic”, which means travelling for business reasons in order to meet clients, will be left out.
The chapter draws on various sources, most noteworthy the EU supported projects / initiatives BESTUFS, City Freight, and CIVITAS. Their stated aims are as follows:
� CIVITAS: Promotion of sustainable urban transport approaches in cities; Implementation of measures and evaluation as to outcome, processes and knowledge gap.
� BESTUFS: To identify solutions for urban freight transport, to describe factors of success and problematic areas and make the results available to the wider public.
� City:Freight: Analysis of selected freight transport systems already functioning in Europe; evaluation of their socio-economic and environmental impacts.
Many European cities participate in all of these (and partly other) projects and initiatives. These cities are of very different shapes and sizes, however, they are united by the fact that urban freight transportation is of high relevance, and problems resulting from it need to be solved for economic as well as ecologic reasons. For an overview of these projects and their characteristics see Annex 2.
12

Urban Commercial Transport Background Paper for the Meeting in Sydney, October 2008
A general term often used to describe and categorise measures in urban freight distribution is urban logistics. According to the City Freight consortium it may mean the following:
“Logistics is defined as the management of material and related information and money flows along a supply chain consisting of several companies (suppliers of raw materials, producers, wholesalers, retailers and logistics service providers) and the final customer, which can be a private person, public authority, company or any other organisation. Logistics consists of different processes and components, which can be for example: strategy processes, demand and supply processes and supply chain processes.
Urban logistics concerns logistics processes and operations in urban areas, taking into account the operational, market, infrastructure and regulative characteristics of the urban environment. Urban logistics forms an integral part of interurban and international logistics chains.”24
A review25 of the commercial transport projects implemented in CIVITAS shows that in order to meet the specific local conditions and to cope with the problems caused by commercial transport the cities apply a surprisingly broad spectrum of strategies and measures indicating the complexity and variety of the urban commercial transport in European cities. A total of 45 measures could be identified that have been applied in the 20 cities. These measures can be merged into three main approaches, nine strategic areas and eleven strategies as the following table 6 shows.
The three main approaches, thereby, are: the intelligent use of vehicles approach, the vehicle technology approach, and the incentives approach. The interesting point is that cities put less emphasis on technology but rather on looking for solutions that answer the questions ‘How to organise commercial transport in a more efficient way?’ and ‘Which incentives might contribute to reduce commercial transport side effects?’ Furthermore, in order to increase impacts, many cities apply a bundle of measures. Likewise, within one individual measure different strategies are combined so as to create synergy effects, e.g. distribution centre and clean vehicles.
Table 6: Commercial transport strategies, measures and approaches applied in 20 CIVITAS cities26
Approach Intelligent use of vehicles Clean
Vehicle technology
Incentives Others
Strategic areas Distribution Fleet Car
sharing Clean
vehicles Loading Access Parking information
Travel PPP
Stra
tegy
Dist
ribut
ion
sche
me
Urba
n d
istrib
utio
nce
ntre
Flee
tm
anag
emen
t &
rout
e pl
anni
ng
Car
shar
ing
Cle
an v
ehic
les /
cl
ean
fleet
Load
ing
and
uplo
adin
g
Load
ing
Zone
Acc
ess
ma
nage
men
t /
Enfo
rcem
ent
Park
ing
Man
agem
ent
Rea
l tim
e tra
vel
info
rmat
ion
Publ
ic p
rivat
e co
op
erat
ion
Strategies applied 16 9 8 1 18 4 3 5 1 1 6
13

Association of the Major Metropolises Commission4: Urban Mobility Management
2.1.1. The Intelligent Commercial Vehicle Approach
The intelligent commercial vehicles approach is one of the most frequently applied approaches in CIVITAS and in general. The measures primarily aim to reduce the number of vehicles in circulation as well as the number of supply trips, mileage and transport related air pollutant emissions and noise. In order to do so, three strategic areas are combined, i.e. ‘distribution’, ‘fleet management’ and ‘car sharing’.
In addition to this ‘collective approach’ the ‘individual approach’ of fleet management has been applied as well. Furthermore some cities opt for the sharing of delivery vehicles as a solution to reduce the number of vehicles in circulation.
Distribution strategies are frequently referred to by different terms, such as consolidated, co-ordinated and optimised delivery or distribution scheme, consolidation or urban distribution centre (UDC) as well as city logistic. They all aim to reduce the number of vehicles in circulation, the mileage, the fuel consumption and harmful emissions.
Urban distribution centre in Bristol
The implemented distribution approaches very often use combined approaches to reach synergies and to support the main strategy with accompanying activities such as loading/unloading issues, clean vehicle employment, multi-use lanes, regulations and communication and information activities.
The main focus is on delivery of any kind of goods needed for retail and wholesaling. There are a few exemptions serving special clients – offices with office materials, restaurants and cafeterias with food goods.
In CIVITAS, distribution approaches were implemented by the cities of Barcelona, Bremen, Berlin, Bristol, Göteborg, Graz, Rotterdam, Stockholm and Winchester, albeit with varying foci and outcome as the box below illustrates.
In Barcelona, a combined approach with emphasis on distribution scheme, unloading and loading zone elements and quiet vehicles was applied. Five super markets sites shifted to night-time deliveries with a 40 ton truck for quiet and off-peak deliveries. Furthermore the multi-use lane which converts onstreet parking space into unloading zones was expanded, web-based loading information (active guide) were provided and kerbside regulations were established. As a result of these measures, traffic conditions and accessibility of customers were improved and time needed to make deliveries was reduced dramatically. In the German city of Bremen, another combinatory approach was established, the emphasis of which was on city logistic and clean vehicles. The main delivery element was the consolidation of goods delivery for so-called difficult inner-city areas and special clients such as shopping centre, city centre, warehouses and retailers with special requirements. Positive effects were, thus, gained regarding mileage reduction (9,000 kilometre per month), fuel savings (1,100 litre diesel per month) and emission reduction. However, consolidation related difficulties, such as composition of co-operation partners, grouping of deliveries, competition with courier, express and parcel services as well as the nonavailability of freight vehicle technology. These reduced the success of the combined approach, which consequently did not reach its full potential.
14

Urban Commercial Transport Background Paper for the Meeting in Sydney, October 2008
A somewhat similar combined approach with emphasis on urban distribution centre and clean vehicles in Stockholm turned out to be more successful. There special customers, like restaurants, requested specific solutions regarding delivery times and provisions. The existence of the logistic centre successfully reduced the number of deliveries. A reduced number of trips in combination with the use of a more environmental-friendly fuel reduced the emission from deliveries in the demonstration area. Due to less use of fossil fuels, C02 emissions were reduced by 1,3 ton per annum (NOx emissions by 0,019 ton p.a.; particulate matter by 1,91 kg/year; saved energy 7,0 GJ/annum).
Just like in CIVITAS, UDC turned out to be one of the most frequently applied strategies also in BESTUF and in City Freight, which is why it appears reasonable to take a closer look at them. In general, BESTUF defines UDC as centres for collecting and distributing goods. They are usually located in close vicinity to the target area, which they are meant to serve (city centre, entire urban area, individual traffic originators and large-scale individual costumers, such as shopping centres). Goods are transported to the UDC, and from there consolidated transports to the target area are carried out. What is more, additional and processing services may also be offered.27 The idea behind UDC is to reduce the number of vehicles that enter the city and maybe even to use “green”, i.e. electrical, vehicles to further lower emissions. In practice, the achieved benefits and drawbacks may turn out differently in the city itself and in its hinterland, as a review of existing UDC28 revealed:
� Without any UDC, the freight flows enter the city through a lot of different routes ending in destinations which are highly dispersed in the urban area. Medium size vehicles are found everywhere in the city.
� With a UDC, the freight flows entering the city concentrate on only one destination point in the urban area – the UDC – creating an opportunity to use heavier vehicles upstream of this point and to increase the efficiency of the transport system on the inter-city links. Chances are to see the impacts balances on vehicle*kms per transported ton and on emissions of pollutants and greenhouse gases become positive in the hinterland of the city (see Figure 3).
� However, downstream, the transfer of goods from heavy to light vehicles generates the increase of light vehicles flows because goods must be dispatched from one single point to all the final destinations in the city. The number of vehicle*kms per transported ton will increase, as well as the total amount of emissions of pollutants and greenhouse gases. The impacts balances will become surely negative.
� The use of electric vehicles can make the emissions balance become positive but so far it is still a very costly solution. Nevertheless the increase of congestion and hindrance will stay the same inside the city.
� The location of the UDC has of course its importance. Most of the jobs and activities are concentrated in the heart of the city, for example in the Central Business District or in some still remaining industrial areas. Thus, these areas constitute an employment density peak. Ideally, an urban distribution centre should be located close to that peak in order to minimise the length of the light vehicles routes.
� In relation to the former, locating the UDC in the suburbs often increases the length of these routes, the kilometres travelled and consequently, the total amount of emissions. As the spatial distribution of activities changes over time, advantages and disadvantages of being in a certain location will change too.
15

Association of the Major Metropolises Commission4: Urban Mobility Management
Figure 3: Spatial patterns of freight flows entering a city without or with a UDC29
Medium size vehicles
Without a UDC
More heavy vehicles
More lightvehicles
With a UDC
Medium size vehicles
Without a UDC
Medium size vehicles
Without a UDC
More heavy vehicles
More light vehicles
With a UDC
Three conclusions can be drawn from these theoretical considerations :
First, some initiatives that are carried out inside the city can have their main positive impacts outside of the city. Second, it is therefore important to consider and analyse (potential or actual) impacts with regard to a territory much larger than the city. Third, when assessing the impacts, sophisticated tools are needed. These tools should be capable of simulating in detail routes taken, vehicle kilometre driven and emissions generated, in order to correctly calculate the local impacts balances.30
While UDC aim at limiting negative and maximising positive impacts of the transportation of freight and goods into shops, there are other approaches that aim at changing the patterns of bringing goods from the shops to the costumers.
These are often referred to as ‘last mile approaches’ and will be considered in more detail in chapter 2.2.
2.1.2. The clean vehicle technology approach
A second major cluster of strategies and measures can be called the clean vehicle technology approach. Cities would like to see quick and direct improvements by introducing clean vehicles and clean fleets. About one quarter of the CIVITAS measures aimed to improve the negative environmental impacts by using clean vehicles. The reasons for attempting to get cleaner vehicles on the roads are manifold and might also be seen as a reaction of freight transport providers to political and administrative regulations, i.e. air quality plans and directives.31 In fact, regulations such as the European vehicle emission standards are a strong driving force for both innovation and market penetration of lowemission vehicles and alternative fuels. In Europe, new trucks will have to meet the Euro-5 standards 2008/2009. What is more, 2014 will see yet another tightening of the regulations (see Table 7). Euro 6 will then set significantly lower emission limits for NOx emissions from diesel cars.
16

Urban Commercial Transport Background Paper for the Meeting in Sydney, October 2008
Table 7: Overview of evolvement of emission standards in Europe since 199632
Emissions Standards
Particulate matters
(PM in mg/km)
Oxides of nitrogen
(NOx in mg/km)
Hydrocarbons
(HC in mg/km)
Diesel Petrol Diesel Petrol Diesel Petrol
Euro 2 (1996) 80 – 100 - - - - -
Euro 3 (2000) 50 - 500 150 - 200
Euro 4 (2005) 25 - 250 80 - 100
Euro 5 (2009) 5 5 180 70 - 100
Euro 6 (2014) 5 5 80 70 - 100
Emission standard for commercially and privately used vehicles are of course no European singularity. Japan and the US have adopted legislation similar to the Euro emissions standards. Some countries in Asia, Africa and South America are also gradually adopting legislation on emissions standards and fuel requirements in order to avoid serious air pollution problems linked to the growing numbers of automobiles on their roads. Table 8 shows the evolvement of emission standards in Asian countries as compared to Europe.
MAN TGL, modern truck with low emissions
17

Association of the Major Metropolises Commission4: Urban Mobility Management
Table 8: Evolvement of emission standards for new vehicles (light duty) in different countries33
95 96 97 98 99 2000 01 02 03 04 05 06 07 08 09 10
European Union Euro 1 Euro 2 Euro 3 Euro 4 Euro 5
Bangladesh Euro 2 (under discussion)
Hong Kong Euro 1 Euro 2 Euro 3 Euro 4
Indiaa Euro 1 Euro 2 E3
Indiab E 1 Euro 2 Euro 3
Indonesia Euro 2
Malaysia Euro 1 Euro 2
Nepal Euro 1
Philippines Euro 1
PR Chinac Euro 1 Euro 2 Euro 3
PR Chinad Euro 1 Euro 2 Euro 3
Singaporee Euro 1 Euro 2
Singaporef Euro 1 Euro 2 Euro 4
Sri Lanka Euro 1
Taipei, China US Tier 1 US Tier 2 for diesel
Thailand Euro 1 Euro 2 Euro 3 Euro 4
Viet Namg Euro 1
Viet Nam Euro 1
a Entire Country b Delhi and other cities; Euro 2 introduced in Mumbai, Kokata and Chennai in 2001; Euro 2 in Bagalore, Hyderabad, Khampur, Pune and
Ahmedabad in 2003; Euro 3 to be introduced in Delhi, Mumbai, Kolkata, Chennai, Bangalore, Hyderabad and Ahmedabad in 2005 C Beijing and Shanghai
d Gasoline vehicles under consideration e for gasoline vehicles f for diesel vehicles g for all types of diesel vehicles
Apart from lowering fuel consumption and equipping vehicles with exhaust filters, etc., another option for cities and transport providers is to switch to alternative fuel and propulsion technologies.
Regarding urban freight transportation, the clean vehicle technology approach covers different types of commercial vehicles, such as heavy duty lorries, medium and small trucks, and vans. In addition, waste collection and transportation is also sometimes targeted by this approach, albeit only a few cities can be found looking for clean and quiet solution in disposal transportation. The clean/green vehicles are mainly gas (compressed natural gas and compressed biogas) and electric driven vehicles. Depending on their power source, the different kinds of vans, trucks and cars have varying qualities, including environmental dis- and advantages, as the following overview states.
18

Urban Commercial Transport Background Paper for the Meeting in Sydney, October 2008
Table 9: Alternative fuels and vehicle propulsion technologies34
Fuel / Propulsion Environmental Advantages
Environmental Disadvantages
Further Notes
Biofuels (Ethanol, Rapeseed Oil/ Rapeseed Methyl Alcohol)
Lower CO2 emissions compared to diesel;
biologically disposable
Contamination of soil and groundwater;
Land consumption;
N2O Emissions resulting from fertilisation
Further emissions equalling diesel;
economically unviable;
subsidisation needed;
replacing food with bio fuel plants causes food supply shortages in crop growing countries
Natural Gas
- compressed (CNG)
- liquefied (LNG)
Lowest emissions; CO2 emissions per energy unit about 25% lower than for petrol and diesel
Heavy tanks increase weight of vehicle
Infrastructure often insufficient (albeit improving) – reduced cruising range;
all safety standards by now fulfilled
Liquefied Petroleum Gas (LPG)
low emissions; CO2 emissions per energy unit about 16% lower than for petrol and diesel
Heavy tanks increase weight of vehicle
Comparable to natural gas, however, advantages regarding filling stations, storage, coverage, handling
Hydrogen (H2)
no pollution emissions except for NOx at the immediate place of combustion
Pollutants are generated if hydrogen is derived from fossil energy sources; generally high production wastage
Storage difficult, especially when derived from solar energy: direct solar use is preferable
Electricity Virtually no emissions at direct place of use; low levels of noise
Emissions are allocated to power plant; unsolved issues concerning batteries (manufacturing, recycling); extremely high vehicle weight
Economically unviable; quite limited areas for use; no overall emission reduction
Fuel Cell
Almost no emissions at place of use; catalytic fuel exploitation; high efficiency; low temperatures
additional wastages for additional aggregates, high requirements regarding H2-purity
Still in very basic research state of development and/or individual demonstration; deployment will take anther 10-20 years; stationary fuel cells are preferable
As mentioned before, in CIVITAS strategies were often combined, and consequently, pure technology measures are rare. For example, Rotterdam applied the clean vehicle approach with emphasis on electric distribution vehicles. However, due to prevailing technical problems, especially malfunction of the battery management system, the success was somewhat limited. Other combined approaches are presented in the following text box.
19

Association of the Major Metropolises Commission4: Urban Mobility Management
In Stockholm, a technology approach was put forward, emphasising the promotion of biogas powered heavy vehicles, which were then to be used in sensitive and densely populated areas in the city centre. All in all, 24 clean heavy vehicles were purchased. Out of these, 21 vehicles were biogas buses that replaced ethanol powered buses in the city centre. The latter were, in turn, relocated to outside areas of the city, where they in turn replaced conventional diesel buses. The three biogas lorries were purchased by the Stockholm Water Company in compliance with a 2002 board decision to substitute the company’s diesel with biogas lorries. For both replacement approaches, the fuel consumption and emission of air pollutants showed the expected decrease, apart from the emissions of HC, that have increased by 20 times. Another (albeit to be expected) drawback is the increase in the cost of maintenance from 0.033 Euro per km to 0.045 Euro per km due to higher maintenance requirements of the biogas Otto engines. Another clean vehicle approach using information and incentive elements can be reported from Berlin35. Here, the aim was to bring at least 100 CNG-powered distribution lorries of different weight classes (3.5-24 t) onto the roads between 2002 and 2006. This was to be achieved by means of information campaigning and the creation of financial assistance. The project took off rather slowly. However, thanks to intensive campaigning, the demand for CNG lorries enhanced. This was further supported by an increase in crude oil prices. Thus, more than 140 small and medium size delivery vehicles were eventually put to use. The success could even have been greater, yet it was limited by the fact that the procurement of heavy CNG-lorries is very difficult because of missing market offers. In addition, the approach was linked to a further demonstration measure with emphasis on financing of clean vehicles and public private co-operation. New financing models were elaborated and communicated, leading to the development of a leasing contract model for CNG vehicles. While the company in charge of developing the leasing contract reported high level of interest especially from businesses, it is not known in how far the enhanced information actually led to an increase in the purchase of CNG-powered cars for business and commercial reasons. Also by means of partnership, an energy supplier and three logistic companies in Göteborg tested different incentive options to change from conventional distribution to new environmentally friendly ways of distribution. Thereby, it was aimed at overcoming some of the barriers that prevent the purchase and use of CNG vehicles by private companies in the haulage sector, e.g. higher investment costs, lack of fuelling stations, uncertainty as to the usability and reliability of these vehicles, lack of suitable vehicle models for different haulage requirements such as purchase subsidies, improving fuel supply infrastructure and ‘green tonnage service’. Regarding the latter, DHL and Green Cargo AB, both international logistic companies, introduced a product called “Green Tonnage”. Thereby, they offer their clients the possibility of buying almost carbon dioxide free transportation. Additional transport cost equal only abut 0.02 Euro per km. In addition, Gatubolaget, a company specialised in transport in the Göteborg area, purchased 10-15 lighter distribution vehicles and used them in their daily operation. All in all, 16 distribution vehicles and 2 heavy duty vehicles contributed to a reduction of CO2 emissions by 72.8 tons and NOx by 83 kg. The vehicles will within 1 year’s time drive app 500,000 km on compressed biogas (CBG) instead of diesel. To further enhance the impacts, two new CNG fuelling stations were provided by FordonsGas, a distributor of CNG/CBG for vehicles. The project shows that private businesses and companies, located in different parts of the transport chain, may co-operate and make a difference regarding the shift from conventional to new and environmentally friendly ways of distribution. Nevertheless, environmental incentives and requirements by public actors certainly help them in doing so.
In general it turns out that environmentally friendly vehicles are a promising way to solve in particular air pollution and noise problems resulting from freight transportation. However, in order to achieve noticeable impacts a critical mass of these vehicles need to be brought onto the roads. Cities and indeed public actors might stimulate the utilisation of clean vehicles by providing incentives (see following chapter) or financial and other assistance. The aim, thereby, should be to alleviate some of the mainly competitive disadvantages that are still linked to introducing clean vehicles, e.g. higher operational costs, shorter cruising ranges and reduced loading volume (electric vehicles), insufficient infrastructure as regards fuelling stations, and higher frequency of breakdowns. Thus, in order to reach real market penetration, it is most important that costs and reliability of clean vehicles equal that of conventional vehicles. Furthermore, examples from Germany, France and The Netherlands show that a combination of financial incentives and legal regulations is most suitable for enhancing the use of clean vehicles.
20

Urban Commercial Transport Background Paper for the Meeting in Sydney, October 2008
2.1.3. The incentives approach
A third option can be called the incentives approach. Cities thereby apply incentives or restrictions in order to solve specific problems such as loading, uploading, access and parking of commercial transport vehicles. Within the incentives approach, delivery companies that fulfil certain requirements are rewarded with preferential treatment while others might face difficulties in carrying out their business. The most prominent examples for the incentive approach are environmental zones, clean vehicle zones and special loading and parking zones. In fact, the measures may be identified as belonging either to access or parking strategies. 36
Access Strategies Access strategies are often linked to environmental zones, which are sometimes called low-emission zones. They usually cover a distinct area of the city, which is only open for vehicles that meet specified restrictions. Criteria for enforcing environmental zones may relate to certain areas, a certain period of time, exhaust and noise emissions, or vehicle types.37
Environmental zones have already been put in place by Stockholm, Berlin, Göteburg, and many other cities. In Europe, cities are increasingly inclined to implement them in order to comply with EU air quality directives. What is more, environmental zone provisions may be altered and adjusted so that they specifically address issues of commercial transport. This was done, for example, in Göteborg (Sweden) within the framework of the CIVITAS initiative.
In Göteborg, an Environmental Zone had already been established in 1996. It originally encompassed the central areas of the city, a total of 15 square kilometres. About 100,000 people work in the area, and an equivalent number reside there. In 2005, the number of heavy vehicles driving locally in the Environmental Zone was about 3,400, covering approximately 8.4 million vehicle kilometres. Since its implementation, the Zone has proven to be one of the more effective systems to ensure a minimum environmental standard for heavy duty trucks and buses in the inner city. Therefore an enlargement of the zone was desired and made subject of the CIVITAS related project TELLUS (Transport and Environmental Alliance for Sustainability). In addition to the geographical expansion, a second aim was to adjust the regulations for vehicles allowed to drive within the Environmental Zone. The latter was undertaken together with the other Swedish cities with existing Environmental Zones (Stockholm, Malmö and Lund). In order to expand the Zone, a new definition for ‘special environmental sensitive areas’ had to be agreed on, not only by actors in Göteborg, yet amongst all Swedish cities with Environmental Zones. This was a necessary prerequisite for the proposed enlargement of the Environmental Zone, and it resulted in the following characterisation of such an area: “A special environmentally-sensitive area is an area which contains parks, green area, dwellings, streets with many road-users, sensitive buildings, places of work, and areas which are exposed to noise and emissions or where there is a risk of the European Commission Air Quality Norm not being fulfilled.”38
This new definition differs somewhat from previous ones, predominantly in that it is now possible not only to include areas where large numbers of people live, but also areas where people work or also certain locations near traffic routes. The second undertaking, i.e. the alteration of vehicle regulations for the Zone, was realised in an act of co-operation and extensive negotiation between the four Swedish cities. Initially, there had been two different drafts (one based on vehicle age, the other on emissions). Following a cost-benefit-analysis, joint negotiations and further stakeholder participation, a final proposal was settled. It states that non euroclassed vehicles are allowed to enter the Zone, provided they are no older than 6 years. The exceptions to this rule are based on vehicle emission. If the vehicles are euro-classed they will be allowed to enter the Zone even if they are older than 6 years, but there will be a limit for each euroclass. Euro IV are allowed for 9 years and Euro V are allowed for 10 years. It will mean that all types of vehicles are allowed, but the cleanest vehicles are allowed for a longer period. Furthermore, the Environmental Zone is marked by an increased number of signposts, that also contain brief albeit clear information on the provisions for entering the Zone.
21

Association of the Major Metropolises Commission4: Urban Mobility Management
The unique co-operation and participation process was rewarding in that first, now all of the major Swedish cities comprise of similar provisions for their Environmental Zones, which is valuable for haulage companies, etc. Second, a survey carried out in 2005 amongst haulage companies operating in the Göteborg area showed that knowledge on and awareness of the provisions of the Environmental Zone has increased (compared to a baseline survey in 2003). What is more, the companies, as well as the general public, are aware of the positive impacts of the Zone as regards air quality, which in turn increases acceptance and positive attitudes towards the measure. According to the comprehensive evaluation carried out for the measure, a good lesson learnt is to involve affected parties as soon as possible, and to include different kinds of experts, including professionals in leadership and development-processes. A study (Miljözon- en världsnyhet från Göteborg, Ecoplan) shows that the people involved at an early stage are the ones holding most positive attitudes. It is also very important to have a realistic timescale. This kind of development takes time. Changes in legislation on national level are often combined with lots of lobbying, which is a time consuming work.39
In addition to the above, a field test was carried out for duration of two months and for two different vehicles. The aim was to increase understanding of the degree of reduction from the NO-reducing longroute EGR (Exhaust Gas Retrofit equipment) systems, as well as the development and validation of an onboard measurement system. The equipment produced for mobile measurement of NOx emissions from heavy duty diesel vehicles consists of a NOx sensor (with built-in lambda sensor), a pressure sensor, a speed sensor, a PC logger and the relevant accessories. These instruments were fitted to two buses operating in Göteborgs Spårvägar’s (Göteborg Tram) regular traffic. The equipment seems to function well for its purpose, but could be fine-tuned and developed further. The new engine technology together with the regulations has been a success factor to decrease the emissions in Göteborg. In the field test with the two buses NOx emissions from one vehicle were reduced by approximately 36 % and from the other by around 18 %. In relation (and as a kind of add-on) to the Environmental Zone, Göteborg also carried out a pilot project on a voluntary basis on integrating load factors. Thereby, incentives were created that gave advantage to suppliers, haulers and retailers, who co-ordinated or in some other way consolidated their deliveries to the area. The goal was that the number of deliveries to the area should be reduced without introducing severe restrictions on volume of goods, availability or vehicle type. Furthermore, it was aimed to also gain acceptance from the parts of the business world that are influenced by the new requirements and to secure their support for the new zone. The incentives were as such that if a truck is loaded up to at least 65% of its weight or volume capacity, or alternatively if a minimum number of 50 costumers is visited within the area, then the driver was allowed to take up special incentives, such as reserved zones for loading and un-loading, use of the three bus lanes that lead into the area and access to a short-cut road that is normally prohibited for vehicles over 3.5 t. The monitoring of the load factor was done by applying a whole array of modern communication technologies. The pilot scheme as such went well and was rated a success, even though emission reduction targets were not achieved. The most valuable positive outcomes were seen in the generation of knowledge, acceptance and personal contacts between different actors. Furthermore, it proved that for such a down-to-earth approach, the knowledge of truck drivers, parcel deliverers, etc. is invaluable, as they have a very detailed and realistic knowledge of the traffic conditions in an area. For the future, a rerun and expansion of the scheme is envisaged, involving more companies and vehicles in order to finally increase the environmental benefits.40
The above example should serve to illustrate that introducing an environmental zone, or indeed other forms of access strategies, does not necessarily put an end to the need to deal with the matter of traffic, congestion and pollution in inner cities. In fact, such a zone may be the starting point to build up acceptance and awareness and to subsequently develop and implement further strategies and measures to enhance the situation. Such was done in Göteborg, and again it appears appropriate to highlight in particular the co-operation with other ‘environmentally zoned’ cities in the country in order to create common rules and, thus, a reliable framework for businesses, haulers, etc. throughout the country. Likewise, such a multiparty undertaking may also be seen as an intensive and promising way for lobbying, i.e. for communicating urban issues on a national podium and to actors outside the municipality.
22

Urban Commercial Transport Background Paper for the Meeting in Sydney, October 2008
A different approach to access strategies comprises the designation of a specific road network for heavy duty vehicles. These networks may be implemented by cities in order to divert heavy duty (HD) vehicles away from sensible urban areas. These networks can be either compulsory or obligatory. In the case of the latter, no monitoring and control measures are needed. Thus, the achievement of results is pretty much subject to the goodwill of lorry drivers. In contrast to that, compulsory networks are a strong enforcement instrument, yet they do require surveillance and control, which is why implementation as well as maintenance are considerably more complex and expensive. Regardless of their enforcement, different kinds of heavy duty vehicle road networks may be implemented:41
1. HD trunk routes: routes within the primary road network, which provide fast connections over wide areas and between urban agglomerations;
2. HD main routes: these lead from the trunk routes to industrial or business as well as urban areas,
3. HD access routes: relevant roads for delivery and freight vehicle flows in an area.
In order to introduce HD vehicle networks, attention should be paid to the following:
� all main traffic axes and their connecting roads should be covered;
� all origins and destinations of HD traffic need to be linked in;
� the roads themselves have to be in good condition and should be sufficiently sized and equipped for HD vehicles, regarding for example radii, structural gauge, permitted gross vehicle weight on bridges, etc.;
� steep roads and sensitive areas (residential, pedestrian zones) should be avoided;
� all relevant planning authorities should be involved in the process of localising a HD vehicle network;
� sufficient and comprehensible signposting and the provision of conventional (printed) as well as electronic maps are necessary preconditions for successfully implementing the HD vehicle network approach.42
As with most transport measures, the generated effects of HD road networks are not always unambiguous, let alone positive. An assessment of different freight transportation measures, carried out in EU’s COST 321 project, identified benefits as well as drawbacks of different measures, differentiated with regard to the spatial context in which they appear.43 Table 10 presents the results for the two access strategies dealt with in this chapter.
According to the COST 321 assessment, positive effects of HD road networks are to be expected mainly as regards noise reduction. Likewise, the kilometres travelled in the inner city areas are bound to decrease once the HD network is routed around the centre in order to decrease congestion. As a consequence, however, kilometres travelled will increase in the outer city. The impacts regarding length of stay in road traffic and emissions of air pollution are also somewhat varied.
In comparison, denying access to the inner city for HD trough traffic in combination with minimising the use of HD vehicles in the inner city also generates improvements and deteriorations of existing conditions alike. Thus, it appears that the positive impacts achieved in the inner city are outbalanced by the drawbacks generated outside the city centre. Thus, the overall tendency is negative. The only exception is noise emissions as the improvements achieved in more sensitive inner city areas outbalance the resulting deterioration in areas outside the city centre.
23

Association of the Major Metropolises Commission4: Urban Mobility Management
Table 10: Comparison of likely effects of access strategies in cities44
Kilometres travelled
Length of stay in road traffic
Emission of air pollutants Noise emissions
IC OC EC IC OC EC IC OC EC IC OC EC
HD Vehicle road network / routing
Denied access to inner city for through traffic + minimising HD use in inner city
Key: IC = Inner City OC = Outer City EC = Entire City (IC+OC=EC)
Improvement certain Improvement likely Deterioration likely Deterioration certain No clear tendency
Lastly, tolling and road charging schemes may also be seen as a part of access strategies. While per se these do not restrict access for vehicles, they do nevertheless provide an important management tool that also affects freight and service transportation. In Germany, trucks and heavy duty vehicles are tolled when using the national highway system. However, at present no tolling in inner city areas takes place. By contrast, in London the congestion charging scheme sets a higher charge for lorries and vans that exceed 3.5 t gross vehicle weight.
The most recent report on the effects of the congestion charging scheme in London showed that by 2006, four years after the charge entered into force, the number of vans and lorries entering the city has decreased by 13% each.45 However, the share of these vehicles typical for commercial transport on total traffic within the charging zone has remained stable. Thus, the decrease in commercial vehicles echoes that of the decrease in total traffic. Furthermore, some assumptions can be made as to the reasons for this decline:
1. There had possibly been a large potential for optimising supply and service trips into the area, which was deployed after the charge came into being;
2. or there had been a lot of through traffic, which now uses routes outside the city centre;
3. or, as a third option, deliveries and businesses have shifted to smaller vehicles, since a small charge has to be paid for those.
In reality, probably a combination of these three options took effect. Yet the notion that the reduction of vehicles is a follow-up effect of a decline in sales and services in the inner city must be considered as untrue. The aforementioned report provides no hints as to an economic downfall – quite the opposite, actually.
As mentioned above, the incentive approach further includes Parking strategies as a means to improve (freight) transport conditions in urban centres.
Parking strategies Regarding parking strategies, at least two issues need to be considered. First, parking for loading and uploading of goods, parcels and the delivery of services. Second, long term parking of trucks and vehicles during waiting times or when they are not in immediate use. Again, the issue of parking is relevant both to the public as well as to private companies. For citizens and the public administration, disturbances to the traffic flows, uptake of cycling lanes or footpaths, noise and air pollution are among the negative impacts noted. Truck drivers and companies in turn have to deal with lack of parking space, which is an obstacle to meeting tight delivery schedules. Thus, providing sufficient space for both of the identified uses is important in order to allow for the delivery of goods and services while limiting the aforementioned negative impacts to the benefit of all parties involved.
24

Urban Commercial Transport Background Paper for the Meeting in Sydney, October 2008
Short term parking: Loading and uploading zones
Loading restrictions based on time
Designated loading zones can be set up in areas where a lot of delivery activities take place but businesses (both providers and clients) do not obtain loading ramps, backyards, etc. They are particularly useful when not enough road space is available for cars and lorries. These loading zones or loading bays need to be clearly marked. Likewise, they should be distinguishable from the overall street layout by identifiable pavements, curbs, bollards, etc. Their use may be limited to certain (distinctive delivery) times of the day. However, it often makes sense to make them usable throughout the day. Size may vary, consequently so does the number of vehicles that can be fitted into such a bay. Yet in any case attention must be paid to the fact that there are different types of delivery vehicles in use. Thus, the bays should be constructed in such a way that they are usable for all kinds of vehicles.46
Loading bays have been set up in a number of cities throughout the world. Additionally, they are often combined with further measures to smoothen the delivery process. The following outlines three combined approaches, which comprise some innovative and even surprising elements. All of the three have proven to be successful, meaning they contributed to supporting delivery activities and minimising negative impacts.
In the Danish town of Aalborg for example, deliveries are mainly carried out during morning hours. As a complementary measure to the loading bays business owners in the city centre have agreed to put out advertisement shields, signs and overhanging marquees only after 11:00 am. That way, access to shops is further eased, which makes deliveries quicker, more efficient and less disturbing as regards traffic and related nuisance. 47
Also in Denmark, in Copenhagen, loading zones were established that could only be used by truck drivers fulfilling certain loading capacity requirements. Following a voluntary scheme in 1999/2000 and the readjustment of legal provisions, an obligatory scheme was set up in the inner city area. From April 2000 onwards, the following regulations and exceptions were put in place in the city centre: � Lorries and vans over 2 tons are not allowed to enter or to stop in the inner city; � 40 loading zones are reserved for vehicles with a “green” certificate, which can be obtained by
vehicles using at least 60% of their capacity on average over three months; � ‘Red’ and ‘Yellow’ certificates (for one day or a transitional phase respectively) are issued in special
cases and for certain vehicles; � Different fees apply for different certificates; � Trucks and vans parking within the zone without a certificated are fined; � Emergency vehicles or special purpose vehicles, such as lifts, garbage trucks, are exempted. � It has been calculated that the scheme will lead to a reduction of the number of lorries and trucks
entering the city centre of about 30%. In addition this will lead to the reduction of emissions. A further integrated approach comes from Barcelona. There, 3.3 km multi-use lanes were designated for the use of buses during peak hours (frequency of 25 buses per hour) and for loading and uploading (L/U) during off-peak hours. In addition, an equivalent of 44 on-street parking spaces were converted into unloading spaces during the peak hours. The measure is the first of its kind to incorporate bus priority regulations as a variable message sign.
25

Association of the Major Metropolises Commission4: Urban Mobility Management
The “L/U Active Guide” web, provides information on the location and occupancy level of the L/U zones in the pilot area, and includes a system to receive and store registrations from the participating operators. Almost 1,800 records were generated during a 16 week trial. These were analysed to detect the main delivery “hot spots” (locations and times of day) which were then subjected to targeted enforcement. Also, analysis of the data showed that whilst the overall number of delivery places matches the goods demand, the time and location of space availability does not meet operators individual, detailed needs. Thus, it turns out that while the authorities might solve problems on a larger (spatial) scale, the problems experiences on micro level need further solutions that are customised to specific requirements. Moreover, temporary spaces for Loading/Unloading can be arranged for a maximum of up to 2 hours per day in areas without designated loading zones. Shop and business owners may obtain a special concession to reserve roadside space as explained above. They have to sign it in accordance with local regulations, and they may henceforth use this space exclusively for deliveries to their businesses. In Venice, a rather unique parking issue had to be solved that is inevitably tied to the exceptional structure of the lagoon city. Nevertheless, it could be of interest to other cities, in particular those that retain inner urban waterways used for daily transportation of people and goods. In the city, there was and partly still is a problem with long and short term boat parking as well as with the delivery of goods by boat. The lack of boat parking and docking space together with high demand resulting from private as well as commercial and tourist boat traffic caused obstructions, noise, and wake disruptions or turbulences. In order to solve the problem and manage parking according to both demand and priority, a comprehensive information and management system is to be developed and implemented. The project work is still ongoing and includes the following steps: � analysis of the actual use of docks; � recalibration of the permitted use of docks by different boat types at different times of the day and
night; � identification of boat docks to be reserved for the delivery of cargo at set times; � identification of docks that could be used temporarily; � management of permits for the temporary use of docks during construction/restoration work, � management of the signage that will regulate the dock use based on the aforementioned
analyses; � development of a parking management system; � system testing and personnel training; � integration with other information systems. As can be gathered from the above, the project follows an integrated approach with strong emphasis on information generation and distribution by means of a new information management system. Once completed, the information system for the management of permanent and temporary parking along canals will, for example, reduce the possibility of boats competing for the use of the same dock by reserving docks for certain key activities at certain times of the day. Likewise, it will eliminate the possibility that temporary docking permits may negatively affect important services (such as deliveries or emergency services) and create traffic obstructions. In addition, Venetians will be allowed to use their personal boats to conduct personal business and use docks for extended periods of time (2 hrs). Furthermore, constant information will be made available to decision makers for the planning of measures aimed at controlling boat traffic and reducing wake occurrence and noise pollution. While similar in approach to some other traffic and parking management projects, the Venice approach also provides some innovative aspects. For example, economic operators are involved in the construction of the logistic scheme in order to develop an innovative model that will consider how all the deliveries are being made. The entire scheme will be innovative, combining managing technologies and technical solutions with low impact vehicles and a modern terminal. The integration of the management of different activities permits a rationalization of the use of docks, reducing traffic congestion as well as wake and noise pollution in the city.48
26

Urban Commercial Transport Background Paper for the Meeting in Sydney, October 2008
Long term parking
Trucks arriving after the closing time of their clients or of the warehouses need to park overnight until the morning. In some neighbourhoods, this causes a number of nuisances: loss of parking places, visual intrusion and early morning noise as trucks depart.
Such was the case for example in Brussels. As a solution, a regulation forbids heavy trucks (above 3.5 tonnes) to park for more than eight hours in a row except in designated areas. The creation of five such zones is considered in the mobility plan. In addition, the plan also proposes the modernising of logistics facilities operating in relation to the port. The region is currently planning such investments. Some steps have already been taken, such as a new container park. A new tri-modal platform has been created, but with little success until now, as it is underused.49
It appears that especially cargo handling facilities and cities in their vicinity are affected by problems resulting from long-term parking. The following example from The Netherlands shows in more detail the provision that can be taken in order to solve the issue.
In order to reduce noise and to optimise accessibility and safety in urban areas close to the port district in Rotterdam, an area has been designated with 60 long-term parking places for truck combinations. Preceding this measure, the residents of urban areas close to the port district suffered noise pollution because of trucks parking in residential streets. In addition, accessibility to the district had not been favourably anyway. Furthermore, residents did not feel safe due to the large number of heavy vehicles on residential street. In order to solve these problems, it was decided to set up a designated area for long-term parking of trucks (Truck Park). The project incorporated two innovative aspects. First, the expansion of these parking spaces is seen as a solution for noise pollution in residential areas. Second, limited space was used in an unusual and intelligent way. The Truck Park Fruitport is now located in a port area with fruit companies and is close to the residential areas of the Delfshaven district. The Truck park offers secured parking with 24 hour surveillance for trucks and other lighter distribution vehicles. Thanks to the Truck Park, parking in residential areas could be minimised to a large degree. The Park offers 60 parking spaces for long term parking (up to a maximum of one week). In 2004 around 10.000 trucks parked at the facility. The trucks using the facility are both national and international. Almost all trucks had one of the Fruitport companies as their destination. The crucial aspect in making the project a success was the acceptance and willingness of truck drivers to use the provided facilities. Communication proved to be essential for convincing the drivers of the benefits of the Truck Park in terms of safety, convenience and efficiency. What is more, the cargo handling companies stimulated the use of the Truck Park, and they even enforced it. This measure has some recognizable success and failure factors. An evident success factor was the clear separation of tasks between the stakeholders. The Port of Rotterdam was only responsible for design and implementation. The Fruitport Foundation is responsible for maintenance and management of the truck parking area. This agreement enhanced the positive attitude of Port of Rotterdam, and it also increased the acceptance and support of the companies in the Fruitport area. The acceptance for the project in the residential areas was ensured from the start but positively influenced by the activities of the local authorities in parking control, which stimulates truck drivers to avoid the residential areas. A factor that clearly can disturb the project is insufficient communication with and encouragement of the truck drivers. An appropriate signing of the route to the truck parking area is necessary. Also the fees for the truck parking area should not be to high in order to avoid unwanted effects such as transfer of the initial problems to other areas.
27

Association of the Major Metropolises Commission4: Urban Mobility Management
2.1.4. Technology and ICT
Modern distribution systems on all spatial levels require a high level of control of their flows. Control, thereby, starts as both, an organisational and managerial issue. However, in order to apply control, technical tools and expertise are needed. In long-distance freight handling, logistics systems have been shaped fundamentally by a shift to intermodal transportation and containerisation. In addition to that:
“More recently, the application of new Information and Communication Technologies (ICT) for improving the overall management of flows, particularly their load units, has received attention. Thus, the physical as well as the ICT parts of technological change are being underlined. The ICT component is particularly relevant as it helps strengthen the level of control distributors have over the supply chain.”50
The need of logistic suppliers to improve routing and tour planning, to meet high costumer demands and, last but not least, to boost transport processes and, hence, to optimise costs within the entire supply chain, is ever increasing. As a consequence, the demand for and the availability of ICT supported tools has for a while now been on an all-time high. ICT support in goods management and handling is often referred to as ITS (Intelligent Transportation Systems). What is more, not only private actors but cities themselves often initiate ITS applications. The aim, thereby, is to improve traffic conditions in the urban area, e.g. by means of access restrictions or transport routing. According to the different objectives and actors, ITS can be classified into transport management systems and traffic management systems. 51
Transport management systems aim at optimising the supply chain and its costs. The tools and concepts used include:
� ICT supported route and tour planning systems, which allow controllers to develop more efficient cargo and tour planning;
� Navigation and monitoring systems, which provide support throughout the tour and provide up-todate information about vehicle positions, traffic conditions and client’s requests;
� On-board communication systems, which allow direct (personal or via computer) contact between driver, headquarters and clients;
� Loading platform booking systems, which support coordination and timing of vehicle arrivals at highly frequented destinations.
There are two classifications for traffic management systems:
1. Urban Traffic Management and Control (UTMC) systems
� UTMC systems allow to improve the flow of traffic, to reduce travel times and delays, and they increase safety. Berlin, London and Paris are some of the cities that have UTMC centres in place, which are cost-effectively administered. The systems may include a number of technical solutions, such as
o control centres for operating light-signal systems
o variable message signs to inform drivers
o parking space occupancy sensors
o automatic travel time recording by means of number plate detection.
28

Urban Commercial Transport Background Paper for the Meeting in Sydney, October 2008
2. Maps and navigation aides
� support the use of HD route networks
� may include information on
o HD route networks
o size and gross vehicle weight restrictions
o Access, up-/ loading regulations
o location of rest and service areas
To put it in a nutshell, ICT systems as well as the use of technology appear to be a means to an end, rather than an end in itself. Technology may support other approaches, like HDV routes, information measures, access strategies, etc. Yet they are only suitable under certain conditions and require partly extensive and expensive infrastructure, causing investment and maintenance costs. Thus, they must be viewed as providing one of the latter steps to be taken in order to manage urban freight and commercial transport.
2.2.Certainly not least: the last mile
The term last mail relates to the last segment of the transport chain. It therefore includes deliveries to the ultimate destination, which may be either a (small scale or local) retail establishment or the costumer directly. Thus, the term last mile actually refers to a number of miles (see figure 4) that are travelled every day in the real, not just figurative, sense of speaking.
Figure 4: The last mile in the transport chain52
Consumer
Direct delivery
Distribution logistic process
Manu-facturer
Central warehouse
Regional warehouse
Retail trade
Pick-up point
Delivery-box system
The last mile clearly is a mile that is mainly overcome with cars, trucks, and vans. In fact, most of what has been said in this paper so far related to the last mile in the business-to-business transport, e.g. regional distribution centre-to-local shop. However, the present chapter will take a closer look at the business-to-consumer last mile, meaning how do the goods get from their last sales point to the private consumers door step. Thereby, by and large there are two options for that. First, the goods are taken to the consumers door by the seller or a delivery service respectively. Second, the buyer takes the goods home him-/herself. The latter option is not, strictly speaking, a matter of urban commercial transport. Rather it is part of personal mobility and will, therefore, not be considered any further in this paper.
29

Association of the Major Metropolises Commission4: Urban Mobility Management
The need to deal with the last mile in terms of deliveries results from a number of developments. First, it is a sector of high performance logistics with relevant contribution to the GDP. Likewise, it is a sector that has experienced rapid change over recent years.53 These have been caused by technological and organisational developments and, most noteworthy, the increase of internet shopping, or e-commerce as it is more correctly referred to.
Today, e-commerce is the fastest growing segment of distance selling. It includes internet orders as well as traditional mail order companies that now also maintain online presences. Most frequently ordered goods are those that fit into a box and may be delivered by one person, such as books, CDs, shoes, jewellery. Bulky goods (furniture, electrical equipment), which need to be delivered by at least two people, and groceries make up position two and three on the ‘most ordered’ scale. Compared to conventional sales channels, e-commerce leads to two distinct changes in sales and distribution. First, intermediate sellers are left out. Second, clients may order personalised goods. Thus, the supply chain is shortened, and the client may request additional services, which in turn affects quality and price of products. These modifications in the sales channels and logistic systems have a significant impact on existing structures:
� instead of a client choosing the product in the shop and takihave to be ordered in the storage or warehouse, which results bring-system:
ng it right home, the products now in a shift from a collect- system to a
� instead of large deliveries to retailers and shops consumers;
individual parcels are now delivered to the
� deliveries are “atomised”, meaning they get reduced deliveries get smaller.54
in sizes, since orders and consequently
Most consumers tend to greet the possibility to order from home and have their orders delivered to their doorsteps rather enthusiastically. However, the reality is often less positively perceived. As a UK Study survey showed, only very few internet shops offer their clients to choose a delivery date or to even make a fixed delivery appointment. This means that the consumer does not know when the products are likely to arrive at the doorstep. So s/he either has to stay at home all the time, to have somebody watch out for the delivery, or to hope s/he will be lucky and be at home by chance. However, as many people know from personal experience, it is much more likely not to be at home when the delivery arrives. This was proven also in the UK. There, yet another study revealed the following:
� In about 50% of houses and apartments no-one is at home in between 9:00 and 16:00, which are standard delivery times (The reason for that is that the number of 1 and 2 person households with all household members working increases steadily).
� As a result, one out of 15 delivery attempts is unsuccessful. (A certain proportion of deliveries, for which the actual recipient is not at home, is left with neighbours, etc., thus improving the delivery ratio.)
� If a delivery attempt fails, the client has to be contacted again, which increases operation costs. Likewise, the company’s image is affected, and the client may not use the order service again.
� Failed deliveries are also quite annoying for the consumer. In the UK, 38% of clients ceased to use mail or internet shopping facilities as they regarded delivery times as unsuitable or unknown. 55
In order to reduce failed deliveries and/or the necessity to contact clients again, various delivery alternatives exist.
First, deliveries may be organised so that it is not necessary to meet the recipient at home.
Solutions include parcel boxes and logistic boxes, which are either permanently (parcel boxes) or occasionally (logistic boxes) fixed to the outside wall of the client’s house. The boxes may be opened using an electric code or a key. Clients are informed of the delivery via mail or mobile phone.
30
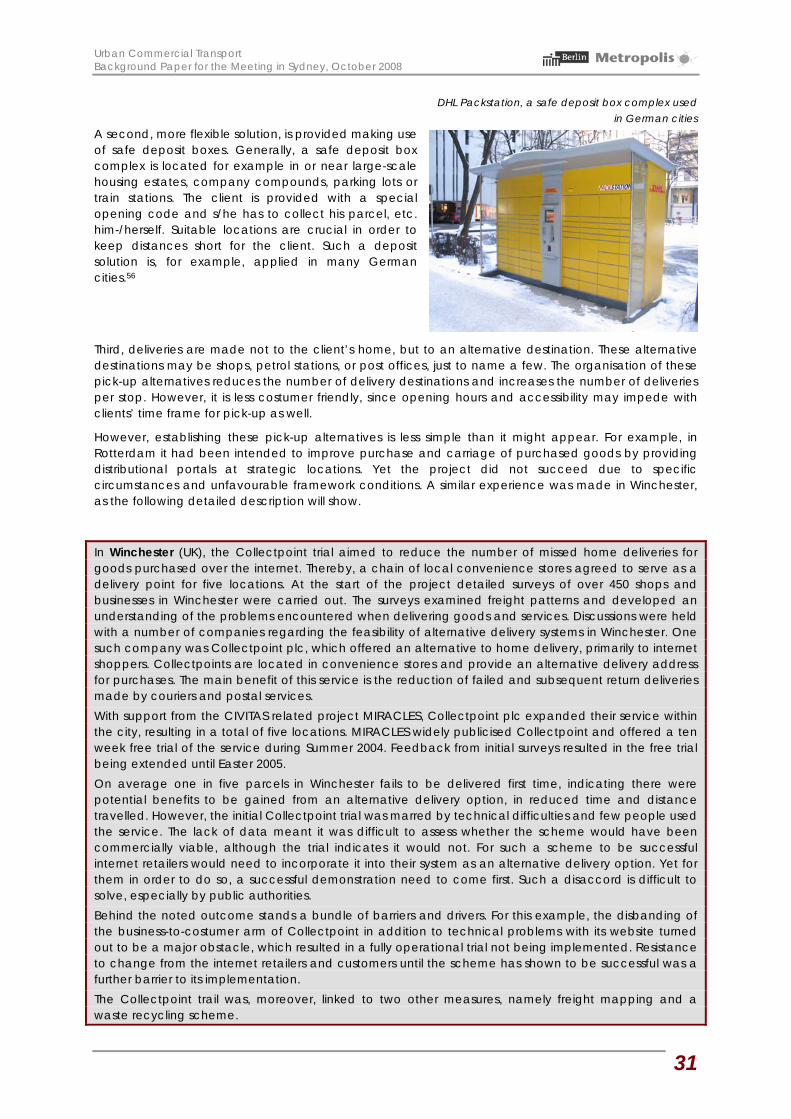
Urban Commercial Transport Background Paper for the Meeting in Sydney, October 2008
DHL Packstation, a safe deposit box complex used in German cities
A second, more flexible solution, is provided making use of safe deposit boxes. Generally, a safe deposit box complex is located for example in or near large-scale housing estates, company compounds, parking lots or train stations. The client is provided with a special opening code and s/he has to collect his parcel, etc. him-/herself. Suitable locations are crucial in order to keep distances short for the client. Such a deposit solution is, for example, applied in many German cities.56
Third, deliveries are made not to the client’s home, but to an alternative destination. These alternative destinations may be shops, petrol stations, or post offices, just to name a few. The organisation of these pick-up alternatives reduces the number of delivery destinations and increases the number of deliveries per stop. However, it is less costumer friendly, since opening hours and accessibility may impede with clients’ time frame for pick-up as well.
However, establishing these pick-up alternatives is less simple than it might appear. For example, in Rotterdam it had been intended to improve purchase and carriage of purchased goods by providing distributional portals at strategic locations. Yet the project did not succeed due to specific circumstances and unfavourable framework conditions. A similar experience was made in Winchester, as the following detailed description will show.
In Winchester (UK), the Collectpoint trial aimed to reduce the number of missed home deliveries for goods purchased over the internet. Thereby, a chain of local convenience stores agreed to serve as a delivery point for five locations. At the start of the project detailed surveys of over 450 shops and businesses in Winchester were carried out. The surveys examined freight patterns and developed an understanding of the problems encountered when delivering goods and services. Discussions were held with a number of companies regarding the feasibility of alternative delivery systems in Winchester. One such company was Collectpoint plc, which offered an alternative to home delivery, primarily to internet shoppers. Collectpoints are located in convenience stores and provide an alternative delivery address for purchases. The main benefit of this service is the reduction of failed and subsequent return deliveries made by couriers and postal services. With support from the CIVITAS related project MIRACLES, Collectpoint plc expanded their service within the city, resulting in a total of five locations. MIRACLES widely publicised Collectpoint and offered a ten week free trial of the service during Summer 2004. Feedback from initial surveys resulted in the free trial being extended until Easter 2005. On average one in five parcels in Winchester fails to be delivered first time, indicating there were potential benefits to be gained from an alternative delivery option, in reduced time and distance travelled. However, the initial Collectpoint trial was marred by technical difficulties and few people used the service. The lack of data meant it was difficult to assess whether the scheme would have been commercially viable, although the trial indicates it would not. For such a scheme to be successful internet retailers would need to incorporate it into their system as an alternative delivery option. Yet for them in order to do so, a successful demonstration need to come first. Such a disaccord is difficult to solve, especially by public authorities. Behind the noted outcome stands a bundle of barriers and drivers. For this example, the disbanding of the business-to-costumer arm of Collectpoint in addition to technical problems with its website turned out to be a major obstacle, which resulted in a fully operational trial not being implemented. Resistance to change from the internet retailers and customers until the scheme has shown to be successful was a further barrier to its implementation. The Collectpoint trail was, moreover, linked to two other measures, namely freight mapping and a waste recycling scheme.
31

Association of the Major Metropolises Commission4: Urban Mobility Management
Regarding the first, about 2,000 Winchester Freight Maps were produced for freight operators and drivers of commercial vehicles, showing appropriate routes, the main delivery destinations and vehicular restrictions. Initially the Maps had been thought to be a helpful tool for delivery drivers and would support smother and less disrupting traffic flows. However, the results of the measure were also quite sobering. Awareness at the side of the businesses was low (only 3%), so no evidence was collected to show that the freight map was used by freight companies. Nevertheless, some subjective comments suggested that the simplified map was useful. The waste recycling collection trail, however, turned out to be more successful, albeit its potentials have not yet been fully put to use. In this demonstration measure, an electric vehicle was used to undertake a waste cardboard and paper recycling service for Winchester city centre businesses. Within the waste recycling collection trial, only a relatively small amount of recyclable waste was collected, typically about one tonne per month. Nevertheless, this appears to be an economically viable venture for the company running the scheme since the service is operated on a full-time basis. A client base of 35 Winchester businesses has been established and the scheme has been expanded to other towns in Hampshire. In addition, the participating Winchester businesses saw the use of an electric van as a worthwhile public relations exercise to enforce the impression that they are a ‘green’ company.
As can be seen from the overview of last mile solutions provided in the previous paragraphs, last mile solution are often operative solutions on the side of logistic and delivery providers. They are very much determined by costumer demands and to some degree also a subject of (private) buyer–seller relations. The role of local authorities is, therefore, somewhat restricted to providing the necessary provisions, e.g. building permission for locker complexes or by matching delivery times (and restrictions) with the times that costumers are at home. The latter is particularly important for avoiding repeated delivery attempts, yet it might actually contradict local attempts to reduce noise and air quality disturbances, e.g. by prohibiting access to residential areas at evening times. Nevertheless, last mile solutions are crucial for the reduction of freight volumes in cities. In order to achieve optimal solutions, local authorities and delivery companies need to cooperate quite intensively.
2.3.Shifting the mode
Just like in the passenger transport sector, hopes to alleviate negative impacts and increase benefits of freight transportation are often pinned on shifting the modal split. By and large, this refers to shifting inter-/nationally and regionally transported cargo from road to rail. However, changing the modal split for freight transportation in urban areas is also an interesting approach. What is more, it is an approach more frequently applied than publicly perceived: sometimes for ambitious reasons, sometimes out of necessity and lack of alternatives.
Thereby, the former motive usually relates to developed countries, while the latter is an issue in developing nations, especially as regards non-motorised transportation.
Combining public and freight transportation, i.e. by using public transport rail infrastructure for freight transportation purposes during off-peak hours, is another interesting approach. As a matter of fact, this has for a long time already been done for long-distance transportation, yet in urban transport it presents something of a novelty. The following chapters will outline some of the specific requirements, case studies and interesting aspects of the two alternative modes that could ease the handling of freight transportation in cities.
2.3.1. By foot, by bike, on cart, on time: Non-motorised goods transportation
Non-motorised transport of goods is quite heterogeneous in character. It comprises pedestrians, bicycles, tricycles, cycle rickshaws, animal drawn vehicles, push carts, etc. The nature of the goods transported is equally diverse, ranging from food and other convenience goods to building materials and waste. Non-motorised transportation holds three distinct benefits for the cities. First, it secures that
32

Urban Commercial Transport Background Paper for the Meeting in Sydney, October 2008
cities and their population are being supplied with whatever goods are needed. Second, it causes virtually no pollution, little noise, and it uses only a fraction of the space that motorised transports take up. Third, it is comparably labour intensive, thus providing a source of income for many people working in the sector.
By and large, non-motorised goods transportation in cities is usually a matter of short-distance transports. In rural areas, however, distances can reach considerable lengths.
In cities of the developing world the share of goods transported on foot, bicycles or carts is often considerable. Nevertheless, it is usually seen as inferior to motorised transportation, and, moreover, as merely a reaction to the (financial) inability of small traders or vendors and private merchants to transfer their businesses to other modes of transportation. Thus, road transportation might take over shares as soon as business develops and improved financial conditions generate the respective demand.
In contrast, cities of the developed world, having for long experienced the negative impacts of uncontrolled growth of motorisation and transportation, increasingly see non-motorised transport as a solution to many problems in the urban transport sector. However, more often than not increasing nonmotorised mobility of people and goods poses a target, which is difficult to achieve. It requires more than just good will, the existence of which is nevertheless a necessary prerequisite. In fact, increasing non-motorised mobility is a lengthy undertaking once people are used to motorised transport only. It needs strong political will, a paradigm shift in planning, new perspectives to be taken on, and the ability to convince the users – be it private people or business entities – to at least try alternative modes.
To put it in a nutshell: many cities of the developed world now strive to get (back) what cities in the developing world still have, but might loose in the future: high shares of non-motorised transportation. However, both getting them back and retaining them is often easier said than done. It requires the involvement of many actors, the ability of planners and users to decide on what is the right mode for a certain trip, and not least an image shift.
While a lot more could be said from a theoretical perspective, usually the best way to prove a point is to illustrate it by an example. Also, instances from the real life allow for not only seeing the benefits, yet also the drawbacks that non-motorised transportation may also bring with it.
Hauling and rolling in cities of the developing world A comprehensive study on ‘The development of logistic services in third world cities’ commissioned by the World Bank provides the following two case-studies. 57
First, in the city of Dhaka (Bangladesh), the transport of food and grain is an important sector of urban transportation, even more so as the market for food products is of regional and even national relevance.58 Water, road as well as rail transportation are being used, yet with different shares, different potentials and for different purposes. Transportation of goods by trucks from outside the city, such as the seaport Chittagong, is important. Yet occupancy of trucks is low, and the problems caused by parking and congestions lead to the introduction of a truck ban in the inner city. Animal drawn carts are likewise prohibited in the centre of Dhaka.59 Thus, for short distances, pick-up trucks and other motorised and non-motorised vehicles, such as rickshaws, rickshaw vans and pushcarts, are predominantly used. But the non-motorised vehicles also cause considerable disturbances to the traffic due to their slow speed. In addition, since loading capacity is limited, a large number of these vehicles are required to transport an equivalent of one truckload. The non-motorised vehicles are the main modality for intra-city goods movement, especially near the old city. The necessity of (non-) motorised vehicles is also caused by the infrastructure; some roads are just not suited for large vehicles. Second, in Nairobi (Kenya), non-motorised means, mainly pull carts and horse or mule driven carts, serve to provide the markets with food, and they also bring goods into the industrial zone. Yet their number is decreasing due to an increase in motorisation and furthered by the building activities that also include road infrastructure. Thus, pull carts are now mainly used in the near surroundings of the markets. Horse and mule driven carts are all together vanishing from the street scene.
33

Association of the Major Metropolises Commission4: Urban Mobility Management
The cited study compared Dhaka and Nairobi to Rotterdam, where non-motorised commercial transport appears to play no role at all. So, the findings as regards bikes and carts are based on the two cities only. They conclude:
“The best modality to organise the short distance transport depends on:
- The labour costs;
- The available infrastructure.
The total transport costs are determined by labour costs and the depreciation and operational costs of the vehicle used. In developing countries, labour is very cheap and the transport costs mainly determined by depreciation and operational costs. This makes non-motorised transport very attractive for developing countries. It requires a minimum investment and maintenance/operational costs are very low. The labour efficiency is very low, but this is not important, as the costs for labour are very low as well.
Another aspect that influences the type of modality is the infrastructure. The bazaar in Dhaka has very narrow streets, what makes the use of large vehicles impossible. The modality choice is firstly determined by the possibilities of the available infrastructure and secondly by cost aspects. The low labour costs in developing countries makes the use of nonmotorised transport, especially for relative small distances, very attractive.”60
Loaded freight xiclo in Hoh-Chi Min City
The fact that non-motorised transportation is of particular importance in market areas and for the distribution of food and convenience products is further stressed by a report of the Food and Agriculture Organization of the United Nations (FAO).61
There, carrying goods between markets and supplying small wholesalers is denoted to be a specific sector of urban transport. For the purposes mentioned, specific vehicles, motorised and otherwise are used, and special depots exist, most of which are frequently unregulated. Non-motorised vehicles include bicycles, two-wheel manually drawn vehicles (carts and rickshaws) and four-wheel manually drawn vehicles (carts and wagons). Lastly animal
drawn vehicles (horse- or donkey-drawn carts) are used, and, for example in Antananarivo, a small number of horse-drawn carriages also do their bit. While these non-motorised vehicles are concentrated mostly at the markets or in their immediate vicinity, the carts may also be linked with a commercial centre, such as a customs post (the river customs post at N'Djamena (Chad)), small ports (Conakry (Guinea)), or a wholesaler district (Bobo-Dioulasso (Burkina-Faso), Antananarivo (Madagascar), etc.).
The above mentioned issue of low loading capacity is somewhat opposed when considering the fact that surveys have shown
“…that bicycles carry up to 180 kg, while rickshaws and twowheel carts carry an average of between 200 and 500 kg, reaching 600 kg in the case of some rickshaws. The four-wheeled carts carry loads of up to 1.5 tonnes. Some two-wheel carts can even take 2 tonnes, in which case (only found at N'Djamena) the cart driver has two assistants.” 62
34

Urban Commercial Transport Background Paper for the Meeting in Sydney, October 2008
There are other, partly peculiar characteristics of non-motorised goods vehicles in cities.
For example, the rickshaws and the horse-drawn carriages in Antananarivo were formerly passenger vehicles (the carriage was known as “the poor man's bus”, and the rickshaw the taxi of the “peasants” arriving in town). They have gradually been adapted to meet the increasing urban freight transport demand throughout the vast informal sector of markets and small shops. A factor that supports the use of non-motorised vehicles in Antananarivo is the topography of the metropolitan area, since they are more suitable for some hilly parts of the town than any other mode of transport. In the areas built on the hills, rickshaws are the only means of transport that can be used over short distances. For longer journeys and on steeper roads, rickshaws and motorized vehicles compete. Since they charge essentially the same fare, the decisive factor for the chosen mode of transport is the volume of merchandise being carried, the speed of the service required and the relations established with one or other type of transport provider.
Likewise, in the case of the Senegalese animal-drawn cart, which carries a load of about 1.5 tonnes, the only passenger accepted would be the owner of the merchandise being transported.
Conakry, the capital of Guinea provides an excellent example for how the different transportation modes are used for transporting various kinds of food over a range of distances and to/from different clients:
“Non-motorized vehicles (NMVs) link the small urban ports where paddy, salt, palm oil, fish, construction timber (mangrove wood) are unloaded with Madina [the central market], and Madina with the neighbouring markets. Four-wheeler carts and rickshaws cover these very short distances of north-south or south-north traffic (between one and two kilometres). Transport from west (Madina) to east (the various markets on the national highway) covers long distances and is carried out almost exclusively by motorized vehicles.”63
The FAO studies conclude that non-motorised (goods) vehicles are found in every town, regardless of size. Therefore, it is not an archaic mode of transport in towns with certain traditions. Even more so, it is not specific to any particular stage in the urbanisation process, or in the development of modes of motorised transport. Instead, it co-exists easily with motorised modes of transport, sometimes even competing certain routes.
Further proof for the adaptability and usefulness of non-motorised vehicles also and foremost in highly developed cities can be gathered from Asia.
There, in many cities non-motorised vehicles (including people’s own feet) account for 25 to 80 percent of trips, more than anywhere else in the world.64 While bicycles are the principal non-motorised mode for personal mobility, non-motorised rickshaws are used for the delivery of goods such as furniture, refrigerators, and washing machines. Semi-skilled workers, carpenters, masons, plumbers, postmen, and courier services use bicycles. The demand for bicycles and rickshaws is therefore considerable at present, and it is likely to continue to be so. Despite their importance for safeguarding local supply, the situation of non-motorised transport is usually not explicitly recognised in policy documents and very little thought is given to improving facilities for non-motorised modes of transport.65
The following is but one example of the daily use and requirements of bicycles for goods transportation. It dates back a number of years, but still provides a vivid picture of a situation that can be found in different cities worldwide even nowadays.
35

Association of the Major Metropolises Commission4: Urban Mobility Management
“Bicycles are not licensed in Jakarta [Indonesia] so no accurate estimate of their use exists. Bicycling is not confined to the young; older people use them both for movement and transport of goods. Wicker baskets are often secured to the back to carry grass, garbage, or wood. I have also seen wooden and metal frames attached to the bicycle to carry special goods. Bicycles are manufactured in Indonesia, but most are imported from Japan and China. The Chinese bicycles ($90) were more expensive than the Japanese ($78) and appeared to be heavier-duty models. For example, the Japanese brakes were cable operated while the Chinese bikes used rods. The trade-off here is weight for durability, and if the bike is to be used for cargo transport then the most durable type will be chosen. For personal transport, however, speed is more important so the lighter bike will be chosen. Bicycle repair is done in the streets on a wooden stand by itinerant repairmen. The repairman has a few tools and spare parts, and is capable of performing all light repairs including wheel truing and tyre patching. Becaks [bicycle rickshaws] can also be repaired at these facilities and it is not uncommon to see several up-ended becaks clustered around a repair stall.“66
The picture painted in the quotation above appears to be somewhat rosy. An indeed, the situation in Jakarta, just like in other Asian cities, has changed since the time those impressions were given way. Many cities attempt to reduce the number of non-motorised vehicles as they appear to be remainders of old times, not in line with the general notion of progress. Likewise, and not always on purpose, the creation of infrastructure fitted to the needs of cars and trucks also makes it more difficult for nonmotorised vehicles to keep their stand.
However, there appears to be a paradigm shift, also and foremost initiated by international agencies, which increasingly support non-motorised transportation. Some examples include:
� Oxfam International, a confederation of 13 organisations, has realised the strong economic advantages arising from providing people with freight bicycles. The purpose-built OxTrike (available since the late 1970s) is a three-wheeled pedal operated vehicle capable of carrying payloads of over 150 kilograms. It is produced at community workshops in non-industrialised countries worldwide, providing employment opportunities in both the manufacture and transport sector.67
� Worldbike (founded in 2000), an international network of bicycle designers, industry leaders, and international development professionals, has succeeded in developing freight bicycles that suit the needs of those working with them better than ‘conventional’ bicycles that are usually designed for recreation purpose. They have designed higher-strength, longer wheelbase bicycles with integrated cargo capacity called Big Boda. The vehicle is manufactured in a trial workshop in Kisumu, Kenya. Initially about 50 Big Boda cargo extensions were built there and sold locally. The Big Boda found success in the transportation of certain goods such as bread and cut flowers, in the transport of school children and in medical field work. Success in these arenas are measured as increase in efficiency (carrying 20 to 40% more bread per load), increase in earnings (carrying more passengers simultaneously increases income per trip), and in some cases decrease in costs (decreasing the orphanage's daily transport expenses). Currently, the organisation aims at remedying some of the technical and usability problems of the bike, resulting in the development of a second generation of the vehicles, which are simply called worldbike.68
These two examples also show that bicycle technology, indeed, has an enormous potential for innovation – be it with regard to the technology or in relation to use, manufacturing and entrepreneurship.
Probably, exactly these sometimes often underrated characteristics of the non-motorised transport sector will make sure that non-motorised means will always have their place in freight transportation. The prime example for that are the Lunchbox Carriers of Mumbai.
36

Urban Commercial Transport Background Paper for the Meeting in Sydney, October 2008
The city of Mumbai (formerly called Bombay, estimated population 15 million in 2001 with rapid growth rates) contains a somewhat unique and successful system for the distribution of highly specialised goods for private costumers: boxes containing home made lunches. Every day, about 5,000 dabbawallahs (delivery men) pick up 200,000 lunch boxes from people’s homes and deliver them through an (labour-) extensive network using bicycles, trains or simply their own feet to the workplaces and offices in the inner city or anywhere else. The dabbawallahs are often poor and illiterate people; however, their system of colour coding is so efficient that their error-rate is less than 1 in 16 million – a ratio that even impresses management gurus.69 The money a dabbawallah earns goes into a co-operative pool, out of which s/he is paid a monthly salary. The system is so successful, that even the rise of food-courts and the growing numbers of fast-food outlets and hot meal suppliers do not pose serious competition. High demand and the efficiency and the reliability of the system prove any prejudice about nonmotorised transport being outdated and obsolete to be completely mistaken. The dabbawallah industry in Mumbai has been working faultlessly for the past 126 years. Moreover, annual growth rates are estimated to reach up to 5-10%. If this was not already enough evidence for the durability of the dabbawallahs, the tiffin carriers, as they are also called, have now gone high-tech. In order to increase costumer numbers, they have set up a website – http://www.mydabbawala.com – and they also offer a sms service for their clients. This has come to a surprise to many people, considering that the majority of the lunchbox carriers are illiterate, and only few have ever heard of the internet. However, the move online has been an enormous success, leading to 10 to 15 additional enquiries every day.70
By now, the service is not only well-known in Mumbai, but it has become famous all over the world. Media coverage is high, and it experienced yet another boost following the visit of Prince Charles’ to the dabbawallahs in Mumbai in March 2003. The Prince of Wales, however, had to arrange his schedule around theirs, since punctuality is the key to the success of the lunchbox carriers, and nothing, not even a royal visit, could lead them to jeopardise it.71 In return, the dabbawallahs pooled money for a special wedding present to the Prince of Wales and Camilla, Duchess of Cornwell, thus expressing their gratitude for the royal visit.72
What is more, representatives of the ‘Mumbai Tiffin Carriers Association’, listed in the commercial registry since the late 1960s, also offer lectures and presentations on the work of the dabbawallahs in Mumbai as stimulation to other cities. Interest in their work is great, and considerations to adapt the system to other cities frequently arise. However, apart from one other set-up in Pune, so far the system seems only to be feasible in Mumbai. As one dabbawallah explained:
''Earlier also there were plans to start in other places, including London, but it is not easy. For us, distance and time management is most important. The stations need to be close to each other and everyone needs to be served lunch between 12 noon and 1 pm. […] The train system here [in Mumbai] works best for us. But in other cities, even Delhi, it is not the same. Also the distances are really far, so the road is ruled out.”73
The same source, moreover, states the necessity to have “A group of like minded people who are self motivated and committed” is another important prerequisite for achieving the success of the tiffin carriers.74
Apart from the outlined necessary preconditions regarding spatial organisation and transport system structure, further restrictions to the adaptability of the tiffin carrier organisation to other cities also apply. First and foremost, it is a very specialised system regarding the delivered products (home-cooked lunches) as well as the organisation of the ‘delivery fleet’, i.e. the carriers themselves. It is, thereby, not applicable in cultural backgrounds where for example labour participation of women is high, so that there simply is no-one to cook lunch in the mornings. Also, societies vary considerably regarding their food (and thus, lunch) culture. Likewise, labour costs in many countries have risen above the level, where the described, labour intensive system would be economically viable . Thus, recommending other cities should implement the same or a similar system as well would mean oversimplifying the complexity and the logistics of the tiffin carrier system. Instead, the case of the lunchbox carriers might well serve as an inspiration to other cities all over the world to reconsider the merits and possibilities coming with non-motorised delivery.
37

Association of the Major Metropolises Commission4: Urban Mobility Management
Many more examples could be cited for the way bi- and tricycles, carts, rikshaws, etc. are used in cities of the developing world. However, in order to illustrate the argument that was already stressed a number of times, i.e. that non-motorised (freight) transportation is also an important issue in cities of the developed world, our attention should now be turned to those.
Pedalling and speeding in cities of the developed world In cities of the developed world, bicycle couriers are the most frequently available means of nonmotorised goods transportation. In fact, the number of cycling couriers has increased in past years due to the time and cost advantages over their motorised competitors. As an additional give-away, the urban environment benefits from this transport alternative. For example, in Germany bicycle couriers cover a distance of about 17 Mio. km annually, thereby reducing noise and air pollution in the same way as they take pressure off the urban (road) infrastructure.75
Naturally, there are some special characteristics of cycling messengers. For example, their range of services includes:
� spontaneously required quick-time courier jobs;
� regularly booked trips;
� messenger services for businesses in inner-city locations;
� delivery service for private people;
� regional and national shipments making use of other transport modes.
Bicycle courier in London
Cycling messengers usually offer their services within a radius of about 13 kilometres in inner-city areas. Distances up to 5 km are usually overcome faster by cyclists than by a car. Moreover, if traffic routings for motorised transport are less direct, if there is a lot of congestion, or if short-cuts are available to the cyclists, they also outrun the car on longer distances. Generally, the weight of the goods or deliveries does not exceed 10 kg. Sometimes, courier services offer to transport heavier loads as well when special freight bikes or, alternatively, cars are used. Until some years ago the circle of costumers was pretty much restricted to printing shops and
advertisement agencies. By now, the variety of clients has increased, now including travel agencies, insurance companies, banks, tax and law attorneys, pharmacies as well as industry and craft shops, dental laboratories, political parties, and many more.76
Among the reasons for employing bicycle instead of ‘conventional’ couriers, their flexibility as well as time and costs advantages are probably of most interests to clients. However, the advertisement effect is also quite considerable. Bicycle messengers and couriers have a young, dynamic, innovative and, of course, environmentally friendly image that rubs off on their employers. Their attractiveness increases further by the possibility to use their services for long-distance. Even nationwide shipments are possible, which are handled by means of combining the bike with other modes as the example from Germany (see textbox below) shows.
Other European cities also hold some interesting experiences and plans regarding non-motorised commercial transport:
38

Urban Commercial Transport Background Paper for the Meeting in Sydney, October 2008
� In York (UK), purpose-built cycle rickshaws are used for deliveries in the city centre where a ban of vehicle traffic has been imposed.
� In The Hague (The Netherlands), a horse and wagon was used for goods deliveries in the town centre. The arrangement was extremely successful, but the company relocated to the outskirts of the town and thus too far from the centre to continue this operation.
� “In Antwerpen, Belgium, the PuPNET scheme encourages shoppers in the main shopping street to leave their cars in one of the park-and-ride zones in the outskirts of the city. Shoppers can have their purchases picked up by a bike courier, who guarantees delivery within two hours to pick-up points close to the park-and-ride zones and major hubs of public transport. The goods may also be ordered by phone. The goods are stored in temperature controlled lockers of different sizes, which can be opened with a special “hands-free shopping pass”. Hands-free shopping means that shoppers do not need to carry their purchases with them, and they can easily combine shopping activities with others such as visiting theatres or restaurants.” 77
� In Brussels (Belgium), a bicycle courier service named Urban Bike was founded in 2000, employing six bicycle couriers, for light packages on short distances. The initiative was evaluated and assessed successfully according to the following: First, there is a clear speed advantage for bicycles in city centres. Second, this distribution model is positive for reducing congestion and pollution and to improve delivery speed and reliability especially during peak hours. However, it clearly turned out that this is a niche market, which cannot be extended to other type of parcels. Nevertheless, the model itself is transferable to other cities. The transfer requires a market actor and demand potential for small packages on short distance, thus a dense city centre. 78
� Helsinki (Finland) has recommendations.79
made the exact same experiences with similar outcomes and
In Germany, a pilot project was initiated by the German Federal Association of Bicycle Courier Services (bdf) in co-operation with time:matters (a daughter company of Lufthansa Cargo), proving that combining the bicycle and the train for goods delivery is a worthy undertaking. And this is how it works:80
Bicycle messengers collect urgent deliveries at the client’s home or office and take it to one of about 140 courier stations of time:matters at German central train stations. There, the parcel, letter, materials, samples, medication… or whatever else it might be, is put on board of a high-speed train and delivered to the train station closest to the recipient. There, another bike courier picks it up again and pedals it to its destination. Within Germany, a same-day door-to-door service is offered, using the bike-train combination. For European shipments, same-day deliveries can also be arranged, albeit by air mail rather than the more environmentally friendly rail bound transport. The service is available in most German urban agglomerations, and it is being continuously extended to increase area and costumer coverage.81 While of course this model is a valuable source of business for the logistic provider and the courier services involved, it also benefits the environment and reduces motorised inner city traffic volumes. Needless to say, the solution to urban freight transport problems will not be achieved by using this system solely. However, it provides on of many building blocks towards better, unobstructed, environmentally friendly urban transportation of goods.
These examples from the cities provide two distinct impressions regarding non-motorised freight transportation. First, it is a niche market. Second, in cities of the developed world it appears to be feasible virtually only for messenger services or for small scale deliveries. The full potentials have, thus, not been put to use. The reasons for that are manifold and deeply rooted in the technical (infrastructure, availability of bikes), spatial (long distances to be covered), economic (low demand, no feasible business models) and behavioural (lack of awareness) conditions of a city.
Thus, attempts to promote non-motorised freight transportation on a larger scale are more or less anecdotic. However, they make for great media coverage and, thereby, possibly awareness and a stimulus to challenge established mindsets. The following transcript of an American radio airing gives some prove to this.
39

Association of the Major Metropolises Commission4: Urban Mobility Management
Truckers: Make Room for Bike Freight. by Shannon Mullen82
In a handful of major cities, some companies are turning to bike freight as a cheaper, greener way of delivering their products without using fossil fuels. In Boston, for example, a driver named Wenzday Jane pedals her way across town to deliver a 300-pound load of locally made chocolate and cheese. She navigates her 200-pound vehicle along the city streets, going a hair slower than traffic. Jane is a driver and general manager for The New Amsterdam Project — a 6-month-old company based in Cambridge, Massachusetts, that uses human power to deliver serious freight. Some deliveries weigh up to 1,000 pounds. There are similar start-ups in Berkeley, California., and New York City. Their three-wheeled vehicles look like a cross between a bike and a box truck. New Amsterdam's British-made model has a shiny, bright-red fiberglass cargo hold in the back that's about 4 feet high and 3 feet wide. The front looks like a bicycle — seat, pedals, handlebar and a wheel. "There's also an electric assist to help out with inertia and inclines with a heavy load," Jane says.
A Greener Way? Even a full load doesn't rival the capacity of a conventional delivery truck. But New Amsterdam CEO Andrew Brown says his custom, compact vehicles would better suit many small- to medium-sized businesses. "It makes no sense to transport goods through urban areas with big trucks. Our business operationalizes that idea," Brown says. "It's faster, more efficient, healthier, and a more constructive way to distribute goods." But at $11,000, the custom vehicles are expensive. And with fewer than a dozen clients currently signed up, his business has yet to turn a profit — or cut much carbon. New Amsterdam has saved an estimated 3,600 pounds of carbon dioxide emissions per year — only about 180 gallons of gas. But once all five of New Amsterdam's vehicles are logging 600 miles a week, the company expects to save more than 1,000 gallons per year. That equals eco-peace of mind for carbon conscious companies such as Taza Chocolate, one of New Amsterdam's clients. Taza co-founder Larry Slotnick says human power also saves his business and his customers money. "We just knew that with New Amsterdam, our delivery price would actually stay pretty constant because they're not relying on fossil fuels," Slotnick says. Most New Amsterdam clients pay $10 per delivery, while other Boston-area trucking firms charge $50 to $80 plus a fuel surcharge. Another advantage to bike freight delivery: State traffic laws let New Amsterdam drivers use bike lanes to get around traffic jams.
Picture to the right: In Boston, New Amsterdam Project bike freight driver Wenzday Jane pedals her 200-pound vehicle along the city streets, going a hair slower than the busy city traffic.
40

Urban Commercial Transport Background Paper for the Meeting in Sydney, October 2008
2.3.2. Combining public and freight transportation
In long-distance transportation, shared use of infrastructure for transporting freight and passengers is a common practice. Cargo and passenger trains use the same railroad tracks; aircrafts start and land on the same airports; ships use the same routes, and they even transport both passengers and goods at the same time. However, on urban level, only roads are used by both passenger cars and cargo trucks, while rail infrastructure in most cases is used for passenger transport only. But, this has not always been the case, as the examples below quite vividly shows.
The London Mail Road, or London Post Office Railway as it was officially called, was a small-scale underground network. It was opened in 1927 following the below cited Chicago example and connected eight postal offices. It still had been in heavy use in the 1980s as the world’s only left-over mail rails system after the ones originally in use in Germany and America had long been closed down. However, it finally became redundant after re-organisation of the postal offices in 2003 and is now part of both postal and transport history.83
The Chicago Tunnel Company Railroad started building a freight underground network in 1899. After completion in 1906, the network reached a length of 97 km with tunnels stretching along under virtually all roads in the inner city. By means of two-way operation, coal and other goods from railway cargo terminals were rolled to warehouses, offices and storehouses in the inner city. For the return trip, waste and ashes were loaded onto the train. 84 Limitations notwithstanding, the tunnel railroad was not a small-scale operation, as an article from 1929 proudly announced: “The freight subway, with its 150 electric locomotives and its 3,300 freight cars, handles a volume of tonnage each day equivalent to that carried by 5,000 motor trucks.”85
However, the emergence and increase of trucks and lorries as well as the shift from coal powered to gas powered heating systems resulted in a downturn in profits. Finally, the operating company had to declare bankruptcy in 1956; the network was shut down for good in 1959. Nowadays the only remainders are the tunnels, which are used for the laying of electric cables and telephone wires.86
Because of the ever increasing pressure to reduce the dominance of road transportation in inner cities, the idea to use existing inner-city underground and train networks for the transporting of goods reappears every so often.
A historian’s memory is a futurologist’s dream: underground freight networks In Germany, for example, the mid- and late-1990s saw such a debate, focussing on the cities of Hamburg, Munich and Frankfurt. There, as in other cities around the world, it surely is not uncommon to see the odd (underground) train transporting spare parts for the existing network or building materials for replacement and extension works. However, these very specialised transports have nothing to do with the reality of supplying shops and offices in the inner city. When cities started to rebuilt and modify their stations and vehicles in order to be universally accessibly and barrier-free, some planners saw a chance that through these modifications goods transportation could also be made feasible. It was envisage that the newly installed lifts and ramps could be used to load palettes and small containers into the trains. As appealing as the idea might seem, operational obstacles proved not to be easily overcome:
� Elevator doors and underground passages for passengers are often too narrow for even the smallest of freight containers;
� Most underground lines are used to their capacity during daytime, thus, no additional freight trains may be squeezed in;
� During night hours maintenance and cleaning works also provide obstructions for freight trains;
� Simply coupling cargo wagons to the passenger trains is not an option, since passenger trains stop for only 30 to 50 seconds – a time span to short for unloading cargo.
41

Association of the Major Metropolises Commission4: Urban Mobility Management
It appears that inner-city passenger and freight transport follow different systematic logics. While infrastructure is similar, the operational demands are quite the opposite. However, the idea is still not wholly discarded. For example, the Urban Mobility Plan for Paris envisages the use of the existing regional express train connection from Roissy Charles-de-Gaulle airport to Paris Les Halles shopping centre (in former times nicknamed “the belly of Paris”) for freight transportation. A feasibility study is being carried out, aiming at identifying potentials, costs and likely outcomes of such a connection.87
Since the line as well as the station already exist, it will be interesting to see which solutions and findings may now be generated especially in comparison with similar attempts from the last decades, as for example the ones just mentioned.
Contemporary considerations on using especially underground networks for goods transportation are often coupled with the idea of having fully automated systems and/or systems roughly comparable to that of the much older pneumatic deliveries. These pneumatic post networks, also called letter shoots or letter chutes, were popular in major cities around the world in the early years of the last century, e.g. in New York, Berlin, Chicago, Boston, Rio de Janeiro, Sao Paolo, London, Vienna, Algiers, Buenos Aires, and many more. Mainly, these where pipe systems, in which letters and (very) small packages were transported in cylindrical containers by applying pressure differences.
While most city-wide networks have now ceased to exist, they are still in use in large-scale building complexes such as hospitals for the transporting of post, pictures, laboratory probes, etc.
Nevertheless, since the 1960s several attempts have been made to transport goods by pneumatic networks with a much larger diameter. Lines were built in the US, the UK, Canada, Russia, Japan and Germany. However, they never became much of a success. Also today, several inventors and companies try to revive the technique. Yet it stands to reason that a two hundred year old technology may not be the way forward. In fact, pneumatic systems are very energy intensive and not suited for longer distances.88 Thus, automated underground transport using electric propulsion is now promoted to be a much more viable technology.
CargoCap, automated underground freight transport
Today’s plans for automated underground freight transport networks are of course of different scale and magnitude. Within Europe, The Netherlands have for a long time been the mastermind of these systems, yet they are still very much in experimental stage. Likewise, the German CargoCap (each cap with a volumetric capacity of two standardised euro-pallets, planned to be able to travel up to 150 km per hour on longdistances), promoted as ‘the fifth transport alternative’ is also exclusively running on test tracks so far.89 While receiving extensive funding by both national and federal sources as well as considerable media coverage, it yet remains to be seen whether the system will indeed turn out to be economically viable and usable in practice.
More examples, e.g. from Rotterdam or Antwerp, could be cited.90 Yet to cut a long story short, the following bullet points will put the automated underground freight systems into perspective:
� The advantages are generally agreed on: First, automated underground systems could handle a large share of freight transport, estimated to reach up to 70% for urban areas. Second, using separate infrastructure both under and over ground maintains the benefits of undisturbed transportation resulting in a considerable time gain even though the actual speed of the system should in most cases not exceed 7 – 10 km per hour91 (only CargoCap is designed to go faster).
� The disadvantages are also universally and much more prominently agreed on: The initial costs for such a system are enormous. In the Netherlands, about 10 years ago the costs of a nationwide network were calculated to reach up to 60 billion Euros.92 As a consequence, the plans were buried in silence, albeit, it seems, not very deep and not for very long.
To put it in a nutshell: “The Underground Logistic System can be regarded a high-tech and very highcosts solution and not regarded feasible for developing countries.“93... and, one might add, only feasible for few developed countries as well.
42

Urban Commercial Transport Background Paper for the Meeting in Sydney, October 2008
Historic concepts made fit for the future: cargo trams
A more feasible and often probed solution for combining public and freight transportation can be found in the concept of the Cargo Tram. Trams or other light rail train systems transporting goods, waste and other freight components are again not a novelty.
CarGo Tram in Dresden
Many European cities maintained tram systems in the 19th and early 20th century. However, these had become unfashionable for passenger transport in the 1950s and 1960s and were consequently dismantled in the majority of western cities. This general development and the subsequent development of road haulage put an end to tram hauled freight as well. The practice only continued on low key in some Eastern European cities as well as in the closed environment of many ports or large industrial estates. The turn of the millennium, however, saw the renaissance of the tram in many cities around the globe. In the wake of tram systems being built or at least thought about in urban areas, the idea of the cargo tram also gains new grounds.
One of the first realised cargo tram concepts can be found in Germany.
In the year 2000 the city of Dresden (Germany, population approx. 478,000) gave birth to the idea of the CarGo Tram. While it appears to be slightly ironic that the tram exclusively transports parts to a car manufacturing plant of Volkswagen, the idea itself is as simple as it proved to be feasibly and practical. A five kilometre light-rail track connects the logistic centre in Friedrichstadt with the new Volkswagen manufacture in the east of the city. Both locations have been built adjacent to existing railroad tracks, so that only a short spur had to be built by VW leading directly into the plant. The CarGoTram’s route goes straight through the inner city, thus using the city’s existing public transport infrastructure. Currently, two distinctively blue coloured trams are in operation, each with a carrying capacity equalling that of three trucks. They are managed by central control and receive inter-section priority. Their scheduled passage is shown on the real-time displays at the stops along the streetcar lines. In case of an obstruction along the CarGo Tram’s route, alternative urban rail routes will be made available. Consequently, the service is reliable and fast, reaching a maximum speed of 50 km per hour, so that it takes only about 15 minutes to get from one location to the other, transporting parts in a just-in-time manner. The CarGo Tram provides an environmentally friendly alternative for freight transport that could replace about 65 lorries a day if it ran at full capacity. It is of little surprise that the purpose built trams cost more than the conventional lorries. In fact, each of the trams cost about Euro 1.75 Mio. However, the cargo tram has a lifespan of about 25 years, which is about three times as much as that of a lorry. 94
Apart from procurement costs, the CarGo Tram in Dresden is considered an inexpensive means of transportation, especially because the tracks had already been laid. While naturally, the system has its limits, it is worth considering its feasibility and benefits in cities that already contain a tram system.
Other European cities have soon followed the example of Dresden. Cargo transporting trams are now in use or in the state of planning in many cities and with regard to a range of purposes.
43

Association of the Major Metropolises Commission4: Urban Mobility Management
In Zurich (Switzerland), trams had been used for the transporting of mail, milk, beer and other convenience goods until 1966. While passenger trams remained an important part of the city’s transport network, they were not used for freight for the next 37 years to come. However, in 2003 a pilot project was set up to re-introduce freight transportation to the tram network. The project was initiated by the city’s transport provider VBZ and the local refuse disposal service (ERZ). In Zurich, items too bulky for the dustcart can be collected at a charge, or left for free at one of the two ERZ yards. Yet 300 tons of bulky waste items are dumped illegally every year. The city had for a long time been searching for a way to provide an attractive yet inexpensive service, which would lead people to legally dispose of their bulky waste. Finally, ERZ approached the transport company about using the existing extensive tram infrastructure to collect bulky refuse in the neighbourhoods, right at resident’s doorsteps so to say. The idea was met with enthusiasm, and Cargotram was born. Thanks to the favourable conditions, it only took a couple of months to introduce the service. Standards waste containers were mounted to fourwheeled flat wagons, which incidentally were former work wagons dating from 1929. The containers were painted in Zurich’s traditional blue and white, but with the colours reversed to clearly distinguish it from passenger trams. Cargotram runs four times a month. Residents can leave bulky items free of charge in the vicinity of the tram tracks and at different pick-up points. The service was extensively used right from the beginning. Thus, the pilot project was turned into a permanent service in November 2003. Subsequently, larger parts of the network and number of new destinations were included in the service. Likewise, in 2005 the first new track was purpose built for the Cargotram in order to connect it to a recycling yard and to simplify operations. As a further addition, the E-tram service was initiated in 2006. E-tram collects unwanted electrical and electronic appliances from the same pick-up points as Cargotram but on different days. Both Cargo-Tram and E-tram serve every point once a month, taking number of total round trips to 18. The service has become very popular with all parties involved.95
Similar results were achieved in Vienna (Austria). There, freight transport was re introduced to the tram system as well in 2005 in form of a pilot scheme. The so-called ‘GüterBim’ commenced service with transporting materials and spare parts, etc. for the local transport provider to and from manufacturers, workshops and depots. Following a comprehensive evaluation in 2006, the pilot was branded a “lighthouse project” and made a permanent feature of the city’s transport system. It now carries out transport not only for municipal bodies, but its services may also be engaged by private companies. Special services further increase the popularity of the ‘Bim’ with private citizens. For example, on a weekend before Christmas costumers were invited to leave their shopping bags and parcels in the tram and either collect it later the same day or get it delivered to their door by a co-operating parcel service on the following Monday. Thereby, the operator also aimed at presenting the innovative telematic system developed for the ‘Bim’ to the public.96
The circle of cities with cargo trams was recently also joined by Amsterdam (The Netherlands). At the end of 2006, the city council approved a pilot project using the goods trams. The idea for the project came from a Dutch entrepreneur, who had recently visited the city of Dresden and learned about their CarGo Tram concept. A four-week trial phase was commissioned in March 2007, in the course of which the provider CityCargo Amsterdam had to fulfil a number of strict criteria. These included no interruptions to personal transport in the city and a commitment to maintaining traffic safety. Throughout the trial-phase the service ran successfully. Thus, in July 2007 the city granted CityCargo a ten year concession to distribute cargo using the current tram infrastructure. A permanent cargo tram service is now scheduled to commence in January 2009. Most prominently, in contrast to Dresden, the tram services various destinations and is supported by electric vehicles for inner-city fine distribution. CityCargo will start off in the first half of 2009 with five cargo trams, 47 E-cars and one distribution centre. Once the project is in full operation it will be 42 cargo trams, 611 E-cars and two distribution centres. The tram receives cargo in large warehouses on the outskirts of the city. Each tram is able to fit in about four truckloads of cargo. The trams depart to locations inside the city, where they are met by smaller electric vehicles that take cargo from the tram to the final destinations. The aim of CityCargo is to finally take out half the number of trucks that come into the city (in Amsterdam it would mean cutting the number of trucks from 5,000 to 2,500 a day). In addition, CityCargo intends to use zero emission electric vehicles (clean), to reduce the number of trucks (safer in the streets), to use the tram infrastructure (fast and efficient).97
44

Urban Commercial Transport Background Paper for the Meeting in Sydney, October 2008
Furthermore, Paris, one of main drivers of the ‘tram renaissance’ in Europe, also considers using the tram for cargo and trash transportation.98
Despite these stories of achieved and expected success, the cargo tram system is not suitable for every city. Like with most transport related measures, the system offers a number of advantages, but it also has its limits (see following table 11), and both sides need to be carefully weighted against each other.
Table 11: Advantages and limits of cargo trams 99
Advantages Limits
�
�
�
�
Existing rail infrastructure may be used to handle freight transportation more sustainably.
Sensitive inner city areas are relieved from road bound freight transport.
By making use of automated traffic guidance systems freight transport flows may be optimally matched with overall traffic flows.
Cargo tram system may generate additional revenues for transport operators.
�
�
�
�
�
Logistic centres and clients need to be located near or connected to the rail tracks, which may make investments necessary.
Points for loading and uploading need additional space.
Regular and suitable cargo quantities are necessary.
Commercial consumers have to be willing to enter into long-lasting contract agreements.
Rail infrastructure is exposed to heavier loads.
Apart from the cited success stories, there are also cases where the cargo tram was deemed to be unsuitable. For example, in Brussels it had been considered to introduce a Cargo Tram Train. The concept of a tram train means that a tram uses railroad infrastructure, thus, integrating two technically separate but somewhat related systems into one. They have been discussed and promoted for a while as a solution for better integration of inner-urban and regional transport. Nevertheless, only few projects have as yet been realised, since such an undertaking is neither easy nor cheap.100 The idea of the Cargo Tram Train in Brussels had been to bring supermarket deliveries from distribution centres with a railroad connection right into the inner city without having to transfer the load from trains to trams. Yet technical and costs problem were the main reasons that the idea of the Cargo Tram Train for Brussels was finally abandoned. Nevertheless, the study that generated these findings also concluded that the results could be different in other cities in Europe, especially in those (few) that have a tram-train system already running.101
This conclusion should be taken seriously and underlines the notion that is advocated throughout this paper, namely that there is no one-fits-all solution, but local contexts and circumstances play an important, if not the most important, role.
2.4.Work in progress. Construction site logistics
Cities worldwide are subject to constant change. Be it renewal, growth, shrinkage, or conversion, changes to the built environment require construction and, thus, the set up of construction sites. Major projects, like the erection of new business districts, of large scale housing areas, or of leisure and shopping complexes consequently lead to the temporal appearance of major construction site. However, the term temporal might be misleading. Large projects often require a long time for construction that might easily stretch over a couple of years. In the course of construction, major transport streams are generated. Excavated materials or demolished structures need to be transported away from the site while construction materials need to be brought there. This is very often a matter of just-in-time deliveries, since space for storage is usually not available. Thus, construction site logistics has already become a major issue, especially, but not exclusively, in rapidly growing metropolises.
In fact, the following examples are all from cities that are not characterised by rapid growth. Instead, they represent cases , in which major constructions took place within the existing built environment.
45

Association of the Major Metropolises Commission4: Urban Mobility Management
From 1994 to 1998, Potsdamer Platz in Berlin constituted Europe’s largest building site. Before even the first bucket of soil was excavated, calculations had shown that about 18 Mio. tons of excavations and waste materials were going to be produced. Likewise, it was envisaged that about 8 Mio. Tons of concrete would be needed. Additionally, steel and other building materials as well as a range of bulk goods would be needed for construction. All of this would have to be transported right through the city. The investors feared that construction works might have been delayed by congestion. Additionally, it was thought that the daily fleet of trucks would generate extensive air and noise emissions, which could lead to protests and conflicts with nearby residents and the general population. 102
Because of that, the different private and public investors decided to jointly tackle the complex logistic problems of the different construction areas that together formed the entire site. Therefore, the investors together with the federal state of Berlin joined into a public-private-partnership, resulting in the launch of a designated company in 1993, which was termed baulog (Baustellenlogistik Potsdamer Platz GmbH). The baulog was endowed with great authority. It centrally organised and co-ordinated all transports to and from the site. The individual building companies had to fulfil all the regulations and comply with the overall logistic plan enforced by baulog, especially as regards their material deliveries. The main elements of the logistic plan were the following: - The sites of two former freight depots in the vicinity of the area were used for establishing a logistic
centre (‘inlog’). The centre was connected to the construction site by a purpose built, internal road of 2.5 km length, including a bridge over the adjacent channel.
- All supplies had to be brought in by train or by barge; transports by truck were only permitted in selected cases. Deliveries by truck that were carried out without permission were seized with a minimum fee of 5,000 Euro.
- The building materials that arrived at the logistic centre were transhipped to lorries that forwarded them to their final destination.
- Outside the city, a number of transhipment areas (‘exlog’) were set up. They served as storage areas for materials as space in the inlog was limited. Furthermore, here shipments with destination Potsdamer Platz had to be transferred onto the rails at the latest.
- Designated control systems for different substances and materials were established, so that the individual flows could be effectively monitored and steered. Control and management systems were established for excavated materials, for concrete, for unit loads, waste, and for ground water.
Even though the project was initiated foremost for economic reasons, the benefits for the urban environment were nevertheless noticeable. Instead of the expected 42,000 truck km daily, only 1,300 truck km were accounted for in the urban area. About 80 to 90 per cent of the entire transport volume was handled by rail. Thereby, NOx emissions were reduced from potential 200 t p.a. to 60 t p.a. From an economic point of view, the logistic costs increased as a result of transhipment requirements and increased rental costs in the logistic areas as well as because of staff costs for management and dispatching. However, due to the fact that deliveries generally were on time, that no re-scheduling and no major delays took place, and because of the enormous reduction of external costs the undertaking was rated successfully by all involved. 103
The case of Berlin’s construction site logistic is an interesting example. It illustrates the possibilities that exist when actors join together. The circumstances, under which this project came into being, were somewhat special. The mid-1990s were a special time in Germany, and especially in Berlin, following the recent re-unification of the nation. The economic climate was open for co-operations and innovation. Investors and logistic companies felt induced to distinguish themselves with major, spectacular ventures in the new capital. The awareness of potential problems was likewise high. The existing rail and inland waterway connections made the implementation of the logistic problem possible.
Picture to the right: Construction site at the Potsdamer Platz
46

Urban Commercial Transport Background Paper for the Meeting in Sydney, October 2008
The Berlin approach to organising deliveries from and to the construction site of Potsdamer Platz brought together spatial, access, consolidation and management strategies. It was rated as having been a great success. However, as outlined above, the circumstances were somewhat exceptional regarding the spatial setting as well as the timing of the developments. Nevertheless, with regard to upcoming major construction projects, sophistic logistic concepts will be needed as well. One such project will be the so-called Humboldt-Hafen, an area near the new central station which is to be developed into a mixed and lively inner city urban quarter.
A major new urban quarter is currently also under construction in Stockholm (Sweden). Thereby, the concept of a logistic centre is being put to use, which contains some very interesting facets.
Hammarby Sjöstad is one of the largest constructions sites in a former harbour area in Stockholm. 8,000 apartments are being constructed until 2015. Thereby, 22 individual construction sites are being worked on. The access possibilities for deliveries are restricted, due to both geographical reasons and existing buildings. As a result, access roads are quite narrow, which causes obstructions to delivery trucks. Moreover, the city of Stockholm requires and environmentally sustainable solution for construction traffic, aiming at less congestion and less disturbance to the surrounding areas and the people that live there. Based on a master thesis written at the Technical University Lund, a logistic centre (LC) has been set up at the entrance of the are. It works as follows: The LC receives all small deliveries (less than four pallets) and stores the materials temporarily in save and weather-proof conditions. The building contractors are allocated designated spots in the area for the storage of their materials. The first four days of storage were for free; after that contractors were charged for using the storage facilities. Deliveries into the immediate construction areas are made using special vehicles on a just-in-time basis. For those deliveries that did not pass through the LC, an internet based calendar was created. Contractors that needed to use the same access road in order to get materials delivered to their site had access to the calendar. Incoming trucks were, thus, visualised. In that way it is possible to overview the total amount of incoming trucks and prevent traffic jams. In the LC a traffic coordinator was hired to follow up all registrations. If the roads get stacked, it is possible to send SMS to variable signs and mobile phones. The aim with this service was to avoid serious traffic jam inside the area. The Logistic centre in Hammarby Sjöstad was successfully implemented. The number of small direct deliveries was decreased by 80 %, thus taking pressure off the restricted access infrastructure. The LC has been a well working integrated part of the supply chain. On one side it was possible to save energy and emission. On the other side, the users are very satisfied with access and transport conditions. There has also been considerable reduction in thefts, losses and damaged materials. The centre had been set up to operate over a three year period when construction works were expected to reach a peak. It went into operation in 2001 and had its peak in 2002. During 2003 and 2004 the intensity of the construction work decreased. In parallel to that, the initial LC was dismantled and moved into a building nearby to make room for new buildings. However, building companies themselves are keen on keeping the service in operation for the next building phase. It is then envisaged to work on a cost-effective basis. Initially, about 95% of the LC budget was funded by the City of Stockholm. After a while, when different services became more familiar to the clients (contractors) and they understood that they could save money using the LC’s different services it was possible to increase the prices. Thus, by the end of the first project phase it was almost at breakeven for cost/income. The city contribution was then about 40% of the budget. In a continuation of the project, the city contribution is estimated to be 0%.
The Stockholm case study showed again the need and the success of bringing together different approaches in order to solve complex logistics issues. In addition to the components implemented in Berlin, it also had the technology supported virtual calendar for deliveries set up. It worked on an interactive base and made it possible to adjust traffic streams when necessary.
Construction site logistics are very much in the interest of each constructor, the contracted building companies as well as the logistics companies and the individual truck drivers. Their rationale is to have
47

Association of the Major Metropolises Commission4: Urban Mobility Management
deliveries on time, without obstruction, and at minimal costs. However, when the logistics are left to them, a co-ordinated approach that also takes into account environmental and other issues may not always be expected. Thus, particularly in built-up areas where space is scarce and where people already live and suffer from noise, dust and air pollution which inevitable arise in the wake of construction works, city authorise might find themselves in the need to act. The two presented approaches show how this may be done to the satisfaction of all parties involved, and in a costeffective manner.
2.5.Mutual dependence, common interests? Ports and their hinterland
The introduction chapter of this paper already identified globalisation as one of the drivers for increase in freight and commercial transport. There, it was also said that, in fact, globalisation is not a new phenomenon. Traces for trade over long distances can be found dating back as early as the 3rd
century BC. Yet until the 19th and even the 20th century, before the phase of industrialisation brought innovation also to the transport and trade sector, land-bound trade was an arduous undertaking. For example, the famous and somewhat luxuriously sounding Silk Road, connecting China to continental Europe, was anything but luxurious to travel. A trip from the Mediterranean to China and back could take as long as six years. Weather and geographical conditions were demanding for those brave enough undertaking the trip, and the risk of getting robbed and even killed was ever present and high. Thus, traders and transporters tended to favour water trips along rivers and across oceans. Waterways appeared to be more suited to goods transport by nature. A river would deliver the entire infrastructure needed for a trouble-free trip: load bearing capacity of the wet element is nearly unlimited; river beds have been provided for free by ‘mother nature’, and currents and wind were ‘natural engines’ providing propulsion for boats and ships.104
The downside, of course, also came quite naturally. Storms, calms, diseases and man-made dangers like pirates made river and sea navigation a risky undertaking – but, all things considered, also a successful one.
Container terminal in the Port of Hamburg
Ports have for a long time been catalysts of development. They have always provided employment for stevedores, merchants, traders and their middlemen, for the hotel business, for innkeepers and their staff, for entertainers, for farmers who sell their food products, for entrepreneurs, clerks and officials, day labourers, etc. Thus, they soon became economic centres of regions and nations, they turned into agglomerations and into properly built cities, which were often fortified, since trading power was economic power, which also was political power. Likewise, they played an important role for transferring and transmitting (as well as creating) information. Yet their role, their importance as well as their overall appearance has changed tremendously over the years.
First, the rise of telecommunication – from telegraphy to the telephone and from there to globalised data streams transmitted partly wireless by satellite or internet – diminished their function as hubs for information transfer.
Second, changing character of goods, ever-increasing size and loading capacities of sea faring vessels as well as the alteration of routes and the tightly woven net of international trade routes all provide for new port requirements regarding infrastructure, timing and positioning.
48

Urban Commercial Transport Background Paper for the Meeting in Sydney, October 2008
The importance of ports from both a national and international perspective is now greater than ever. Yet this development also creates a number of difficulties for the ports themselves as well as for their surrounding cities and hinterlands. This holds particularly true in settings were, due to the mutual dependency of former times, cities and ports have grown too closely together.
From 1985 to 2000, the growth of general cargo was about 3.8% annually, which is modest compared to the growth in container transport that has reached an average growth rate of 10% per year. The pace of growth is expected to continue on a rate of about 7.5% until 2015. Apart from general economic growth and globalisation, the tremendous increase in container shipping is to a large extent due to the rise of the Chinese economy.105
As a result, port congestion has become a problem in many European, US-American and partly also Asian port cities. Thereby, congestion appears on both sides of the port: land and water, causing problems for everyone involved:
“Deepsea carriers may be charged additionally for missing berthing slots in subsequent ports and confronted with higher fuel costs to make up or readjust schedules. Container stevedores have difficulties to carry out their plans because of delayed arrival of deepsea vessels and hinterland operators are affected too because intermodal transfers are also delayed, i.e. containers miss their feeder, train or barge connection. “106
While increasing container transhipment has lead to this development, it is not the only root of the problem:
“However, it is widely believed that a lack of investment, planning and outdated practices in terminals have significant contribution to the problem. … For many seaports space limitations and environmental regulation, because they are located in the vicinity of metropolitan areas, are likely to restrict future expansion. … Increasing container throughput in the ports also leads to increasing transport volumes in their hinterland and this has also brought the issue of capacity and quality of the hinterland transport system to the fore. Containerisation has increased the geographical market coverage of seaports substantially and as a result the hinterlands of seaports have transformed from captive regions to contestable regions.”107
Inner-city ports, therefore, often create congestion, pollution, noise and safety problems. Likewise, inner city areas lack the space to accommodate further port growth. As many ports need to expand, they often move out from the central position in a city to peripheral locations. This is also not an entirely unproblematic solution. Environmental and recreational interests oppose many port relocation and expansion plans. In addition, the former inner city areas now devoid of use rip holes into the urban fabric. Redevelopment of former port and waterfront areas is, therefore, a common issue in many cities, e.g. in Hamburg, Dublin, Liverpool, Glasgow, Baltimore, etc. Not in all of these cases expansion and relocation of ports has been the reason for the termination of port use. Sometimes overall economic developments have caused port business to retreat, for example the collapse of coal and steel producing industries leading to a breakdown in demand for shipped raw materials. Also, the shift from an industrial to a service society leads to shifting demands for goods and products that are often cheaper and better transported by other modes, such as road-bound trucks, trains or even planes.
Coming back to the subject of thriving ports, however, the hinterland problem, which often is a problem for the metropolis since hinterlands tend to be urban rather than rural, is one that requires a lot of thought and activity in order to be solved.
49

Association of the Major Metropolises Commission4: Urban Mobility Management
Intermodal hinterland transport by barge
A number of possible actions have already been described in previous chapters. For example, routing systems for heavy duty vehicles may be organised and managed in such a way that they specifically address port connections. Also, providing rail and inland waterway connections to the ports may reduce some of the hinterland transport burdens. Albeit, the viability and feasibility of intermodal infrastructure strongly depends on the kind of goods transported and the position of the port in the global cargo network:
“The development of intermodal hinterland transport (rail and barge), enabling large-scale transport services, is gaining importance to keep the port accessibly by shifting cargo away from the congested roads to the railways and waterways. In Europe, US and Asia, intermodal transport gains political importance. In many seaports… the environmental and social impacts of road transport are subject to strong debate about the future role of road transport. On the other hand, many ports are also faced with different restrictions in railway capacity in the hinterland and expanding capacity is an expensive and often long-term process. Barge transport can be an attractive alternative, for some major seaports in Europe (Rotterdam, Antwerp) and US (New York, New Jersey) but most seaports are not connected to a well-developed waterway network.”108
A city that holds a multi-modal infrastructure network is Rotterdam. This greatly benefits the port. However, hinterland congestion is a serious problem, especially as regards road transportation. The following provides an interesting case study for spatial reorganisation in order to solve these problems. Nevertheless, it is, as yet, merely a study, meaning it is in research and conceptualising stage aimed at providing a long-term solution.
The port of Rotterdam is the largest port in Europe and the world’s seventh-largest container port. What is more, from 1962 until 2002 it was the world's busiest port, now overtaken by Asian ports like Singapore and Shanghai. The port started out from the city’s historic harbour area in the centre and from there continued to expand westwards towards the North Sea. The latest addition to the port is the Maasvlakte, a port that reaches out into the North Sea. Furthermore, following a long period of planning and quarrels about environmental issues, constructions have now started for yet another port addition (Maasvlakte 2) reaching even further into the North Sea.109 (see figure 5 below). Regarding the situation in the hinterland, container road traffic plays a dominant role. Up to 60% of containers are transported by road, while barge and rail have a share of 31% and 9% respectively (numbers relate to the year 2005). Many of the containers, which are transported by road, have their origin or their destination in the region. In addition, national and international traffic also play a significant role. The only hinterland route by road is provided by the A15 highway, connecting the port of Rotterdam with the hinterland in eastern direction. Even though the capacity of the highway had been extended, it did not keep up with persistent traffic growth. Thus, the highway is increasingly faced with congestion problems, both inside and outside the port area. 110
Rail transport has for long played a modest role in container hinterland traffic, also due to the fact that transporting capacities were limited. Mixed use of rail tracks for passenger and freight trains, with the former being prioritised, proved to be insufficient. Thus, in 2007 a new dedicated rail line, the Betuweline, was opened, connecting the Europoort to the German border and from there to the rest of Europe. The rail line has been under a lot of criticism due to environmental problems as well as high investment and maintenance costs. This led to doubts about whether costs could be recuperated, especially since
50

Urban Commercial Transport Background Paper for the Meeting in Sydney, October 2008
investments on the German side did not keep up. So far, the line, which could accommodate up to 150 trains a day, is still underused.111
In contrast, barge transport has considerably increased importance as a hinterland transport mode. Services are cheap and reliable, and they are of particular interest for long-distance container transport. 40 per cent of the total volume shipped (2 million TEU in 2005) are transported to or from Germany, covering distances of 200 up to 900 km. 30 per cent is container barge traffic between Rotterdam and Antwerp (distances between 125 to 180 km). The remaining 30 per cent of the container volume is national traffic, which is dispersed in flows and distances ranging from 50 to 250 km. All of the transport modes may be characterised by advantages and disadvantages. Road transport is very flexible, but its reliability is challenged by increasing congestion. Rail transport has unused capacities, but already now bottlenecks appear due to long waiting times at terminals, where trains of different operators have to be assembled depending on the final destination of the cargo. Barge vessels are as fast as the trains, yet they loose in time and efficiency since vessel handling at the sea port terminals is time-consuming and complicated. Regarding the expected and wanted growth of the port, the future strains on the transport system will be enormous. Therefore, solutions are being sought to reduce the transport burdens in the hinterland. These include infrastructure as well as organisational concepts. One of the ideas is to develop port-entry points further inlands, were traffic aiming at entering the port is handled. The port-entry point should act as a regional collection and distribution point, and it should be equipped with rapid connections to the actual port. By shifting the port entry, other port functions may be shifted as well, such as spaceintensive container storage, stripping and warehousing or costumes clearance. These satellite ports could take pressure off the actual port location and its surroundings. Nevertheless, the decisive element is the rapid and unhindered connection of the port entry and the port itself. Yet the issue of how to create such a connection, which more or less resembles an internal route, yet without being sealed off from public areas, is still unsolved. A number of new transport concepts, such as automated trucks, multi-trailer systems, automated trains and/or barge handling systems and automated capsule/alternative rail systems are being investigated. Main assets of all of these systems are, first, the provision of a dedicated lane as a precondition for flexible and full continuous services, and second, transport automation to reduce labour costs. Potential and not easy to overcome barriers exist as regards the reaction of shipping companies owning terminals in the port, which might not want to shift location. Also, shipping companies strive at keeping all cargo handling processes in their own hands. Also, the existing modes have not yet reached their limits. Thus, an important driver for change is lacking. In fact it must be concluded that the inland portentry and the application of new technologies appear to be more of a long-term solution.112
Figure 5: Development of the port of Rotterdam113
51

Association of the Major Metropolises Commission4: Urban Mobility Management
The issue of port-hinterland relations is, in fact, a matter of high complexity. The ports and the surrounding areas depend on each other, yet each one might also put a barrier to the development and quality of its counterpart. Solutions are, likewise, multifaceted. New infrastructure, re-organisation, re-location, timing, ICT use, etc. are solutions to cope with growing port turnovers and the resulting increase in hinterland traffic.
Cities of the developed world, however, might have to face completely different problems. There, experience in dealing with large and sophisticated freight transport is limited. Present land- use patterns and urban growth may not be sufficient to accommodate intermodal freight. However, being connected to the world-wide trade system by waterways remains a prime prerequisite for economic development. The lack of connectivity to global transport networks – direct or via transhipment ports – remains an important barrier to trade in many developing countries. In fact, African countries are among the worst connected to international shipping transport networks, while a lot of Asian countries have managed to improve their ports and connections. Likewise, while the international freight costs (as a percentage of the import value) have steadily declined in all countries (in Asia from 9 per cent in 1990 to just below 6 per cent in 2005), they have increased in Africa from 9.4 to 10 per cent. This commands a serious threat to development opportunities.114
Thus, the key issues for developing countries concerning port logistics and connections are:
� Port infrastructure cannot be built overnight and may take a lifetime to repay. Thus, ports need careful planning, and as transport nodes they must be connected to national, regional and international transport networks. In addition, ports must be connected to centres of manufacturing, either inland or adjacent to the port.
� Poor connectivity to international transport networks leads to low trade volumes; low trade volumes lead to poor transport connections.
� Governments facing competing demands for public funds may not see that port investment meets the immediate needs of the population, as do housing and job creation.
� Ports have become an integral part of the logistics chain. As such, they increasingly have to provide value added services that go beyond the traditional cargo-handling functions. This has both economic and social implications, as ports historically tended to absorb excess capacity in lowskilled labour. The challenge is how to move these jobs out of the port into manufacturing goods for exports.
� Other challenges relate to upgrading infrastructure to provide longer berth lengths, wider ship turning circles and deeper access channels alongside berths for modern ships. In addition, managing the ports’ superstructure has also becoming more sophisticated and demanding.115
3. Wrapping things up
… is not what we are going to do in this chapter. Considering the wealth of information presented here, the complexity of the matter, and the variety of approaches to be used in different context, any attempt to summarise the previous chapters appears to be a vain undertaking. Likewise, it would defy the purpose of the paper, which was to stimulate ideas rather than to provide ready-made solutions. The authors are well aware that they did not succeed in addressing all of the possible subjects and that they did not do justice to all of the promising approaches. Again, finding information on commercial and freight transport in cities is much more difficult than on any other topics. This holds particularly true for cities outside the Western world.
Therefore, it will be interesting to find out more about individual city’s approaches during the Commission’s meeting in Sydney on 22nd October 2007. Rather than addressing the problems and challenges resulting from urban commercial transport, the main focus of the meeting should be on solution approaches, projects and schemes and what could be done to implement them successfully.
In doing so, Commission 4 will, once again, prove its dedication to tackle also difficult problems, even though this might mean that not only success stories may be told. However, it appears that this is exactly what members appreciate, and it is also in line with the spirit of Metropolis.
52

Urban Commercial Transport Background Paper for the Meeting in Sydney, October 2008
53

Association of the Major Metropolises Commission4: Urban Mobility Management
Annex 1: List of Abbreviations
BESTUFS Best Urban Freight Solutions C4 Commission 4, Metropolis Network CIVITAS Cities – Vitality – Sustainability (Initative of the EU) CO2 carbon dioxide CBG compressed biogas CNG compressed natural gas etc. etcetera EU European Union FAO Food and Agricultural Organisation of the United Nations H2 hydrogen HC hydrocarbon HDV heavy duty vehicle ICT Information and Communication Technologies ibid. ibidem: in the same place kg kilograms km kilometre km*t kilometre-tons LC Logistic Centre l.c. loco citato: at the place cited LNG liquefied natural gas LPG liquefied petroleum gas LU loading and uploading mg milligram NMT non-motorised transportation NMV non-motorised vehicles p.a. per annum PM particulate matters ppm parts per million publ. publisher N2O nitrous oxide NOx nitrogen oxide s.a. sine anno: without date s.l. sine loco: without location t tons TEU Twenty Foot Equivalent Unit UDC Urban Distribution Centre
54
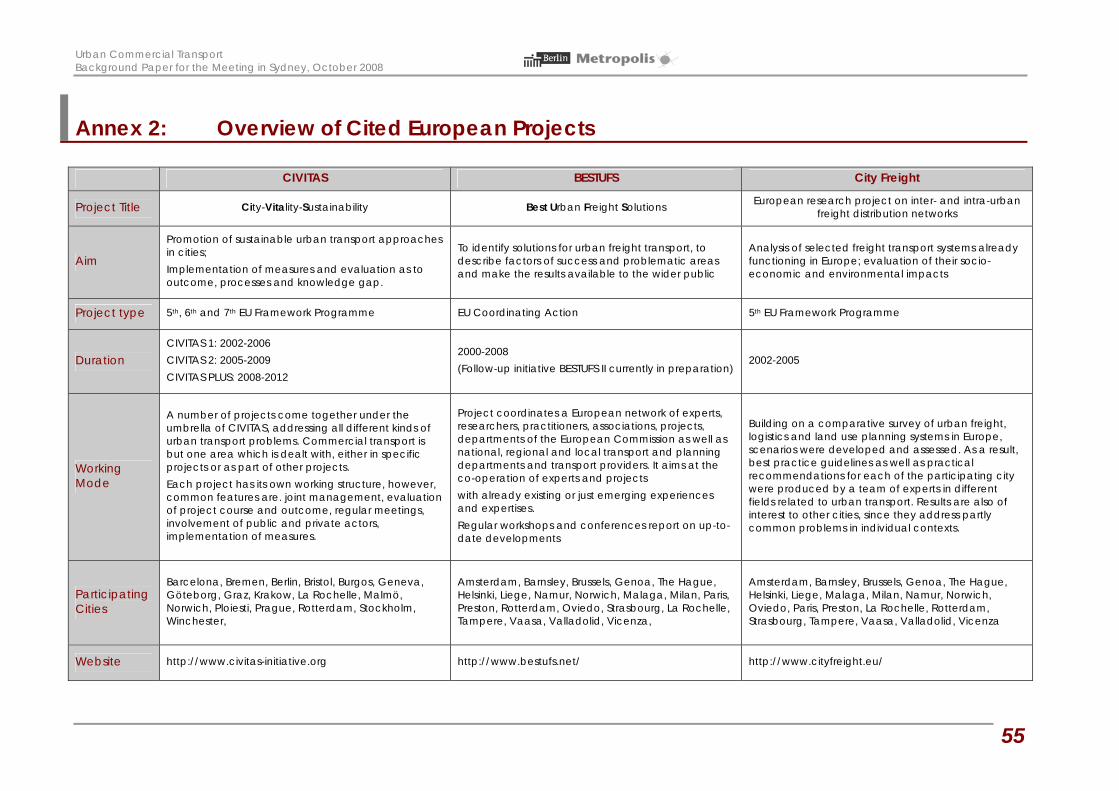
Urban Commercial Transport Background Paper for the Meeting in Sydney, October 2008
Annex 2: Overview of Cited European Projects
CIVITAS BESTUFS City Freight
Project Title City-Vitality-Sustainability Best Urban Freight Solutions European research project on inter- and intra-urban freight distribution networks
Aim
Promotion of sustainable urban transport approaches in cities; Implementation of measures and evaluation as to outcome, processes and knowledge gap.
To identify solutions for urban freight transport, to describe factors of success and problematic areas and make the results available to the wider public
Analysis of selected freight transport systems already functioning in Europe; evaluation of their socioeconomic and environmental impacts
Project type 5th, 6th and 7th EU Framework Programme EU Coordinating Action 5th EU Framework Programme
Duration CIVITAS 1: 2002-2006 CIVITAS 2: 2005-2009 CIVITAS PLUS: 2008-2012
2000-2008 (Follow-up initiative BESTUFS II currently in preparation)
2002-2005
Working Mode
A number of projects come together under the umbrella of CIVITAS, addressing all different kinds of urban transport problems. Commercial transport is but one area which is dealt with, either in specific projects or as part of other projects. Each project has its own working structure, however, common features are. joint management, evaluation of project course and outcome, regular meetings, involvement of public and private actors, implementation of measures.
Project coordinates a European network of experts, researchers, practitioners, associations, projects, departments of the European Commission as well as national, regional and local transport and planning departments and transport providers. It aims at the co-operation of experts and projects with already existing or just emerging experiences and expertises. Regular workshops and conferences report on up-todate developments
Building on a comparative survey of urban freight, logistics and land use planning systems in Europe, scenarios were developed and assessed. As a result, best practice guidelines as well as practical recommendations for each of the participating city were produced by a team of experts in different fields related to urban transport. Results are also of interest to other cities, since they address partly common problems in individual contexts.
Participating Cities
Barcelona, Bremen, Berlin, Bristol, Burgos, Geneva, Göteborg, Graz, Krakow, La Rochelle, Malmö, Norwich, Ploiesti, Prague, Rotterdam, Stockholm, Winchester,
Amsterdam, Barnsley, Brussels, Genoa, The Hague, Helsinki, Liege, Namur, Norwich, Malaga, Milan, Paris, Preston, Rotterdam, Oviedo, Strasbourg, La Rochelle, Tampere, Vaasa, Valladolid, Vicenza,
Amsterdam, Barnsley, Brussels, Genoa, The Hague, Helsinki, Liege, Malaga, Milan, Namur, Norwich, Oviedo, Paris, Preston, La Rochelle, Rotterdam, Strasbourg, Tampere, Vaasa, Valladolid, Vicenza
Website http://www.civitas initiative.org http://www.bestufs.net/ http://www.cityfreight.eu/
55

Association of the Major Metropolises Commission4: Urban Mobility Management
Annex 3: Picture credits
Cover page:
Kuala Lumpur (Roland Haas, GTZ Transport Photo DVD, November 2006)
Page 4:
Global trade by a modern containership (© Bernd Sterzl / PIXELIO)
Page 6:
Freight transport by road is a serious problem for many cities (BESTUFS Good Practice Guide on Urban Freight Transport, 2007)
Page 14:
Urban distribution centre in Bristol (BESTUFS Good Practice Guide on Urban Freight Transport, 2007)
Page 17:
MAN TGL, modern truck with low emissions (http://commons.wikimedia.org, Author: MAN photo, GNU Free Documentation License)
Page 25:
Loading restrictions based on time (BESTUFS Good Practice Guide on Urban Freight Transport, 2007)
Page 31:
DHL Packstation, a safe deposit box complex used in German cities (http://commons.wikimedia.org, Author: Klaus Mueller, This file is licensed under the Creative Commons Attribution ShareAlike 2.5 License)
Page 34:
Loaded freight xiclo in Hoh-Chi Min City (Gerhard Menckhof, GTZ Transport Photo DVD, November 2006)
Page 38:
Bicycle courier in London (http://commons.wikimedia.org, Author: Caspar Huges, GNU Free Documentation License)
Page 40:
New Amsterdam Project bike freight driver Wenzday Jane (http://www.npr.org/templates/story/story.php?storyId=91731834, 16.07.2008)
Page 42:
CargoCap, automated underground freight transport (http://www.cargocap.de, Graphik: visaplan GmbH)
Page 43:
CarGo Tram in Dresden (http://commons.wikimedia.org, Author: Marco Präg, GNU Free Documentation License)
Page 46:
Construction site at the Potsdamer Platz (http://commons.wikimedia.org, GNU Free Documentation License)
Page 48:
Container terminal in the Port of Hamburg (© Friedrich Frühling / PIXELIO)
Page 50:
Intermodal hinterland transport by barge (© ich / PIXELIO)
56

Urban Commercial Transport Background Paper for the Meeting in Sydney, October 2008
Annex 4: Endnotes (References)
1 Metropolis Commission 4 (publ.): Declaration on Sustainable Urban Mobility Management. Joint declaration of the C4 member cities, adopted at the 8th Congress of the World Association of the Major Metropolises in Berlin 11-15 May 2005. Available online: www.metropolis.org
2 Köhler, Uwe; Kirchoff, Peter; Stolz. Martin (2001): Verkehrssystemanalyse. (Transport System Analysis) In Mehlhorn, Gerhard, Köhler, Uwe (publ.): Verkehr. Straße, Schiene, Luft. Kassel: 218-268. [Figure found in p. 221. Own translation]
3 Steinmeyer, Imke (2007): Personenwirtschaftsverkehr (Passenger commercial transport). In Nobis, Claudia; Lenz, Barbara: Wirtschaftsverkehr: Alles in Bewegung? (Commercial Transport. Everything in motion?) Studien zur Mobilitäts- und Verkehrsforschung Band 14. Mannheim: 115-125.
4 STRATEC S.A (project coordinator) (2002): CITY FREIGHT Inter- and Intra-City Freight Distribution Networks. Deliverable 6: Best Practice Guidelines. Brussels: 13.
5 STRATEC S.A (project coordinator) (2005): CITY FREIGHT Inter- and Intra-City Freight Distribution Networks. Final Report. Brussels: 30.
6 www.globalisation.org. 7 Economic Policy Group and Development Economics Group PREM, World Bank Group (s.a.): Assessing
Globalization. World Bank Briefing Papers. Part 1: What is Globalization? Available online: http://www1.worldbank.org/economicpolicy/globalization/documents/AssessingGlobalizationP1.pdf
8 www.globalisation.org. 9 WBCSD World Business Council for Sustainable Development (2001): Mobility 2001 – World mobility at
the end of the twentieth century and its sustainability. Conches – Geneva. 10 Henckel, Diedrich; Pahl-Weber, Elke; Herkommer, Benjamin (publ.) (2006): Time – Space – Places.
Frankfurt. 11 Becker, Hans-Joachim; Runge, Diana (2005): Safeguarding Mobility – Transforming Transportation.
Report produced on behalf of Metropolis Commission 4 “Urban Mobility Management” (publ.) Barcelona, Berlin.
12 ibid. 13 Becker, Hans-Joachim; Runge, Diana (2005). l.c. 14 STRATEC S.A. (2002): l.c. 15 Nobis, Claudia; Lenz, Barbara (2007): Wirtschaftsverkehr: Alles in Bewegung? (Commercial Transport.
Everything in motion?) Studien zur Mobilitäts- und Verkehrsforschung Band 14. Mannheim. 16 Nobis, Claudia; Lenz, Barbara (2007): l.c. 17 Böge, Stefanie (1993): Registration and evaluation of transportation by means of product-related
transportation analysis. Wuppertal. [available online: www.stefanie-boege.de/texte/yogurtengl.pdf. 19.05.2008]
18 Kerkhoff, Christof (2004): Standortverflechtungen und Verkehrsaufkommen bei der Herstellung und Vertrieb eines Personalcomputers. (Interlacing of locations and transport volumes for the production and distribution of a personal computer). Diplomarbeit an der Fakultät Raumplanung der Universität Dortmund. Gutachter: Holz-Rau, Christian; Clausen, Uwe. Dortmund.
19 Böge, Stefanie (1994): l.c. 20 STRATEC S.A. (2002): l.c. 21 WBCSD (2001): l.c. 22 STRATEC S.A. (2002): l.c. 23 STRATEC S.A. (2002): l.c. 24 STRATEC S.A. (2002): l.c.: 13.
57

Association of the Major Metropolises Commission4: Urban Mobility Management
25 Becker, Hans-Joachim; Runge, Diana; Schwedler, Urte, Abraham, Michael (2008): Commercial Transport in European Cities. IVP Schriftenreihe Band 21. Berlin. [in print] [available online: http://www.verkehrsplanung.tu-berlin.de/html/schriften/ivp_schriften/index.html]
26 Becker et al. (2008): l.c. 27 BESTUFS project partners (publ.) (2008): Praxisleitfaden für den städtischen Güterverkehr (Practial
guide for urban freight transportation) J. Allen, G. Thorne, M. Brown. University Westminster. 28 STRATEC S.A. (2002): l.c.: 21. 29 STRATEC S.A. (2002): l.c.: 22. 30 STRATEC S.A. (2002): l.c. 31 OECD (2003): Delivering the Goods 21st Century Challenges to Urban Goods Transport. Paris. 32 EurActiv network (publ.) (2004): Euro 5 emissions standards for cars. s.l. [available online:
http://www.euractiv.com/en/transport/euro-5-emissions-standards-cars/article-133325. 09.06.08] 33 GTZ (2005): Sustainable Urban Transport, Sourcebook Modul 4b. Eschborn. 34 Umweltundesamt (UBA) (s.a.): Alternative Kraftstoffe und Fahrzeugantriebe. (German Federal
Environment Agency: Alternativ Fuels and Vehcile Propulsion.) [available online: http://www.umweltdaten.de/verkehr/ downloads/aerltant.pdf. 05.06.208]
35 Kracker, Elisabeth; Becker, Hans-Joachim; Runge, Diana; Karl, Astrid; Zimmer, Wiebke; Schmied, Martin; Schönberg, Martin (2005): TELLUS Final Evaluation Report. Berlin.
36 Becker, Hans-Joachim; Runge, Diana; Schwedler, Urte, Abraham, Michael (2008): l.c. 37 BESTUFS project partners (publ.) (2008): l.c. 38 Axelsson, Johan; Jensen, Carl et al. (2005): TELLUS Final Evaluation Report Göteborg.
Göteborg/Berlin/Brussels: 39 Axelsson, Johan; Jensen, Carl et al. (2005) l.c. 40 Runge, Diana on behalf of Senatsverwaltung für Stadtentwicklung Berlin (publ.) (2006): The TELLUS
Times. Berlin / Bucharest. 41 BESTUFS project partners (publ.) (2008): l.c. 42 ibid. 43 Ingenieurgruppe IVV-Aachen (1999): Stadtverträglicher Güterverkehr. Ermittlung von
Maßnahmewirkungen zur umweltfreundlicheren Führung des Güterverkehrs in städtischen Straßennetzen. (Urban area compatible freight transportation. Identification of measure results regarding environmentally friendly routing of freight transportation in urban road networks) Forschungsbericht (19 G 95 13 0) – Kurzfassung. Erstellt im Rahmen der COST-Aktion 321 der Europäischen Union. Aachen. [available online: http://www.ivvaachen.de/cost/Cosber_kurzf.htm#Links%20und%20Verweise. 01.07.08]
44 Ingenieurgruppe IVV-Aachen (1999): l.c. 45 Transport for London (publ.) (2007): Central London Congestion Charging. Impacts monitoring – Fifth
Annual Report. London [available online: http://www.tfl.gov.uk/assets/downloads/fifth-annualimpacts-monitoring-report-2007-07-07.pdf. 01.07.2008]
46 BESTUFS project partners (publ.) (2008): l.c. 47 ibid. 48 Becker, Hans-Joachim; Runge, Diana; Schwedler, Urte; Abraham, Michael (2008): l.c. 49 BESTUFS project partners (publ.) (2001): l.c. 50 Rodrigue, Jean-Paul; Hesse, Markus (2006): Logistics and Freight Distribution. In: Rodrigue, Jean-Paul et
al. The Geography of Transport Systems, Hofstra University, Department of Economics & Geography, http://people.hofstra.edu/geotrans. The Geography of Transport Systems. New York.
51 BESTUFS project partners (publ.) (2008): l.c. 52 Daduna, Joachim R.; Lenz, Barbara (2004a): Online Shopping and Changings in Mobility. Berlin.
58

Urban Commercial Transport Background Paper for the Meeting in Sydney, October 2008
53 Daduna, Joachim R.; Lenz, Barbara (2004b): The Last Mile – Old Problem, New Options? Presentation given at the COST Action 355 Namur Meeting, 1-3 December 20004. [Available online http://cost355.inrets.fr/IMG/ppt/WG1_Namur_Lenz.ppt. 21.07.2008]
54 BESTUFS project partners (publ.) (2008): l.c. 55 ibid. 56 ibid. 57 ARCADIS Bouw/Infra; Urban Planning and Housing Department of the Municipality of Rotterdam
(2000): Urban Transport Strategy Review: The development of logistic services. Commissioned by The World Bank Group. Rotterdam, Washington.
58 Government of Bangladesh; United Nations Development Program (publ.) (1994): Greater Dhaka Metropolitan Area Integrated Transport Study - Working Paper 25: Commercial goods movement. cited in: ARCADIS Bouw/Infra et.al. (2000): l.c.
59 Wilhelm, Laurence (1997): Transport and Inter-Market Supplies in African Cities. Communication delivered to the Sub-regional FAO-ISRA Seminar "Food supply and distribution in francophone African Towns". Dakar, 14-17 April 1997.
60 ARCADIS Bouw/Infra et.al. (2000): l.c.: 56. 61 Wilhelm, Laurence (1997): l.c. 62 Wilhelm, Laurence (1997): l.c.: 16. 63 Wilhelm, Laurence (1997): l.c.: 9. 64 Replogle, Michael (1992): Non-Motorized Vehicles in Asia: Lessons for Sustainable Transport Planning
and Policy. Washington D.C. 65 Tiwari, Geetam (1999): Towards a Sustainable Urban Transport System: Planning for non-motorised
vehicles in cities. In: United Nations (publ.): Urban Transport in the Asian and Pacific Region. Transport and Communcations Buttetin for Asia and the Pacific No. 68. New York: 49-66. [available online: http://www.unescap.org/ttdw/Publications/TPTS_pubs/TxBulletin_68/bulletin68_fulltext.pdf. 04.07.2008]
66 Meier, Alan K. (1977): Intermediate Transport in South East Asian Cities: Three Case Studies. I.T.D.B. Transport Panel, Information Paper No. 4. Excerpt from Gruehl, Kipke (ed.) (1991): Bicycle Reference Manual for Developing Countries. Oxford. UK. [available online: http://www.mobility.de/brm/asia/meier/toc/ as_mei1s.htm 04.07.2008]
67 www.cycl.net/node/80. 02.06.2008 68 www.worldbike.org. 02.06.2008 69 Unnithan, Sandeep (2001): Delivering the Goods. Forbes rates the lunch-box carriers of Mumbai on a
par with Motorola. India Today 04 June 2001. [available online: http://www.india-today.com/itoday/ 20010604/ offtrack.shtml. 14.07.08]
70 Vaswani, Karishma (2006): India’s tiffnwalas fuel economy. BBC News online, 26 July 2006 [available online: http://news.bbc.co.uk/2/hi/business/5210092.stm. 15.07.08]
71 Ramachandran, Sudha (2006): India’s lessons in a lunch box. Asia Times online, 8 September 2006. [available online: http://www.atimes.com/atimes/South_Asia/HI08Df01.html. 14.07.08]
72 Kabra, Harsh (2005): Tiffin time for Charles and Camilla. BBC News 17 February 2005. [available online: http://news.bbc.co.uk/2/hi/south_asia/4269823.stm. 14.07.08]
73 Menon, Supriya (2007): Delhi not suitable for Mumbai’s dabbawalas. [available online: http://www.mydabbawala.com/news/DelhinotsuitableforMumbai'sdabbawalas.htm. 14.07.08]
74 Dabbawalla Website (publl.) (s.a.): Frequently Asked Questions. http://www.mydabbawala.com/general/faq.htm
75 Müller, Michael; Volkamer, Achim (2006): Leitfaden städtischer Güterverkehr. Umwelt schonen und Kosten sparen (Guidelines for urban freight transportation: Preserving the environment and saving costs). VCD Fakten 09/2006. Berlin.
76 ibid.
59

Association of the Major Metropolises Commission4: Urban Mobility Management
77 STRATEC S.A. (2002b): CITY FREIGHT Inter- and Intra-City Freight Distribution Networks. Work package 1: Final report. Comparative survey on urban freight, logistics and land use planning systems in Europe. Brussels: 64
78 STRATEC S.A. (2002c): CITY FREIGHT Inter- and Intra-City Freight Distribution Networks. Work package 1: Annex report Belgium. Brussels: 64. [available online: http://www.cityfreight.eu/Sitefichiers/Project_results /CF_WP1_Belgium.pdf. 15.07.2008]
79 LT Consultants Ltd. (2002): CITY FREIGHT Inter- and Intra-City Freight Distribution Networks. Work package 1: Annex report Finland. Brussels: 26. [available online: http://www.cityfreight.eu/Sitefichiers/Project_results /CF_WP1_Finland.pdf. 15.07.2008]
80 Bundesministerium für Verkehr, Bau und Stadtentwicklung (2006): Warentransport mit Rad und Bahn. Kombinierter Kurierdienst über lange Strecken. (Federal Ministry for Transport, Building and Urban Environment: Transport of goods by bicycle and train: Combined long-distance courier services). Berlin. [available online: http://www.nationalerradverkehrsplan.de/praxisbeispiele/anzeige.phtml?id=2029. 14.07.08]
81 time:matters (publ.) (2005): time:matters erhält Umweltaktie vom Bundesverband der Fahrradkuriere. Pressemitteilung (time:matters receives environmental award by the Federal Association of Bicycle Couriers. Press release). Neu-Isenburg. [available online: http://www.time-matters.com/de/files/timemattersPI0506HBbdfUmweltaktie.pdf. 14.17.08]
82 Mullen, Shannon (2008): Truckers: Make Room for Bike Freight. National Public Radio, 20 June 2008. [Available online (transcript and as audio file): http://www.npr.org/templates/story/story.php?storyId=91731834. 16.07.2008]
83 The British Postal Museum and Archive (2005): Post Office Underground Railway (Mail Rail). Archive Information Sheet. [Availabe online: http://www.postalheritage.org.uk/history/downloads/BPMA_Info_Sheet_ MailRail_web.pdf?searchterm=Mail%20Rail. 18.07.2008]
84 O’Keefe, Phill (2006): Chicago Tunnel Company Railroad Home Page. (private homepage, last updated 21 September 2006) http://users.ameritech.net/chicagotunnel/tunnel1.html. 17.08.2008
85 Fawcett Publications (publ) (1929): Chicago’s Freight Subway Does the Work of 5000 Trucks. In: Modern Mechanics and Inventions. Issue Nov. 1929: 131 ff. [reprinted copy available for viewing at http://blog.modernmechanix.com/2008/03/06/chicagos-freight-subway-does-the-work-of-5000trucks/., 17.07.2008]
86 O’Keefe, Phill (2006): l.c. 87 Levifve, Hervé (2007): The City of Paris Freight Policy. Programme and Outcome. Presentation given at
the BESTUFS II national seminar in The Netherlands on “Competitive, accessible and attractive cities: Urban distribution as aorta for the urban economy.”. The Hague, 26 November 2007. [Available online: http://www.bestufs.net/download/BESTUFS_II/national_seminar/2007-1126_netherlands/BESTUFS_NL_11_ 2007_herve_levivfe.pdf. 21.07.2008]
88 De Decker, Kris (2008): A world without trucks. In: Low-tech Magazine. 22 Feb. 2008.[Available online: http://www.lowtechmagazine.com/2008/02/a-world-without.html. 17.07.2008]
89 CargoCap GmbH (s.a.): CargoCap – Freight transportation in congested urban areas. Website. http://www.cargocap.com/. 17.07.2007
90 Pielage, Ben-Jaap (2001): Underground Freight Transportation. A new development for automated freight transportation systems in the Netherlands. IEEE Intelligent Transportation Systems Conference proceedings – Oakland (CA) IUSA, 25-29 August 2001.
91 De Decker, Kris (2008): l.c. 92 ibid. 93 ARCADIS Bouw/Infra et al. (2000): l.c.:31. 94 Bundesministerium für Verkehr, Bau und Stadtentwicklung (publ.) (s.a.): Die CarGo Tram Dresden als
indermodale Maßnahme zur Vermeidung von Güterverkehr in Ballungsräumen (The CarGo Tram Dresden as an intermodal means to reduce freight traffic in urban agglomerations). Bonn/Karlsruhe. [available online: www.forschungsinformationssystem.de. 21.07.2008]
95 Verkehrsbetriebe Zürich (n.d): Homepage: http://www.vbz.ch/vbz_opencms/opencms/vbz/deutsch/Dienstleistungen/Cargotram/. [21.07.2008]
60

Urban Commercial Transport Background Paper for the Meeting in Sydney, October 2008
96 WIENER LINIEN GmbH & Co KG (s.a.): GüterBim (Cargo Bim) Homepage. http://www.gueterbim.at/. [21.07.2008]
97 CityCargo Amsterdam (publ.) (2008): CityCargo Amsterdam Website. http://www.citycargo.nl/ [21.07.2008]
98 Levifve, Hervé (2007): l.c. 99 Bundesministerium für Verkehr, Bau und Stadtentwicklung (publ.) (s.a.): ibid. 100 van der Bijl, Rob; Kuehn, Axel (2006): TramTrain: The 2nd Generation. New Criteria for the ‘Ideal
TramTrain City’. [available online: www.lightrail.nl.TramTrain/tramtrain.htm. 21.07.2008]. 101 STRATEC S.A. (2002): l.c. 102 European Centre for Transportation and Logistics (2004): Wirtschaftsverkehr in Ballungsräumen –
Fallbeispielsammlung. (Commercial Transport in Urban Agglomerations – Case Study Collection). Hamburg. [available online: http://www.vsl.tu-harburg.de/gv/gv/index_html. 13.08.2008]
103 ibid. 104 Gleich, Michael (1998): Mobilität. Warum sich alle Welt bewegt. (Mobility. Why the whole world keeps
moving.) Hamburg. 105 Visser, Johan; Konings, Rob; Pielage, Ben-Jaap; Wiegmans, Bart (2007): A new hinterland transport
conecpt fort he port of Rotterdam: organisational and/or technological challenges? Transportation Research Forum – Proceedings of the 48th Annual Forum 15-17 March 2007. Boston, MA. [available online: http://www.trforum.org/forum/2007/schedule.php. 23.07.2008]
106 i ib d.: 2 107 i ib d.: 2 108 i ib d.: 3 109 Port of Rotterdam Authority (2008): Port of Rotterdam Homepage. http://www.portofrotterdam.com.
[23.07.2008] 110 Visser, Johan et al. (2007): l.c. 111 DutchNews.nl (publ.) (2007): Germany ignores Betuwelijn rail project. Posted online 5th September
2007. http://www.dutchnews.nl/news/archives/2007/09/germany_ignores_betuwelijn_rai.php.m 24.07.2008
112 Visser, Johan et al. (2007): l.c. 113 Port of Rotterdam Authority (2008): Port of Rotterdam Homepage. http://www.portofrotterdam.com.
[23.07.2008] 114 UNCTAD United Nations Conference on Trade and Development (2007): UNCTAD XII pre-event:
“Globalization of port logistics: opportunities and challenges for developing countries.” 12 December 2007. Note by the Secretariat. Geneva. [available online: http://www.unctad.org/en/docs/tdxiibpd3_en.pdf. 24.07.2008].
115 UNCTAD United Nations Conference on Trade and Development (s.a.): Port logistics: key issues for developing countries. Article on UNCTAD homepage: http://www.unctad.org/Templates/Page.asp?intItemID=4434&lang=1. 24.07.2008
61