urban street-scale hydrodynamic flood modeling of micro ... · outline 1. introduction emerging...
TRANSCRIPT
Urban Street-Scale Hydrodynamic Flood Modeling of Micro-Burst Rainfall
Sridhar Katragadda
Systems Analyst,
City of Virginia Beach
Dr. Jon Derek Loftis
Asst. Research Scientist,
VA Inst. of Marine Science
ESRI User Conference, July 11, 2017
Advanced Computational Methods in Water Resources
Kyle Spencer
GIS Team Supervisor
City of Norfolk
Outline1. Introduction
▪ Emerging Flood Model Verification Methods
(Sensors, Citizen Science, and Drones)
▪ Sensor Network and Sub-Grid Modeling Approach
2. Methods: Model Setup and Grid Development
3. Results & Discussion
▪ Tropical Storm Julia (Sept. 19-22, 2016)
▪ Hurricane Matthew (Oct. 8-9, 2016)
4. Conclusions
1. Introduction ▪ Emerging Flood Model Verification Methods
(Sensors, Citizen Science, and Drones)
▪ Sensor Network and Sub-Grid Modeling Approach
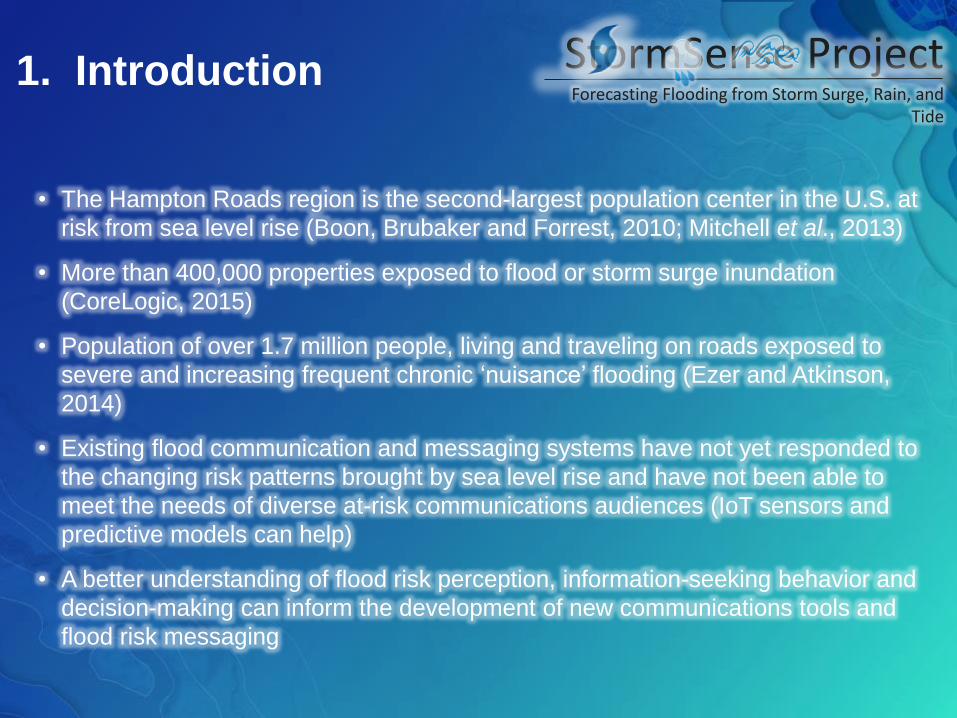
• The Hampton Roads region is the second-largest population center in the U.S. at
risk from sea level rise (Boon, Brubaker and Forrest, 2010; Mitchell et al., 2013)
• More than 400,000 properties exposed to flood or storm surge inundation
(CoreLogic, 2015)
• Population of over 1.7 million people, living and traveling on roads exposed to
severe and increasing frequent chronic ‘nuisance’ flooding (Ezer and Atkinson,
2014)
• Existing flood communication and messaging systems have not yet responded to
the changing risk patterns brought by sea level rise and have not been able to
meet the needs of diverse at-risk communications audiences (IoT sensors and
predictive models can help)
• A better understanding of flood risk perception, information-seeking behavior and
decision-making can inform the development of new communications tools and
flood risk messaging
1. Introduction StormSense ProjectForecasting Flooding from Storm Surge, Rain, and
Tide
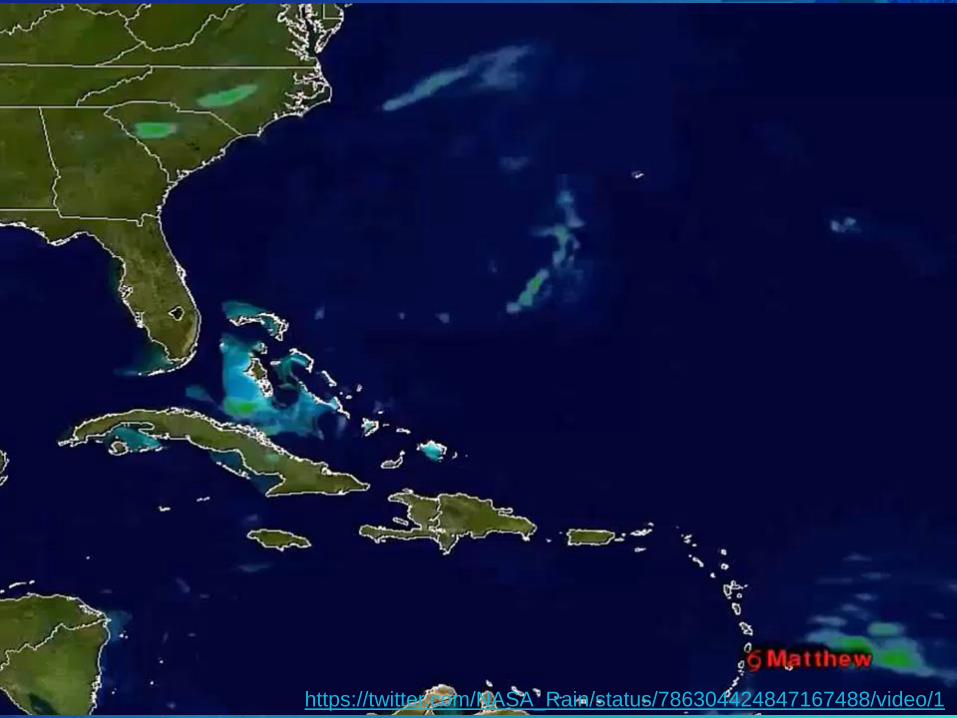
https://twitter.com/NASA_Rain/status/786304424847167488/video/1

StormSense ProjectForecasting Flooding from Storm Surge, Rain, and
Tide
Emerging Flood Model Verification Methods
▪ Water Level Sensors (NOAA, USGS, COOS, VIMS)
▪ Ultrasonic Sensors (Cities)
▪ GPS Citizen-Science
• Sea Level Rise Mobile App (Wetlands Watch)
• ArcGIS Collector App (ESRI)
▪ 4K Aerial Drone Surveys
• Drone2Map (ESRI)
• Photosynth (Microsoft)(less)
Conventionalit
y
(more
)
Scie
ntific R
elia
bili
ty

StormSense ProjectForecasting Flooding from Storm Surge, Rain, and
Tide
Sea Level Rise App
▪ How it’s used
▪ Collect GPS max.
flood extent data
▪ Frequently flooded
areas are identified
in ‘trouble’ section
▪ What information is
gathered?
▪ Pics of flooding
▪ Text descriptions
▪ How do I use it?
▪ Assess accuracy of
flood forecasts
Web Map of Suggested
App Features & Updates:

Project Partners (as of July 2017):
StormSense ProjectForecasting Flooding from Storm Surge, Rain, and
Tide
Project Partners
2. Methods
▪ StormSense Model Setup
▪ Grid Development

IoT Stream Gauge
Network
StormSense
Hydrodynamic
Forecast Model
Server StormSense
Web Portal
6-min automated
retrieval script
Observations & Predictions
stormsense.com
StormSense ProjectForecasting Flooding from Storm Surge, Rain, and
Tide
Sensor Network and StormSense Model Inputs

StormSense Model Output Methods
• Water levels extracted from grid cells with
water level observations
• Perl and python scripts run in the background
to produce geotiff rasters of water level and
flood heights (water level- land elevation) for
each 6-minute interval
• Spatial outputs are prepared as .kml files and
javascript-layers for production of open layers
maps, Google Maps, and Google Earth
animations .
Amazon Web Service for
StormSense Sensor Data:
StormSense ProjectForecasting Flooding from Storm Surge, Rain, and
Tide
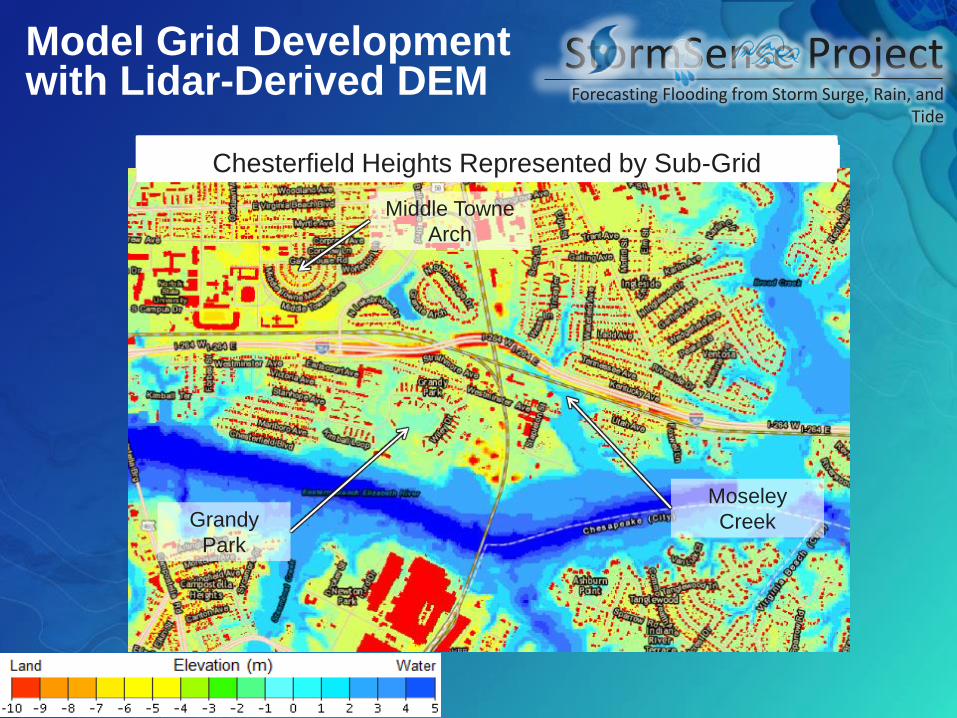
Model Grid Development with Lidar-Derived DEM
12
Central Norfolk Superposed with Sub-gridCentral Norfolk Represented by Sub-gridDowntown Norfolk and City HallCity Hall Superposed with Sub-gridCity Hall Represented by Sub-grid
Norfolk Tides
Stadium
Norfolk
City Hall
Norfolk
Scope
Arena
City of NorfolkOld Dominion University and PeninsulaODU Peninsula Superposed with Sub-gridODU Peninsula Represented by Sub-grid
Edgewater
Haven
Foreman Field
ODU
President’s
Residence
Chesterfield Heights, Grandy Park, and Broad CreekChesterfield Heights Represented by Sub-Grid
Middle Towne
Arch
Moseley
CreekGrandy
Park
StormSense ProjectForecasting Flooding from Storm Surge, Rain, and
Tide
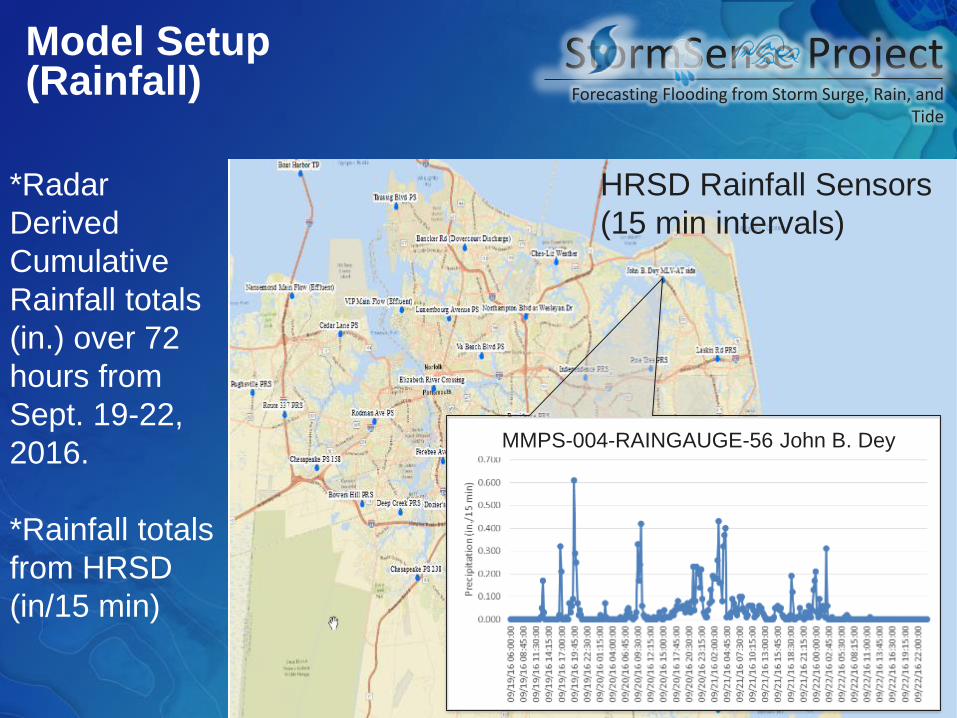
Model Setup (Rainfall)
*Radar
Derived
Cumulative
Rainfall totals
(in.) over 72
hours from
Sept. 19-22,
2016.
*Rainfall totals
from HRSD
(in/15 min)
HRSD Rainfall Sensors
(15 min intervals)
MMPS-004-RAINGAUGE-56 John B. Dey

3. Results & Discussion
▪ Tropical Storm Julia (Sept. 19-22, 2016)
▪ Hurricane Matthew (Oct. 8-9, 2016)

StormSense ProjectForecasting Flooding from Storm Surge, Rain, and
Tide
Tropical Storm Julia & Hurricane Matthew
StormSense ProjectForecasting Flooding from Storm Surge, Rain, and
Tide
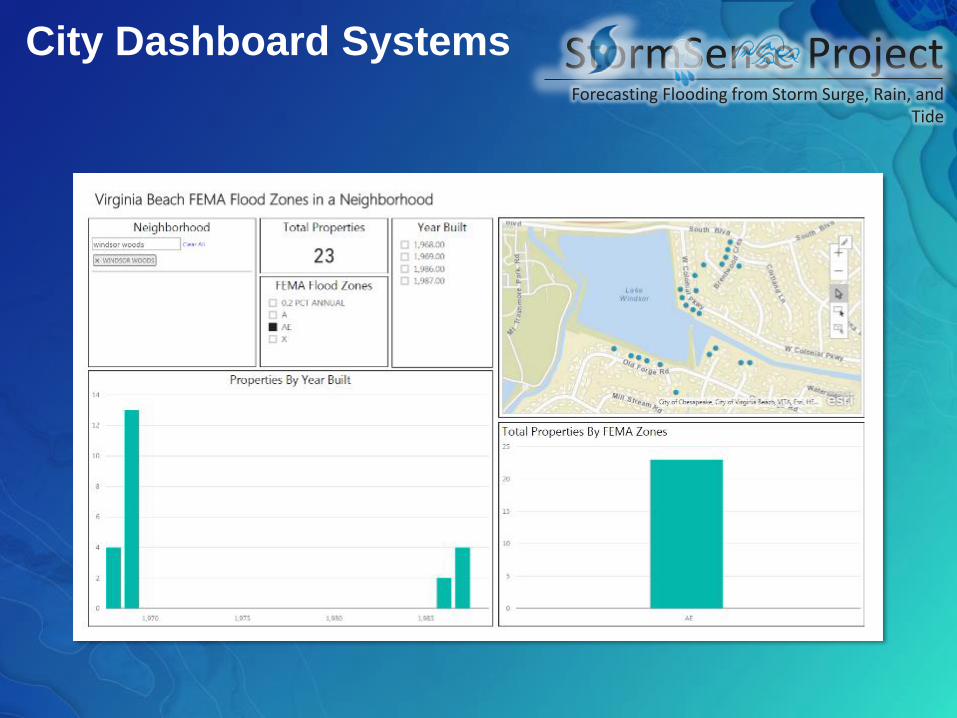
City Dashboard Systems
StormSense ProjectForecasting Flooding from Storm Surge, Rain, and
Tide
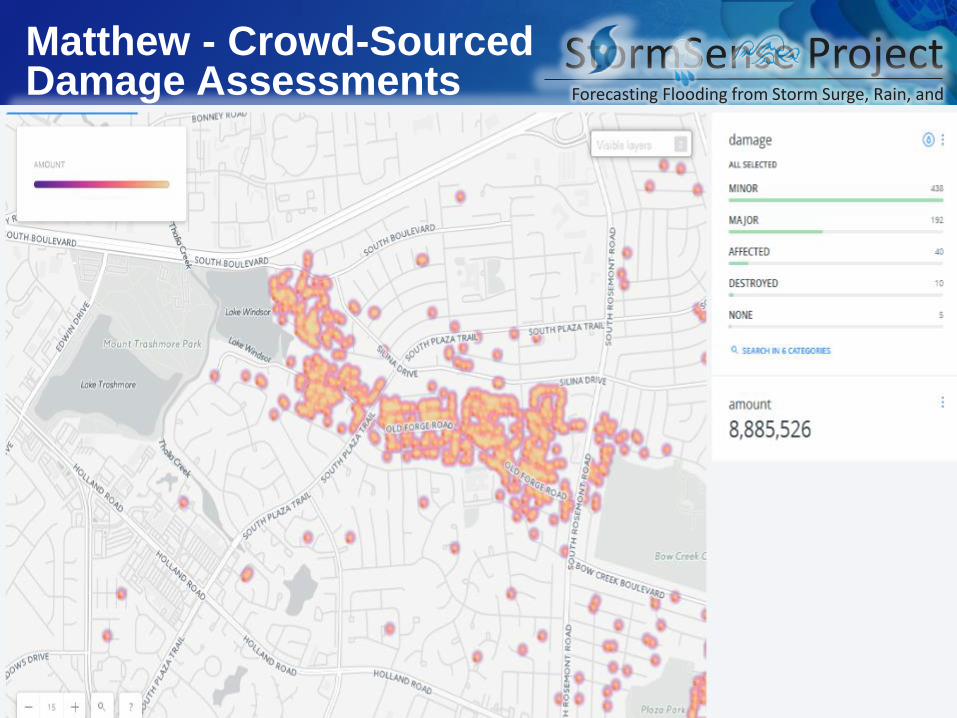
Matthew - Crowd-Sourced Damage Assessments

StormSense ProjectForecasting Flooding from Storm Surge, Rain, and
Tide
Hurricane MatthewDrone2Map Survey
Drone Video by John Ehlers, Norfolk
https://youtu.be/R8ZYxubUo-w
Workflow:
• Capture Video
• Parse to Images (0.25 sec)
• Edge Detection
• Laplace Transform of Pixel
Values (Sobel)
• Supervised Classification
• Import to Drone2Map with XYZ
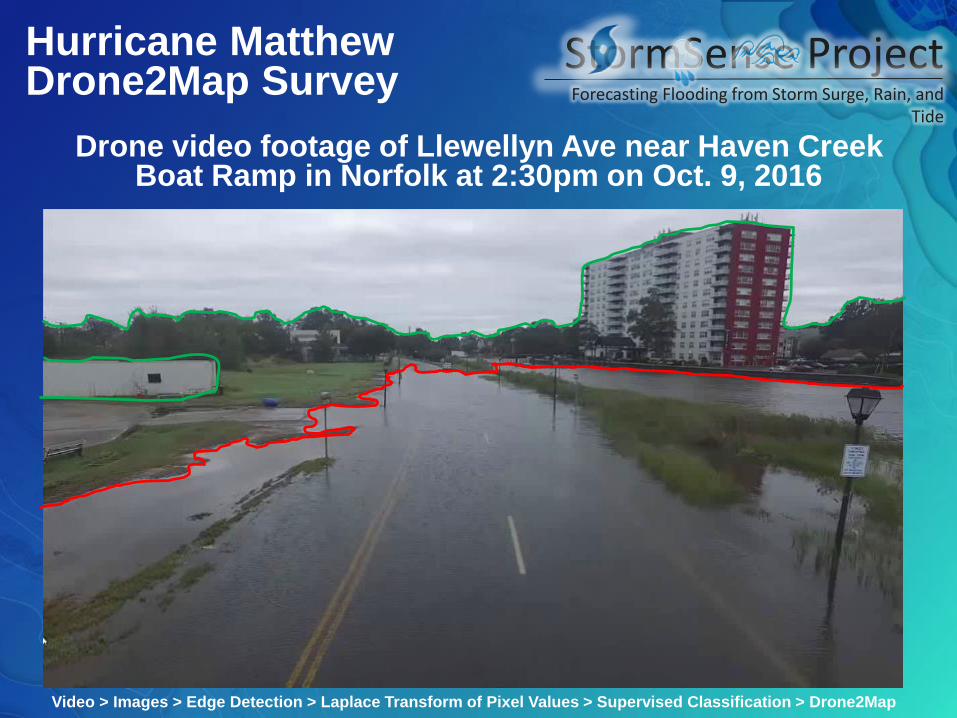
Drone video footage of Llewellyn Ave near Haven Creek Boat Ramp in Norfolk at 2:30pm on Oct. 9, 2016
Video > Images > Edge Detection > Laplace Transform of Pixel Values > Supervised Classification > Drone2Map
StormSense ProjectForecasting Flooding from Storm Surge, Rain, and
Tide
Hurricane MatthewDrone2Map Survey
Forecast Modeled Extents at 2:30pm on Oct. 9, 2016 @ Llewellyn AvePlotted with Maximum Inundation Extents from Drone2Map
StormSense ProjectForecasting Flooding from Storm Surge, Rain, and
Tide
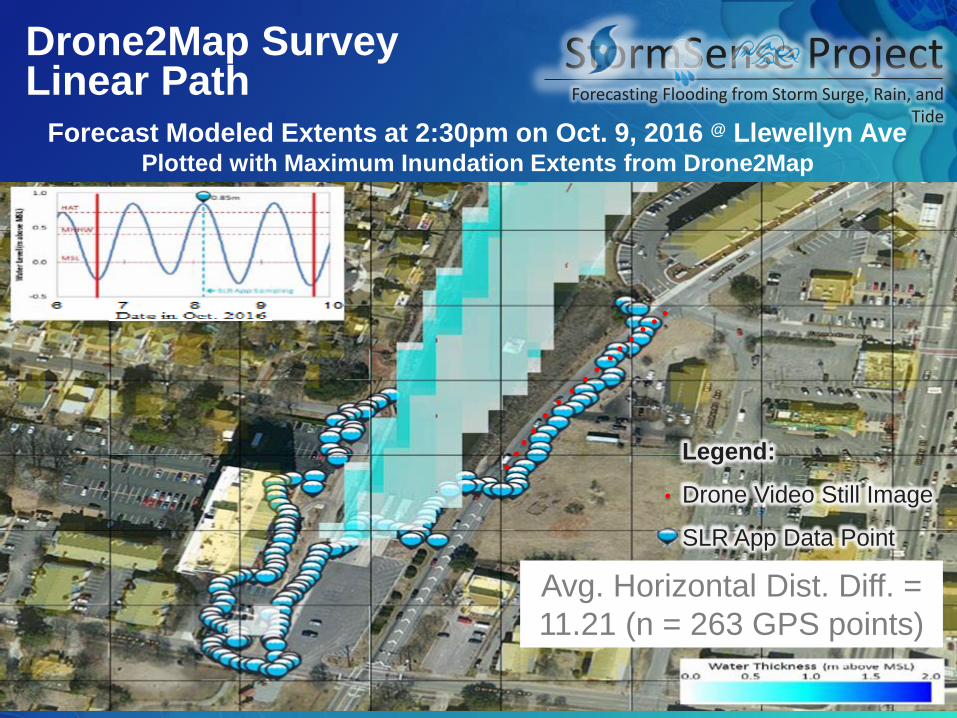
Drone2Map SurveyLinear Path
Avg. Horizontal Dist. Diff. =
11.21 (n = 263 GPS points)
Legend:
Drone Video Still Image
SLR App Data Point

So why is the model over-predicting flooding here?
*Model DEM is sourced with 2009 lidar before the ground was raised

Current Flooding Extent
Avg. Horizontal Dist. Diff.
= 14.39m (n = 137 points)
Drone Video Footage > Images > Drone2Map
Drone video footage of Monticello Ave near Haven Creek Boat Ramp in Norfolk at 3:00pm on Oct. 9, 2016
StormSense ProjectForecasting Flooding from Storm Surge, Rain, and
Tide
Drone2Map SurveyPanoramic Path
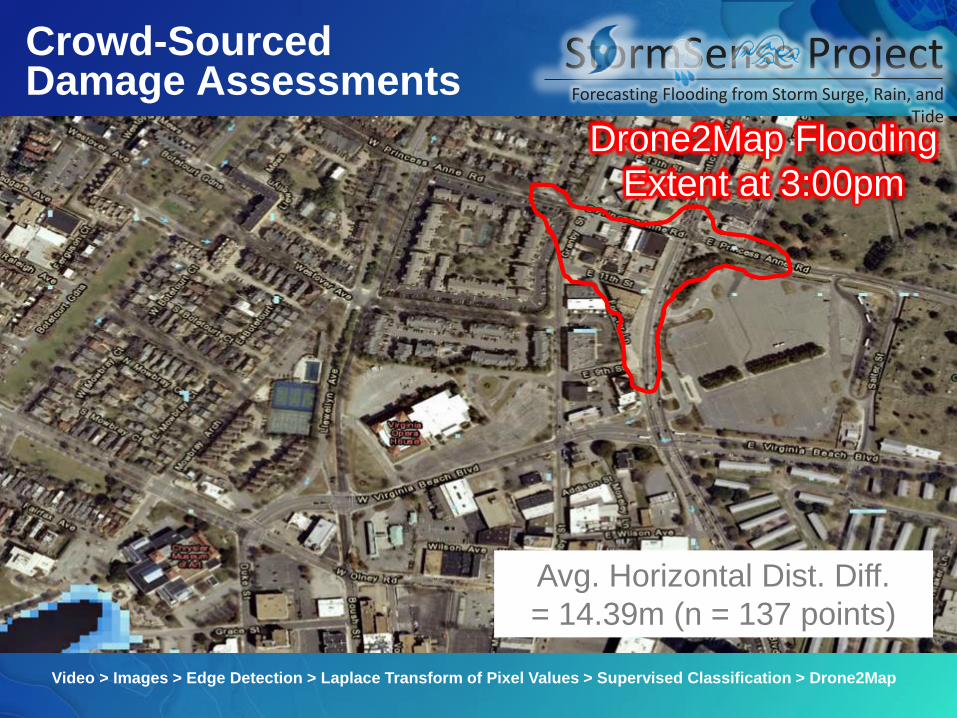
Drone2Map Flooding
Extent at 3:00pm
Avg. Horizontal Dist. Diff.
= 14.39m (n = 137 points)
StormSense ProjectForecasting Flooding from Storm Surge, Rain, and
Tide
Crowd-Sourced Damage Assessments
Video > Images > Edge Detection > Laplace Transform of Pixel Values > Supervised Classification > Drone2Map

4. Conclusions
▪ The sub-grid model forecasted tidal flooding during
Hurricane Matthew in Sept. 2016 and was well validated via
tide gauges and ‘Sea Level Rise’ App GPS extent data: Vertical Accuracy: aggregate RMSE of 8.19 cm (n=5; 416ts each)
Horizontal Accuracy: distance diff. of 11.21 m (n=263; GPS pts)
▪ Through StormSense, 24 more sensors are planned for
installation throughout Hampton Roads by the end of July,
courtesy of NIST RSCT funds, VDEM, & Virginia Beach CIP.

4. Conclusions (cont’d)
▪ Tropical Storm Julia caused more than 14 inches of rainfall
over 3 days time in parts of Norfolk, Chesapeake, and
Virginia Beach. The NWS under-predicted this amount by as
much as 4 inches in some parts of Hampton Roads
▪ This caused model under-prediction for Hurricane Matthew
in inland regions when compared with Drone2Map surveyed
extents for an Avg. Horizontal Dist. Diff.=14.39m (n = 263 pts).

Thank You