urban its expert group - european...
TRANSCRIPT
January 2013
January 2013
URBAN ITS EXPERT GROUP
BEST PRACTICES IN URBAN ITS
COLLECTION OF PROJECTS
U R B A N I T S E X P E R T G R O U P
Document Information
Version Number: 1.0
Dissemination Level: Public
Members of Urban ITS Expert Group
ALBRECHT Hanfried Albrecht Consult GmbH / OCA DE
BEASLEY Simon Reading Borough Council / UDG UK
BLAQUIERE Alexandre Tisseo - Toulouse Public Transport Authority FR
BROWN Tony Hampshire County Council UK
COLDEFY Jean Greater Lyon Region FR
DIEGO BERNARDO Enrique EMT - Madrid Public Transport Authority SP
ELIASSEN Jarl Trafikanten AS NO
FIBY Hans Transport Association East Austria AT
FRANCO Gino Mizar / Swarco IT
HASELBERGER Rainer City of Vienna AT
HEDIN Johan Hybris Konsult SE
IZDEBSKI Piotr ZTM Warsaw PL
JENSEN Helge City of Oslo NO
KEARNS Steve Transport for London UK
LEFEBVRE Olivier STIF Ile-de-France FR
LEIHS Dietrich Kapsch TrafficCom AT
MEEUWISSEN Marcel City of Enschede NL
PLANATH Susanne Swedish Transport Administration SE
SPELL Sabine Volkswagen AG DE
TØFTING Svend North Denmark Region DK
TOMASSINI Maurizio ISIS - Rome IT
TYRINOPOULOS Yannis Hellenic Institute of Transport (HIT) GR
VAN DEN ABEELE Didier Alstom Transport FR
VLEMMINGS Tiffany National Data Warehouse for Traffic information NL
WINNING Ian City of Cork IE
Notices
The Urban ITS Expert Group thanks all organisations contributing to this collection.
Editors of document:
- EGELER Christian, Rapp Trans AG - DELL Gideon, Rapp Trans AG
Copyright on pictures on title sheet:
J. Léone - Grand Lyon, A. Hauteroche(top left, bottom right), Public transport authority of the Toulouse
agglomeration (top right), Bristol City Council’s Urban Traffic Control Centre with kind permission by
info4security.com (bottom left)
U R B A N I T S E X P E R T G R O U P
ITS Action Plan – Best Practices: Collection of projects
Content 1 URBAN ITS BEST PRACTICE TEMPLATE ..................................................................................... 1
2 URBAN ITS BEST PRACTICES EXPLANATORY NOTE ................................................................... 3
3 URBAN ITS BEST PRACTICES PROJECTS .................................................................................... 6
3.1 AT - Graphs Integration Platform (GIP) for Austria 6 3.2 AT - Vienna – A Joint Traffic Information Project 8 3.3 CH – Basel - MCH Logisticstool 10 3.4 DE - Düsseldorf – Dmotion, Cooperative Traffic Management in the Metropolitan
Area of Düsseldorf 13 3.5 DE - Munich - Tram and Bus Priority at Traffic Signal, “Green Waves” 15 3.6 DE - Berlin - Inner City Logistics 17 3.7 DE - Berlin - Integrated Real-Time based Travel Information Services for Public
Transport, VBB Berlin Brandenburg 20 3.8 DE - Deutsche Bahn: Touch & Travel (NFC Pilot) 23 3.9 DE - Stuttgart - Integrated Traffic Management Centre Focuses on Collaboration
and Information Sharing 26 3.10 DE - Munich - Public Transport, Information Management System 28 3.11 DE - Cologne - Intermodal Transport Control System for Public Transport 30 3.12 DE - Leipzig - Public Transport Traffic Control and Passenger Information 32 3.13 DE - Intermodal Transport Control Systems for Public Transport 34 3.14 DE - RNV Real-Time Passenger Information (Rhein-Neckar-Verkehr) 36 3.15 DE - Karlsruhe - Handy Ticket KVV 38 3.16 DE - Implementation of ITCS for 250 Light Rail Vehicles and 80 Buses 40 3.17 DE - Provision of Nationwide and Europeanwide Public Transport Journey
Planner System (DELFI & EU-SPIRIT) 42 3.18 DE - Integration of Regional Public Transport Routing Information System within
the Public Transport Network of Nation- and Europeanwide Journey Planner 44
3.19 DE - Networking of Intermodal Passenger Travel Information and Real-Time in Public-Transport (ITCS/RBL/FIS/ABF/RBL-Light etc.) 46
3.20 DE - Stuttgart - RBL Light, Intermodal Transport Control System 48 3.21 DE - Stuttgart – VVS HandyTicket 50 3.22 DE - Stuttgart - Journey Planner (EFA) 52 3.23 DE - Dortmund – Public Transport, ITCS/RBL 54 3.24 DE – Logistic V-Info, Professional Tour Planning System 56 3.25 DE - Bremen – eTicketing / BOB Card 58 3.26 EL - Online Portal for Transport Data/Content Management and Transportation
Services Provision 61 3.27 ES - Madrid - Contactless Card End of 2011- Integration of High Number of
Operators 64 3.28 ES - Madrid – WiFi on Buses 66 3.29 ES - ATM Barcelona – Steps towards E-Ticketing 68 3.30 EU - Europe-In-Time (Delivering Intelligent and Efficient Travel Management for
European Cities) 70 3.31 EU - European Cross Border Travel Information Network, “EU-Spirit” 74 3.32 FR - Lyon- Global Urban Ticketing 76 3.33 FR - Lyon - Grand Lyon Urban Traffic Management System (CRITER) 78 3.34 FR - Paris - Passautocar (Coach Parking Pass) 80
U R B A N I T S E X P E R T G R O U P
ITS Action Plan – Best Practices: Collection of projects
3.35 FR - Toulouse – The Electronic Ticketing System 82 3.36 FR - Toulouse – Multimodal Traveller Information Centre 84 3.37 FR Paris – INFOMOBI Mail / SMS Service for PRMs 86 3.38 FR - La Rochelle – Electronic Ticketing System 88 3.39 IT/DE - SMART-WAY: Mobile Public Transport Navigation 90 3.40 IT - Bologna – SIRIO, Access to Controlled Areas 92 3.41 NL - Rotterdam – Park & Ride Pricing Strategy for Target Groups 94 3.42 NL - Rotterdam -. Truck Parking in Residential Areas 97 3.43 NL - Rotterdam - The Traffic Enterprise (De Verkeersonderneming) 100 3.44 NL – Urban Freight Energy Efficiency Pilot (Helmond Freilot) 102 3.45 NL - Rotterdam - Havenbedrijf (Port of Rotterdam Authority) 106 3.46 NL - Openbaar Vervoer Chipkaart (Public Transport Chipcard) 108 3.47 NL - Spitsmijden, Avoiding Rush Hour 110 3.48 NL - Brabant – Spitsmijden, Avoiding the Peak 112 3.49 NL - Yellowbrick / Parkline 115 3.50 NL - Maintenance of Information Standards for Public Transportation BISON 117 3.51 NL - Public Transport Information without Frontiers GOVI 120 3.52 NL - Enschede – Incentive Zone 124 3.53 NO - Oslo - Economic Evaluation of an ITS-Based Toll Collection 126 3.54 NO - Trondheim - Smart Card Ticketing: t-card 128 3.55 PL/DE - Warsaw - Cross Border Travel Planner 130 3.56 PL - Warsaw – Voice Portal 132 3.57 PL - Warsaw - Tickets on Mobile Phones in SkyCash™ and mPay Systems based
on Specialized Applications 134 3.58 PL - Lodz – Electronic Monthly Ticket 136 3.59 RO– RATB Travel Card 138 3.60 SE - Gothenburg - Motorway Control System 141 3.61 SE - Gothenburg – ITS4 Mobility 144 3.62 SE - Gothenburg – Attractive Travel Service 146 3.63 UK - Urban Traffic Management & Control (UTMC) Open System Integration 150 3.64 UK - London: Urban Road User Charging 153 3.65 UK - Bristol - Environmental Road Pricing 157 3.66 UK - London – Oyster Card 160 3.67 UK - London - The Low Emission Zone (LEZ) 162 3.68 UK - Leicester - Traffic Information Service Database / Smart Ticketing 167

U R B A N I T S E X P E R T G R O U P
ITS Action Plan – Best Practices: Collection of projects 1
1 Urban ITS Best Practice Template
URBAN ITS
KEY APPLICATION
Traffic & Travel Information Traffic & Access Management
Smart Ticketing Urban Logistics
Other:
TITLE
1 . G E N E R A L D E S C R I P T I O N
Problems to solve /
Objectives
Issue(s) encountered:
Objective(s) of the measure/service:
Start of system/service
Location single road/line city district whole city urban region
Transport mode(s)
concerned
public transport rail road car-sharing
bicycles pedestrians other:
Implementing
organisation
System / service
description
Technologies
Standards
2 . I M P L E M E N T A T I O N
Partners involved
Public authorities:
Private stakeholders:
Others:
Organisational model
Management body:
Operating body:
Financing body:
Business model
Public investment:
Private / commercial framework:
Public-private partnership:
Investment costs €:
Operating costs € / year: person / year:
U R B A N I T S E X P E R T G R O U P
ITS Action Plan – Best Practices: Collection of projects 2
3 . R E S U L T S
Technical performance
Implementation of
Innovation
Safety impacts
Efficiency impacts
Environmental impacts
Socio-economic impacts
Revenue generation
User acceptance
4 . L E S S O N S L E A R N T
Factors for success
Obstacles
5 . M O R E I N F O R M A T I O N
Contact Person
Name:
Function:
Company:
Email:
Phone:
Web link (if existing)

U R B A N I T S E X P E R T G R O U P
ITS Action Plan – Best Practices: Collection of projects 3
2 Urban ITS Best Practices Explanatory Note
Who collects Urban ITS Best Practices?
The collection of Urban Intelligent Transport Systems (ITS) Best Practices is an activity coordinated by
the Urban ITS Expert Group, as part of its framework. This group has been set up in late 2010 by
the Directorate General for Mobility and Transport (DG MOVE) of the European Commission, as part of
the ITS Action Plan. The group is made of 25 experts form public and private organisations, directly
connected and concerned with urban ITS issues.
Why collecting this information?
The first task of the Urban ITS Expert Group during its 24 months of activity is to identify and
exchange best practices for the key applications of urban ITS. The objective is to support cross-
fertilisation among stakeholders through the setting up of an urban ITS database. This database is
to be filled in with success stories but also unsuccessful implementations.
This database will aim to target an audience of stakeholders responsible for the implementation of ITS
systems and services in urban areas. The population comprises local authorities, public transport
operators, service providers and to a certain extent decision-makers at a political level.
How this information will be used?
The information once collected will go through an editorial process to adapt and harmonise the
layouts. The Commission foresees a web-based version of this database to ensure a large
dissemination and the possibility to continually enhance the content. Personal details like detailed
contact information will not be publicly available if so required.
How to complete the Best Practice template, what type of information is awaited?
The information to be provided in the Best Practices should be:
Quantitative rather than qualitative: it should be based on concrete facts and figures
Comprehensive: a maximum of sections of the template should be completed, if not all
Concise: the final document should not exceed 5 pages, answers should be focused.
The template’s structure includes 6 sections which should be completed as follow:
Best Practice classification
URBAN ITS
KEY APPLICATION
Traffic & Travel Information
Traffic & Access Management
Smart Ticketing
Urban Logistics
Other:
Tick at least one box. The 4 items
correspond to priority areas
identified by the Expert Group.
TITLE
Title of Best Practice describing in
20 words maximum the ITS
project.
U R B A N I T S E X P E R T G R O U P
ITS Action Plan – Best Practices: Collection of projects 4
Description of the ITS services and systems concerned
1 . G E N E R A L D E S C R I P T I O N
Problems to solve /
Objectives
Issue(s) encountered:
Objective(s) of the measure/service:
Transport issues requesting the
implementation of such service or
system.
Quantitative and/or qualitative
objectives targeted (reduction
of…)
Start of system/service Date of first operating
Location single road/line city district whole city urban region Is the measure linear or spatial
Transport mode(s)
concerned
public transport rail road car-sharing
bicycles pedestrians other: Urban modes considered
Implementing
organisation
Name and characteristic (public,
private, other) of the
implementer. Core of its normal
activities.
System / service
description
Description of service/system
provided to users, its functions,
basic reasoning.
Technologies
List of the main technologies in
use to implement the
service/system.
Standards List of the main standards in use
to implement the service/system.
Description of the implementation scheme
2 . I M P L E M E N T A T I O N
Partners involved
Public authorities:
Private stakeholders:
Others:
List of all stakeholders directly
involved in the running of the
service/system.
Organisational model
Management body:
Operating body:
Financing body:
List of all stakeholders directly
involved under 3 sections:
management/coordination,
operating and financing.
Business model
Public investment:
Private / commercial framework:
Public-private partnership:
Definition of the business model
and identification of the amounts.
Investment costs €: Total investment before running
the service/system.
Operating costs € / year:
person / year:
Yearly cost for operating the
service/system.

U R B A N I T S E X P E R T G R O U P
ITS Action Plan – Best Practices: Collection of projects 5
Evaluation results, quantitative and qualitative outputs
3 . R E S U L T S
Technical performance Technical performance indicators.
Implementation of
Innovation
Break-through, new technology,
new organisation, new
stakeholder, new solution, etc.
Safety impacts
Evaluation results (if available),
quantitative rather than
qualitative.
Efficiency impacts
Evaluation results (if available),
quantitative rather than
qualitative.
Environmental impacts
Evaluation results (if available),
quantitative rather than
qualitative.
Socio-economic impacts
Evaluation results (if available),
quantitative rather than
qualitative.
Revenue generation Financial benefits or loss,
unexpected financial impacts.
User acceptance Users’ feedback, impact on usage,
incentive on use, etc.
Cross-fertilisation in a summary
4 . L E S S O N S L E A R N T
Factors for success
Which crucial elements impacted
so much the implementation that
it made it successful, which
elements/actors/process are key
factors.
Obstacles
Which crucial elements impacted
so much the implementation that
it could make it a failure, which
elements/actors/process are key
factors.
Contacts
5 . M O R E I N F O R M A T I O N
Contact Person
Name:
Function:
Company:
Email:
Phone:
Details of the person in charge
that may be contacted for further
information.
Web link (if existing) Website address.

U R B A N I T S E X P E R T G R O U P
ITS Action Plan – Best Practices: Collection of projects 6
3 Urban ITS Best Practices Projects
3.1 AT - Graphs Integration Platform (GIP) for Austria
URBAN ITS
KEY APPLICATION
Traffic & Travel Information
Traffic & Access Management
Smart Ticketing
Urban Logistics
Other:
1 . G E N E R A L D E S C R I P T I O N
Problems to solve /
Objectives
Provide Austria with an intermodal, routable graph as the basis for traffic
information, traffic management and traffic administration
Location single road/line city district whole city urban region
Transport mode(s) public transport road multi-modal other: pedestrian, bike,
p+r, parking,...
Implementing
organisation
Cooperation of ASFINAG, OeBB, States and Municipalities of Austria and
Federal Ministry of Transportation (bmvit)
System / service
description
Database and Software for Editing and Exchange of Graph Data in a
decentralised manner
Technologies Web-Services for Editing, ArcGIS-Rich-Client for special purposes
Standards The GIP-Standard is going to created by the above organisations till end
of 2011
Start of system/service 2008 in Vienna
2 . I M P L E M E N T A T I O N
Role model (tbc) none
Partners involved ASFINAG, OeBB, Vienna, Lower Austria, Burgenland, ..., bmvit
Business model Costs are divided between the partners and funded from their budgets.
Subsidies from the Austrian Climate and Energy-Funds
3 . R E S U L T S
Technical performance Vienna has replaced it’s former Graph by the new system
Safety impacts none
Efficiency impacts
Is the basis for the data exchange within and between the transport
authorities on behalf of cooperations, regulatory processes, permits and
traffic information
Environmental impacts Enables comprehensive monitoring of environmental footprint and fuel-
consumption on real-world data instead of models, forecasts
Socio-economic impacts
Basis of the ITS-Vienna Region traffic situation forecast and dynamic
intermodal router; shall become the basis of the Austrian accident
database
Revenue generation none
User acceptance All states of Austria, the federal government and some of the
municipalities are already using the system

U R B A N I T S E X P E R T G R O U P
ITS Action Plan – Best Practices: Collection of projects 7
4 . L E S S O N S L E A R N T
Factors for success Subsidies, technical expertise, technical excellence, reference
implementation in the Vienna Region, free exchange of data
Obstacles Mere amount of data necessary, large number of involved authorities
5 . M O R E I N F O R M A T I O N
Contact Person Rainer Haselberger (Vienna), Hans Fiby (VOR)
Web link (if existing) http://AnachB.at is based upon the GIP,
http://www.kagis.ktn.gv.at/194378_DE-.pdf

U R B A N I T S E X P E R T G R O U P
ITS Action Plan – Best Practices: Collection of projects 8
3.2 AT - Vienna – A Joint Traffic Information Project
URBAN ITS
KEY APPLICATION
Traffic & Travel Information
Traffic & Access Management
Smart Ticketing
Urban Logistics
Other:
1 . G E N E R A L D E S C R I P T I O N
Problems to solve /
Objectives
Regional and intermodal traffic and travel information system run by the
public transport association for the Vienna region (VOR GesmbH)
Location single road/line city district whole city urban region
Transport mode(s) public transport road multi-modal other: bike,
pedestrian, p+r, take along bike, city-bike,...
Implementing
organisation VOR GesmbH, funded by the partner states
System / service
description Dynamic traffic situation forecast, dynamic intermodal router
Technologies Transport models, intermodal graph with dynamic traffic information and
information from transport authorities (e-Government)
Standards DATEX2
Start of system/service 2008
2 . I M P L E M E N T A T I O N
Role model (tbc)
Partners involved City of Vienna, the states of Lower Austria and Burgenland and the VOR
(Public transport association Vienna Region)
Business model Public funds from the above mentioned states
3 . R E S U L T S
Technical performance You find the results at http://AnachB.at
Safety impacts none
Efficiency impacts Modal shift, better informed passengers
Environmental impacts Modal shift
Socio-economic impacts Route guidance free of charge for all social groups
Revenue generation none
User acceptance 1 Mio requests/month

U R B A N I T S E X P E R T G R O U P
ITS Action Plan – Best Practices: Collection of projects 9
4 . L E S S O N S L E A R N T
Factors for success
Comprehensive intermodal and dynamic graph as the joint reference
system for all data providers involved, data exchange for free from all
partners, additional funds from research programs, expertise of the team
Obstacles Quality of data, accuracy, timelyness, organising data exchange free of
charge, complexity of forecast-models
5 . M O R E I N F O R M A T I O N
Contact Person Hans Fiby (VOR), Rainer Haselberger (Vienna)
Web link (if existing) http://AnachB.at
U R B A N I T S E X P E R T G R O U P
ITS Action Plan – Best Practices: Collection of projects 10
3.3 CH – Basel - MCH Logisticstool
URBAN ITS
KEY APPLICATION
Traffic & Travel Information
Traffic & Access Management
Smart Ticketing
Urban Logistics
Other:
1 . G E N E R A L D E S C R I P T I O N
Problems to solve /
Objectives
Background: Fairground (Messe Basel) in the middle of the city Construction of 3 exhibition halls in the period between 2011 to
2013 Limited unloading points
Problems: Uncoordinated approaches to the transfer zones (unloading points) Poor coordination and inadequate arrangements between stand
builder and carriers
High transport peaks in the first set-up and dismantling days
Difficult management of existing checkpoint New exhibition halls in 2013 with less lifts
Conclusion: Current condition needs optimisation, particularly in view of the
logistical processes with commissioning of the new halls
Objectives:
Transparent representation of the logistics processes on the premises
Optimisation of logistics processes in all areas and phases (checkpoint, transfer zones, lifts, etc.)
Improving traffic flow
Optimisation of the unloading points Optimisation of the use of forklifts Partial change of delivery concept Optimal allocation of resources (personnel and transportation
equipment)
Location single road/line city district whole city urban region
Messe Basel (Fair Basel)
Transport mode(s) public transport road multi-modal other: traffic
on fairground (e.g. trucks, forklifts, etc.)
Implementing
organisation MCH – Messe Basel
System / service
description
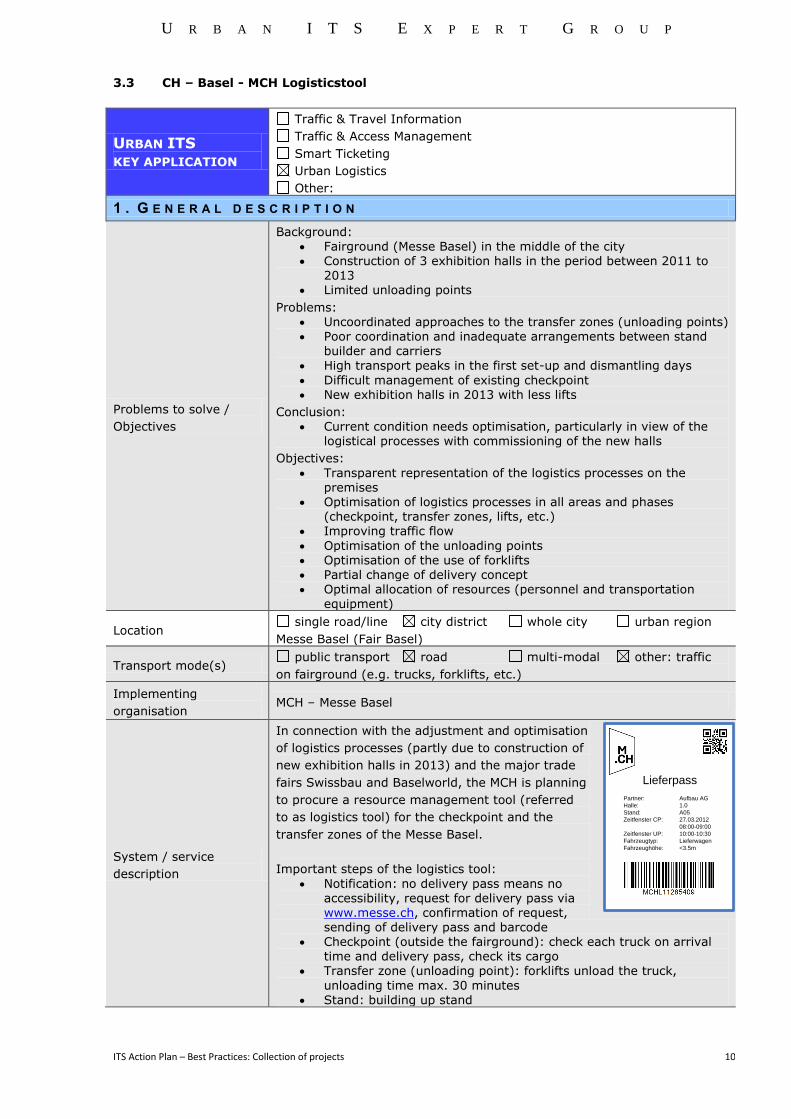
In connection with the adjustment and optimisation
of logistics processes (partly due to construction of
new exhibition halls in 2013) and the major trade
fairs Swissbau and Baselworld, the MCH is planning
to procure a resource management tool (referred
to as logistics tool) for the checkpoint and the
transfer zones of the Messe Basel.
Important steps of the logistics tool:
Notification: no delivery pass means no accessibility, request for delivery pass via www.messe.ch, confirmation of request, sending of delivery pass and barcode
Checkpoint (outside the fairground): check each truck on arrival time and delivery pass, check its cargo
Transfer zone (unloading point): forklifts unload the truck,
unloading time max. 30 minutes Stand: building up stand
Partner: Aufbau AG
Halle: 1.0
Stand: A05
Zeitfenster CP: 27.03.2012
08:00-09:00
Zeitfenster UP: 10:00-10:30
Fahrzeugtyp: Lieferwagen
Fahrzeughöhe: <3.5m
Lieferpass

U R B A N I T S E X P E R T G R O U P
ITS Action Plan – Best Practices: Collection of projects 11
Technologies RFID / Barcode
Standards
Start of system/service
Support the logistics processes through a logistics tool, phased
introduction from 2012 onwards : 2012: notification and control of vehicle movements and
reservation of resources (lifts, unloading and transport equipment)
2013: supplement to the collection of cargo/truck movements in the logistics tool (RFID/barcode)
2 . I M P L E M E N T A T I O N
Role model (tbc)
Overall view on the different roles in the logistics tool:
Partners involved IC information company, Pratteln, Switzerland
Rapp Trans, Basel, Switzerland
Business model
3 . R E S U L T S
Technical performance System runs without any problems
Safety impacts
Efficiency impacts Traffic jams in the city and the neighbourhood of the fair facilities because
of lorry deliveries from/to the exhibitions have been reduced dramatically.
Environmental impacts
Socio-economic impacts
Revenue generation
User acceptance The haulier appreciate the improved reliability in deliveries to/from the fair
compounds.
4 . L E S S O N S L E A R N T
Factors for success Involvement of stakeholders, detailed determination of functional
requirements
Obstacles

U R B A N I T S E X P E R T G R O U P
ITS Action Plan – Best Practices: Collection of projects 12
5 . M O R E I N F O R M A T I O N
Contact Person
Simon Benz
Rapp Trans AG
Web link (if existing)
http://www.performed.ch/index.php?m=2&id=8&PHPSESSID=529ig5g56f
gqhslrdisenqh067
http://www.messe.ch

U R B A N I T S E X P E R T G R O U P
ITS Action Plan – Best Practices: Collection of projects 13
3.4 DE - Düsseldorf – Dmotion, Cooperative Traffic Management in the Metropolitan
Area of Düsseldorf
URBAN ITS KEY APPLICATION
Traffic & Travel Information
Traffic & Access Management
Smart Ticketing
Urban Logistics
Other:
6 . G E N E R A L D E S C R I P T I O N
Problems to solve /
Objectives
Issue(s) encountered:
Traffic Management, Traffic Guidance, Traffic Incident Management
Objective(s) of the measure/service: To maximize the utilization of the regional and urban network
capacities in case of incidents and congestions
To coordinate strategy management between private actors and
traffic management centres of public authorities
Start of system/service 2010
Location single road/line city district whole city urban region
Transport mode(s)
concerned
public transport rail road car-sharing
bicycles pedestrians other:
Implementing
organisation
Authority of Düsseldorf, authority of Nordrhein Westfalen, Stadtwerke
Düsseldorf, private service provider PTV,
System / service
description
By establishing a data, information and strategy network between two
public authorities and a private service provider, an enhanced traffic state
analysis and a strategy management system will be provided. Road users
will receive information on current traffic conditions and traffic
management strategies via different media including dynamic routing
advices via online navigation services.
Technologies
Information broadcast by internet, freetext display panels (variable
message signs) and on-board navigation units in the whole network,
measurement support by adaptive traffic light control in the city of
Düsseldorf
Standards Communications standards OCIT and OTS
7 . I M P L E M E N T A T I O N
Partners involved
Public authorities: authorities of the city Düsseldorf and the county
Nordrhein-Westfalen,
Private stakeholders: private service provider PTV
Others: municipal utility company of Düsseldorf
Organisational model
Management body: see above
Operating body: see above
Financing body: public funded R&D-project
Business model
Public investment:
Private / commercial framework:
Public-private partnership:

U R B A N I T S E X P E R T G R O U P
ITS Action Plan – Best Practices: Collection of projects 14
Investment costs €: 12 Million €
Operating costs € / year: person / year:
8 . R E S U L T S
Technical performance
The evaluation of traffic conditions, the selection of appropriate strategies
and the adjustment of coherent strategies between the centres of the city
and the county are executed automatically.
Implementation of
Innovation
Safety impacts
Efficiency impacts
Environmental impacts
Socio-economic impacts
Revenue generation
User acceptance
9 . L E S S O N S L E A R N T
Factors for success Cooperation model between different authorities
Obstacles
1 0 . M O R E I N F O R M A T I O N
Contact Person
Name: Mr. Heiko Böhme
Company: Authority of Düsseldorf
Email: [email protected]
Phone: +49 2118993672
Web link (if existing) www.dmotion.info

U R B A N I T S E X P E R T G R O U P
ITS Action Plan – Best Practices: Collection of projects 15
3.5 DE - Munich - Tram and Bus Priority at Traffic Signal, “Green Waves”
URBAN ITS
KEY APPLICATION
Traffic & Travel Information
Traffic & Access Management
Smart Ticketing
Urban Logistics
Other:
1 . G E N E R A L D E S C R I P T I O N
Problems to solve /
Objectives
Issue(s) encountered: mitigation of individual drivers demand for ‘green
waves’ with the necessity of maintaining schedule of public transports
Objective(s) of the measure/service: keep fluidity of traffic flow and
maintain public transport efficiency
Start of system/service Since 1994 in Munich, implemented for all of the 10 Munich tram lines
plus 4 bus lines.
Location single road/line city district whole city urban region
Transport mode(s)
concerned
public transport rail road car-sharing
bicycles pedestrians other:
Implementing
organisation
System / service
description
A traffic control measure for public transport prioritisation: the system is
speeding up public transport as well as obtaining advantages of green
Waves (compensation and overall optimisation). The traffic control
measure operates hierarchically with several different levels of
prioritisation in the case that both trams and buses have to be taken into
consideration.
240 prioritising traffic signal systems in Munich.
Two tram lines at a main road section in Munich have been equipped with
a public transport speedup within a Green Wave.
Technologies
Standards
2 . I M P L E M E N T A T I O N
Partners involved
Public authorities:
Private stakeholders:
Others:
Organisational model
Management body:
Operating body:
Financing body:
Business model
Public investment:
Private / commercial framework:
Public-private partnership:
Investment costs €:
Operating costs € / year: person / year:
U R B A N I T S E X P E R T G R O U P
ITS Action Plan – Best Practices: Collection of projects 16
3 . R E S U L T S
Technical performance
Deployment of public transport speedup within a Green Wave for two
tram lines at a main road section in Munich, with an average daily traffic
volume of approximately 50.000 vehicles.
Implementation of
Innovation
Safety impacts
Efficiency impacts
Travel efficiency: increase of travelling speed of private individual traffic in
the Green Wave by 15%; traffic flow maintained.
Public transport: reduction of the number of delayed trips by 38%
Environmental impacts
Socio-economic impacts
Cost of Fleet utilisation (personnel and vehicle operating costs): -
4.200.000 €/year
Saving estimated of 15% in operation costs for public transports.
Revenue generation
User acceptance
4 . L E S S O N S L E A R N T
Factors for success
By providing an efficient tram prioritisation and increasing the travelling
speed for private transport in the Green Wave, the traffic situation could
get improved remarkably. In addition, further approaches for optimising
the Green Wave were suggested.
Obstacles
5 . M O R E I N F O R M A T I O N
Contact Person
Source: TEC Traffic Engineering and Control, Hemming Group Ltd.
London, issue 01/2007 ; Doll, C.; Listl, G.
Function:
Company:
Email:
Phone:
Web link (if existing)
U R B A N I T S E X P E R T G R O U P
ITS Action Plan – Best Practices: Collection of projects 17
3.6 DE - Berlin - Inner City Logistics
URBAN ITS
KEY APPLICATION
Traffic & Travel Information
Traffic & Access Management
Smart Ticketing
Urban Logistics
Other:
1 . G E N E R A L D E S C R I P T I O N
Problems to solve /
Objectives
Issue(s) encountered: impact of massive presence of lorries in inner city,
poor use of logistic centres intending to dispatch freight to smaller
vehicles
Objective(s) of the measure/service: Increase and improve freight
management and inter-modal transfer
Start of system/service 2002-2005
Location single road/line city district whole city urban region
Transport mode(s)
concerned
public transport rail road car-sharing
bicycles pedestrians other: Freight stakeholders
Implementing
organisation
System / service
description
CIVITAS project “Inner City Logistics Centre” included:
Acceptance improvement of the newly established tri-modal logistic
centre “Westhafen”.
Promotion of and support to the introduction of CNGpowered
distribution lorries by the haulage companies which handle the
transport operations between the logistic centre and the freight
recipients.
Telematics-based container tracking system (200 units) was intended
to be applied by Zapf Umzüge GmbH for inter-modal freight transport
from one of the two inner-city logistics centres.
Technologies
Standards
2 . I M P L E M E N T A T I O N
Partners involved
Public authorities: City of Berlin
Private stakeholders: Freight transporter
Others:
Organisational model
Management body:
Operating body:
Financing body:
Business model
Public investment:
Private / commercial framework:
Public-private partnership:
Investment costs €:

U R B A N I T S E X P E R T G R O U P
ITS Action Plan – Best Practices: Collection of projects 18
Operating costs € / year: person / year:
3 . R E S U L T S
Technical performance
Reliability was confirmed in the test phase much to the satisfaction of the
freight company. As of June 2005 the five prototypes have been operated
largely free of maintenance needs ever since the test phase in February
2003.
According to the freight operator the system with all its individual
components proved successful in real operations. A conclusive assessment
is not possible due to the limited number of prototypes.
Implementation of
Innovation
Safety impacts
Efficiency impacts
Environmental impacts
Socio-economic impacts
Revenue generation
User acceptance Tracking system (verification of a container’s position on map) was
positively assessed by the freight responsible personnel.
4 . L E S S O N S L E A R N T
Factors for success
Economic efficiency: the main reason for the loading of containers onto
rail is the reduction of costs.
Planning security for the Treptow-Neukölln site. Berlin’s local authorities
must guarantee that the area as a whole remains available for the inner-
city logistics centre and is not given over to other use.
Major campaign to attract new customers.
Improvement in combined transport. With the acquisition of new
customers, overnight rail transport between all important German
conurbations should gradually be established.
Transparency of rail and ship transport: responsible employee can at any
time determine online the precise location of a container, irrespective of
whether transport is by lorry, ship or rail.
Environment-orientated transport concept for the logistics sites.
Preferential treatment for the environmentally friendly transport of goods
in Berlin.
Increasing and extending the motorway toll on heavy-duty vehicles.
Obstacles
Availability of inner-city loading facilities for transferring containers to rail.
Offers for combined transport: regular combined-transport connections to
all important conurbations are indispensable.
The introduction of a motorway toll in Germany, which had been expected
to stimulate a modal shift in favour of rail-bound transportation of goods,
was considerably delayed.
5 . M O R E I N F O R M A T I O N
Contact Person
Sources: (1) Integrated Transport Planning TU Berlin; Kracker E. ;Becker
H.J.; Runge D.
(2) Social Science Research Centre Berlin (WZB); Karl A.

U R B A N I T S E X P E R T G R O U P
ITS Action Plan – Best Practices: Collection of projects 19
(3) Öko-Institut e.V.; Zimmer W.; Schmied M.
(4) Centre for Technology and Society (CTS) TU Berlin; Schönberg M.
Web link (if existing)

U R B A N I T S E X P E R T G R O U P
ITS Action Plan – Best Practices: Collection of projects 20
3.7 DE - Berlin - Integrated Real-Time based Travel Information Services for Public
Transport, VBB Berlin Brandenburg
URBAN ITS KEY APPLICATION
Traffic & Travel Information
Traffic & Access Management
Smart Ticketing
Urban Logistics
Other:
1 . G E N E R A L D E S C R I P T I O N
Problems to solve /
Objectives
Issue(s) encountered:
An actual and reliable traveller information is an important service for
public transport users. Therefore the integrated realtime-based public
transport information service in VBB’s service area with around 40 public
transport operators has being set up and is further developed.
Objective(s) of the measure/service:
Making the usage of public transport as easy and reliable as possible.
Start of system/service Step-by-step since 2006
Location single road/line city district whole city X urban region
Transport mode(s)
concerned
X public transport X rail road car-sharing
X bicycles X pedestrians X other: flights
Implementing
organisation
VBB Verkehrsverbund Berlin-Brandenburg GmbH (Public Transport
Authority)
System / service
description
VBB’s travel planning system «VBB-Fahrinfo» contains integrated
regional, national and international travel information as well as barriere-
free information and realtime data. It serves as well as regional realtime
data exchange platform for VBB and its operators.
Public transport information is combined with pedestrians and bicycle
information for the whole travel chain. Currently 12 transport operators
act as suppliers of realtime data for traveller information and connection
management between rail and busses.
Technologies
VBB’s information service is available on the internet and for most mobile
devices (iPhone, Android, Blackberry, JAVA and XHTML). VBB-Fahrinfo is
connected in the German national network (DELFI) and the European
information network EU-Spirit.
Standards German VDV-Standards for Public Transport planning and operation
2 . I M P L E M E N T A T I O N
Partners involved
X Public authority: VBB
X Private stakeholders: VBB’s subcontractors
X Others: Transport operators as suppliers of data and information
needed
Organisational model
X Management body: VBB (Coordination, concept and contracting)
X Operating body: VBB and VBB’s subcontractors (HaCon Ingenieur-
gesellschaft as system supplier and IVU Traffic Technologies for data
integration and management). Public Transport operators through
delivering the data and information needed.
X Financing body: VBB’s public stakeholder (German Lands Berlin and
Brandenburg and municipal cities and districts) through financing VBB’s
activites.
Business model X Public investment:
Private / commercial framework:

U R B A N I T S E X P E R T G R O U P
ITS Action Plan – Best Practices: Collection of projects 21
Public-private partnership:
Investment costs €:
Operating costs € / year: person / year:
3 . I M P L E M E N T A T I O N
Partners involved
Public authorities:
Private stakeholders:
Others:
Organisational model
Management body:
Operating body:
Financing body:
Business model
Public investment:
Private / commercial framework:
Public-private partnership:
Investment costs €:
Operating costs € / year: person / year:
4 . R E S U L T S
Technical performance
Implementation of
Innovation
Safety impacts
Efficiency impacts
Environmental impacts
Socio-economic impacts
Revenue generation
User acceptance

U R B A N I T S E X P E R T G R O U P
ITS Action Plan – Best Practices: Collection of projects 22
5 . L E S S O N S L E A R N T
Factors for success
Obstacles
6 . M O R E I N F O R M A T I O N
Contact Person
Name:
Function:
Company:
Email:
Phone:
Web link (if existing)

U R B A N I T S E X P E R T G R O U P
ITS Action Plan – Best Practices: Collection of projects 23
3.8 DE - Deutsche Bahn: Touch & Travel (NFC Pilot)
URBAN ITS
KEY APPLICATION
Traffic & Travel Information
Traffic & Access Management
Smart Ticketing
Urban Logistics
Other:
1 . G E N E R A L D E S C R I P T I O N
Problems to solve /
Objectives
Issue(s) encountered:
Customers of the public transport usually must buy a ticket before the
trip. Therefore the customer must know the tariff to be applied, has to go
to a ticket machine or ticket counter and needs money or credit card.
Objective(s) of the measure/service:
to simplify the access to the public transport and offering a continual
chain of travel throughout Germany.
Start of system/service 2008
Location single road/line city district whole city urban region
Transport mode(s)
concerned
public transport rail road car-sharing
bicycles pedestrians other:
Implementing
organisation
System / service
description
After a singleton registration process, the customer could check in at the
starting point and has to check out at his final destination for every trip
only with his mobile. The check-in- and the check-out-process as well are
supported by NFC-Tags, 2D-barcodes and GPS detection. This information
and the location during the trip are collected by a backbone. With that
data the backbone calculates the price for each taken trip.
The customer doesn’t need knowledge about the tariff because the system
always calculates the suitable price of the trip automatically. Afterwards
he gets the bill for taken trips monthly.
During the registration process the customer has to give personal
information and his consent to take part at a debiting procedure.
Afterwards the application is being downloaded on his mobile.
During the trip, a conductor can control the validity of the entitlement,
which is stored at the mobile. He is doing that with an electronic device by
using the NFC interface or reading a barcode representing the entitlement
from the display of the mobile.
Technologies
Standards
2 . I M P L E M E N T A T I O N ( No information available for VDV KA KG actually)
Partners involved
Public authorities:
Private stakeholders: ATRON GmbH, Vodafone, Giesecke&Devrient,
Samsung, NXP, Motorola,
Others:
U R B A N I T S E X P E R T G R O U P
ITS Action Plan – Best Practices: Collection of projects 24
Organisational model
Management body:
Operating body:
Financing body:
Business model
Public investment:
Private / commercial framework:
Public-private partnership:
Investment costs €:
Operating costs € / year: person / year:
3 . R E S U L T S
Technical performance
The system had started with approximately 300 friendly users. After the
first test period further developments has occurred. Since 2010 the
system has become open for every interested customer. It can be used
with NFC-mobiles from Samsung and Motorola and with the non-NFC-
mobiles iPhone and each Android-platform.
Actually Touch&Travel can be used in the Rhein-Main-Verkehrsverbund, in
Berlin-Brandenburg and on each long distance route.
Implementation of
Innovation
By using a NFC-mobile, the application consists of two parts: one part
that is responsible for the MMI and is located in the unsecure part of the
mobile. The other part is the user media of the VDV coreapplication. The
user media manages the secure administration of entitlements between
the customer device and the backbone as well as terminals.
A trusted service management platform is able to transmit the VDV
coreapplication after an authorized request to the NFC-mobile in a secure
manner.
For check-in and check-out the NFC-mobile has to read a passive NFC-tag
- the mobile is in active mode. In case of controlling tickets, an electronic
device in the hand of the conductor checks the validity of the entitlement
after reading it from the user media. The mobile is in passive mode. To
use both modes in one business process for such a complicated
communication is remarkable.
Safety impacts No information available for VDV KA KG actually
Efficiency impacts No information available for VDV KA KG actually
Environmental impacts No information available for VDV KA KG actually
Socio-economic impacts No information available for VDV KA KG actually
Revenue generation No information available for VDV KA KG actually
User acceptance
The customer likes the easy and fast access to the public transport and
that the system could determine the cheapest price. He feels comfortable
in having an overview about the taken trips monthly.
He wants to have season tickets and special offers on Touch&Travel
available too. Season tickets seems to be possible whereas special offers
including reservation don’t match to the concept of Touch&Travel.

U R B A N I T S E X P E R T G R O U P
ITS Action Plan – Best Practices: Collection of projects 25
4 . L E S S O N S L E A R N T
Factors for success
The technical challenges of Touch&Travel are very high. It was very
helpful, to have very motivated and competent partners at the project.
Obvious there are partners in the project with a high impact on
standardisation, the necessary changes needs a very long time before it
has an effect on customer products. Therefore it is important to do
alternative steps in order to keep the positive things of Touch&Travel in
mind until the needed technology is available.
Obstacles
For the full functionality of Touch&Travel with the highest level of security,
NFC-mobiles with an implemented secure element have to be available.
The NFC-mobiles must support passive and active mode and fulfil the
requirements of the VDV coreapplication in order to transmit long
command sequences. It still isn’t a mobile device for consumer market
available, despite of the several announcements and it is even difficult, to
get a prototype of a NFC-mobile device.
5 . M O R E I N F O R M A T I O N
Contact Person
Name: Birgit Wirth
Function: senior project manager
Company:
Email: [email protected]
Phone: +49 69-265-17716
Web link (if existing) www.touchandtravel.de
U R B A N I T S E X P E R T G R O U P
ITS Action Plan – Best Practices: Collection of projects 26
3.9 DE - Stuttgart - Integrated Traffic Management Centre Focuses on Collaboration and
Information Sharing
URBAN ITS KEY APPLICATION
Traffic & Travel Information
Traffic & Access Management
Smart Ticketing
Urban Logistics
Other:
1 . G E N E R A L D E S C R I P T I O N
Problems to solve /
Objectives
Issue(s) encountered: Concerted Traffic management and control in
Stuttgart
Objective(s) of the measure/service: Different authorities (road and
planning authority, police, public transport) work together in a single
TMC-Centre, in a cooperative way. Thus separate measures of different
bodies are adjusted and harmonised to avoid contradicting impact on
traffic.
Start of system/service 2006
Location single road/line city district whole city urban region
Transport mode(s)
concerned
public transport rail road car-sharing
bicycles pedestrians other: special mass events
Implementing
organisation
Alliance of road and planning authorithy, police and public transport
operator
System / service
description
Traffic management system integrating different control, guidance and
information systems with comprehensive tools influencing traffic
dissemination and flow using road side infrastructure and internet and
radio based traveller information services
Technologies Traffic light system, park and guidance system, dynamic lane
management, dynamic network control, VMS, digital video system
Standards OCIT - Open communication interface for traffic control
2 . I M P L E M E N T A T I O N
Partners involved
Public authorities: police department, traffic and planning department,
public transport authority
Private stakeholders:
Others:
Organisational model
Management body: City authority
Operating body: Working partnership (city authorities, police, public
transport authorities)
Financing body: city authority
Business model
Public investment:
Private / commercial framework:
Public-private partnership:
Investment costs €:
Operating costs € / year: n/a person / year: 17

U R B A N I T S E X P E R T G R O U P
ITS Action Plan – Best Practices: Collection of projects 27
3 . R E S U L T S
Technical performance
Implementation of
Innovation
Innovation is the mode of co-operation and collaboration of legally
autonomous bodies based of common partner arrangement, signed by all
partners
Safety impacts
No figures available (Timely and effective concerted traffic management
serves to mitigate safety impacts. Quick and consistent traveller
information contributes to safety, as well informed travellers adapt their
driving behaviour to current conditions)
Efficiency impacts
No figures available (Main benefit in terms of network efficiency is the
reduction of delays and travel time through the use of effective and timely
control and information measures in case of major incidents)
Environmental impacts
No figures available (traffic mamnagement and traveller information
contributed to the reduction in energy consumption with commensurate
impacts on CO2 emissions.
Socio-economic impacts no figures available (improvement of modal split is possible)
Revenue generation no figures available
User acceptance No figures available (acceptence of VMS up to 60 %)
4 . L E S S O N S L E A R N T
Factors for success
Cooperation and colaboration model of autonomous authorities, possibility
of quick reaction caused of the immediate adjustment of measures based
on a personal
Obstacles Lacking cooperation model with the motorway road operators
5 . M O R E I N F O R M A T I O N
Contact Person
Name: Dipl.-Ing. (FH) Dirk Herrmann
Function: Traffic Manager
Company: Tiefbauamt Stuttgart, Abteilung Straßen und Verkehr, Hohe
Strasse 25, 70176 Stuttgart
Email: [email protected]
Phone: +49 711 216 - 1562
Web link (if existing)
U R B A N I T S E X P E R T G R O U P
ITS Action Plan – Best Practices: Collection of projects 28
3.10 DE - Munich - Public Transport, Information Management System
URBAN ITS
KEY APPLICATION
Traffic & Travel Information
Traffic & Access Management
Smart Ticketing
Urban Logistics
Other:
1 . G E N E R A L D E S C R I P T I O N
Problems to solve /
Objectives
Issue(s) encountered: information management system for the
distribution of realtime passanger information of several itcs in public
transport environment
Objective(s) of the measure/service: sharing realtime passanger
information and system messages between several itcs systems
Start of system/service 2006
Location single road/line city district whole city urban region
Transport mode(s)
concerned
public transport rail road car-sharing
bicycles pedestrians other:
Implementing
organisation Stadtwerke München GmbH, SWM, local public transport operator
System / service
description realtime passinger information, information sharing system
Technologies internet protocol, xml, database, realtime information systems
Standards VDV 453 and VDV 454
2 . I M P L E M E N T A T I O N
Partners involved
Public authorities: City Munich
Private stakeholders:
Others: Public transport operators in Munich and other puplic transport
authorities in bavaria/germany
Organisational model
Management body: SWM
Operating body: SWM
Financing body:
Business model
Public investment:
Private / commercial framework:
Public-private partnership:
Investment costs €: 5 Mill.€ + annual maintenace 0.3 Mill €
Operating costs € / year: person / year: 3
3 . R E S U L T S
Technical performance
system is managing and distributing passanger realtime information for
5000 stops and four itcs systems and provides information for more than
500 different displays and internet platform
Implementation of
Innovation 2005
U R B A N I T S E X P E R T G R O U P
ITS Action Plan – Best Practices: Collection of projects 29
Safety impacts
Efficiency impacts reducing interfaces between systems and reducing complexity. Efficient
Use of different information channels e.g. passenger information displays
Environmental impacts more and better information helps to use more public transport
Socio-economic impacts very high; e. g. more than 50.000 users of the internet platform
Revenue generation no direct revenue generation, better service generates more passengers
User acceptance
User PT Operator: itcs is needed for an efficient operation, USER
Passenger: Passengers are asking for real time information and
coordinated service
4 . L E S S O N S L E A R N T
Factors for success professionals in the company, understanding the systems and the
passanger/user
Obstacles implementation of interfaces, handling mass data
5 . M O R E I N F O R M A T I O N
Contact Person
Name: Claudius Blank
Function: Leader IT-Systeme U-Bahn
Company: Stadtwerke München GmbH
Email: [email protected]
Phone: +49 89 2191-2372
Web link (if existing)

U R B A N I T S E X P E R T G R O U P
ITS Action Plan – Best Practices: Collection of projects 30
3.11 DE - Cologne - Intermodal Transport Control System for Public Transport
URBAN ITS
KEY APPLICATION
Traffic & Travel Information
Traffic & Access Management
Smart Ticketing
Urban Logistics
Other:
1 . G E N E R A L D E S C R I P T I O N
Problems to solve /
Objectives
Issue(s) encountered: intermodal transport control system for public
transport
Objective(s) of the measure/service: Optimized transport services, Real
Time Information, disturbance management, efficient use of infrastructure
and vehicles, traffic signal priorisation, radio communication
Start of system/service first itcs in 1970ies, new system with digital radio in 2003
Location single road/line city district whole city urban region
Transport mode(s)
concerned
public transport rail road car-sharing
bicycles pedestrians other:
Implementing
organisation Koelner Verkehrsbetriebe AG, KVB, local public transport operator
System / service
description
Fleet management, coordinate transport services, real time passenger
information, disturbance mangement, efficient use of infrastructur and
vehicles, traffic signal priorisation, radio communication
Technologies computer based traffic management system, real time information
provision with passenger information displays, digital radio TETRA, etc.
Standards VDV 300, VDV 730, VDV420, VDV 421, VDV 422, VDV 423, VDV 424, VDV
450, VDV 451, VDV 452, VDV 453, VDV 454, TETRA, TS 15531, etc.
2 . I M P L E M E N T A T I O N
Partners involved
Public authorities: City Cologne
Private stakeholders:
Others: Public Transport operators Cologne, Bonn, Public Transport
Cooperation Rhein Sieg
Organisational model
Management body: KVB
Operating body: KVB
Financing body:
Business model
Public investment:
Private / commercial framework:
Public-private partnership:
Investment costs €: 20 Mill.€ + annual maintenace 0.6 Mill €
Operating costs € / year: person / year: 15
3 . R E S U L T S
Technical performance system controls 380 Light Rail + 320 Busses, 740 Real Time information
devices, 2000 radio devices, availability rate 99,8 %,
Implementation of
Innovation
U R B A N I T S E X P E R T G R O U P
ITS Action Plan – Best Practices: Collection of projects 31
Safety impacts train control system for light rail is seperated and an additional ITS
Efficiency impacts use of traffic light influence reduces number of public transport vehicles,
disturbance management generates coordinated use of vehicles
Environmental impacts more public transport means less use of resources (fuel/energy, CO2
emission, space, etc.)
Socio-economic impacts better public transport services will enhance the use of it, more
passengers, 275 Mill. passengers a year, increase of 2% to 3% a year
Revenue generation no direct revenue generation, better service generates more passengers
User acceptance
User PT Operator: itcs is needed for an efficient operation, USER
Passenger: Passengers are asking for real time information and
coordinated service
4 . L E S S O N S L E A R N T
Factors for success
Obstacles e. g. availability of frequencies for the digital radio,
5 . M O R E I N F O R M A T I O N
Contact Person
Name: Dietmar Klein
Function: Leader processes & communication
Company: Koelner Verkehrsbetriebe AG
Email: [email protected]
Phone: +49 (221) 5473488
Web link (if existing)
U R B A N I T S E X P E R T G R O U P
ITS Action Plan – Best Practices: Collection of projects 32
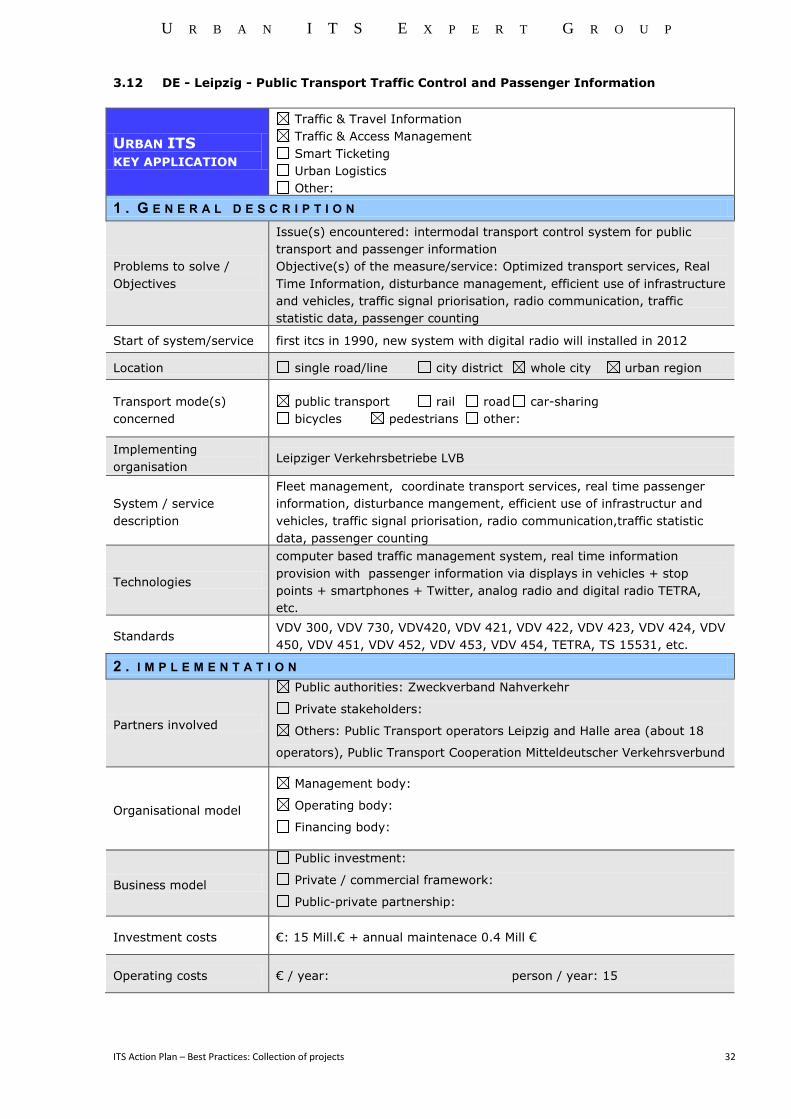
3.12 DE - Leipzig - Public Transport Traffic Control and Passenger Information
URBAN ITS
KEY APPLICATION
Traffic & Travel Information
Traffic & Access Management
Smart Ticketing
Urban Logistics
Other:
1 . G E N E R A L D E S C R I P T I O N
Problems to solve /
Objectives
Issue(s) encountered: intermodal transport control system for public
transport and passenger information
Objective(s) of the measure/service: Optimized transport services, Real
Time Information, disturbance management, efficient use of infrastructure
and vehicles, traffic signal priorisation, radio communication, traffic
statistic data, passenger counting
Start of system/service first itcs in 1990, new system with digital radio will installed in 2012
Location single road/line city district whole city urban region
Transport mode(s)
concerned
public transport rail road car-sharing
bicycles pedestrians other:
Implementing
organisation Leipziger Verkehrsbetriebe LVB
System / service
description
Fleet management, coordinate transport services, real time passenger
information, disturbance mangement, efficient use of infrastructur and
vehicles, traffic signal priorisation, radio communication,traffic statistic
data, passenger counting
Technologies
computer based traffic management system, real time information
provision with passenger information via displays in vehicles + stop
points + smartphones + Twitter, analog radio and digital radio TETRA,
etc.
Standards VDV 300, VDV 730, VDV420, VDV 421, VDV 422, VDV 423, VDV 424, VDV
450, VDV 451, VDV 452, VDV 453, VDV 454, TETRA, TS 15531, etc.
2 . I M P L E M E N T A T I O N
Partners involved
Public authorities: Zweckverband Nahverkehr
Private stakeholders:
Others: Public Transport operators Leipzig and Halle area (about 18
operators), Public Transport Cooperation Mitteldeutscher Verkehrsverbund
Organisational model
Management body:
Operating body:
Financing body:
Business model
Public investment:
Private / commercial framework:
Public-private partnership:
Investment costs €: 15 Mill.€ + annual maintenace 0.4 Mill €
Operating costs € / year: person / year: 15
U R B A N I T S E X P E R T G R O U P
ITS Action Plan – Best Practices: Collection of projects 33
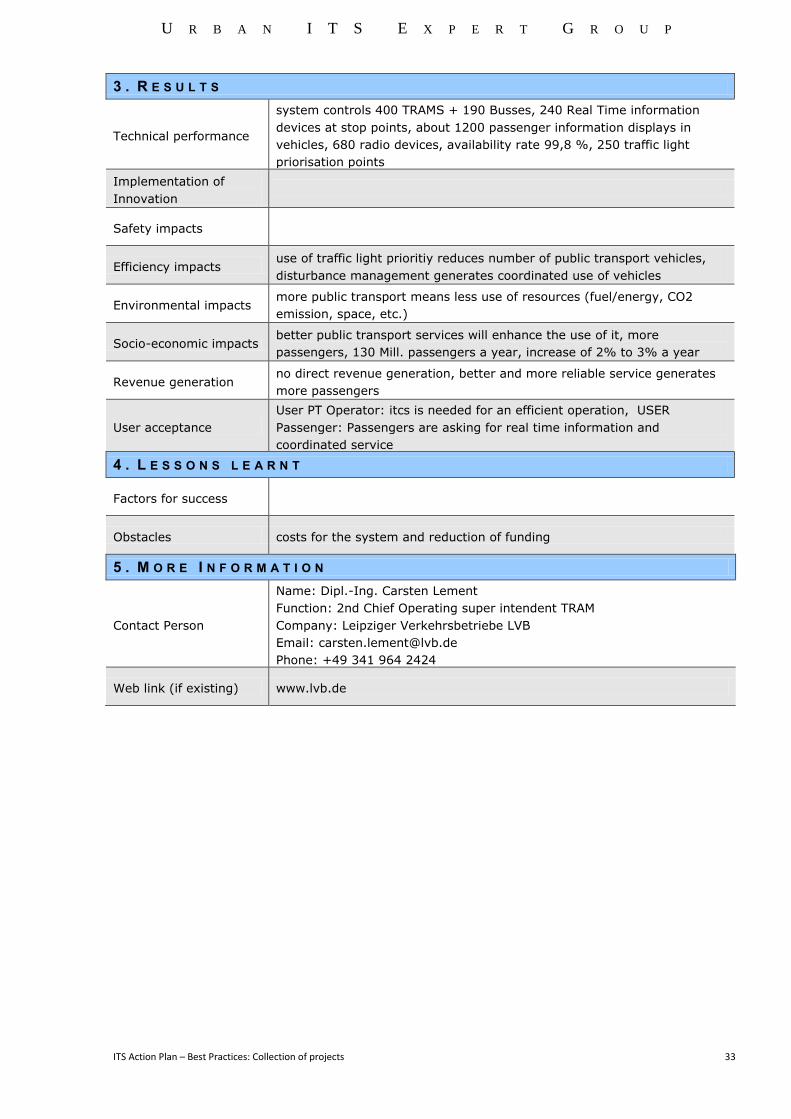
3 . R E S U L T S
Technical performance
system controls 400 TRAMS + 190 Busses, 240 Real Time information
devices at stop points, about 1200 passenger information displays in
vehicles, 680 radio devices, availability rate 99,8 %, 250 traffic light
priorisation points
Implementation of
Innovation
Safety impacts
Efficiency impacts use of traffic light prioritiy reduces number of public transport vehicles,
disturbance management generates coordinated use of vehicles
Environmental impacts more public transport means less use of resources (fuel/energy, CO2
emission, space, etc.)
Socio-economic impacts better public transport services will enhance the use of it, more
passengers, 130 Mill. passengers a year, increase of 2% to 3% a year
Revenue generation no direct revenue generation, better and more reliable service generates
more passengers
User acceptance
User PT Operator: itcs is needed for an efficient operation, USER
Passenger: Passengers are asking for real time information and
coordinated service
4 . L E S S O N S L E A R N T
Factors for success
Obstacles costs for the system and reduction of funding
5 . M O R E I N F O R M A T I O N
Contact Person
Name: Dipl.-Ing. Carsten Lement
Function: 2nd Chief Operating super intendent TRAM
Company: Leipziger Verkehrsbetriebe LVB
Email: [email protected]
Phone: +49 341 964 2424
Web link (if existing) www.lvb.de

U R B A N I T S E X P E R T G R O U P
ITS Action Plan – Best Practices: Collection of projects 34
3.13 DE - Intermodal Transport Control Systems for Public Transport
URBAN ITS
KEY APPLICATION
Traffic & Travel Information
Traffic & Access Management
Smart Ticketing
Urban Logistics
Other:
1 . G E N E R A L D E S C R I P T I O N
Problems to solve /
Objectives
Issue(s) encountered: PT itcs - control & steering of several modes of
public transport services, providing real time passenger information,
assuring service connections, disturbance management, provision of
communication channles for data exchange, etc.
Objective(s) of the measure/service: Optimize transport services and
make them efficient, Real Time Information, disturbance management,
efficient use of infrastructure and vehicles, traffic signal priorisation, radio
communication, traffic statistic data, passenger counting
Start of system/service
in the 1960´s first systems were installed in bigger cities in Germany,
since the 1990's systems were enhanced for intermodality, systems are
also installed now in cities and regions, PT-ITCS can be defined in 3
categories light, standard and advanced
Location single road/line city district whole city urban region
Transport mode(s)
concerned
public transport rail road car-sharing
bicycles pedestrians other:
Implementing
organisation
PT-ITCS are installed by public transport operators and public transport
cooperations
System / service
description
Fleet management, coordinate transport services, real time passenger
information, disturbance mangement, efficient use of infrastructur and
vehicles, traffic signal priorisation, radio communication,traffic statistic
data, passenger counting
Technologies
computer based traffic management system, real time information devices
via displays (LCD,LED, TFT) in vehicles + stop points + other
communication channels (smartphone, internet, ...), analog radio and
digital radio, connection to traffic lights
Standards VDV 300, VDV 730, VDV420, VDV 421, VDV 422, VDV 423, VDV 424, VDV
450, VDV 451, VDV 452, VDV 453, VDV 454, TETRA, TS 15531, etc.
2 . I M P L E M E N T A T I O N
Partners involved
Public authorities:
Private stakeholders:
Others:
Organisational model
Management body:
Operating body:
Financing body:
Business model
Public investment:
Private / commercial framework:
Public-private partnership:
Investment costs €:
Operating costs € / year: person / year:

U R B A N I T S E X P E R T G R O U P
ITS Action Plan – Best Practices: Collection of projects 35
3 . R E S U L T S
Technical performance
itcs is controlling all modes of public transport (Light Rail, TRAM, METRO,
Bus, ferry, on demand services, etc.), availability rate at least 99,8 %,
connection to traffic lights for the priorisation of public transport services
Implementation of
Innovation
Safety impacts
Efficiency impacts
use of traffic light prioritiy reduces number of public transport vehicles,
disturbance management generates coordinated use of vehicles and staff,
connection assurance makes travel chains more reliable for passengers,
etc.
Environmental impacts
better and reliable public transport services generating more use of public
transport that means less use of resources (fuel/energy, CO2 emission,
space, etc.)
Socio-economic impacts
better and reliable public transport services will enhance the use of it,
increase of passengers arround 0,8% per year (in 2010 9.672 Billion
travels in Germany)
Revenue generation no direct revenue generation, better and more reliable service generates
more passengers
User acceptance
User PT Operator: itcs is needed for an efficient operation, USER
Passenger: Passengers are asking for real time information and reliable
service
4 . L E S S O N S L E A R N T
Factors for success
Obstacles costs for the system and reduction of funding
5 . M O R E I N F O R M A T I O N
- Contact Person
- Name: Dipl.-Ing. Berthold Radermacher - Function: section leader - Company: Association of German Transport Companies, VDV
- Email: [email protected] - Phone: +49 221 57979 141
- Web link (if existing)
- www.vdv.de

U R B A N I T S E X P E R T G R O U P
ITS Action Plan – Best Practices: Collection of projects 36
3.14 DE - RNV Real-Time Passenger Information (Rhein-Neckar-Verkehr)
URBAN ITS
KEY APPLICATION
Traffic & Travel Information
Traffic & Access Management
Smart Ticketing
Urban Logistics
Other:
1 . G E N E R A L D E S C R I P T I O N
Problems to solve /
Objectives
Provision of urban wide real time passenger information in public
transport systems with standardized interfaces.
Start of system/service 10.09.2010
Location single road/line city district whole city urban region
Transport mode(s)
concerned
public transport rail road car-sharing
bicycles pedestrians other:
Implementing
organisation RNV- Rhein-Neckar-Verkehr GmbH
System / service
description
RNV Start.Info delivers real time passenger information directly to the
passengers mobile phone while the prognosis of departure times is
calculated directly by the ITCS: - provision of urban wide real time passenger information in public
transport sector of the Rhine Neckar metropolitan region including information on disruptions and news
- no connection information only departure times - especially made for bus and tram stops without stationary passenger
information - supports all RNV lines
Technologies Common (real time) public transport information system for mobile
phones (iPhone, Android)
Standards VDV454
2 . I M P L E M E N T A T I O N
Partners involved Public authorities: Private stakeholders: Others: The Agent factory (system provider, Jena, Germany)
Organisational model Management body: RNV Rhein-Neckar Verkehr Operating body: RNV Rhein-Neckar Verkehr Financing body: RNV Rhein-Neckar Verkehr
Business model Public investment: Private / commercial framework: Public-private partnership:
Investment costs €:
Operating costs € / year: person / year:
3 . R E S U L T S
Technical performance 1 Server
Implementation of
Innovation

U R B A N I T S E X P E R T G R O U P
ITS Action Plan – Best Practices: Collection of projects 37
Safety impacts
Efficiency impacts RNV wide dynamic passenger information system for mobile phones on
base of very high quality data
Environmental impacts more public transport means less use of resources (fuel/energy, CO2
emission, space, etc.)
Socio-economic impacts
Revenue generation
User acceptance ~ 30.000 downloads and 600.000 user requests in total (since
10.09.2010).
4 . L E S S O N S L E A R N T
Factors for success
- Maintanance of the platform by the system providers (RNV Start.Info and ITCS) is essential
- A very high quality data is essential
Obstacles
5 . M O R E I N F O R M A T I O N
Contact Person
Name: Marc Pätschke
Function: expert
Company: Rhein-Neckar Verkehr GmbH, Mannheim, Germany
Email: [email protected]
Phone:
Web link (if existing) www.rnv-online.de

U R B A N I T S E X P E R T G R O U P
ITS Action Plan – Best Practices: Collection of projects 38
3.15 DE - Karlsruhe - Handy Ticket KVV
URBAN ITS
KEY APPLICATION
Traffic & Travel Information
Traffic & Access Management
Smart Ticketing
Urban Logistics
Other:
1 . G E N E R A L D E S C R I P T I O N
Problems to solve /
Objectives
Issue(s) encountered: enhancement of the distribution channels
Objective(s) of the measure/service: distribution of tickets via mobile
phone (Java, Android, Iphone)
Start of system/service First steps in 2008, Rollout in 02/2010
Location single road/line city district x whole city x urban region
Transport mode(s)
concerned
public transport rail road car-sharing
bicycles pedestrians other:
Implementing
organisation
VBK (public transport company), KVV (transport association), supply with
public transport in the city of Karlsruhe and the neighbouring
administrative districts
System / service
description
With “Handy Ticket KVV” smartphone users can buy tickets (single or 24
h) for public transport. Possible with Java, Android and Iphone.
Independent of mobile telephone system companies.
Technologies Java, Android, Iphone
Standards Privacy policy
2 . I M P L E M E N T A T I O N
Partners involved
Public authorities: VBK,KVV
Private stakeholders:
Others:
Organisational model
Management body: VBK
Operating body: VBK
Financing body: VBK,KVV
Business model
Public investment:
Private / commercial framework:
Public-private partnership:
Investment costs €: 60.000
Operating costs € / year: 24.000 person / year: 0,1
3 . R E S U L T S
Technical performance Actual more than 7.500 tickets a month are sold, actual 1% of all tickets
(single and 24 h)
Implementation of
Innovation Independence of mobile telephone system companies
Safety impacts
Efficiency impacts Cut the distribution costs under the regular distribution costs, aim should
be reached next year

U R B A N I T S E X P E R T G R O U P
ITS Action Plan – Best Practices: Collection of projects 39
Environmental impacts Less paper waste, less paper produced
Socio-economic impacts
Revenue generation Lower distribution costs cut the rise in prices for public transport tickets
User acceptance Increase in use actual 6% per month
4 . L E S S O N S L E A R N T
Factors for success the high number of smartphones sold in the last 2 years, usability
Obstacles The registration has to be filled in online
5 . M O R E I N F O R M A T I O N
Contact Person
Name: Bock, Benjamin
Function: sales manager
Company: VBK
Email:
Phone:
Web link (if existing) http://www.kvv.de/fahrkarten/fahrkarten-verkauf/handy-ticket.html
U R B A N I T S E X P E R T G R O U P
ITS Action Plan – Best Practices: Collection of projects 40
3.16 DE - Implementation of ITCS for 250 Light Rail Vehicles and 80 Buses
URBAN ITS
KEY APPLICATION
Traffic & Travel Information
Traffic & Access Management
Smart Ticketing
Urban Logistics
Other:
1 . G E N E R A L D E S C R I P T I O N
Problems to solve /
Objectives
Issue(s) encountered: intermodal transport control system for public
transport
Objective(s) of the measure/service: optimized data supply and
management, real time information, optimized dispatching of vehicles,
radio communication
Start of system/service First RBL in 2000, itcs system update in 2009
Location single road/line city district whole city urban region
Transport mode(s)
concerned
public transport rail road car-sharing
bicycles pedestrians other:
Implementing
organisation
VBK and AVG, public transport companies, supply with public transport in
the city of Karlsruhe and the neighbouring administrative districts
System / service
description
coordinate transport services, real time passenger information,
disturbance mangement, efficient use of infrastructur and vehicles
Technologies
computer based traffic management system, real time information
provision with passenger information displays, data management via
GSM/UMTS
Standards VDV 300, VDV 410, VDV 160, etc.
2 . I M P L E M E N T A T I O N
Partners involved
Public authorities: City of Karlsruhe
Private stakeholders:
Others: KVV (Public Transport Cooperation Karlsruhe)
Organisational model
Management body: VBK
Operating body: VBK
Financing body: VBK
Business model
Public investment:
Private / commercial framework:
Public-private partnership:
Investment costs €: 4,5 Mio.
Operating costs € / year: 130.000 person / year: 3
3 . R E S U L T S
Technical performance System controls 250 light rail vehicles + 80 buses, 130 real time
information displays
Implementation of
Innovation
Safety impacts Better disturbance management
U R B A N I T S E X P E R T G R O U P
ITS Action Plan – Best Practices: Collection of projects 41
Efficiency impacts Coordinated use of vehicles and less delays
Environmental impacts Increasing rate in Modal Split means less use of energy resources
Socio-economic impacts
Coordinated vehicles and well-informed passengers enhance the use of
public transport, more than 180 mill. Passengers/year, increase of 9% in
the last 5 years
Revenue generation No direct revenue generation
User acceptance
Operator: work for the staff of the control station can be done faster and
more efficient; Passenger: real time information creates confidence to the
public transport system
4 . L E S S O N S L E A R N T
Factors for success Integration of the light rail vehicles, which go out in the rural areas
Obstacles Time for the installation into the light rail vehicles
5 . M O R E I N F O R M A T I O N
Contact Person
Name: Messerschmidt, Ralf
Function: operations manager
Company: VBK
Email:
Phone:
Web link (if existing)

U R B A N I T S E X P E R T G R O U P
ITS Action Plan – Best Practices: Collection of projects 42
3.17 DE - Provision of Nationwide and Europeanwide Public Transport Journey Planner
System (DELFI & EU-SPIRIT)
URBAN ITS KEY APPLICATION
Traffic & Travel Information
Traffic & Access Management
Smart Ticketing
Urban Logistics
Other:
1 . G E N E R A L D E S C R I P T I O N
Problems to solve /
Objectives
Provision of nationwide and European wide public transport journey
planner system (address sharp / pedestrian information) with
standardized interfaces using the DELFI and EU-SPIRIT platform
Start of system/service DELFI since 1999 and EU-Spirit 2011
Location single road/line city district whole city urban region
Transport mode(s)
concerned
public transport rail road car-sharing
bicycles pedestrians other:
Implementing
organisation
The German states or organisations on behalf of the them and the public
transport companies in this state
System / service
description
Interconnection of public transport routing system with other public
transport journey planner systems of other German states via the
interfaces of the DELFI Platform and Interconnection of public transport
routing system with other public transport journey planner systems in
Europe via the interfaces of the EU-Spirit Platform.
Technologies Common public transport routing systems
Standards VDV 300, VDV 730, VDV420, VDV 421, VDV 422, VDV 423, VDV 424, VDV
450, VDV 451, VDV 452, VDV 453, VDV 454, TETRA, TS 15531, etc.
2 . I M P L E M E N T A T I O N
Partners involved
Public authorities: Public transport operators and public transport
cooperations, DELFI consortium and EU-SPIRIT consortium
Private stakeholders: private railway companies
Others: Mentz DV, HBT, HACON
Organisational model
Management body: DELFI Consortium and EU-Spirit Consortium
Operating bodies: public transport companies, public transport
cooperations and public authorities
Financing body: German states
Business model
Public investment:
Private / commercial framework:
Public-private partnership:
Investment costs €:
Operating costs € / year: person / year:

U R B A N I T S E X P E R T G R O U P
ITS Action Plan – Best Practices: Collection of projects 43
3 . R E S U L T S
Technical performance
Implementation of
Innovation
Interconnection of journey planner systems, data management is still
local and due to the local data management is the data quality and
actually very high
Safety impacts
Efficiency impacts Nation/European wide journey planner information on base of very high
quality data
Environmental impacts more public transport means less use of resources (fuel/energy, CO2
emission, space, etc.)
Socio-economic impacts
Revenue generation
User acceptance
4 . L E S S O N S L E A R N T
Factors for success Organisation of the platforms by the data providers and connected
systems is essential
Obstacles Financing of the platform organisation
5 . M O R E I N F O R M A T I O N
Contact Person
Name: Berthold Radermacher
Function: section leader
Company: Association of German Transport Companies
Email: [email protected]
Phone: +49 221 57979 141
Web link (if existing) www.vdv.de

U R B A N I T S E X P E R T G R O U P
ITS Action Plan – Best Practices: Collection of projects 44
3.18 DE - Integration of Regional Public Transport Routing Information System within the
Public Transport Network of Nation- and Europeanwide Journey Planner
URBAN ITS KEY APPLICATION
Traffic & Travel Information
Traffic & Access Management
Smart Ticketing
Urban Logistics
Other:
1 . G E N E R A L D E S C R I P T I O N
Problems to solve /
Objectives
Issue(s) encountered: Integration of regional public transport routing
information system within the public transport network of Nation- and
European wide journey planner
Objective(s) of the measure/service: Integration of regional public
transport routing information within the of nationwide, europeanwide
public transport routing information (address sharp, pedestrian
information) based on the standardised interfaces using the DELFI and
EU-Spirit platform.
Start of system/service DELFI 1999, EU-SPIRIT 2011
Location single road/line city district whole city urban region
Transport mode(s)
concerned
public transport rail road car-sharing
bicycles pedestrians other:
Implementing
organisation
VRR on behalf of Northrhine Westfalia and the public transport companies
in NRW
System / service
description
Interconnection of Public transport routing systems with other public
transport routing system of other German states via the interfaces of
DELFI platform and interconnection of Public transport routing systems
with other public transport routing system in Europe via the interfaces of
the EU-Spirit platform
Technologies Common public journey planner and transport routing systems
Standards VDV 452, DELFI, EU-Spirit
2 . I M P L E M E N T A T I O N
Partners involved
Public authorities: DELFI Consortium, EU-Spirit Consortium
Private stakeholders:
Others: Mentz DV, HBT, HaCon
Organisational model
Management body: DELFI Consortium, EU-Spirit Consortium
Operating body: public transport companies and authorities
Financing body: German states
Business model
Public investment:
Private / commercial framework:
Public-private partnership:
Investment costs €:
Operating costs € / year: person / year:
3 . R E S U L T S
Technical performance 2 high performance Server

U R B A N I T S E X P E R T G R O U P
ITS Action Plan – Best Practices: Collection of projects 45
Implementation of
Innovation
Interconnection of journey planner system, data management is still local
and dual to the local data management is the data quality and actuality
very high
Safety impacts
Efficiency impacts Nation- / European Wide journey planner information based on very high
quality data and actuality
Environmental impacts
Socio-economic impacts
Revenue generation
User acceptance ca. 20 million users requests per month the journey planner system from
VRR region
4 . L E S S O N S L E A R N T
Factors for success Organisations of the platform by the data provider and connected systems
is essential
Obstacles Financing of the platform organisation
5 . M O R E I N F O R M A T I O N
Contact Person
Name: Sefa Tasdemir, Harald Gerstenberg
Function: expert
Company: VRR
Email: [email protected]
Phone:
Web link (if existing) http://www.delfi.de ; http://www.eu-spirit.com ; http://eu.efa.de
U R B A N I T S E X P E R T G R O U P
ITS Action Plan – Best Practices: Collection of projects 46
3.19 DE - Networking of Intermodal Passenger Travel Information and Real-Time in
Public-Transport (ITCS/RBL/FIS/ABF/RBL-Light etc.)
URBAN ITS KEY APPLICATION
Traffic & Travel Information
Traffic & Access Management
Smart Ticketing
Urban Logistics
Other:
1 . G E N E R A L D E S C R I P T I O N
Problems to solve /
Objectives
Issue(s) encountered: interconnection of existing Systems (itcs/ RBL/ FIS/
ABF/ RBL-Light etc.) for Traffic&Travel Information and Traffic&Access
Management
Objective(s) of the measure/service: Optimized transport services, Real
Time Information, disturbance management, efficient use of infrastructure
and vehicles, traffic signal priorisation, radio communication
Start of system/service central data hub for real-time data since 2006
Location single road/line city district whole city urban region
Transport mode(s)
concerned
public transport rail road car-sharing
bicycles pedestrians other:
Implementing
organisation
Transportation companies in North Rhine-Westphalia region and VRR (e.g.
Deutsche Bahn AG, private railway companies (Keolis, abellio,NWB, WFB,
RegioBahn, PEG…), public transport companies (EVAG, WSW,SWN, SWK,
HST, NVV, MVG, VES, STWMS, BGS…)
System / service
description
The central data pool connects and distributes information about the
services of all transport modes in one region, such as a mainline and local
services of Deutsche Bahn, private railway companies, rapid transit,
busses and tramways. Particularly at locations where different modes
converge, such as interchange stations, the central data pool provides
real-time data for passenger information systems. On the basis of this
real-time data, up-to-the-minute information about the current travel
situation is made available to passengers and gives them an overview of
all intermodal connections.
Technologies computer based traffic management system, real time information
provision with passenger information displays, digital radio TETRA, etc.
Standards VDV 300, VDV 730, VDV420, VDV 421, VDV 422, VDV 423, VDV 424, VDV
450, VDV 451, VDV 452, VDV 453, VDV 454, TETRA, TS 15531, etc.
2 . I M P L E M E N T A T I O N
Partners involved
X Public authorities: Deutsche Bahn AG, public transport companies
(EVAG, WSW,SWN, SWK, HST, NVV, MVG, VES, STWMS, BGS…)
X Private stakeholders: private railway companies (Keolis, abellio,NWB,
WFB, RegioBahn, PEG…)
Others: Funkwerk IT, Mentz DV, INIT, Trapeze, T-Systems,
Interautomation, CSC, Lumino etc
Organisational model
Management body: VRR
Operating body: public transport companies, Deutsche Bahn AG,
private railway companies
Financing body: NRW, VRR

U R B A N I T S E X P E R T G R O U P
ITS Action Plan – Best Practices: Collection of projects 47
Business model
Public investment:
Private / commercial framework:
Public-private partnership:
Investment costs €:
Operating costs € / year: person / year:
3 . R E S U L T S
Technical performance system controls 380 Light Rail + 320 Busses, 740 Real Time information
devices, 2000 radio devices, availability rate 99,8 %,
Implementation of
Innovation New solution with central data pool
Safety impacts
Efficiency impacts improved customer information
Environmental impacts more public transport means less use of resources (fuel/energy, CO2
emission, space, etc.)
Socio-economic impacts
• 25 cities • population: 8.1 million
• 7.400 km² • Travellers per year: 1.1 billion • Travellers per day: 3.0 million • a balanced offering of trains and buses
Revenue generation
User acceptance Customers are satisfied
4 . L E S S O N S L E A R N T
Factors for success Public transport companies and customers are satisfied
Obstacles old systems and implementation periods
5 . M O R E I N F O R M A T I O N
Contact Person
Name: Sefa Tasdemir, Harald Gerstenberg
Function: expert
Company: VRR
Email: [email protected]
Phone:
Web link (if existing) http://www.vrr.de ; http://efa.vrr.de

U R B A N I T S E X P E R T G R O U P
ITS Action Plan – Best Practices: Collection of projects 48
3.20 DE - Stuttgart - RBL Light, Intermodal Transport Control System
URBAN ITS
KEY APPLICATION
Traffic & Travel Information
Traffic & Access Management
Smart Ticketing
Urban Logistics
Other:
1 . G E N E R A L D E S C R I P T I O N
Problems to solve /
Objectives
Issue(s) encountered: 07/2010
Objective(s) of the measure/service: 450,000 €
Start of system/service 11/2011
Location single road/line city district whole city urban region
Transport mode(s)
concerned
public transport rail road car-sharing
bicycles pedestrians other:
Implementing
organisation Verkehrs- und Tarifverbund Stuttgart GmbH (VVS)
System / service
description
Intermodal Transport Control System “light” for small medium-sized
businesses depending a vehicle-monitoring and control system
Technologies Data-Management, GPS-Positioning, Mobile Services
Standards GPS, GSM, VDV 454
2 . I M P L E M E N T A T I O N
Partners involved
Public authorities: VVS
Private stakeholders: Kappus-Reisen GmbH & Co KG, Omnibus
Dannenmann GmbH, Württembergische Eisenbahn GmbH
Others:
Organisational model
Management body: VVS
Operating body: VVS, transportation companies: Kappus-Reisen GmbH
& Co KG, Omnibus Dannenmann GmbH, Württembergische Eisenbahn
GmbH
Financing body: VVS, Ministerum für Verkehr und Infrastruktur (MVI)
Business model
Public investment:
Private / commercial framework:
Public-private partnership: vehicle Equipment is funded by
transportation companies and MVI, all other parts are public investment
Investment costs €: 326,000
Operating costs € / year: 8,000 person / year:
3 . R E S U L T S
Technical performance Performing tests persist, accessibility is more than 95%
Implementation of
Innovation
Vehicle tests by transportation companies, data quality tests by VVS and
transportation companies
Safety impacts
Efficiency impacts
The dispatcher at the transporting company can localise its vehicles at any
time on screen and doesn’t need a mobile phone to connect the driver.
Statistics for the planner help to make schedules which fit to the real

U R B A N I T S E X P E R T G R O U P
ITS Action Plan – Best Practices: Collection of projects 49
journey-time
Environmental impacts
Socio-economic impacts
Revenue generation N/A
User acceptance Tests persist
4 . L E S S O N S L E A R N T
Factors for success Involvement of all partners, early tests in live systems, fast partial
success
Obstacles Match interfaces,
5 . M O R E I N F O R M A T I O N
Contact Person
Name: Anke Beckert
Function: Realtime Information Systems
Company: VVS
Email: [email protected]
Phone: +49 711 6606-2121
Web link (if existing) ww.vvs.de
U R B A N I T S E X P E R T G R O U P
ITS Action Plan – Best Practices: Collection of projects 50
3.21 DE - Stuttgart – VVS HandyTicket
URBAN ITS
KEY APPLICATION
Traffic & Travel Information
Traffic & Access Management
Smart Ticketing
Urban Logistics
Other:
1 . G E N E R A L D E S C R I P T I O N
Problems to solve /
Objectives
Issue(s) encountered: Easier access to public transport by creating a
ticketing system for mobile phones. Intermodal ticketing in other public
transport-regions, implementation of ticketing system in mobile journey
planning-tools.
Objective(s) of the measure/service: Reduction of distribution expenses,
Start of system/service 1/2012
Location single road/line city district whole city urban region
Transport mode(s)
concerned
public transport rail road car-sharing
bicycles pedestrians other:
Implementing
organisation
Project team based in the SSB in cooperation with VVS. Implemation
together with partners HanseCom and EOS Uptrade as partners.
System / service
description
Technologies
Standards
2 . I M P L E M E N T A T I O N
Partners involved
Public authorities: Stuttgarter Straßenbahnen AG (SSB)
Private stakeholders: HanseCom, EOS Uptrade
Others:
Organisational model
Management body: SSB/VVS
Operating body: HanseCom, EOS Uptrade
Financing body:
Business model
Public investment:
Private / commercial framework:
Public-private partnership:
Investment costs €: 150.000
Operating costs € / year: 5.000 person / year: 4
3 . R E S U L T S
Technical performance
Implementation of
Innovation
Safety impacts
U R B A N I T S E X P E R T G R O U P
ITS Action Plan – Best Practices: Collection of projects 51
Efficiency impacts
Environmental impacts
Socio-economic impacts
Revenue generation
User acceptance
4 . L E S S O N S L E A R N T
Factors for success
Obstacles
5 . M O R E I N F O R M A T I O N
Contact Person
Name:
Function:
Company:
Email:
Phone:
Web link (if existing)

U R B A N I T S E X P E R T G R O U P
ITS Action Plan – Best Practices: Collection of projects 52
3.22 DE - Stuttgart - Journey Planner (EFA)
URBAN ITS
KEY APPLICATION
Traffic & Travel Information
Traffic & Access Management
Smart Ticketing
Urban Logistics
Other:
1 . G E N E R A L D E S C R I P T I O N
Problems to solve /
Objectives
Issue(s) encountered: intermodal passenger information, travel alerts
Objective(s) of the measure/service: common information about pt
mobility
Start of system/service 1988
Location single road/line city district whole city urban region
Transport mode(s)
concerned
public transport rail road car-sharing
bicycles pedestrians other:
Implementing
organisation Verkehrs- und Tarifverbund Stuttgart GmbH (VVS)
System / service
description Intermodal journey planner, travel alerts
Technologies DIVA / EFA System by Mentz Datenverarbeitung GmbH (mdv)
Standards
2 . I M P L E M E N T A T I O N
Partners involved
Public authorities:
Private stakeholders:
Others:
Organisational model
Management body: Verkehrs- und Tarifverbund Stuttgart GmbH (VVS)
Operating body: Verkehrs- und Tarifverbund Stuttgart GmbH (VVS)
Financing body: Verkehrs- und Tarifverbund Stuttgart GmbH
(VVS)
Business model
Public investment: Verkehrs- und Tarifverbund Stuttgart GmbH (VVS)
Private / commercial framework:
Public-private partnership:
Investment costs €: 23 years of development, n/a
Operating costs € / year: n/a person / year: 3
3 . R E S U L T S
Technical performance 4 Live-Server, 99,5% accessibility
Implementation of
Innovation Realtime information
Safety impacts Not relevant
Efficiency impacts 10 Million calculated trip requests per month

U R B A N I T S E X P E R T G R O U P
ITS Action Plan – Best Practices: Collection of projects 53
Environmental impacts Enhancing green mobility, reduction of carbon dioxide emissions
Socio-economic impacts n/a
Revenue generation n/a
User acceptance 10 Million calculated trip requests per month, very high, increasing
4 . L E S S O N S L E A R N T
Factors for success Technological development in collaboration with user and developer
Obstacles none
5 . M O R E I N F O R M A T I O N
Contact Person
Name: Volker Torlach
Function: Project Manager EFA
Company: Verkehrs- und Tarifverbund Stuttgart GmbH (VVS)
Email: [email protected]
Phone: +49-711-6606-2120
Web link (if existing) http://www2.vvs.de
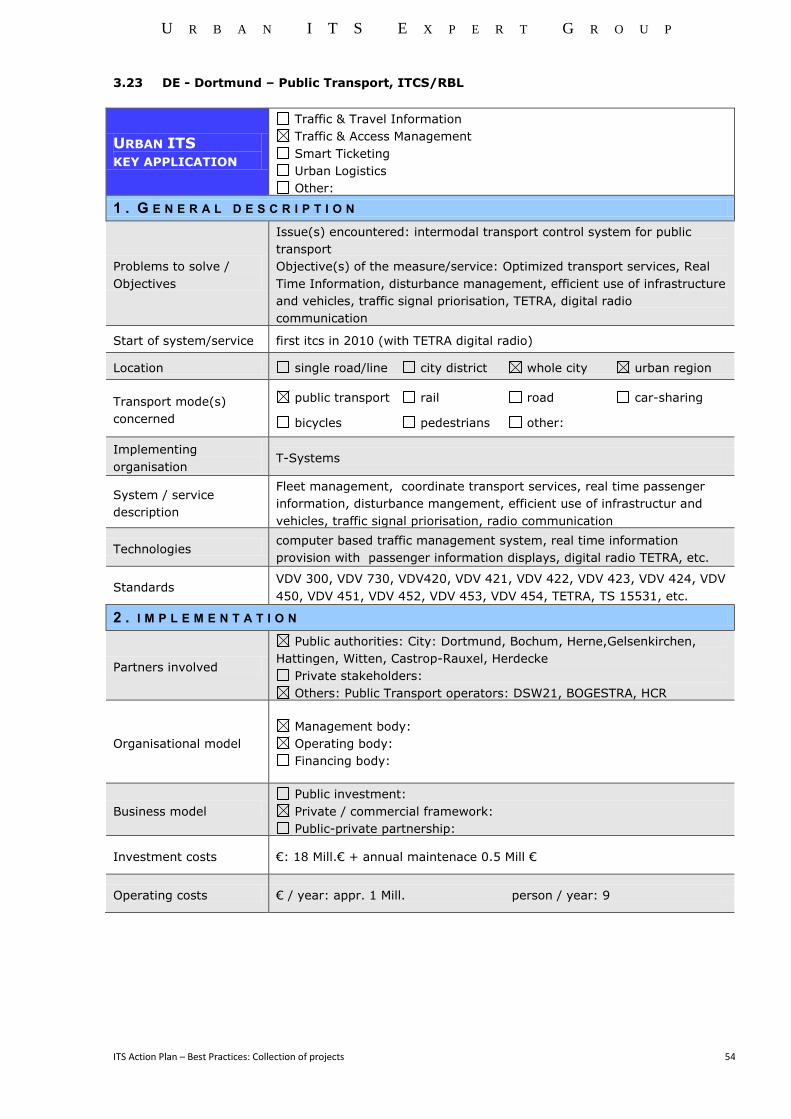
U R B A N I T S E X P E R T G R O U P
ITS Action Plan – Best Practices: Collection of projects 54
3.23 DE - Dortmund – Public Transport, ITCS/RBL
URBAN ITS
KEY APPLICATION
Traffic & Travel Information
Traffic & Access Management
Smart Ticketing
Urban Logistics
Other:
1 . G E N E R A L D E S C R I P T I O N
Problems to solve /
Objectives
Issue(s) encountered: intermodal transport control system for public
transport
Objective(s) of the measure/service: Optimized transport services, Real
Time Information, disturbance management, efficient use of infrastructure
and vehicles, traffic signal priorisation, TETRA, digital radio
communication
Start of system/service first itcs in 2010 (with TETRA digital radio)
Location single road/line city district whole city urban region
Transport mode(s)
concerned
public transport rail road car-sharing
bicycles pedestrians other:
Implementing
organisation T-Systems
System / service
description
Fleet management, coordinate transport services, real time passenger
information, disturbance mangement, efficient use of infrastructur and
vehicles, traffic signal priorisation, radio communication
Technologies computer based traffic management system, real time information
provision with passenger information displays, digital radio TETRA, etc.
Standards VDV 300, VDV 730, VDV420, VDV 421, VDV 422, VDV 423, VDV 424, VDV
450, VDV 451, VDV 452, VDV 453, VDV 454, TETRA, TS 15531, etc.
2 . I M P L E M E N T A T I O N
Partners involved
Public authorities: City: Dortmund, Bochum, Herne,Gelsenkirchen,
Hattingen, Witten, Castrop-Rauxel, Herdecke
Private stakeholders:
Others: Public Transport operators: DSW21, BOGESTRA, HCR
Organisational model
Management body:
Operating body:
Financing body:
Business model
Public investment:
Private / commercial framework:
Public-private partnership:
Investment costs €: 18 Mill.€ + annual maintenace 0.5 Mill €
Operating costs € / year: appr. 1 Mill. person / year: 9
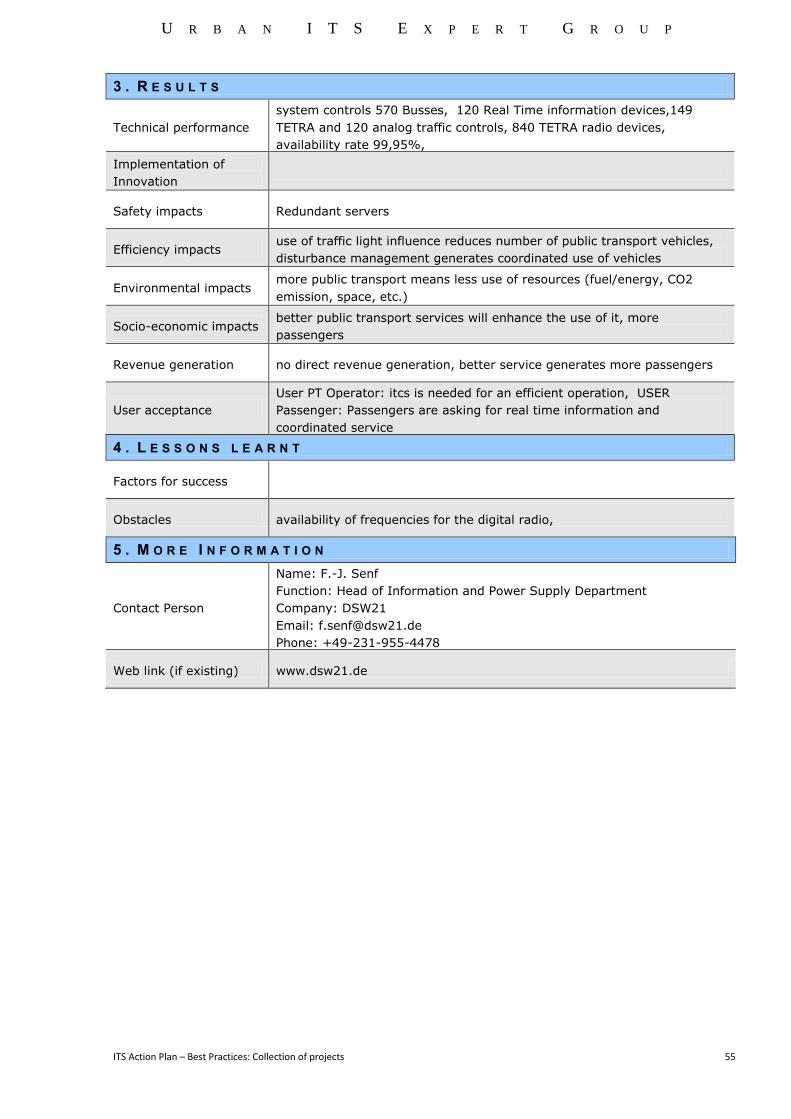
U R B A N I T S E X P E R T G R O U P
ITS Action Plan – Best Practices: Collection of projects 55
3 . R E S U L T S
Technical performance
system controls 570 Busses, 120 Real Time information devices,149
TETRA and 120 analog traffic controls, 840 TETRA radio devices,
availability rate 99,95%,
Implementation of
Innovation
Safety impacts Redundant servers
Efficiency impacts use of traffic light influence reduces number of public transport vehicles,
disturbance management generates coordinated use of vehicles
Environmental impacts more public transport means less use of resources (fuel/energy, CO2
emission, space, etc.)
Socio-economic impacts better public transport services will enhance the use of it, more
passengers
Revenue generation no direct revenue generation, better service generates more passengers
User acceptance
User PT Operator: itcs is needed for an efficient operation, USER
Passenger: Passengers are asking for real time information and
coordinated service
4 . L E S S O N S L E A R N T
Factors for success
Obstacles availability of frequencies for the digital radio,
5 . M O R E I N F O R M A T I O N
Contact Person
Name: F.-J. Senf
Function: Head of Information and Power Supply Department
Company: DSW21
Email: [email protected]
Phone: +49-231-955-4478
Web link (if existing) www.dsw21.de

U R B A N I T S E X P E R T G R O U P
ITS Action Plan – Best Practices: Collection of projects 56
3.24 DE – Logistic V-Info, Professional Tour Planning System
URBAN ITS
KEY APPLICATION
Traffic & Travel Information
Traffic & Access Management
Smart Ticketing
Urban Logistics
Other:
1 . G E N E R A L D E S C R I P T I O N
Problems to solve /
Objectives
Issue(s) encountered: distribution services of goods in urban area facing
traffic situation and delays
Objective(s) of the measure/service: integration of traffic
information on professional tour and logistics planning system
Start of system/service
Location single road/line city district whole city urban region
Transport mode(s)
concerned
public transport rail road car-sharing
bicycles pedestrians other:
Implementing
organisation PTV + Schober Logistics
System / service
description
professional tour planning system interfacing with public traffic
management centre
Technologies
Standards
2 . I M P L E M E N T A T I O N
Partners involved
Public authorities:
Private stakeholders: LSP
Others: Traffic management centre
Organisational model
Management body:
Operating body:
Financing body:
Business model
Public investment:
Private / commercial framework:
Public-private partnership:
Investment costs €:
Operating costs € / year: person / year:
3 . R E S U L T S
Technical performance stabile and usable for day to day business solution
Implementation of
Innovation
interfacing traffic information with tour planning system, routines
for processing of traffic information with sufficient performance
Safety impacts
U R B A N I T S E X P E R T G R O U P
ITS Action Plan – Best Practices: Collection of projects 57
Efficiency impacts better planned tours and more reliable tour plans
Environmental impacts savings of driven km of about 5%
Socio-economic impacts
Revenue generation
User acceptance positive
4 . L E S S O N S L E A R N T
Factors for success high performance processes and systems, innovative use of traffic
information of different sources
Obstacles availability of reliable traffic information
5 . M O R E I N F O R M A T I O N
Contact Person
Name:
Function:
Company:
Email:
Phone:
Web link (if existing) www.logistik-vinfo.de
U R B A N I T S E X P E R T G R O U P
ITS Action Plan – Best Practices: Collection of projects 58
3.25 DE - Bremen – eTicketing / BOB Card
URBAN ITS
KEY APPLICATION
Traffic & Travel Information
Traffic & Access Management
Smart Ticketing
Urban Logistics
Other:
1 . G E N E R A L D E S C R I P T I O N
Problems to solve /
Objectives
Issue(s) encountered: supporting eTicketing (prepaid and post-paid)
Objective(s) of the measure/service: to ease ticketing process for the user
– special target group non-frequent PT users - // get away from cash in
PT vehicles to reduce risks of assault etc. and to change from ticketing
sales by drivers to ticketing machines
Start of system/service 2005
Location single road/line city district whole city x urban region
Transport mode(s)
concerned
x public transport x rail road car-sharing
bicycles pedestrians other:
Implementing
organisation
Public Transport operator BSAG and regional PT cooperation VBN
(Verkehrsverbund Bremen/Niedersachsen)
System / service
description
There is a cooperation of today 38 PT operators in the region of Bremen
(train, bus, and tram) offering one ticketing and information regime.
Electronic ticketing in the Bremen region adds to the standard annual
subscriptions, which still use paper cars. Tickets are checked on the spot.
With eTicketing, especially non-frequent travellers are targeted. First,
there was the introduction of a pre-paid ticketing (starting with a test
phase in 2000) being the first and largest region-wide electronic ticketing
system in Germany to date. The post-payment system BOB Card
(“Bequem ohne Bargeld” / cashless and convenient) was introduced in
2005. Here you become a registered user and will get a direct-debit
invoice for your travels – including a best-price option per day.
The system is based on the chip of the bankcard that more or less every
bank account holder has. Thus, it is a contact-based system.
See also http://www.civitas-
initiative.org/alt/measure_sheet.phtml?lan=en&id=285 (in English) and
http://www.bob-ticket.de/index.php (in German)
Technologies
Underpinning both public transport and car sharing is the city's well-
developed e-ticketing payment system, developed by a partnership
consisting of INIT GmbH, Höft & Wessel, Smart Pay Systems and IRS
Consult AG. The pre-paid Bremer Karte, which also allows electronic
shopping, is based on the microchip-enabled general German Geldkarte
(bankcard) following an agreement between the country's national
umbrella banking and public transport associations.
The card is not contactless, partly because of the security requirements
that apply to financial transactions in Germany and partly for reasons of
cost and reliability. This means that, on boarding a vehicle, the passenger
has to use the onboard equipment to select the travel zone, indicate any
concessions (for example, for children), insert the card and confirm the
details. The transaction is then recorded on the card and the fare

U R B A N I T S E X P E R T G R O U P
ITS Action Plan – Best Practices: Collection of projects 59
deducted. Inspectors carry out spot checks to guard against fraud.
Standards http://www.geldkarte.de/_www/en/pub/geldkarte/geldkarte_users/additio
nal_functions.php
2 . I M P L E M E N T A T I O N
Partners involved
X Public authorities: regional and local transport authorities
x Private stakeholders: banks, IT research
x Others: Public Transport operators
Organisational model
x Management body: regional PT cooperation (VBN)
x Operating body: regional PT cooperation (also as clearing institution)
Financing body:
Business model
Public investment:
Private / commercial framework:
x Public-private partnership: PT is partly publically operated (and
financed) partly privately operated
Investment costs €: n.a. (is meanwhile part of standard procedures and vehicle
procurement etc at BSAG)
Operating costs € / year: n.a. person / year: n.a.
3 . R E S U L T S
Technical performance
Implementation of
Innovation
Safety impacts
Efficiency impacts Today there are about 80,000 customers of the BOB Card in the Bremen
region.
Environmental impacts
Socio-economic impacts
Revenue generation
User acceptance
4 . L E S S O N S L E A R N T
Factors for success
Obstacles
5 . M O R E I N F O R M A T I O N
Contact Person
Name: GLOTZ-RICHTER Michael
Function: Senior Advisor Sustainable Mobility
Company: Free Hanseatic City of Bremen, Senate Department for

U R B A N I T S E X P E R T G R O U P
ITS Action Plan – Best Practices: Collection of projects 60
Environment, Construction and Transport
Email: [email protected]
Phone: +49 173 6 123 178
Web link (if existing) http://www.bremen.de/
U R B A N I T S E X P E R T G R O U P
ITS Action Plan – Best Practices: Collection of projects 61
3.26 EL - Online Portal for Transport Data/Content Management and Transportation
Services Provision
URBAN ITS KEY APPLICATION
Traffic & Travel Information
Traffic & Access Management
Smart Ticketing
Urban Logistics
Other:
1 . G E N E R A L D E S C R I P T I O N
Problems to solve /
Objectives
Issue(s) encountered: Lack of well organized data in transport in Greece;
online support to policy makers, transport planners and researchers
Objective(s) of the measure/service: creation of critical information
content concerning the operation of the basic transport fields; disposal of
expert tools to be used by institutions and companies of the transport
filed in order to support their own business, research or other activity;
regular monitoring of the country’s transport system; innovation
promotion support in the field of transport
Start of system/service 2002
Location single road/line city district whole city urban region
Transport mode(s)
concerned
public transport rail road car-sharing
bicycles pedestrians other:
Implementing
organisation Centre for Research and Technology Hellas/ Hellenic Institute of Transport
System / service
description
Portal provides the following services:
Transports Observatory: This service aims at providing transport
data to the Portal’s users. This data constitute a valuable help for
the users of scientific committees, researchers, as well as the
citizens that seek for information related to the transport section.
This service is also used for the Athens pilot application in VIAJEO.
Traffic Forecasting and Network Simulation: The service provides
to the user the potential of fulfilling transport scenarios, activating
transport applications that are hosted in HIT’s headquarters
infrastructure.
Scheduling and Freight Urban Routing: The service includes the
procedures that allow the routing of vehicles and drivers in urban
and suburban environments, not only for the passenger but also
for the freight transport systems. Even though their function is
differentiated for the passenger and the freight transport,
routing’s common logic enables their simultaneous analysis.
Info-mobility: This service is responsible for the discovery and the
classification of solutions provided according to the users’
applications for a travel determination and for the provision of
information for traffic incidents and data.
Test Bed: This is a platform providing simultaneous hosting of
multiple innovative systems for validation purposes. This service
is available to non-commercial applications and can be operated
with concurrent extracting of transportation data from the Portal.
Technologies SQL Server 2005/2008 with Spatial Support, C#, ASP, .NET, GIS Server,
ArcGIS, XML, CSS,
Standards W3C Standards

U R B A N I T S E X P E R T G R O U P
ITS Action Plan – Best Practices: Collection of projects 62
2 . I M P L E M E N T A T I O N
Partners involved
Public authorities: (G.S. of Development)
Private stakeholders: (OTENET)
Others: Research Institute (CERTH/HIT)
Organisational model
Management body: (CERTH/HIT)
Operating body: (CERTH/HIT)
Financing body: (G.S. of Development)
Business model
Public investment:
Private / commercial framework:
Public-private partnership:
Investment costs €: 1275039
Operating costs € / year: 10000 person / year: 6
3 . R E S U L T S
Technical performance
High end servers, clusters and other essential hardware equipment as well
as custom and commercial computational software is used and maintained
daily to support all the services, their reliability and performance.
Implementation of
Innovation
Innovative products and services are developed every year using the tools
and data of HIT PORTAL
Safety impacts Road safety observatory is maintained and research on safety issues is
implemented.
Efficiency impacts 30 new research products and services that have been use the tool and
data of HITPORTAL have been developed
Environmental impacts
Environmental observatory is under construction and services for
promoting the environmental friendly routes have already been
developed.
Socio-economic impacts
The improvement of the traffic conditions, the road safety and the
facilitation of the research on transportation are the main positive socio-
economic impacts.
Revenue generation HITPORTAL generate no revenues but only its maintenance costs.
User acceptance 2000 users on line or off line every year.
4 . L E S S O N S L E A R N T
Factors for success Giving an open platform with an easy access to the research community
generates very productive cooperations and advanced new products.
Obstacles Data collection mainly due to the difficult cooperation among all the
relative public authorities.
U R B A N I T S E X P E R T G R O U P
ITS Action Plan – Best Practices: Collection of projects 63
5 . M O R E I N F O R M A T I O N
Contact Person
Name: Dr. E. Mitsakis, Mr. B. M. Vassilantonakis
Function: Responsible for the operation of the Observatory
Company: CERTH/HIT
Email: [email protected], [email protected]
Phone: +30 2310 498459, 2310498468
Web link (if existing) www.komvos-imet.gr
U R B A N I T S E X P E R T G R O U P
ITS Action Plan – Best Practices: Collection of projects 64
3.27 ES - Madrid - Contactless Card End of 2011- Integration of High Number of
Operators
URBAN ITS KEY APPLICATION
Traffic & Travel Information
Traffic & Access Management
Smart Ticketing
Urban Logistics
Other:
1 . G E N E R A L D E S C R I P T I O N
Problems to solve /
Objectives
Issue(s) encountered: Lack of coordination among PT stakeholders,
specially in crisis scenarios
Objective(s) of the measure/service: Improving real time information
between stakeholders. Knowlegde to decision makers
Start of system/service 2008
Location single road/line city district whole city urban region
Transport mode(s)
concerned
public transport rail road car-sharing
bicycles pedestrians other:
Implementing
organisation Consorcio Regional Transportes de Madrid
System / service
description Multimodal Control Center
Technologies Open systems based on web services
Standards
2 . I M P L E M E N T A T I O N
Partners involved
Public authorities:
Private stakeholders:
Others:
Organisational model
Management body:
Operating body:
Financing body:
Business model
Public investment:
Private / commercial framework:
Public-private partnership:
Investment costs €: 1.500.000
Operating costs € / year: 500.000 person / year: 9
3 . R E S U L T S
Technical performance Real time tools and software platforms to integrate technological systems
from different transport operators
Implementation of
Innovation
New management tools and procedures that will improve PT information
and coordination

U R B A N I T S E X P E R T G R O U P
ITS Action Plan – Best Practices: Collection of projects 65
Safety impacts Real time information about disruptions and threats on PT
Efficiency impacts Shorter times on communication and better information for decision
makers in case of incidents on PT
Environmental impacts those related with an increase in use of PT
Socio-economic impacts Real time information for PT users in a multimodal approach
Revenue generation Increasing attractiveness of PT
User acceptance Increasing quality of PT system as a whole
4 . L E S S O N S L E A R N T
Factors for success Coordination, cooperation, action procedures
Obstacles different level of technological development among PT operators
5 . M O R E I N F O R M A T I O N
Contact Person
Name: Tomas Melero
Function: CITRAM Manager
Company: Consorcio Transportes de Madrid
Email: [email protected]
Phone: +34638215952
Web link (if existing) www.crtm.es
U R B A N I T S E X P E R T G R O U P
ITS Action Plan – Best Practices: Collection of projects 66
3.28 ES - Madrid – WiFi on Buses
URBAN ITS
KEY APPLICATION
Traffic & Travel Information
Traffic & Access Management
Smart Ticketing
Urban Logistics
Other: Added-Value Services to the passengers
1 . G E N E R A L D E S C R I P T I O N
Problems to solve /
Objectives
Issue(s) encountered: Legal Issues with Spanish Telecommunication
Market Commission
Objective(s) of the measure/service: Offer an added-value service to
commuters, improving the travel experience.
Start of system/service September - 2010
Location single road/line city district X whole city urban region
Transport mode(s)
concerned
X public transport rail road car-sharing
bicycles pedestrians other:
Implementing
organisation Madrid Public Bus Transport Operator (EMT de Madrid)
System / service
description
Internet access via WiFI is offered on-board to commuters. Users do not
have to authenticate, due to the service is open and free. In order to
comply with Spanish Telecommunication Market Commission
requirements, the service is sponsored by a private company.
Technologies HSPA communications for Internet Access
WiFI communications for user access.
Standards WiFI : IEEE 802.11b/g
GPRS/UMTS/HSPA
2 . I M P L E M E N T A T I O N
Partners involved
X Public operator: EMT
X Private stakeholders: ETRA/ IECISA/PLETTAC
Others:
Organisational model
X Management body: EMT Madrid
X Operating body: EMT Madrid
X Financing body: Private Company
Business model
Public investment:
Private / commercial framework:
X Public-private partnership: 250.000€/year
Investment costs €: 1.000.000
Operating costs € / year:50.000 person / year: 1
U R B A N I T S E X P E R T G R O U P
ITS Action Plan – Best Practices: Collection of projects 67
3 . R E S U L T S
Technical performance
EMT buses are provided with 3G communications with an onboard router,
which has WiFI capabilities also. This router permits users to access
Internet from their mobile handsets (smart phones, laptops, etc).Buses
communicate with a Telecommunication Service Centre, which provides
Internet access as well as traffic inspection functionalities (avoiding
attacks from potential hackers and applying restriction access policies to
web pages considered non-appropriate for a public internet access).
Implementation of
Innovation
One of the first public bus operator company in the world providing free
Internet access via WiFI to commuters.
Safety impacts N/A
Efficiency impacts N/A
Environmental impacts N/A
Socio-economic impacts Improving the travel experience. Use of Public Transport encouragement.
Revenue generation
The incomes received from the sponsor of the service are greater than the
operating costs.
User acceptance The usage of the service increases every month, reaching 395 thousand
users a month.
4 . L E S S O N S L E A R N T
Factors for success
Existing technical infrastructure used for bus service operational purposes
were used to offer and added-value service, so no many additional
investments were needed. The public image of the bus transport service
in the city of Madrid has been improved, and commuters admit to enjoy a
better travel experience.
Obstacles Spanish legislation does not permit to offer a telecommunication service
for free by a public company, so a business model had to be defined.
5 . M O R E I N F O R M A T I O N
Contact Person
Name: Enrique Diego Bernardo
Function: IT Manager
Company: EMT Madrid
Email: [email protected]
Phone: 91 406 88 49
Web link (if existing) www.emtmadrid.es
U R B A N I T S E X P E R T G R O U P
ITS Action Plan – Best Practices: Collection of projects 68
3.29 ES - ATM Barcelona – Steps towards E-Ticketing
URBAN ITS
KEY APPLICATION
Traffic & Travel Information
Traffic & Access Management
Smart Ticketing
Urban Logistics
Other:
1 . G E N E R A L D E S C R I P T I O N
Problems to solve /
Objectives
Issue(s) encountered:
Objective(s) of the measure/service: The project is totally based in
existing ISO/EN standards, open interfaces, multi services-oriented
support, etc.
Start of system/service
Location single road/line city district whole city X urban region
Transport mode(s)
concerned
public transport rail road car-sharing
bicycles pedestrians other:
Implementing
organisation
System / service
description
Technologies
Standards
2 . I M P L E M E N T A T I O N
Partners involved
Public authorities: ATM Barcelona and main public transport operators
in the area
Private stakeholders:
Others:
Organisational model
Management body:
Operating body:
Financing body:
Business model
Public investment:
Private / commercial framework:
Public-private partnership:
Investment costs €:
Operating costs € / year: person / year:

U R B A N I T S E X P E R T G R O U P
ITS Action Plan – Best Practices: Collection of projects 69
3 . R E S U L T S
Technical performance Not launched yet. All in prototypes and ready to the rollout
Implementation of
Innovation
Clearly the main innnovation is the Portabillity of theTransport Application
( (DESFIRE –all versions-, CIPURSE) and the NFC SIM-based and SE
embedded)
Safety-security impacts
Created a security SAM (and HSM) (own deployment) to guarantee trust
in the system (point to point). Interoperable Fare System compliant with
ISO 24014 (IFM)
Efficiency impacts
Very high. Open system and standard compliant promotes vendor
neutrality and cross-vendor system interoperability, giving much more
flexibility in sourcing products and services to meet specific project
requirements without compromising functionality. Future-proof of new
enhancements provided the new comers are ISO compliant.
It also promotes also a crossborder interoperability with other regions
Environmental impacts Expected very positive to be.
Socio-economic impacts
Very positve to be. Expected an efficiency in deploying the system in real
ground and benefits coming from third parties (new comers to the
transport ecosystem)
Revenue generation Expected to have
User acceptance
4 . L E S S O N S L E A R N T
Factors for success
Maturity of technology available (ISO standards), total awareness of the
importance of interoperability, technical skills and engineering facilities,
prototyping of written specifications in order to overcome the challenges
that written paper don’t face
Obstacles Complexity of technology, operations, black boxes
5 . M O R E I N F O R M A T I O N
Contact Person
Name: Carme Fabregas
Function: CIO
Company: ATM, Metropolitan Transport Authority
Email: [email protected]
Phone: +34 93 362 00 25 // +34 627 48 12 50
Web link (if existing)

U R B A N I T S E X P E R T G R O U P
ITS Action Plan – Best Practices: Collection of projects 70
3.30 EU - Europe-In-Time (Delivering Intelligent and Efficient Travel Management for
European Cities)
URBAN ITS KEY APPLICATION
Traffic & Travel Information
Traffic & Access Management
Smart Ticketing
Urban Logistics
Other:
1 . G E N E R A L D E S C R I P T I O N
Problems to solve /
Objectives
In-Time aims at drastic reductions in energy consumption in urban areas´
transport through the change of mobility behaviour of the single traveller
by providing multimodal Real-time Traffic and Travel Information.
Location single road/line city district whole city urban region
Transport mode(s) public transport road multi-modal other:
covering all modes (incl. flight information)
Implementing
organisation
As the system is implemented in several cities and regions (Florence and
Tuscany Region, Munich and Bavaria, Brno and Southern Moravia, Vienna
and Eastern Austria, Bucharest, Oslo) there is not ONE implementing
organisation, but several local and regional ones. The main contribution
and technical coordination of all implementing bodies is done by Softeco
Sismat together with Mizar Automazione.
System / service
description
The In-Time concept is based on the setup of a commonly agreed B2B
Interface for the exchange of services and information between
cities/regions/operators and end-user service providers.
B2C services are provided on-trip as well as pre-trip based on the End-
User service provider requirements. In In-Time currently 4 different End-
User service providers are offering intermodal door-to-door routing
services based on Real Time information to the single citizen by
supporting 3 different platforms (iPhone, Nokia, MS Windows mobile).
U R B A N I T S E X P E R T G R O U P
ITS Action Plan – Best Practices: Collection of projects 71
Technologies
Central part of the In-Time approach is the B2B Interface, which is called
“Commonly Agreed Interface” (CAI). This CAI is a harmonized data model
providing integration of contents in the different domains underlying
multimodal services. The model finally adopted for In-Time is derived
from the eMOTION data model which is based on reference ITS standards
in the different sub-domains integrated in a single, coherent data model.
Each of the different data models has its own modeling strengths with
respect to specific aspects of relevance in the context of multimodal RTTI
services. The key elements of the relevant models were selected and have
been harmonised into a single, composed data model, following the
general lines of the ISO 19100 series of Geographic Information
Standards.
The specifications of In-Time B2B services are largely based on the
relevant open standards of geospatial information services, as defined by
the Open Geospatial Consortium
Data Services are based on the OGC Web Feature Service (WFS) definition
and the Filter Encodings standard accompanying it. In specific cases (such
as for environmental and weather data) Data Services may also be
realised by means of the OGC Web Coverage Service (WCS). The
selection of data entities (features) over the web is made by means of a
query interface offered by WFS.
Together with Data Services, Mapping Services are the most often used
resources in the In-Time system. Exposing standard interfaces for the
provision of maps, In-Time Mapping Services are defined on the basis of
the OGC Web Map Service (WMS), the reference standard for web
mapping open applications.
Standards
The In-Time CAI (Commonly agreed interface) is based in existing
standards. Key standards include:
DATEX II for Individual Traffic and a general traffic situation message
model,
Transmodel as the reference model for Public Transport base data,
SIRI to describe public transport timetables and schedules,
IFOPT to describe fixed infrastructure objects and features (e.g. multi-
modal interchange points),
TPEG used for descriptive location referencing (TPEG-Loc), Road Traffic
Messages (TPEG-RTM), public transport information messages (TPEG-PTI)
and parking facilities (TPEG-PKI).
Start of system/service In January 2011 the public pilot phase was launched, which will last for
one year at minimum
2 . I M P L E M E N T A T I O N
Role model (tbc)
Partners involved
Arsenal Research (AIT), ASFINAG, ATAF, AustriaTech, Austro Control,
Brimatech, Brnenske komunikace, ERTICO, Fluidtime, Geo Solutions,
MemEx, micKS, Mizar Automazione, PTV, Sintef, Softeco Sismat, Swarco
Futurit, TomTom, Telematix, Telmap, Universitatea Politehnica Bucaresti,
VOR
Business model
Basically In-Time offers services for business users (B2B) and end users
(B2C). In the case of B2B services, two payment forms can be
distinguished, pay per use or a flat fee for a specified service (access to
specific data, for a specific time period, etc.). The Traffic Information

U R B A N I T S E X P E R T G R O U P
ITS Action Plan – Best Practices: Collection of projects 72
Service Provider has the benefit of accessing data in an easier way with
defined interfaces, thus this party usually pays for In-Time services in this
model.
In case of B2C end user services, basic services will be provided for free
by the city-authorities or public service providers, as it is in their interest
to provide high quality information for travellers to promote public
transport. In addition, premium services against a fee payable by the end
user can be offered, such as push services and personalised services. On
top, regional advertising completes the revenue model for In-Time.
For the implementation of new traffic management technologies the costs
will be mainly with public authorities and ppp-models.
For the In-Time project life-cycle the B2B service as well as the B2C
service will be offered for free to measure and assess the impact of the e-
services. Later on the B2B Server access of the TISP via the harmonised
standardised open interface needs to be fixed in a contract. It is expected
that the TISP needs to pay for the data/service access.
3 . R E S U L T S
Technical performance First results are expected by April 2011. Final results will be available by
April 2012
Safety impacts First results are expected by April 2011. Final results will be available by
April 2012
Efficiency impacts First results are expected by April 2011. Final results will be available by
April 2012
Environmental impacts
Changes in the mobility behaviour (approx.. 3% modal shift) will decrease
the negative impacts of road traffic on the environment. In this context
the environment covers both, road network and natural environment:
There will be less congestion along the road network, leading to enhanced
traffic safety. In parallel the selection of the travel mode will be influenced
by In-Time by supporting traffic management to disseminate current valid
travel data and services.
But a major impact will be on the natural environment by reducing
pollutants and CO2 Emissions,
particle emissions,
noise, etc.
First results are expected by April 2011. Final results will be available by
April 2012
Socio-economic impacts
In-Time will also have a positive impact on new targets for efficiency and
environmental friendliness in Europe’s transport sector through new
mobility services. A very important impact should stem from the reduction
of congestion and the resulting reduction of noise and air pollution.
Asthma and other respiratory diseases have become a major issue over
recent years, both among adults and children who live in polluted cities. A
major part of this pollution is transport related. Any improvement in urban
pollution would therefore be most welcome by sufferers and educated
citizens.
But also by all other citizens, noise and air pollution are regarded as one
of the main drawbacks of "life in the metropolitan areas" and is one of the
major reasons for urban sprawl and return to the countryside, a move
which then generates even more traffic. If the installations promoted by

U R B A N I T S E X P E R T G R O U P
ITS Action Plan – Best Practices: Collection of projects 73
In-Time only make a small contribution to reversing this trend, it will help
in the preservation of the countryside, and therefore enhance everybody’s
quality of life.
Furthermore, studies carried out for EC Directorate General V have shown
that difficult journeys to work create stress, absenteeism and reduce
productivity at work, and have a harmful impact on family life and social
interaction. Again, improvements in the travel conditions and travel
comfort for commuters will help to reduce such negative effects.
First results are expected by April 2011. Final results will be available by
April 2012
Revenue generation First results are expected by April 2011. Final results will be available by
April 2012
User acceptance First results are expected by April 2011. Final results will be available by
April 2012
4 . L E S S O N S L E A R N T
Factors for success As the pilot phase is on-going results can be expected latest by April 2012
Obstacles As the pilot phase is on-going results can be expected latest by April 2012
5 . M O R E I N F O R M A T I O N
Contact Person Martin Böhm; 1220 Vienna, Donau-City-Str. 1 –
Web link (if existing) www.in-time-project.eu
U R B A N I T S E X P E R T G R O U P
ITS Action Plan – Best Practices: Collection of projects 74
3.31 EU - European Cross Border Travel Information Network, “EU-Spirit”
URBAN ITS
KEY APPLICATION
Traffic & Travel Information
Traffic & Access Management
Smart Ticketing
Urban Logistics
Other:
TITLE European cross-border travel information network «EU-Spirit»
1 . G E N E R A L D E S C R I P T I O N
Problems to solve /
Objectives
Issue(s) encountered:
An actual and reliable traveller information is an important service for
public transport users – both on the national and international level.
Therefore the European public transport information service EU-Spirit was
set up within the 5th framework and has been in continuous operation
since 2001.
Objective(s) of the measure/service:
Making the usage of public transport as easy and reliable as possible –
especially for cross-border trips.
Start of system/service European R&D project 1998 – 2001; Continuous operation since 2001
Location single road/line city district whole city X urban region
X national and international
Transport mode(s)
concerned
X public transport X rail (X) road car-sharing
(X) bicycles X pedestrians X other: flights (ferries expected)
Implementing
organisation
VBB Verkehrsverbund Berlin-Brandenburg GmbH
(Public Transport Authority – coordination) plus all network partners
System / service
description
EU-Spirit enables operators of local, regional and national travel planning
systems to offer international information to their customers via their
existing information system in the local language through the
interconnection of existing travel planning systems independently from
the system supplier or the functional level of service.
Technologies
The EU-Spirit network consists of special IT components for the
interconnection of existing travel planners to make sure the interaction of
the different systems (e. g. identification of origin and destination for the
given request, omputing international travel information through the
combination of part-information from the different travel planners).
Standards EU-Spirit standard interface
2 . I M P L E M E N T A T I O N
Partners involved
X Public authorities: VBB and all travel planning service operators
X Private stakeholders: Technical subcontractors / other service providers
Others:
Organisational model
X Management body: VBB (Coordination9)
X Operating body: All participating travel planners and technical.
subcontractors (e. g. HaCon Ingenieurgesellschaft as system operator for
the network architecture and long distance information systems.
X Financing body: All participating travel planning operators through
annual fees.
Business model
X Public investment: set up through R&D project
X Annual fees payed by public travel plaaner operators
Private / commercial framework:
U R B A N I T S E X P E R T G R O U P
ITS Action Plan – Best Practices: Collection of projects 75
Public-private partnership:
Investment costs €:
Operating costs € / year: person / year:
3 . R E S U L T S
Technical performance
Implementation of
Innovation
Integrated system for the total area and national and international
cooperation, usage of standardized moduls and interfaces
Safety impacts
Efficiency impacts
Environmental impacts
Socio-economic impacts
Revenue generation
User acceptance Around 60 Mio. information system requests per year in Berlin-
Brandenburg
4 . L E S S O N S L E A R N T
Factors for success Integration, overall concept, usage of standard software and standard
interfaces, public support and funding
Obstacles Size and heterogeneous service area, number of parties involved
5 . M O R E I N F O R M A T I O N
Contact Person
Name: Juergen Ross
Function: Head of Planning and Customer Information Division
Company: VBB Verkehrsverbund Berlin-Brandenburg GmbH
Email: [email protected]
Phone: +49.30.254 14 260
Web link (if existing) VBBonline.de
U R B A N I T S E X P E R T G R O U P
ITS Action Plan – Best Practices: Collection of projects 76
3.32 FR - Lyon- Global Urban Ticketing
URBAN ITS
KEY APPLICATION
Traffic & Travel Information
Traffic & Access Management
Smart Ticketing
Urban Logistics
Other:
1 . G E N E R A L D E S C R I P T I O N
Problems to solve /
Objectives
Issue(s) encountered: several transport services several tickets and
systems, barriers for the users to combine different networks and services
Objective(s) of the measure/service: ensure seamless ticketing service for
the user on Lyon Region
Start of system/service 2005
Location single road/line city district whole city urban region
Transport mode(s)
concerned
public transport rail road car-sharing
bicycles pedestrians other:
Implementing
organisation Region Rhône Alpes, Sytral (Lyon PT authority), Grand Lyon
System / service
description
SmartCard (Oura!) supporting ticketing services for Lyon PT network,
regional trains and Lyon free bike service
Technologies Contact less Card
Standards Existing smart ticketing standards
2 . I M P L E M E N T A T I O N
Partners involved
Public authorities:
Private stakeholders: suppliers
Others:
Organisational model
Management body:
Operating body:
Financing body:
Business model
Public investment:
Private / commercial framework:
Public-private partnership:
Investment costs €: around 25 million Euros depending on the perimeter
Operating costs € / year: around 3 M€ person / year:
3 . R E S U L T S
Technical performance Interoperability of bike sharing, rail and urban PT services and networks
insured : one ticket for the users for the 3 services
Implementation of
Innovation
Safety impacts N/A

U R B A N I T S E X P E R T G R O U P
ITS Action Plan – Best Practices: Collection of projects 77
Efficiency impacts
Environmental impacts
Socio-economic impacts
Public Transports are easier to use, and combination with bike sharing
leads to real competitiveness of this multimodality compared to single car
use.
Revenue generation
User acceptance High
4 . L E S S O N S L E A R N T
Factors for success Minimum impact on existing ticketing and vending schemes
Obstacles Numerous actors and operators
5 . M O R E I N F O R M A T I O N
Contact Person
Name :
Dominique Bauthier Region Rhone Alpes
Jean Chaussade - Sytral
Jean Coldefy - Grand Lyon
Company: Region Rhone Alpes / Sytral / Grand Lyon
Email:
Phone:
Web link (if existing)
U R B A N I T S E X P E R T G R O U P
ITS Action Plan – Best Practices: Collection of projects 78
3.33 FR - Lyon - Grand Lyon Urban Traffic Management System (CRITER)
URBAN ITS
KEY APPLICATION
Traffic & Travel Information
Traffic & Access Management
Smart Ticketing
Urban Logistics
Other:
1 . G E N E R A L D E S C R I P T I O N
Problems to solve /
Objectives
Issue(s) encountered: recurrent congestions, non fluidity of PT services,
Objective(s) of the measure/service: 1) reduce PT travel time, 2) reduce
congestion of road urban traffic
Start of system/service 2000
Location single road/line city district whole city urban region
Transport mode(s)
concerned
public transport rail road car-sharing
bicycles pedestrians other:
Implementing
organisation Lyon City council
System / service
description
Intelligent Transport Service, combining real time detection (400 sensors)
and real time management of traffic lights (1000 connected together) for
PT priority, + green waves for traffic, this second objective coming AFTER
the PT priorities at traffic lights. Management of single stretch, corridors
and zones. Predefined scenarios, tools for local regulations as well as
corridors or zone regulations.
Technologies Sensors + traffic lights automated controllers + software
Standards
2 . I M P L E M E N T A T I O N
Partners involved
Public authorities: Grand Lyon
Private stakeholders: suppliers and software development
Others:
Organisational model
Management body: Grand Lyon
Operating body: Grand Lyon + private partner (system designer)
Financing body: Grand Lyon
Business model
Public investment:
Private / commercial framework:
Public-private partnership:
Investment costs €: 6 M€
Operating costs € / year: 600 k€ person / year: 5
3 . R E S U L T S
Technical performance
Availability of the system very high
Efficiency very high : gain of several minutes per PT lines (for each
bus/tramways), reduction per half of daily traffic congestions

U R B A N I T S E X P E R T G R O U P
ITS Action Plan – Best Practices: Collection of projects 79
Implementation of
Innovation
Regularly improved: new sensors, new software development. Promising
test and short term predictive traffic information.
Safety impacts Non significant : in urban areas, average speed is around 20 km/h
Efficiency impacts Enhancement of public transport reliability: respect of theoretical timing
(with an average of 2 sec).
Environmental impacts High reduction of CO2 see technical performance
Socio-economic impacts
Thanks to the technical performance of the system and its impact on
efficiency, the transport has increased up to 5% on the concerned bus
lines.
Revenue generation None
User acceptance High
4 . L E S S O N S L E A R N T
Factors for success
Progressive implementation, learn by walking process, pragmatic
approach of urban environment as road ITS is today mainly designed for
interurban networks
Obstacles
Technology is today not really suited to urban environment and a lot of
experimentations need t be performed before deployment. Lack of R&D on
ITS in urban environment
5 . M O R E I N F O R M A T I O N
Contact Person
Name: Jean Coldefy
Function: ITS programmes coordinator
Company: Grand Lyon
Email: [email protected]
Phone:
Web link (if existing) http://www.grandlyon.com/ or http://www.onlylyon.org/home-1-2.html
U R B A N I T S E X P E R T G R O U P
ITS Action Plan – Best Practices: Collection of projects 80
3.34 FR - Paris - Passautocar (Coach Parking Pass)
URBAN ITS
KEY APPLICATION
Traffic & Travel Information
Traffic & Access Management
Smart Ticketing
Urban Logistics
Other:
1 . G E N E R A L D E S C R I P T I O N
Problems to solve /
Objectives
Issue(s) encountered: Off-sites coach parking & Unprofitable business
case for parking operators
Objective(s) of the measure/service: Regain control over the management
of parking by tourist coaches in the centre of Paris.
Start of system/service 2003
Location single road/line city district whole city urban region
Transport mode(s)
concerned
public transport rail road car-sharing
bicycles pedestrians other:
Implementing
organisation
System / service
description
The PassAutocar system for coach parking was introduced in Paris in June
2003 in order to regulate the parking, stopping and movements of
coaches in the City of Paris and is based on a fixed fee for coach parking
(daily pass).
The Daily pass can either be purchased in advance via a website or at
specific coach parks around the City. The pass is valid for a duration given
in every on-street coach bay, central and peripheral coach parks without
any needs of reservation. The system aims to optimise the usage of the
461 coach bays in Paris.
The use of Passautocar is mandatory.
Technologies
Parking access control centralised and connected via Internet.
Internet and database technologies.
Smartphones, IVR (Interactive Voice Response) solutions.
Standards
2 . I M P L E M E N T A T I O N
Partners involved
Public authorities: City of Paris
Private stakeholders: Coach companies, Parking operators, Services
Operator (Carte Blanche Conseil SAS)
Others:
Organisational model
Management body: City of Paris
Operating body: Parking operators, City of Paris & Carte Blanche
Conseil SAS
Financing body: City of Paris
Business model
Public investment:
Private / commercial framework:
Public-private partnership:
U R B A N I T S E X P E R T G R O U P
ITS Action Plan – Best Practices: Collection of projects 81
Investment costs Studies (EU co-financed) + System development.
Operating costs
System operation + manual control + administrative cost = Incomes ≈ 4
M€
person / year: ≈ 5
3 . R E S U L T S
Technical performance Fully operational since 2003.
Implementation of
Innovation ~ One every 3 years
Safety impacts Reduce useless traffic and double-parking.
Efficiency impacts
Coach companies know where their vehicles actually are.
Environmental impacts Reduce useless traffic and congestion.
Socio-economic impacts It is aimed at reducing the negative and harmful effects on local
inhabitants caused by traffic and vehicles stopping.
Revenue generation Reduced Profits for the City of Paris.
Viable business case for parking operators.
User acceptance Complete from Parking Operators, Coach companies, Coach drivers,…
4 . L E S S O N S L E A R N T
Factors for success
Obstacles
Convincing all stakeholders. ( achieved with the performance of the
system)
Separation of enforcement and management actors.
5 . M O R E I N F O R M A T I O N
Contact Person
Name:
Function:
Company:
Email: [email protected]
Phone:
Web link (if existing) http://pass.cbconseil.com/
U R B A N I T S E X P E R T G R O U P
ITS Action Plan – Best Practices: Collection of projects 82
3.35 FR - Toulouse – The Electronic Ticketing System
URBAN ITS
KEY APPLICATION
Traffic & Travel Information
Traffic & Access Management
Smart Ticketing
Urban Logistics
Other:
1 . G E N E R A L D E S C R I P T I O N
Problems to solve /
Objectives
Issue(s) encountered: Integrating the different existing services and
standards to make the system interoperable ; Former system obsolete.
Objective(s) of the measure/service: Simplify the user experience;
Control the evolution of fraud and delays; Enable flexibility in integrated
fare policies; Ensure safe transactions
Start of system/service 2007
Location single road/line city district whole city urban region
Transport mode(s)
concerned
public transport rail* road car-sharing*
bicycles* pedestrians other: *: Rail, bicycle and car-
sharing not under TISSEO-SMTC control.
Implementing
organisation Public Transport Authority of Toulouse (TISSEO-SMTC)
System / service
description
Moving from magnetic tickets to contactless technology-based/e.ticketing
solutions (Toulouse "Pastel" contactless smartcard), enabling customers
to load several public transport contracts on their card.
Technologies
Toulouse has always been a pioneer in the development of innovative
ticketing solutions and implementation of new public transport contracts,
fares and products: from its magnetic based system in 1992 to E-
Ticketing (and coming NFC solutions).
Standards
International: ISO14443. European: Calypso. Standardization efforts at
international (physical and electrical properties of cards), European
(interfaces and interoperability of standards) and national/local level have
generated interoperability.
2 . I M P L E M E N T A T I O N
Partners involved
Public authorities: TISSEO-SMTC, the Greater Toulouse, the County
Council, the Regional Council.
Private stakeholders: Affiliated Computer Services (ACS)
Others:
Organisational model
Management body:
Operating body:
Financing body:
Business model
Public investment:
Private / commercial framework:
Public-private partnership:
Investment costs €: 28 400 000
Operating costs € / year: 800 000 (including cards purchase) person / year:

U R B A N I T S E X P E R T G R O U P
ITS Action Plan – Best Practices: Collection of projects 83
3 . R E S U L T S
Technical performance
New contactless and interoperable ticketing system (currently PT, regional
rail/bus networks and very soon bike sharing and carsharing services)
achieved through standardization. 99,9% reliability of assets and 99,7%
reliability of statistical data.
Implementation of
Innovation System complete renewal over a 4 year period.
Safety impacts Delays reduced ; Faster off loading and station egress ; Passenger fraud
level decreased.
Efficiency impacts
Improved quality of service for the user ; More efficient passenger flow
management in metro stations ; Increased attractiveness of public
transport services.
Environmental impacts Use of paper tickets in steady decrease (except for 10-travels tickets).
Ticketing system and modal shift enhanced, lowering CO2 emissions.
Socio-economic impacts Increased and eased mobility for daily travels (school, work and leisure).
Revenue generation Difficult estimation due to newly implemented tariffs and evolution of the
transport network (new infrastructures).
User acceptance
380 000 “Pastel” smart cards distributed among all public transport
annual subscribers. Increased demande of Pastel smartcard (+10 points
between 2009 and 2010).
4 . L E S S O N S L E A R N T
Factors for success Cooperation between local institutions ; Positive image of smartcards.
Obstacles Lack of leadership and decision-making ; Networks using different
standards ; Impact of possible employees resistance to new technology.
5 . M O R E I N F O R M A T I O N
Contact Person
Name: Régis LARVOR
Function: E-Ticketing Project Manager
Company: Tisséo-SMTC
Email: [email protected]
Phone: +33 (0) 6 16 38 51 77
Web link (if existing)
U R B A N I T S E X P E R T G R O U P
ITS Action Plan – Best Practices: Collection of projects 84
3.36 FR - Toulouse – Multimodal Traveller Information Centre
URBAN ITS
KEY APPLICATION
Traffic & Travel Information
Traffic & Access Management
Smart Ticketing
Urban Logistics
Other:
TITLE Multimodal traveller information centre in Toulouse
1 . G E N E R A L D E S C R I P T I O N
Problems to solve /
Objectives
Issue(s) encountered: Multimodal information managed by different
mobility stakeholders.
Objective(s) of the measure/service: Create a common multimodal
information service in Toulouse urban transport area.
Start of system/service 2010
Location single road/line city district whole city urban region
Transport mode(s)
concerned
public transport rail road car-sharing
bicycles pedestrians other:
Implementing
organisation Public Transport Authority of Toulouse (TISSEO-SMTC)
System / service
description
The multimodal traveller information platform in Toulouse centralizes
public transport/road/bicycle data in the system. The service provides
various services: journey planner, traffic and travel information and
cartographic representations.
Technologies Web service.
Standards Neptune (theoritical offer), DATEX 2 (road information), SIRI (public
transport information), XML (network information).
2 . I M P L E M E N T A T I O N
Partners involved
Public authorities: TISSEO-SMTC, Greater Toulouse, Regional Council,
County Council, State (Traffic Management department), rail authority and
operator, police authority.
Private stakeholders: Public Transport Operator in Toulouse (Régie
TISSEO).
Others:
Organisational model
Management body:
Operating body:
Financing body:
Business model
Public investment:
Private / commercial framework:
Public-private partnership:
Investment costs €: Total investment of 1 068 000 €, of which 10% supported by TISSEO-
SMTC
Operating costs € / year: 350 000 person / year:
3 . R E S U L T S
Technical performance Development of multimodal information.

U R B A N I T S E X P E R T G R O U P
ITS Action Plan – Best Practices: Collection of projects 85
Implementation of
Innovation Switching from content operator to service operator.
Safety impacts
Efficiency impacts Accepted to be an innovative tool increasing the attractiveness of public
transport services.
Environmental impacts Modal shift enhanced, lowering CO2 emissions.
Socio-economic impacts Increased and eased mobility for daily travels (school, work and leisure).
Revenue generation
User acceptance Service to be accessible to the public in the near future.
4 . L E S S O N S L E A R N T
Factors for success Cooperation between mobility stakeholders.
Obstacles Ongoing business model reflection ; Data property.
5 . M O R E I N F O R M A T I O N
Contact Person
Name: CLARIMON Olivier
Function: Multimodal Information Project Manager
Company: TISSEO-SMTC
Email: [email protected]
Phone: +33 (0) 5 62 27 41 49
Web link (if existing)
U R B A N I T S E X P E R T G R O U P
ITS Action Plan – Best Practices: Collection of projects 86
3.37 FR Paris – INFOMOBI Mail / SMS Service for PRMs
URBAN ITS
KEY APPLICATION
Traffic & Travel Information
Traffic & Access Management
Smart Ticketing
Urban Logistics
Other:
1 . G E N E R A L D E S C R I P T I O N
Problems to solve /
Objectives
Issue(s) encountered: Wheelchair users still do not take train because the
elevators in stations are sometimes broken
Objective(s) of the measure/service: Wheelchair user travel information
SMS services
Start of system/service 2003 for the 1st vesion of web site, 2009 for the second version and the
SMS service
Location single road/line city district whole city urban region
Transport mode(s)
concerned
public transport rail road car-sharing
bicycles pedestrians other:
Implementing
organisation STIF : the public authority of the Ile-de-France region
System / service
description
Informations ans services for disabled people : wheelchairfriendly routes,
specific maps, assistance during thre trip, information in real time of the
availability of lifts at railway stations
Technologies A web site with an input interface for transport operators, voice server,
and hotline
Standards
2 . I M P L E M E N T A T I O N
Partners involved
Public authorities:
Private stakeholders: Regional train operators : SNCF and RATP
Others:
Organisational model
Management body: Daily escalators and lifts maintenance tour used for
the SMS service
Operating body:
Financing body:
Business model
Public investment:
Private / commercial framework:
Public-private partnership:
Investment costs €: 350 000 (entire web site without call center)
Operating costs € / year: 190 000 (data collect include in operators contracts)
person / year:

U R B A N I T S E X P E R T G R O U P
ITS Action Plan – Best Practices: Collection of projects 87
3 . R E S U L T S
Technical performance Simple technical architecture
Implementation of
Innovation
Each morning before the opening of stations to collect and to consolidate
information in same electronic format from two different companies (SNCF
and RATP) about 400 elevators in 160 stations
Safety impacts
Efficiency impacts
Each morning before the opening of stations to collect and to consolidate
information in same electronic format from two different companies (SNCF
and RATP) about 400 elevators in 160 stations
Environmental impacts
Socio-economic impacts To develop specific assistance to reassure people with disabilities using
public transport
Revenue generation
User acceptance
The associations representing disabled people. In fact few disabled people
use the service but they feel reassured of its existence and trafficking of
this category of users increases proportionally to the development of
network access
4 . L E S S O N S L E A R N T
Factors for success
To connect the new information service with the existin and to dispatch
the maps and guides service through associations representing disabled
people
Obstacles To offer this service free of charge only to persons with disabilities
5 . M O R E I N F O R M A T I O N
Contact Person
Name: Mathieu Barres
Function: Project manager
Company: STIF
Email: [email protected]
Phone:
Web link (if existing) www.infomobi.com
U R B A N I T S E X P E R T G R O U P
ITS Action Plan – Best Practices: Collection of projects 88
3.38 FR - La Rochelle – Electronic Ticketing System
URBAN ITS
KEY APPLICATION
Traffic & Travel Information
Traffic & Access Management
Smart Ticketing
Urban Logistics
Other:
1 . G E N E R A L D E S C R I P T I O N
Problems to solve /
Objectives
Issue(s) encountered: Integrating the different existing services and
standards to make the system interoperable between the 4 urban
networks and the interurban network.
Objective(s) of the measure/service: Simplify the user experience;
development of intermodality in Charente-Maritime; Ensure safe
transactions
Start of system/service 2002 (initial pilot) / 2005 (generalisation to the networks)
Location single road/line city district whole city urban region
and department
Transport mode(s)
concerned
public transport rail* road car-sharing*
bicycles* pedestrians other: boats, P+R
Implementing
organisation Sustainable Mobility Authority (Syndicat Mixte de la Mobilité Durable)
System / service
description
Moving from papers tickets to magnetic tickets and contactless
technology(pass'partout 17 card)-), enabling customers to load several
public transport contracts on their card.
Technologies
Charente-Maritime has always been a pioneer in the development of
innovative ticketing solutions and implementation of new public transport
contracts, fares and products: smart ticketing, sale on internet (La
Rochelle), and coming NFC solutions
Standards Standard (system prénormatif): 1541. European: Calypso.
2 . I M P L E M E N T A T I O N
Partners involved
Public authorities: Conseil Général 17, CDA La Rochelle, CDA du Pays
Rochefortais, CDA Royan Atlantique, CDC Pays Santon
Private stakeholders:
Others: transporteurs (5 networks)
Organisational model
Management body: SYMOD, local transport authorities and operators
Operating body:
Financing body: local transport authorities and operators
Business model
Public investment: Symod (acting as central buying service for
ticketing systems for the local authorities )
Private / commercial framework:
Public-private partnership:
Investment costs €: 3 045 593 (first stage)
Operating costs € / year: 39 000 € per year for 5 networks person / year:

U R B A N I T S E X P E R T G R O U P
ITS Action Plan – Best Practices: Collection of projects 89
3 . R E S U L T S
Technical performance New contactless and interoperable ticketing system .
Implementation of
Innovation
Modernization of e.ticketing system foreseen in 2014 (study to be
launched in 2012) notably on software.
Safety impacts Passenger fraud level decreased.
Efficiency impacts Improved quality of service for the bus ; Increased attractiveness of
public transport services.
Environmental impacts durée de vie carte à puce 4 ans, plusieurs contrats sur carte, donc moins
d'impression titres magnétiques/puces et émission CO2
Socio-economic impacts Increased and eased mobility for daily travels (school, work and leisure).
Revenue generation Difficult estimation due to newly implemented tariffs and evolution of the
transport network (new infrastructures).
User acceptance
A high level of satisfaction of the systems notably among the youngsters
and students: 65% of students respondents replied that they were “very
satisfied” and 32% “quite satisfied” with the access to different modes of
transport using a unique smart card.
4 . L E S S O N S L E A R N T
Factors for success Cooperation between local institutions ; Positive image of smartcards.
Obstacles système non interopétable avec ferroviaire
5 . M O R E I N F O R M A T I O N
Contact Person
Name: Laure MARTIN
Function: Direction
Company: SYMOD
Email: [email protected]
Phone: +33 5 46 50 48 05
Web link (if existing) www.symod.org

U R B A N I T S E X P E R T G R O U P
ITS Action Plan – Best Practices: Collection of projects 90
3.39 IT/DE - SMART-WAY: Mobile Public Transport Navigation
URBAN ITS
KEY APPLICATION
Traffic & Travel Information
Traffic & Access Management
Smart Ticketing
Urban Logistics
Other:
1 . G E N E R A L D E S C R I P T I O N
Problems to solve /
Objectives
Issue(s) encountered: information barrier to use public transport
Objective(s) of the measure/service: never get lost in public transport
networks
Start of system/service Planned 07/2012
Location single road/line city district whole city urban region
Transport mode(s)
concerned
public transport rail road car-sharing
bicycles pedestrians other:
Implementing
organisation
Fraunhofer Institute for Transportation and Infrastructure IVI (server
application and interfaces to public transport operators)
the-agent-factory GmbH (mobile application)
System / service
description
SMART-WAY is a real public transport navigation system based on mobile
devices that give passengers the possibility to act as they are used to do
with common navigation systems in their cars. Once entered the
destination of their trip they will be able to get into a vehicle and to jump
off/on as often as they like to. The system will always guide them to the
destination, inform them about disturbances and, if possible guide them
around. Passengers are no longer bound to a printout of the route. They
may change and interrupt their trips as often as they want to.
Technologies
Mobile application: Android-App, OSM-droid
Server technologies: XML web services, own Java services (Snap
passenger, map-matching and other GIS services, state identification
etc.), PostgreSQL, fast XML-translation, LBS, central schedule database
Standards VDV implementations, usual timetable information system, REST-services,
XML, SOAP, EDGE, UMTS, HSPA, SQL
2 . I M P L E M E N T A T I O N
Partners involved
Public authorities: Dresdner Verkehrsbetriebe AG (DVB), Gruppo
Torinese Transporti (GTT)
Private stakeholders:
Others: EC/GSA
Organisational model
Management body: Fraunhofer
Operating body: transport authorities
Financing body: EC/GSA
Business model
Public investment: transport authorities
Private / commercial framework: private entities, B2B partnerships
Public-private partnership:
Investment costs €: not yet defined
Operating costs € / year: not yet defined person / year: not yet
defined
U R B A N I T S E X P E R T G R O U P
ITS Action Plan – Best Practices: Collection of projects 91
3 . R E S U L T S
Technical performance
Implementation of
Innovation
Safety impacts
Efficiency impacts
Environmental impacts
Socio-economic impacts
Revenue generation
User acceptance
4 . L E S S O N S L E A R N T
Factors for success
- Novelty of the solution - Success of car navigation system applied to the public transport
- Increasing use of smart phones
Obstacles - Inaccurate or not available data from transport operators - financing
5 . M O R E I N F O R M A T I O N
Contact Person
Name: Andreas Küster
Function: Project Manager
Company: Fraunhofer IVI
Email: [email protected]
Phone: +49 351 4640-667
Web link (if existing) www.smart-way.mobi
U R B A N I T S E X P E R T G R O U P
ITS Action Plan – Best Practices: Collection of projects 92
3.40 IT - Bologna – SIRIO, Access to Controlled Areas
URBAN ITS
KEY APPLICATION
Traffic & Travel Information
Traffic & Access Management
Smart Ticketing
Urban Logistics
Other:
1 . G E N E R A L D E S C R I P T I O N
Problems to solve /
Objectives
Issue(s) encountered: Traffic Calming
Objective(s) of the measure/service: Calm car traffic in the down town
city
Start of system/service 2008
Location single road/line city district whole city urban region
Transport mode(s)
concerned
public transport rail road car-sharing
bicycles pedestrians other:
Implementing
organisation Kapsch Italia
System / service
description
Drivers who want to access the zone with their private cars need to hold
an access permit. Whether or not a driver obtains a permit depends on his
status (resident, taxi, handicapped person, etc.) on the type of vehicle
(hybrid, etc.) or on special application (i.e. temporarily for hotel guests or
short term access). All vehicle passages are enforced electronically.
Technologies ANPR, central systems
Standards
2 . I M P L E M E N T A T I O N
Partners involved
Public authorities: Commune di Bologna
Private stakeholders:
Others:
Organisational model
Management body:
Operating body: Commune di Bologna
Financing body:
Business model
Public investment:
Private / commercial framework:
Public-private partnership:
Investment costs €: ~1.4 mn
Operating costs € / year: 200.000 operations, 220.000 maintenance
person / year: 10
3 . R E S U L T S
Technical performance Average ANPR performance
Implementation of
Innovation no
Safety impacts Reduction of absolute traffic count (-23%...-31%)
U R B A N I T S E X P E R T G R O U P
ITS Action Plan – Best Practices: Collection of projects 93
Efficiency impacts less parking pressure, less congestion, shorter travel times
Environmental impacts Reduction of particle matter emissions (-47%)
Socio-economic impacts
Revenue generation € ~28 mn per year from fines
User acceptance The scheme is well accepted by the citizens
4 . L E S S O N S L E A R N T
Factors for success Real reduction of traffic, better perception of quality of life
Obstacles Acceptance by merchants association, initial public funding
5 . M O R E I N F O R M A T I O N
Contact Person
Name: Carlo Michelacci
Function: municipal official (sustainable mobility sector)
Company: Bologna Municipality
Email: [email protected]
Phone: +39 051 2193390
Web link (if existing) www.comune.bologna.it

U R B A N I T S E X P E R T G R O U P
ITS Action Plan – Best Practices: Collection of projects 94
3.41 NL - Rotterdam – Park & Ride Pricing Strategy for Target Groups
URBAN ITS
KEY APPLICATION
Traffic & Travel Information
Traffic & Access Management
Smart Ticketing
Urban Logistics
Other:
1 . G E N E R A L D E S C R I P T I O N
Problems to solve /
Objectives
Issue(s) encountered:
In the Rotterdam region, the P&R sites offer free parking for all users. The
Rotterdam Alexander site is close to a metro/intercity train station and
has 535 parking places. A lot of non PT-users make use of the P&R site to
go shopping or working in the area instead of using the P&R for its main
purpose. Due to this, it is possible that people, who do want to use the
P&R for travelling with PT, cannot find a parking place.
Objective(s) of the measure/service:
The aim of this measure (pricing strategies for P&R) is to regulate the use
of the P&R-site and ensure the availability of parking spaces for public
transport (PT-) users at the P&R site "Rotterdam Alexander".
The measure had also a number of internal objectives. Achieving these
objectives was an important pre condition for the continuation of this
measure. The objectives are: Achieving an average occupancy rate of
80% or more; The parking pressure in surrounding residential areas
should increase with no more than 10%; The share of the non-target
group should be less than 50%.
Start of system/service The actual measure was implemented in May 2004.
Location single road/line city district whole city urban region
Transport mode(s)
concerned
public transport rail road car-sharing
bicycles pedestrians other: Park and Ride
Implementing
organisation
The parking system was realised under supervision of the department for
street supervision and parking enforcement of the city of Rotterdam.
System / service
description
During the pilot phase (from 2004 to 2006), people who could show a
public transport ticket (with correct stamp and date) would get a free
parking ticket. People who could not show a ticket had to pay a parking
tariff. Controllers who were present from 7:00 -20:00 checked the tickets.
After the pilot phase, a pay-machine was used to recognise a legal public
transport ticket with stamp or a public transport ticket without one.
Technologies
Standards
2 . I M P L E M E N T A T I O N
Partners involved
Public authorities: the city of Rotterdam
Private stakeholders:
Others:
Organisational model
Management body: a central department (Stadstoezicht) of the city.
Operating body: the city department Gemeentwerken is responsible for
the maintenance of the area
Financing body: central city development department of the
municipality
U R B A N I T S E X P E R T G R O U P
ITS Action Plan – Best Practices: Collection of projects 95
Business model
Public investment:
Private / commercial framework:
Public-private partnership:
Investment costs
The total costs for the altered design of the P&R facility are estimated at
approximately 200.000 Euros. These are only the costs for hardware and
not for personnel budgets.
Operating costs
€ / year: person / year:
The maintenance costs of the facility seem reasonably low although higher
than in the previous situation especially since the technical system
encountered some problems at the start of the implementation.
3 . R E S U L T S
Technical performance
Implementation of
Innovation
Safety impacts
Efficiency impacts
The implementation of this measure clearly affected the use of the P&R
site: after implementation the share of the dedicated target group (public
transport users) increased considerably. Although several indicators were
rated positive (ease of use, number of information sites), the impact on
occupancy rates was still ambivalent. Even though the relative number of
users from the target group (PT users) increased, the absolute number of
users declined: the occupancy rates decreased from close to 100% to
65%.
Because of this, and because the behaviour of the non target group is
unclear, it was not possible to make final conclusion about modal shifts.
Environmental impacts
Changes in fuel efficiency and environmental impacts (emissions, noise)
in this case relate to changes in modal split. As the study concluded
there were not enough prove that a modal shift took place, these
indicators are not affected.
Socio-economic impacts
Revenue generation
User acceptance
Before this measure was implemented a lot of users (44%) were less
satisfied with the number of parking places.
The acceptance rating related to maintenance of the site clearly
showed improvement. In the pre-situation 44% of the users gave a
positive value to this item. After the implementation of the measure this
increased to 90%.
The satisfaction rating for safety also increased, from 65% to 80%.
Main reasons for this are the improved lighting and increased
supervision.
The rating for the accessibility slightly decreased (from 93% to
83%) but is still very high.
The electronic system was rated less favourable (65% satisfactory)
because of a number of technical failures that occurred.
4 . L E S S O N S L E A R N T
Factors for success
Although some barriers have been identified (e.g. property ownership),
there were no major obstacles to implement this measure. The most
relevant recommendation would come from the fact that measures of this
kind affect many parameters. Therefore an extensive analysis and

U R B A N I T S E X P E R T G R O U P
ITS Action Plan – Best Practices: Collection of projects 96
assessment is needed for several years to really understand the impact of
these types of measures.
Obstacles
One of the main barriers was the uncertainty about the ownership
rights of this public area. The city districts (Deelgemeenten) felt
reluctant to taking up the ownership since this would also lead to
additional efforts in relation to spatial planning plans as well as possible
financial repercussions. Finally it was decided that the central city
development department of the municipality would be owner and another
central department (Stadstoezicht) would be responsible for control and
management. The discussion about this issue caused some delay in
reaching he milestones.
Another barrier related to the previous, is the question of maintenance
of the P&R area. After several months of discussion (and delays) it was
finally decided that the city department Gemeentwerken is responsible for
the maintenance of the area.
There were also objections raised by neighbours leading to an
additional barrier and delays.
Another barrier was formed by the search for a feasible technological
solution.
5 . M O R E I N F O R M A T I O N
Contact Person
Name: Uitzinger, J; Jan Saft, R.; Derijcke, E. Year of study/report: 2006
Function:
Company: IVAM - University of Amsterdam BV
Email:
Phone:
Web link (if existing)
U R B A N I T S E X P E R T G R O U P
ITS Action Plan – Best Practices: Collection of projects 97
3.42 NL - Rotterdam -. Truck Parking in Residential Areas
URBAN ITS
KEY APPLICATION
Traffic & Travel Information
Traffic & Access Management
Smart Ticketing
Urban Logistics
Other:
1 . G E N E R A L D E S C R I P T I O N
Problems to solve /
Objectives
Issue(s) encountered: The reason behind the introduction of Truck Park
Management is the need to prevent parking of trucks in residential
areas.
As the Rotterdam Fruitport is located in the immediate vicinity of a
residential area, many local truck drivers make use of this area to
park their vehicles, especially in the weekends. Therefore the
residents of urban areas close to the port district face safety, noise and
accessibility problems because of the parking of truck-combinations.
Objective(s) of the measure/service: The main goals of the measure
Truckpark Fruitport are to better accommodate trucks and to better
regulate the movement of lorries from the highways to the port area.
An additional expected outcome is that the measure is thought to speed
up the handling/ processing of orders. The immediate objective of
the measure was the expansion of the Truck Parking management
concept with 20 new parking spaces. The ultimate objective is a
reduction of truck parking in the residential areas.
Start of system/service The first designs were made in 1997 and it took about 8 years to grow to
the mature phase where it is now.
Location single road/line city district whole city urban region
Transport mode(s)
concerned
public transport rail road car-sharing
bicycles pedestrians other: Freight and truck parking
Implementing
organisation
The initiative for the truck parking management was taken by the Port
of Rotterdam (HavenbedrijfRotterdam N.V.). In the design phase there
was no necessity for specific cooperation with other public or private
bodies.
In the implementation phase some cooperation was needed with both
the municipality of Rotterdam and the administrative area
Delfshaven. These bodies support the project with necessary permits.
Furthermore throughout the project the local police department has
been informed and asked for increasing parking control in the residential
areas
In the course of 2005 the maintenance and management of the truck
parking area has been transferred to a foundation that has been founded
amongst others for this purpose. The foundation is established by (a part
of) the participating companies in the Fruitport area. The Port of
Rotterdam will play an advisory role.
System / service
description
Extended parking area (the number of parking spaces increases from 40
to 60)
Improved facilities
Improved regulation and movement of lorries, thanks to a truck parking
management system, including a traffic circulation plan and traffic
guidance systems.
Signing of truck parking area; Special attention has been given to
U R B A N I T S E X P E R T G R O U P
ITS Action Plan – Best Practices: Collection of projects 98
communication issues, especially to the truck drivers (EU and non-EU
drivers) as main target group.
Technologies
Standards
2 . I M P L E M E N T A T I O N
Partners involved
Public authorities: municipality of Rotterdam, the administrative area
Delfshaven, the local police department
Private stakeholders: The Port of Rotterdam, the foundation
responsible for the management and maintenance of the truck parking
area, established by (a part of) the participating companies in the
Fruitport area
Others:
Organisational model
Management body: the Fruitport foundation established by
participating companies in the Fruitport area
Operating body: The Port of Rotterdam and the Fruit foundation
established by participating companies in the Fruitport area
Financing body:
Business model
Public investment:
Private / commercial framework:
Public-private partnership:
Investment costs Approximately 1 million €
Operating costs € / year: person / year:
3 . R E S U L T S
Technical performance
Implementation of
Innovation
Safety impacts
Efficiency impacts
Environmental impacts
The decrease of parking movements in the residential areas has shifted
peak noise burden from populated areas to less populated areas. The
(difference in) peak noise levels have not been measured.
Impacts on land use and other traffic related emissions are expected to be
minimal.
Socio-economic impacts
Revenue generation
Although a gate fee might possibly be introduced in the future, it is not
expected that these revenues will compensate for all of the variable and
maintenance costs.
User acceptance
The implementation of the Truckpark Fruitport has led to less parking
movements in the surrounding areas. Therefore the conclusion has been
made that citizens in these areas would have a positive attitude towards
this measure, although the acceptance amongst citizens has not been
surveyed.
Clear communication to the main target group, the truck drivers, about
the benefits of the measure is a necessity to reach the goals set.

U R B A N I T S E X P E R T G R O U P
ITS Action Plan – Best Practices: Collection of projects 99
4 . L E S S O N S L E A R N T
Factors for success
An evident success factor was the clear separation of tasks between
the stakeholders. The Port of Rotterdam was only responsible for design
and implementation. The Fruitport Foundation is responsible for
maintenance and management of the truck parking area. This agreement
both enhanced the positive attitude of Port of Rotterdam as did it enhance
the acceptance and support of the companies in the Fruitport area.
The acceptance for the project in the residential areas was ensured from
the start but positively influenced by the activities of the local
authorities in parking control and therewith stimulates truckdrivers to
avoid the residential area.
A factor that clearly can disturb the project is insufficient communication
with and encouragement of the truckdrivers. Clear communication to
the main target group, the truck drivers, about the benefits of the
measure is a necessity to reach the goals set. An appropriate signing of
the route to the truckparking area is necessary. Also the fees for the truck
parking area should not be too high in order to avoid unwanted effects
such as transfer of the initial problems to other areas.
Obstacles
The main barrier for this measure was the acceptance by truck drivers to
use the Truckpark. It is essential to communicate with them and explain
the benefits of the Truckpark in terms of safety, convenience and
efficiency. Here the use of the Truckpark was stimulated and enforced by
the companies that actually handle the cargo. There were no major other
barriers from political/administrative, societal, economical, technical, or
other factors.
Transferability: It is expected that the uptake potential of this measure is
not very large. The situation of a harbour area in close vicinity of
residential areas is not common in Europe. On the other hand the uptake
potential could grow if truckparking management proves to be suited for
other areas as well, i.e. industrial zones in the vicinity of residential areas.
5 . M O R E I N F O R M A T I O N
Contact Person
Name: Uitzinger, J; Jan Saft, R.; Derijcke, E., 2006
Function:
Company: IVAM - University of Amsterdam BV
Email:
Phone:
Web link (if existing)

U R B A N I T S E X P E R T G R O U P
ITS Action Plan – Best Practices: Collection of projects 100
3.43 NL - Rotterdam - The Traffic Enterprise (De Verkeersonderneming)
URBAN ITS
KEY APPLICATION
Traffic & Travel Information
Traffic & Access Management
Smart Ticketing
Urban Logistics
Other:
TITLE De Verkeersonderneming
(The Traffic Enterprise)
1 . G E N E R A L D E S C R I P T I O N
Problems to solve /
Objectives
The main objective of De Verkeersonderneming is to keep the Port of
Rotterdam and the A15-corridor accessible during the widening of the A15
highway and the construction work on the Maasvlakte. As a director,
partner and initiator De Verkeersonderneming is the mediator in the
network connecting employees, companies, authorities and other partners
with one another. Concrete goals are to reduce the amount of vehicles on
the A15 highway and reduce rush hour traffic by 20% through mobility
management, and maximizing the capacity and flow on the A15 through
traffic management. The goal for 2011 is to achieve a travel time of 38
minutes during rush hour along the A15 in 95% of cases (the average was
45 minutes).
Location single road/line city district whole city urban region
Transport mode(s) public transport road multi-modal other:
Implementing
organisation
The Municipality of Rotterdam, Rotterdam Metropolitan Region, Ministry of
Transport, Public Works and Watermanagement and Port of Rotterdam
Authority
System / service
description
De Verkeersonderneming focuses on a number of aspects to achieve the
imposed objectives: - Availability of alternative transportation modes and increasing the
visibility and practicality of these modes. - Stimulate the reduction of truck transportation by offering
alternatives on waterways and rail.
- Less hindrance by goods transportation and incidents during rush hour.
- Adjusting road markings around the Botlektunnel - Improve incident management after accidents
Technologies Traffic Management systems, Dynamic Route Information Panels.
Standards Communication standards for traffic management systems and dynamic
route information panels.
Start of system/service 2008
2 . I M P L E M E N T A T I O N
Role model (tbc)
The unique form of collaboration between the various governments
represented by De Verkeersonderneming ensures their role as a
stimulator for innovation and developments for traffic information, while
not directly being the initiator.
Partners involved Deltalinqs, municipality Spijkenisse, the Kamer van Koophandel, TLN,
province of South Holland and the Police Rotterdam-Rijnmond.
Business model Governmental collaboration

U R B A N I T S E X P E R T G R O U P
ITS Action Plan – Best Practices: Collection of projects 101
3 . R E S U L T S
Technical performance
Safety impacts
De Verkeersonderneming has great interest in safely guiding the traffic
through the large scale road- and construction works on the A15 and the
Port of Rotterdam. Traffic management improves the safety level of the
A15 highway through signage and warning systems.
Efficiency impacts
The collaboration between governmental layers and executive agencies
improves communication efficiency between them and the various
developers of applications for the end user, who will eventually benefit
most from the congestion reduction.
Environmental impacts Congestion reduction leads to improvements in air quality, though this is
not directly the scope of the project.
Socio-economic impacts
The public relations image of construction works and the A15 corridor
benefits from the improved connectivity and congestion reduction thanks
to the stimuli offered to the applications market by De
Verkeersonderneming.
Revenue generation No direct revenue generation. Congestion reduction leads to less
economic damage for road users.
User acceptance
The main success factor for user acceptance is congestion reduction which
is achieved by the measures implemented by De Verkeersonderneming.
They do not run user acceptance evaluations as the end user is not
directly in the scope of De Verkeersonderneming rather than the
developers of applications for the end users.
4 . L E S S O N S L E A R N T
Factors for success
Strong communication and collaboration between De
Verkeersonderneming, the various local and provincial governmental
agencies and the executive agencies and constructors in charge of the
roadworks.
Obstacles
Collaborative problems between the various partners and the executive
organisation will cause the quality and quantity of travel information to
decrease.
5 . M O R E I N F O R M A T I O N
Contact Person De Verkeersonderneming, +31 10 402 69 03
Web link (if existing) http://www.verkeersonderneming.nl/

U R B A N I T S E X P E R T G R O U P
ITS Action Plan – Best Practices: Collection of projects 102
3.44 NL – Urban Freight Energy Efficiency Pilot (Helmond Freilot)
URBAN ITS
KEY APPLICATION
Traffic & Travel Information
Traffic & Access Management
Smart Ticketing
Urban Logistics
Other: Driving support / speed limitations
1 . G E N E R A L D E S C R I P T I O N
Problems to solve /
Objectives
The FREILOT service aims to increase energy efficiency drastically in road goods transport in urban areas through a holistic treatment of traffic management, fleet management, the delivery vehicle and the driver, and demonstrate in four linked pilot projects that up to 25% reduction of fuel consumption in urban areas is feasible.
The second important objective is to widely disseminate and share the pilot results with all relevant stakeholders so that the FREILOT service can become a truly pan-European solution for energy efficient, holistic and
integrated goods transport in urban areas.
The third objective is to increase the involvement of fleet operators, cities and other stakeholders in the scheme.
Smooth driving behaviour, optimised planning and routing combine with smooth heavy vehicle targeted traffic control can contribute to achieve
higher fuel efficiency, less pollution, higher driver comfort and more efficient use of infrastructure.
Location single road/line city district whole city urban region
Transport mode(s) public transport road multi-modal other:
Implementing
organisation The Freilot Consortium supported by the European Commission, Ertico
System / service
description
The traffic management element of FREILOT will optimise the traffic control system to reduce heavy vehicle fuel consumption.
The fuel consumption of a motor vehicle is determined by its speed and acceleration. In urban areas speed is of lesser importance while acceleration, due to many stop-go cycles or slowing at intersections and roundabouts, is the main factor responsible for high fuel consumption.
Optimising traffic control for maximum fuel efficiency would aim to minimise congestion and vehicle stops at signal-controlled intersections and roundabouts.
To achieve this goal several innovative measures are implemented to locally improve coordination and avoid heavy goods vehicle stops through selective detection (by size or by vehicle/fleet identity) and priority at individual signalised intersections.
Vehicle - Acceleration limiter and adaptive speed limiter
This feature limits vehicle acceleration in order to reduce excessive fuel consumption. In typical stop-start urban traffic, full acceleration of a truck from a stop
light up to cruising speed can contribute around one-third of its total fuel consumption. The acceleration limiter concept is aimed at those vehicles that need to perform many speed changes, such as urban delivery trucks, for which it can significantly reduce consumption due to excessive acceleration. The technology for acceleration limiter is mature today and there is strong interest to validate a system with good balance between comfort,

U R B A N I T S E X P E R T G R O U P
ITS Action Plan – Best Practices: Collection of projects 103
fuel savings, driver acceptance and time for delivery.
The FREILOT integrated service allows for the optimisation of a traffic
control system according to the presence of goods vehicles equipped with an acceleration/speed limiter, so that these vehicles – even if taking more time to achieve cruising speed – would arrive at the next signal in time to receive a green light.
Driver - Enhanced “green driving” support
The FREILOT service provides direct support for an economic driving style. The eco-driving function supports the driver to optimise the vehicle’s fuel economy through his/her acceleration, braking and gear-changing behaviour.
While driving, continuous information on accelerator position, instant consumption, average consumption and a general performance rating on eco driving level is provided to the driver. If one of the parameters has
very low performance the driver receives a message requesting him to improve his behaviour in terms of fuel consumption.
The eco-driving support service is not only a technical matter but is very much oriented at the driver behaviour, and at the driver’s ability to receive and integrate the advice given.
Fleet management - Real-time loading/delivery space booking
Each time a driver has to deliver goods, he needs either a private space or
a delivery area to park his vehicle; the latter one is the most convenient place to park, since has very little impact on traffic efficiency and is the safest place to leave the vehicle for other users and for the driver himself. When there are no such spaces available, because a driver already use it, or cars are illegally parked on them the drivers mainly use double lane stops. Unfortunately such stops have negative impacts on traffic flow,
environment (by increasing CO2 emissions) and on safety.
Giving the driver the ability of booking a delivery space before he reaches his delivery point will:
• increase the number of stops made on delivery areas, and decrease the number of double lane stops; • reduce all negative impacts due to double lane stops, as listed above; • reduce driver stress, optimise delivery time operations, and significantly improve drivers work conditions.
If the vehicle is out of schedule the operator could reassign a new delivery space according to the new time schedule in order to keep the delivery area available for the other users. This measure will optimize the
routs for each vehicle, reduce the kilometres and number of stops that each vehicle performs.
Technologies Traffic light management, speed assessment and limiting devices, delivery
space booking.
Standards Various depending on type of service
Start of system/service Helmond – October 2010
2 . I M P L E M E N T A T I O N
Role model (tbc)
Data control: Moviloc, Micronav Professional, Flotsanet, GPS/Galileo
Fleet management products: GMV, Micronav, Fagor Electronica, Cenoclap
Simulator manufacturers: Autosim, Prosolvia Clarus
Delivery space booking: Bookings Tracker

U R B A N I T S E X P E R T G R O U P
ITS Action Plan – Best Practices: Collection of projects 104
Partners involved
In Helmond:
- The Municipality of Helmond
- The Helmond Fire Brigade
- Van den Broek Logistics
- Ambulance services Helmond
- Peek Traffic
- Volvo – Renault
- Ertico
Business model PPS
3 . R E S U L T S
Technical performance The pilot is currently being undertaken and will be concluded in october
2011. Technical performance can best be addressed after this date.
Safety impacts
In addition the parking booking functionality of the FREILOT service
should reduce negative impacts of double lane stops, improve work and
safety conditions while delivery operations for drivers, especially in urban
areas.
Efficiency impacts
By implementing acceleration/speed limiters and eco-driving support in
their vehicles, fleet operators benefit from increased energy efficiency
(lower fuel consumption) and from having priority at intersections on
certain roads or during certain times of day, as well as better operational
efficiency and reliability thanks to the delivery space booking service.
Environmental impacts
Every city that would update their traffic management system to support
selective priority for eligible goods vehicle will benefit from the
possibility to “steer” goods traffic towards preferred roads or preferred
times of the day (e.g. early hours in the morning), through an incentive-
scheme.
Overall, it is expected that cities will benefit from lower fuel consumption,
CO2 emissions reduction, better control of traffic flow leading to a better
environment and air quality.
Socio-economic impacts
Drivers benefit from having priority at certain intersections and the
support to become a more eco-friendly driver by adapting their driving
style to use less acceleration and speed. Adopting an eco-friendly driving
style leads to less stress for the driver and reduced risk of accidents.
Revenue generation Transportation companies benefit from reduced fuel consumption and
more reliable logistics leading to cost reductions.
User acceptance The pilot is currently being undertaken and will be concluded in October
2011. User acceptance can best be addressed after this date.
4 . L E S S O N S L E A R N T
Factors for success
A drastic improvement of the energy efficiency and sustainability of goods transport in urban areas can only be achieved if a holistic approach, involving all relevant stakeholders, is taken. If the focus is put only on
one aspect like improvement of vehicle technology, the optimal benefits
may never be reached.
Obstacles
The project needs to be able to prove the successfulness of the
aforementioned efficiency impacts to justify costs and further
implementation
5 . M O R E I N F O R M A T I O N
Contact Person
Zeljko Jeftic – Project Coordinator
Tel: +32 (0)2 400 07 31
Fax:+32 (0)2 400 07 01
Email: [email protected]

U R B A N I T S E X P E R T G R O U P
ITS Action Plan – Best Practices: Collection of projects 105
Web link (if existing) http://www.freilot.eu
U R B A N I T S E X P E R T G R O U P
ITS Action Plan – Best Practices: Collection of projects 106
3.45 NL - Rotterdam - Havenbedrijf (Port of Rotterdam Authority)
URBAN ITS
KEY APPLICATION
Traffic & Travel Information
Traffic & Access Management
Smart Ticketing
Urban Logistics
Other:
1 . G E N E R A L D E S C R I P T I O N
Problems to solve /
Objectives
The aim of the Port of Rotterdam Authority is to enhance the port of
Rotterdam’s competitive position as a logistics hub and world-class
industrial complex. They manage, operate and develop the Rotterdam
port and industrial area. And therefore, they invest in the development of
the existing port area, new port sites (Maasvlakte 2), public infrastructure
and the handling of shipping. Together with their partners they aim
towards a multipurpose, sustainable, safe and attractive port that meets
the high demands of society.
Location single road/line city district whole city urban region
Transport mode(s) public transport road multi-modal other:
Implementing
organisation
The Port of Rotterdam Authority is an autonomous company with two
shareholders, the municipality of Rotterdam and the Dutch state.
Although publicly owned it is run like a commercial company.
System / service
description
The most visible and important service being implemented by the Port of
Rotterdam authority is the Roportis (Realtime Online Port Of Rotterdam
Traffic Information System) online tool for traffic information. It is an
integrated tool using four different methods to collect traffic data. Based
on this traffic information various traffic management scenarios are
formulated to guarantee good traffic flow, prioritize traffic and offer a
strategic framework for routes and deviations. A regional desk can
implement any of 8 traffic management scenarios based on triggers given
by the traffic data collection tools.
Technologies Traffic data collection through road-embedded nodes, VERI, WIM and
Bluetooth
Standards
Start of system/service 2010
2 . I M P L E M E N T A T I O N
Role model (tbc)
Partners involved IT&T (developer of Roportis tool)
Business model Governmental collaboration
3 . R E S U L T S
Technical performance Roportis.com has been online since the start of the service and
functioning successfully.
Safety impacts
Improved traffic management has allowed dangerous situations on the
road network to be solved more efficiently, allowing better
communications between the various organisations responsible for the
network.

U R B A N I T S E X P E R T G R O U P
ITS Action Plan – Best Practices: Collection of projects 107
Efficiency impacts Improved traffic flow has increased the Port’s accessibility and
connectivity, allowing shipments and deliveries to be more precise.
Environmental impacts
Congestion reduction and improved traffic flow reduce vehicle emissions
and fuel consumption. Neighbourhoods around the port areas profit from
the improved air quality.
Socio-economic impacts
The Port of Rotterdam Authority can boast better accessibility for the
companies shipping in the port, increasing the value of port services and
overall image. Residential areas around the port profit from the
environmental improvements.
Revenue generation
No direct revenue is generated from the aforementioned applications, but
companies do profit from the improved accessibility and traffic flows
around the harbour.
User acceptance
Improving traffic flows in areas of heavy traffic and industry can always
rely on support from frequent users as time margins and delivery
reliability is increased.
4 . L E S S O N S L E A R N T
Factors for success
Accurate and reliable traffic information, good communication between
involved traffic management parties, good communication to the end
users regarding traffic and road status.
Obstacles
The cooperation between the various governmental layers, the port
authority and the road network supervisors has to be solid in order to
achieve the criteria for success.
5 . M O R E I N F O R M A T I O N
Contact Person
Zlatan Muhurdarevic
T +31 (0)10 252 1194
F +31 (0)10 252 10 20
M+31 (0) 622987285
Web link (if existing) http://www.portofrotterdam.com, www.roportis.com

U R B A N I T S E X P E R T G R O U P
ITS Action Plan – Best Practices: Collection of projects 108
3.46 NL - Openbaar Vervoer Chipkaart (Public Transport Chipcard)
URBAN ITS
KEY APPLICATION
Traffic & Travel Information
Traffic & Access Management
Smart Ticketing
Urban Logistics
Other:
1 . G E N E R A L D E S C R I P T I O N
Problems to solve /
Objectives
The objective is the creation of a single nationwide electronic payment
method for all public transportation modalities. The transportation card
will replace all paper tickets by 2012, making it possible to travel with a
single electronic payment system on all buses, trams, metros, ferries and
trains.
Location single road/line city district whole city urban region
Transport mode(s) public transport road multi-modal other:
Implementing
organisation Ministry of Infrastucture and the Environment
System / service
description
An electronic card has been deployed, allowing passengers to charge the
card with credit on the internet or through charging units in stations and
on (some) buses. The card must be ‘swiped’ on an electronic unit upon
entering the transportation modality, be it a bus, tram or on the platforms
in train station to allow ‘checking-in’. Upon arrival at the destination, the
card is once again ‘swiped’ to signal the passenger is checking out.
Transportation authorities can check the status of the passengers’ cards
with an electronic reading device.
Technologies Electronic travel registration and payment through chipcards and
charging/checking units.
Standards
Start of system/service Large scale pilot projects started in 2004, implementation in a number of
provinces in 2008, nationwide implementation in 2011.
2 . I M P L E M E N T A T I O N
Role model (tbc) ‘Tripperpas’, pilot project in Groningen (2001,2002), ‘Oyster card’, Londen
(2003)
Partners involved
The five main public transportation companies GVB, HTM, NS en RET
joined together to from Trans Link Systems (TLS) (Connexxion was also a
partner until 2010) and united with other mobility companies forms Mobis.
Business model PPP
3 . R E S U L T S
Technical performance
A variety of start-up problems were found during the implementation of
pilot projects with the OV-chipcard. Privacy issues concerning travel- and
payment information and the so-called ‘hacking’ of the card (making it
relatively easy for people to travel for free) were serious issues that have
been addressed during the initial implementation.
Safety impacts Less cash payments are made in public transport, making drivers less
subjects of crime.
Efficiency impacts
Creating a single payment system and travel card offers great advantages
for consumers and transportation companies. Consumers can avoid
having to buy different tickets and have a single entity to deal with for
questions and problems with the transportation card. Transportation

U R B A N I T S E X P E R T G R O U P
ITS Action Plan – Best Practices: Collection of projects 109
companies can save on personnel and administrative costs as ticket
controls and sales can be automated.
Environmental impacts With the (future) disappearance of paper tickets, production costs and
environmental impact is reduced.
Socio-economic impacts
Implementing a new single payment method for all public transport has
required an adjustment in the perception of all users. In the long run,
ease of payment can stimulate the use public transportation. Adjustments
to tariffs, promotions or incentives can be implemented more easily in
order to adjust consumer behaviour.
Revenue generation
Revenue structures by transport companies are more flexible as the price
per kilometre can be defined with more precision by built-in GPS- or
location systems. Whether public transport company revenue has
effectively increased because of the OV-chipcard is unknown.
User acceptance
Upon introduction the OV-chipcard was criticized, especially regarding the
high tariffs that were charged for people who forgot to ‘check-out’ of the
system and technical defects which occurred in the initial stages of
implementation. The final stage of introduction, meaning the
disappearance of paper tickets and the OV-chipcard becoming the only
transport ticket available, will make it possible to further assess user
acceptance.
4 . L E S S O N S L E A R N T
Factors for success
Long term acceptance is created by high reliability and evident user-
friendliness, both factors having been problematic upon introduction of
the card. There is also a certain period of social adjustment to such a new
large scale introduction which has to be bridged before the actual success
can be assessed.
Obstacles
Technical failures and privacy concerns can negatively influence the
general opinion and politics behind the OV-chipcard, endangering the final
steps of introduction and creating tensions between the TLS partners and
the responsible governmental institutions. Privacy and hacking issues
have arisen, leaving space for improvements and adjustments to the
further development of the system.
5 . M O R E I N F O R M A T I O N
Contact Person Trans Link Systems +31 (0)900-0980
Web link (if existing) http://www.ov-chipkaart.nl/
U R B A N I T S E X P E R T G R O U P
ITS Action Plan – Best Practices: Collection of projects 110
3.47 NL - Spitsmijden, Avoiding Rush Hour
URBAN ITS
KEY APPLICATION
Traffic & Travel Information
Traffic & Access Management
Smart Ticketing
Urban Logistics
Other: Mobility Management
1 . G E N E R A L D E S C R I P T I O N
Problems to solve /
Objectives
Decongestion of preselected highway segments through financial
incentives to utilize alternative mobility methods
Location single road/line city district whole city urban region
Transport mode(s) public transport road multi-modal other:
Implementing
organisation
Rijkswaterstaat (The National Public Works and Water Management
Department), Nederlandse Spoorwegen (Dutch Railways)
System / service
description
Four pilot programmes were conducted from 2006 to 2009, rewarding car
users who avoided rush hour traffic on preselected highway segments. A
preselected test group was given 4 euro for each rush hour they avoided
by utilizing public transportation or adjusting their workday to avoid
congestion delays.
Technologies Car detection and recognition technologies
Standards
Start of system/service 2006
2 . I M P L E M E N T A T I O N
Role model (tbc)
Partners involved
Bereik!, Ars Traffic & Transport Technology, Rabobank, Vrije Universiteit
Amsterdam, Universiteit Utrecht, Technische Universiteit Delft, OC
Mobility Coaching, Dutch Railways, RDW
Business model PPS
3 . R E S U L T S
Technical performance
There were some issues with faulty car recognition or payment issues
which were expected to arise in the initial stages of the project. The
problems were tackled during the duration of the pilot(s).
Safety impacts No noticeable safety impacts were perceived as the number of
participants was relatively low.
Efficiency impacts
Most users chose to adjust their departure times to avoid the rush-hours
in the morning and afternoon, while a smaller percentage chose to work
at home more often or change their transportation modality (to public
transport or bicycle).
Environmental impacts The pilot was carried out under a small amount of people making the
environmental impact reduction negligible.
Socio-economic impacts
Participants were stimulated to think about their daily travel routines and
to consider working at home or changing their mode of travel. Such a
consideration has proven to have a strong impact on new ways of
perceiving how to organize a working day.
Revenue generation No direct revenue was generated as participants were only rewarded and
could not be taxed once their reward credit was depleted.

U R B A N I T S E X P E R T G R O U P
ITS Action Plan – Best Practices: Collection of projects 111
User acceptance
The way alternative travel information was presented was an important
element in the users’ decision to change their habitual routine.
Participants have been found to use only part of the available information
and discard other types.
4 . L E S S O N S L E A R N T
Factors for success More volume needed in order to define impact on congestion reduction.
Obstacles
Fraud can undermine the reliability and image of the system, as well as a
great reduction in congestion can cause more people to take the car as
traffic flow is restored and travel times become more reliable.
5 . M O R E I N F O R M A T I O N
Contact Person [email protected]
Web link (if existing) http://www.spitsmijden.nl/
U R B A N I T S E X P E R T G R O U P
ITS Action Plan – Best Practices: Collection of projects 112
3.48 NL - Brabant – Spitsmijden, Avoiding the Peak
URBAN ITS
KEY APPLICATION
Traffic & Travel Information
Traffic & Access Management
Smart Ticketing
Urban Logistics
Other: Mobility Management
1 . G E N E R A L D E S C R I P T I O N
Problems to solve /
Objectives
This rush-hour avoidance trial, known in Dutch as Spitsmijden in Brabant,
is designed to discover what can induce drivers to choose not to drive in
or out of urban centres at peak times. We are learning about the impact
of rewards and information on drivers’ travel behaviour. This knowledge
should allow us to build solutions to future accessibility problems in the
urban centres of Noord-Brabant province and the Netherlands in general.
Location single road/line city district whole city urban region
Transport mode(s) public transport road multi-modal other:
Implementing
organisation
Noord-Brabant provincial authority and the Eindhoven Regional
Partnership (SRE)
System / service
description
Participants in the project receive a monetary reward of up to € 100 a
month if they avoid Eindhoven or ‘s-Hertogenbosch at peak times. To
support their decision-making they receive up-to-date information via an
innovative system.
Peak hours: morning: 07.30-09.30, Monday to Friday evening: 15.30-13.30, Monday to Friday
Target areas: ‘s-Hertogenbosch: centre, Paleiskwartier Noord, Onderwijsboulevard Eindhoven: centre (the entire area within the ring road)
Reward: Participants will receive a fixed sum of money each month, which can
rise to as much as € 100. Every time they drive during peak hours, € 2.50 or € 1.25 (in the case of participants who live close to the target area) will be deducted. The idea is that those who change their
behaviour will be rewarded for doing so. Participants who do not change their travel behaviour will receive nothing.
Participants will also be given a travel computer, the TravelStar, which gives them the latest information on roadworks, schools in the vicinity, and parking. Research has shown that if travellers can consider all the alternatives (including the costs) beforehand, they
make more conscious choices.
Technologies Satellite navigation through on-board unit, multi-modal travel and traffic
information through handheld device.
Standards
Start of system/service October 2010 – April 2012
2 . I M P L E M E N T A T I O N
Role model (tbc)
Comparable projects: Spitsmijden A12, Spitsmijden Gouda-Den Haag,
Spitsmijden in het OV, SLIM Prijzen Arnhem/Nijmegen, Spitsscoren
Rotterdam. These projects offer the same incentive as Spitsmijden in
Brabant, with the exception that Spitsmijden in Brabant has focused on
offering valid travel alternatives through dynamic and thorough
travel/traffic information on a handheld device named Travelstar

U R B A N I T S E X P E R T G R O U P
ITS Action Plan – Best Practices: Collection of projects 113
Partners involved
‘s-Hertogenbosch and Eindhoven city councils, the Ministry of
Infrastructure and the Environment, and the members of the Mobility
Management Platform, National Data Warehouse for Traffic Information
(NDW)
Business model Governmental collaboration
3 . R E S U L T S
Technical performance
The technical performance of the TravelStar device was sufficient, even
though there were complaints of incomplete or insufficient information
and questions were raised on the usefulness of an extra device compared
to the integration of a system or app in navigation units or smartphones.
Safety impacts
- The TravelStar handheld device is programmed to warn participants
when a school is approached during start- or ending hours of a school
day. A warning is given to adjust the car speed accordingly, improving the
traffic safety around schools.
- By participants users to avoid road works through alternative travel
modes or routes, road workers’ safety was improved.
Efficiency impacts
Most users chose to adjust their departure times to avoid the rush-hours
in the morning and afternoon, while a smaller percentage chose to work
at home more often or change their transportation modality (to public
transport or bicycle).
Environmental impacts The pilot was carried out under a small amount of people (1600
participants), making the environmental impact reduction negligible.
Socio-economic impacts
Participants were stimulated to think about their daily travel routines and
to consider working at home or changing their mode of travel. Such a
consideration has proven to have a strong impact on new ways of
perceiving how to organize a working day.
Revenue generation No direct revenue was generated as participants were only rewarded and
could not be taxed once their reward credit was depleted.
User acceptance
The way alternative travel information was presented was an important
element in the users’ decision to change their habitual routine.
Participants have been found to use only part of the available information
and discard other types.
4 . L E S S O N S L E A R N T
Factors for success
- Up-to-date and dynamic traffic, public transport and roadwork
information increase the relevance and practicality of the alternative
travel solution.
- Due to the small amount of participants congestion reduction was
negligible, but the project has demonstrated that large scale
implementation of the Spitsmijden concept could work to achieve
congestion reduction.
Obstacles
- Accurate and dependable travel information are key elements to ensure
reliability and efficacy of the system.
- Costs/benefits analyses have to prove the systems’ efficiency and
feasibility in a large scale implementation.

U R B A N I T S E X P E R T G R O U P
ITS Action Plan – Best Practices: Collection of projects 114
5 . M O R E I N F O R M A T I O N
Contact Person ing. Y.M. van Velthoven-Aarts, www.sre.nl +31 40 259 45 61
Web link (if existing)
www.brabant.nl (search spitsmijden)
www.spitsmijdeninbrabant.nl
www.bramm.nl

U R B A N I T S E X P E R T G R O U P
ITS Action Plan – Best Practices: Collection of projects 115
3.49 NL - Yellowbrick / Parkline
URBAN ITS
KEY APPLICATION
Traffic & Travel Information
Traffic & Access Management
Smart Ticketing
Urban Logistics
Other:
1 . G E N E R A L D E S C R I P T I O N
Problems to solve /
Objectives
Enable and improve mobile parking payment methods for on-street
parking.
Location single road/line city district whole city urban region
Transport mode(s) public transport road multi-modal other:
Implementing
organisation Yellowbrick, Parkline
System / service
description
These two commercial service provider initiatives offer a mobile parking
payment service, enabling consumers to confirm their parking spot by
calling a number, texting a parking code of the location or using a
smartphone app upon arrival and departure from their parking spot. Users
pay their parking fees through a monthly invoice.
Technologies Mobile registration of parking duration. Parking enforcers scan barcodes
on cars to retrieve payment or permit status.
Standards Communication standards with regional parking registration database
(RDW), which includes license plate numbers of permit owners.
Start of system/service 2006 (Yellowbrick)
2 . I M P L E M E N T A T I O N
Role model (tbc) Mobile parking systems have been developed globally by commercial
parties in the last decade.
Partners involved 25 Dutch municipalities (Yellowbrick), 33 Dutch Municipalities (Parkline)
Business model PPS
3 . R E S U L T S
Technical performance
Scanning technologies have been improving, allowing more efficiency and
accuracy for the recognition of license plate numbers by parking
enforcers.
Safety impacts
The mobile payment method results in less cash payments being made at
on-street parking machines, making them less prone to crime and
vandalism.
Efficiency impacts Users can accurately time and pay for their parking, limiting payment
excesses which on-street parking is prone to.
Environmental impacts No paper tickets required, payment and processing are fully digitalized.
Socio-economic impacts
More flexibility, time- and cost efficiency for parking service users can be
gained through mobile payment. Yet, due to the theoretically easy
implementation of the system, consumer groups are afraid municipalities
will reduce the number of free parking spaces as an extra source of
income.
Revenue generation
The service providers require a one-time subscription fee of 10 euro, a
monthly subscription of 2,50 euro (Parkline) or 2,40 euro (Yellowbrick)
and a fee for each time the service is used of 0,15 euro (Parkline).
U R B A N I T S E X P E R T G R O U P
ITS Action Plan – Best Practices: Collection of projects 116
Yellowbrick offers the option to choose between a monthly subscription of
2,40 euro or a 0,30 euro fee for every time the service is used.
User acceptance
Frequent public parking (business) users have a number of advantages,
the service providers claiming a 15% reduction in parking fee excess
payments and increased user-friendliness. Service growth is steady yet
not explosive. Concerns have been raised about privacy issues, as parking
registration means the whereabouts of a person can be traced back in
time.
4 . L E S S O N S L E A R N T
Factors for success
The foreseen nationwide availability of the service is expected to stimulate
user growth and popularity, as users will be able to park exclusively using
the mobile parking payment methods.
Obstacles
The remaining municipalities which have not adhered to the service could
obstruct the ambitious nationwide coverage, resulting in less user-
friendliness. Conditions and arrangements between the service providers
and the municipalities can differ, with risks of modification of business
cases and revenue generation models.
5 . M O R E I N F O R M A T I O N
Contact Person
Robert-Jan Staartjes (Waysis > Yellowbrick)
Marius Koerselman (Parkmobile > Parkline)
Web link (if existing) http://www.yellowbrick.nl/, http://www.parkline.nl
U R B A N I T S E X P E R T G R O U P
ITS Action Plan – Best Practices: Collection of projects 117
3.50 NL - Maintenance of Information Standards for Public Transportation BISON
URBAN ITS
KEY APPLICATION
Traffic & Travel Information
Traffic & Access Management
Smart Ticketing
Urban Logistics
Other:
1 . G E N E R A L D E S C R I P T I O N
Problems to solve /
Objectives
Issue(s) encountered: Standardisation of IT communication and data
exchange for public transport travel information.
Objective(s) of the measure/service: To develop and deploy standards
that the industry can use to distribute public transport travel information
in an efficient and harmonised way.
Start of system/service 2008
Location single road/line city district whole city urban region
Transport mode(s)
concerned
public transport rail road car-sharing
bicycles pedestrians other:
Implementing
organisation Platform Bison (secretarial work done by Connekt – ITS Netherlands)
System / service
description
The Bison Platform (Beheer Informatie Standaarden OV Nederland) has
the task to define, maintain, harmonise and guard all standards that
facilitate information exchange within public transportation. Bison acts as
a knowledge platform to define IT-policy and intentions for concessions.
Bison is the result of decision by the National Mobility Deliberation (NMB)
– that is why provinces, city regions, national governments, infrastructure
administrators, transportation companies, market parties and traveller
groups are represented in the platform. Bison is facilitated by Connekt /
ITS Netherlands
The activities of the Bison Platform are:
- the development and maintenance of information standards that are
applied to trustworthy and consistent information exchange between
stakeholders in the public transportation sector.
- researching, judging, controlling and modifying these standards.
- stimulating the continuity and market function applied to information
exchange within public transportation.
- advising on information exchange within public transportation, especially
dynamic travel information.
- aiming to achieve collaboration and/or integration with European and
international standards.
The relation to other partners is as follows: other projects or agencies like
GOVI, 9292, SABIMOS, Drechtsteden and Zuid-Holland realise travel
information on the street or on the internet. To do this, they use the Bison
standards, guaranteeing that the information is transparent and uniform
and can be exchanged between different parties. Within Bison the
‘language’ that is used to communicate about public transport processes
is defined. The scope of Bison is for all public transportation: buses,
trams, metros, trains and ferries.
Technologies
Standards Since the start in september 2008, Bison has defined 6 standards,
including one for planned and real-time travel information at stops,

U R B A N I T S E X P E R T G R O U P
ITS Action Plan – Best Practices: Collection of projects 118
schedule and mutations. An accurate list and description of these
standards can be found at: http://bison.connekt.nl/standaarden/
With this, the travel information component of the project for vehicles was
completed in 2009. In 2010, the development was focussed on realising
information exchange with and over the rail network, stops (accessibility
and administration) and tariffs.
2 . I M P L E M E N T A T I O N
Partners involved
Public authorities: Regio Utrecht, DIVV Amsterdam, Interprovinciaal
Overleg, Rijkswaterstaat, OV-Bureau Groningen Drenthe, Prorail,
Provincie Flevoland, Provincie Friesland, Provincie Gelderland, Provincie
Limburg, Provincie Noord-Brabant, Provincie Noord-Holland, Provincie
Overijssel, Provincie Utrecht, Provincie Zeeland, Provincie Zuid-Holland,
Schiphol Group, Samenwerkingsverband Regio Eindhoven, Stadsgewest
Haaglanden, Stadsregio Amsterdam, Stadsregio Arnhem Nijmegen,
Stadsregio Rotterdam, Regio Twente, SKVV, Vereniging van Nederlandse
gemeenten (VNG).
Private stakeholders: ARS T&TT, Astim Telematica, Bostec, Collis,
Ferranti, HP, InTraffic, Keypoint, Logica, NEA, Peek, Prodata Systems,
Siemens, Strukton, Surtronic, Technolution, Twynstra Gudde, Vialis
Others: Transportation companies: Arriva, Connexxion, GVB, HTM, NS,
9292, RET, Syntus, Trans Link Systems, Veolia Transport, ANWB, Rover
Organisational model
Management body:
President Platform BISON: Chris de Vries (Provincie Noord-Holland)
Treasurer: Paul Potters (Connekt)
Secretary: Martijn van Aartrijk (Connekt)
CAB (Change Advisory Board) President: Klaas Steffens (Arriva)
Operating body: Change Advisory Board & Strategic Committee
Business model
Public investment:
Private / commercial framework:
Public-private partnership:
Investment costs
The project is mostly funded by the partners that offer their personnel
and resources without charge. Therefore, a precise cost definition is not
possible
Operating costs See investment costs
3 . R E S U L T S
Technical performance The standards that have been developed are functioning according to their
specifications and the progress is satisfactory.
Implementation of
Innovation
The standards are being used by all partners and agencies involved,
making the implementation a successful one.
Safety impacts None
Efficiency impacts
As a result of the standards defined in Bison, travellers have very
accurate public transport travel, departure and arrival time estimates,
making public transport more dependable.
Environmental impacts
Increased reliability of public transport is expected to increase its use,
thus having a positive environmental impact, though no studies have yet
been held to show the effects.
Socio-economic impacts
Information can be easily interchanged, making it possible to inform the
end-user in a more efficient and complete way. This will hopefully
increase the modal share for public transportation.
Revenue generation No direct revenue generation involved
U R B A N I T S E X P E R T G R O U P
ITS Action Plan – Best Practices: Collection of projects 119
User acceptance Users do not directly deal with the standards that are compiled in Bison,
though they do reap the benefits of being better informed.
4 . L E S S O N S L E A R N T
Factors for success
All parties must acknowledge the return of investment in the development
of standardised sets of information and the benefits of such a project.
Collaboration and flexibility are required to bring together this vast
amount of partners.
Obstacles
Technical problems can be a serious obstacle, as the information
exchange is enriched or enlarged making the need for standards more
complicated. Partnership collaboration is essential to make speedy and
strong decisions on developments and standards to adopt in the future.
5 . M O R E I N F O R M A T I O N
Contact Person
Name: Martijn van Aartrijk
Function: Secretary
Company: Connekt / ITS Netherlands
Email: [email protected]
Phone:
Web link (if existing) http://bison.connekt.nl/
U R B A N I T S E X P E R T G R O U P
ITS Action Plan – Best Practices: Collection of projects 120
3.51 NL - Public Transport Information without Frontiers GOVI
URBAN ITS
KEY APPLICATION
Traffic & Travel Information
Traffic & Access Management
Smart Ticketing
Urban Logistics
Other:
1 . G E N E R A L D E S C R I P T I O N
Problems to solve /
Objectives
Issue(s) encountered: Travel time and service information from public
transport companies used to come from the single companies, making the
usefulness of information very limited.
Objective(s) of the measure/service: To bundle travel time and service
information from all transportation companies in a single database,
facilitating intermodal travel exchange between different public transport
companies.
Start of system/service 2006
Location single road/line city district whole city urban region
Transport mode(s)
concerned
public transport rail road car-sharing
bicycles pedestrians other:
Implementing
organisation GOVI Projectgroup
System / service
description
In various places in the Netherlands, up-to-date travel information is
available. This information is often limited to the routes of a single
transport company. The traveller wants to see integrated information
about the transport services of different companies. GOVI makes this
possible.
The GOVI project (Grenzeloze Openbaar Vervoer Informatie = Public
Transport Information without frontiers) is a joint project involving several
government authorities. The primary objective is to integrate dynamic
travel information from every modality and transport company and to
make that information available in a standard way to organizations and to
subsequently present the information to the traveller. This leads to
independence from transport operators and Dynamic Passenger
Information System (DRIS) suppliers and allows the government/road
owners to take control of the development and management of this
dynamic information system.
North Holland province and Alkmaar City council took the initiative in
2006 to develop a pilot DRIS-system for Alkmaar city council based on
standardised Transmodel data exchange. Soon thereafter City-region of
Amsterdam joined the project. In 2007 and 2008, a large number of
authorities joined the North Holland initiative and national consensus was
created. And so the GOVI project became reality.
GOVI provides the following services for her partners:
Distribution of public transport travel information: receiving, processing and sending of the messages.
Monitoring the travel informationchain: ensuring that the whole
supply chain keeps on running.
Reporting on the performance of the transport operator.
Quality of public transport travel information: monitoring and
improving the quality of the travel information.

U R B A N I T S E X P E R T G R O U P
ITS Action Plan – Best Practices: Collection of projects 121
Technologies
Architecture
The heart of the GOVI system is a central database where data from all
the connected public transport operators is gathered. The underlying
system follows the position of all the busses, so that the waiting time is
always up-to-date. In addition, the traveller is informed by
announcements about serious disruptions in service. The information
removes a significant disadvantage of travelling with public transport
(compared with using the car), and that uncertainty about the travel time.
Within the project, national integration software is developed, to which
both transport operators and dataconsumers are connected. Data
exchange between all the concerned parties is based on standard TMI NL
8.0 interfaces. These interfaces are defined and managed by the BISON
organisation. BISON has no direct involvement in the implementation or
management of the DRIS systems. One of the most important
contributors for proposals to the Transmodel standard is the GOVI project.
See http://bison.connekt.nl
GOVI Information supply chain
Within the information chain, data exchange takes place according to
agreed standard interfaces.
The transport companies provide GOVI with the following data:
Interface 1 (KV 1), the planned timetable and the route/stop information for a certain period.
Interface 6 (KV 6), the messages from the vehicles. In these
messages, each vehicle reports at least once a minute the actual position and the punctuality.
Interface 15 (KV 15), free text messages. These are used to inform the passengers in case of disruptions.
Interface 17 (KV 17), short-term deviations on the planning during the operational day. The interface is used to communicate actions in the operational timetable by the central traffic controllers, for example cancellation or shortening of yourneys or route-diversions.
GOVI provides the following to DRIS-suppliers:
Interface 7 (KV 7), the daily timetable per stop pole. These are sent every day for the next few days ahead.
U R B A N I T S E X P E R T G R O U P
ITS Action Plan – Best Practices: Collection of projects 122
Interface 8 (KV 8), the dynamic, up-to-date times per stop based
on messages received from the vehicles.
KAR (Short-distance Radio)
KAR is a technique for wireless information exchange from vehicles to
traffic light controllers (VRI’s) and intelligent bus-stops. This information
is used to get priority at intersections and to remove information
regarding the quick passing of a vehicle.
Standards TMI 8.0
2 . I M P L E M E N T A T I O N
Partners involved
Public authorities: Provincie Noord-Holland, Stadsregio Amsterdam,
Provincie Noord-Brabant, Provincie Flevoland, Provincie Utrecht, Bestuur
Regio Utrecht, Provincie Zeeland, OV Bureau Groningen/Drenthe,
Provincie Overijssel, Stadsregio Eindhoven, Stadsgewest Haaglanden
Organisational model
Management body: Operational guidance group composed of
representatives from provincial authorities.
Operating body: working group composed of members from various
provinces
Financing body: Provinces, supported by the management body.
Business model
Public investment:
Private / commercial framework:
Public-private partnership:
Investment costs
The project is mostly funded by the partners that offer their personnel
and resources without charge. Therefore, a precise cost definition is not
possible
Operating costs See investment costs
3 . R E S U L T S
Technical performance
GOVI has been fully functional in a large number of provinces. Continuous
progress is being made to develop better standards and provide travellers
with more accurate information
Implementation of
Innovation
Collecting all the data in a single location is an innovative and cheaper
way to make data exchange possible. The standards used for this data
exchange have been harmonised, making it possible for all parties
delivering and collecting data to readily use the database.
Safety impacts None
Efficiency impacts
Travellers information services can use the GOVI database to receive
accurate real-time information on the status of transport services,
including departure times and delays. This makes the use of public
transport more reliable and travel planning easier. Gathering all the
information from different transport authorities to a single database
makes implementation and data exchange much more efficient.
Environmental impacts None
U R B A N I T S E X P E R T G R O U P
ITS Action Plan – Best Practices: Collection of projects 123
Socio-economic impacts
Public transportation is more attractive to use, as information services
provide accurate public transport status. As the use of public
transportation increases, road use and congestion can be tackled.
Revenue generation
Transportation authorities and other GOVI partners provide funding for
the project, and receive their investment back through the possibility to
develop traveller information services.
User acceptance Even though GOVI does not provide information directly to travellers, the
possibility
4 . L E S S O N S L E A R N T
Factors for success
Good collaboration and communication between partners on standards,
costs and operation. Information service providers have to actively use
the information to inform travellers.
Obstacles Insufficient applications built on the information, not being able to justify
the operational costs if the information does not reach travellers.
5 . M O R E I N F O R M A T I O N
Contact Person
Name: Gertjan Kamerik
Function: Delegated projectmanager
Company: GOVI
Email: [email protected]
Phone: +31 (0)8 55 00 60 59
Web link (if existing) www.govi.nu

U R B A N I T S E X P E R T G R O U P
ITS Action Plan – Best Practices: Collection of projects 124
3.52 NL - Enschede – Incentive Zone
URBAN ITS
KEY APPLICATION
Traffic & Travel Information
Traffic & Access Management
Smart Ticketing
Urban Logistics
Other:
1 . G E N E R A L D E S C R I P T I O N
Problems to solve /
Objectives
Issue(s) encountered: Congestion during peak hours
Objective(s) of the measure/service: Reduction of the number of car trips
in peak periods of 5%
Start of system/service Estimated Q3/Q4 2012
Location single road/line city district whole city urban region
Transport mode(s)
concerned
public transport rail road car-sharing
bicycles pedestrians other:
Implementing
organisation
Municipality of Enschede (local government) together with One Big
Agency (OBA; communication company), Universiteit Twente (university)
and another, currently unknown, exploiter.
System / service
description
The system uses personal mobility detection on a mobile phone to
monitor personal mobility behaviour. With this information and road-side
sensors, providing actual traffic information, incentives are given to
people that aim at changing their mobility behaviour to more sustainable
modes and hence at reducing car mileage in the system. Incentives can
be issued by both the municipality as other (third) parties. In addition a
web portal is developed that gives more detailed mobility information.
Technologies
Personal Mobility Monitoring
Automatic Mode Detection
Road-side traffic sensors
Personalised incentives
Web portal
Standards
Maps: OpenStreetMap
Consent: Oauth
Web: JSON, REST
2 . I M P L E M E N T A T I O N
Partners involved
Public authorities: Municipality of Enschede
Private stakeholders: OBA, tbd, 3rd parties
Others: Universiteit Twente
Organisational model
Management body: Combined project team with representation of all
parties
Operating body: Exploiting party
Financing body: Municipality of Enschede (subsidised by Region
Twente) and exploiting party
Business model
Public investment:
Private / commercial framework:
Public-private partnership: Amounts unknown
Investment costs €:

U R B A N I T S E X P E R T G R O U P
ITS Action Plan – Best Practices: Collection of projects 125
Operating costs € / year: person / year:
3 . R E S U L T S
Technical performance
Implementation of
Innovation
Safety impacts
Efficiency impacts
Environmental impacts
Socio-economic impacts
Revenue generation
User acceptance
4 . L E S S O N S L E A R N T
Factors for success
Obstacles
a. Because of the innovative character of the project and the unceartainties accompanied by that fact, the tendering procedure has been a long and explorative process.
b. Specifying technical components is difficult (with relation to assessment) in inovative projects.
5 . M O R E I N F O R M A T I O N
Contact Person
Name: Marcel Meeuwissen
Function: Senior Policy Advisor
Company: Municipality of Enschede
Email: [email protected]
Phone: (+)31 53 481 5168/+31 6 128 99 583
Web link (if existing) PM

U R B A N I T S E X P E R T G R O U P
ITS Action Plan – Best Practices: Collection of projects 126
3.53 NO - Oslo - Economic Evaluation of an ITS-Based Toll Collection
URBAN ITS
KEY APPLICATION
Traffic & Travel Information
Traffic & Access Management
Smart Ticketing
Urban Logistics
Other:
1 . G E N E R A L D E S C R I P T I O N
Problems to solve /
Objectives
Issue(s) encountered: mix use of toll cordon (ETC plus manual);
operational costs
Objective(s) of the measure/service:
Customer-friendly approach
Time saving for users
Reduction of noise and pollution
Improvement of city landscape
Reduction of costs associated with operating tolls
Economic assessment of an ITS implementation
Start of system/service 1990, full ITS since 2008
Location single road/line city district whole city urban region
Transport mode(s)
concerned
public transport rail road car-sharing
bicycles pedestrians other:
Implementing
organisation Norwegian Public Road Administration
System / service
description
City of Oslo: Electronic Toll Collection based on 19 toll stations.
260.000 vehicles/day
20% discount on toll for OBUs holders
No variation of toll
Technologies
On-Board Units: AutoPass tags based on DSRC (provider Tecsidel)
Licence-plate recognition for vehicles not equipped with OBUs
Payment invoices sent to car owners; payments possible at gas stations
and by SMS.
Standards DSRC 5.8 GHz
Optical Character Recognition (OCR)
2 . I M P L E M E N T A T I O N
Partners involved
Public authorities: Norwegian Public Road Administration
Private stakeholders:
Others:
Organisational model
Management body:
Operating body:
Financing body:
Business model
Public investment:
Private / commercial framework:
Public-private partnership:
Investment costs $17.5 million
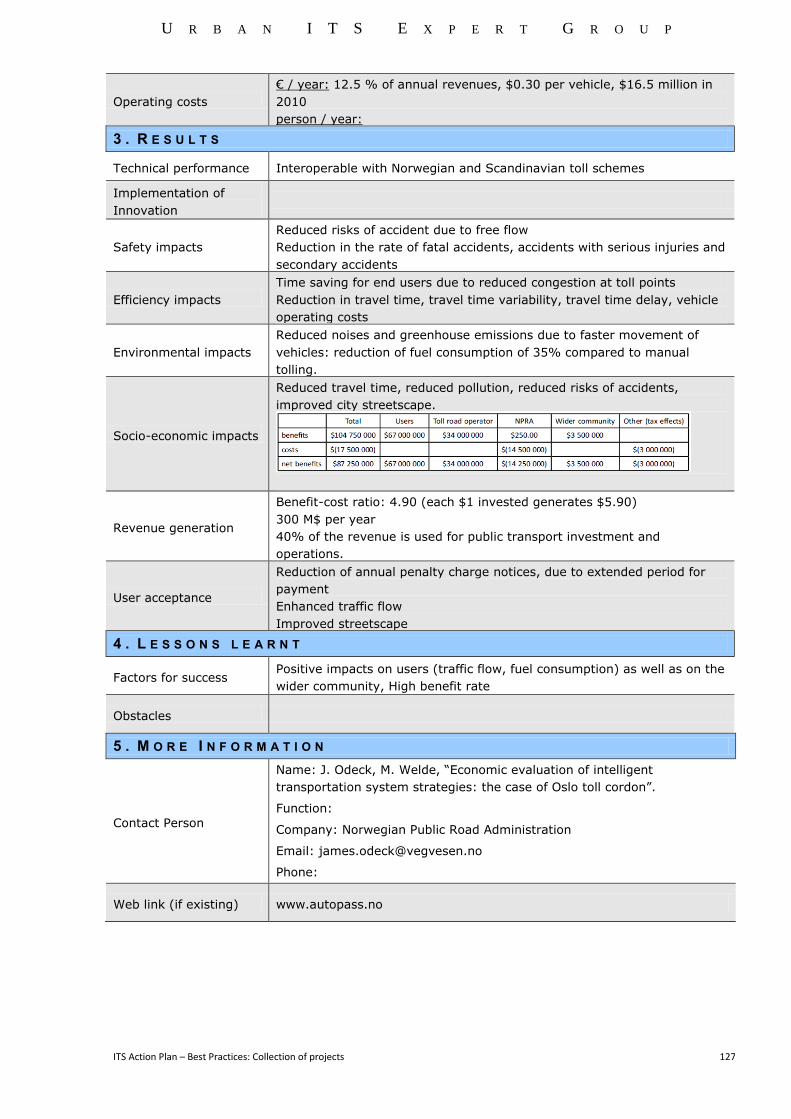
U R B A N I T S E X P E R T G R O U P
ITS Action Plan – Best Practices: Collection of projects 127
Operating costs
€ / year: 12.5 % of annual revenues, $0.30 per vehicle, $16.5 million in
2010
person / year:
3 . R E S U L T S
Technical performance Interoperable with Norwegian and Scandinavian toll schemes
Implementation of
Innovation
Safety impacts
Reduced risks of accident due to free flow
Reduction in the rate of fatal accidents, accidents with serious injuries and
secondary accidents
Efficiency impacts
Time saving for end users due to reduced congestion at toll points
Reduction in travel time, travel time variability, travel time delay, vehicle
operating costs
Environmental impacts
Reduced noises and greenhouse emissions due to faster movement of
vehicles: reduction of fuel consumption of 35% compared to manual
tolling.
Socio-economic impacts
Reduced travel time, reduced pollution, reduced risks of accidents,
improved city streetscape.
Revenue generation
Benefit-cost ratio: 4.90 (each $1 invested generates $5.90)
300 M$ per year
40% of the revenue is used for public transport investment and
operations.
User acceptance
Reduction of annual penalty charge notices, due to extended period for
payment
Enhanced traffic flow
Improved streetscape
4 . L E S S O N S L E A R N T
Factors for success Positive impacts on users (traffic flow, fuel consumption) as well as on the
wider community, High benefit rate
Obstacles
5 . M O R E I N F O R M A T I O N
Contact Person
Name: J. Odeck, M. Welde, “Economic evaluation of intelligent
transportation system strategies: the case of Oslo toll cordon”.
Function:
Company: Norwegian Public Road Administration
Email: [email protected]
Phone:
Web link (if existing) www.autopass.no
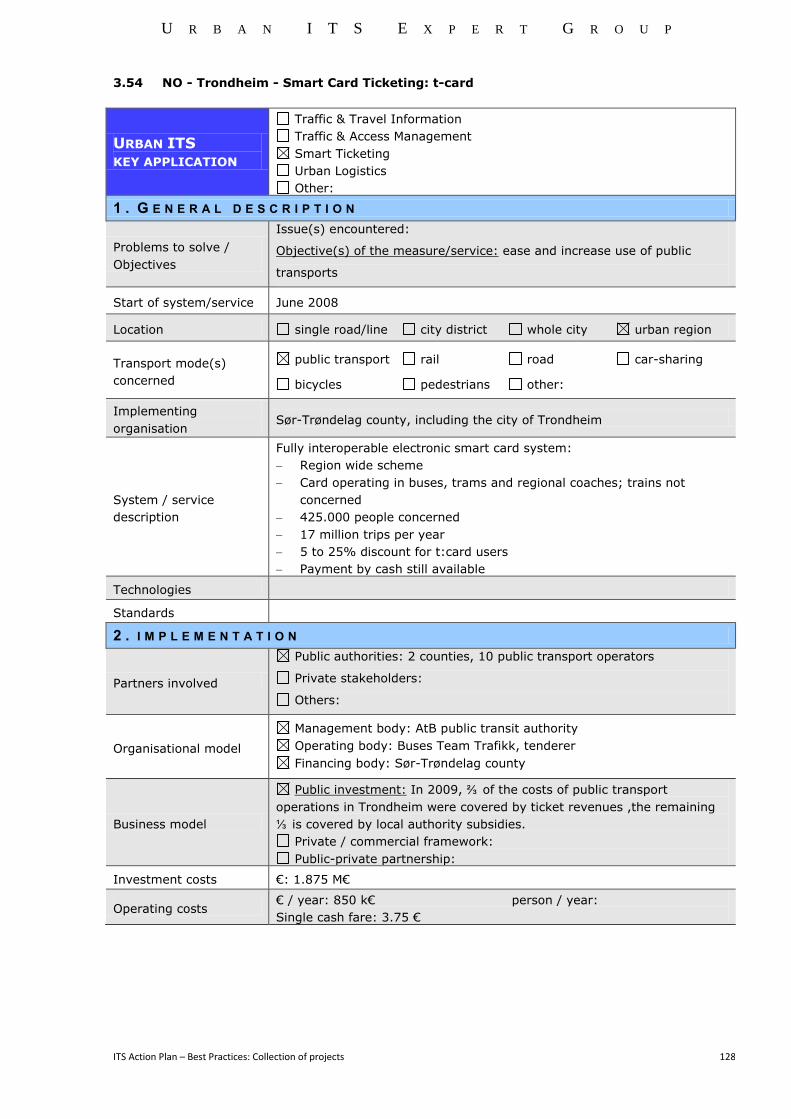
U R B A N I T S E X P E R T G R O U P
ITS Action Plan – Best Practices: Collection of projects 128
3.54 NO - Trondheim - Smart Card Ticketing: t-card
URBAN ITS
KEY APPLICATION
Traffic & Travel Information
Traffic & Access Management
Smart Ticketing
Urban Logistics
Other:
1 . G E N E R A L D E S C R I P T I O N
Problems to solve /
Objectives
Issue(s) encountered:
Objective(s) of the measure/service: ease and increase use of public
transports
Start of system/service June 2008
Location single road/line city district whole city urban region
Transport mode(s)
concerned
public transport rail road car-sharing
bicycles pedestrians other:
Implementing
organisation Sør-Trøndelag county, including the city of Trondheim
System / service
description
Fully interoperable electronic smart card system:
Region wide scheme
Card operating in buses, trams and regional coaches; trains not
concerned
425.000 people concerned
17 million trips per year
5 to 25% discount for t:card users
Payment by cash still available
Technologies
Standards
2 . I M P L E M E N T A T I O N
Partners involved
Public authorities: 2 counties, 10 public transport operators
Private stakeholders:
Others:
Organisational model
Management body: AtB public transit authority
Operating body: Buses Team Trafikk, tenderer
Financing body: Sør-Trøndelag county
Business model
Public investment: In 2009, ⅔ of the costs of public transport
operations in Trondheim were covered by ticket revenues ,the remaining
⅓ is covered by local authority subsidies.
Private / commercial framework:
Public-private partnership:
Investment costs €: 1.875 M€
Operating costs € / year: 850 k€ person / year:
Single cash fare: 3.75 €

U R B A N I T S E X P E R T G R O U P
ITS Action Plan – Best Practices: Collection of projects 129
3 . R E S U L T S
Technical performance
Implementation of
Innovation
Safety impacts Non-monetised solution, avoids cash carrying
Efficiency impacts
Reduced time for boarding and paying estimated to 6.8 seconds per
passenger
Increase bus route reliability and reduce delays.
The system generates accurate statistic data supporting the improvement
of transport systems.
Evaluation of an average 10% reduction on travel time leading to a
potential passenger growth of 3 to 7%.
Environmental impacts
Socio-economic impacts
Positive impacts: increase public transport reliability, reduced need for
carrying cash
Measured benefits: time saving for passengers and bus company.
The smart card ticketing system in Trondheim is profitable from a socio
economic point of view, with a net present value of 16 M€ and a benefit
cost ratio of 1.5 (meaning that 1€ spent generates benefits of 2.5€).
Revenue generation
User acceptance After 2 years of operation the t:card is used to pay 90% of the trips
4 . L E S S O N S L E A R N T
Factors for success
Generation of socio economic benefit.
Next step: getting rid of cash payments (increase social benefits and
decrease operating costs; avoids any risks of robbery in buses).
Obstacles Complex system to set up and implement: started in the early 1990,
postponed several time before final implementation
5 . M O R E I N F O R M A T I O N
Contact Person
Name: Morten Welde; ref: “Smart card ticketing in Trondheim deliver
substantial benefits to society”
Function:
Company: Norwegian Public Roads Administration
Email:
Phone:
Web link (if existing) www.atb.no

U R B A N I T S E X P E R T G R O U P
ITS Action Plan – Best Practices: Collection of projects 130
3.55 PL/DE - Warsaw - Cross Border Travel Planner
URBAN ITS
KEY APPLICATION
Traffic & Travel Information
Traffic & Access Management
Smart Ticketing
Urban Logistics
Other:
1 . G E N E R A L D E S C R I P T I O N
Problems to solve /
Objectives
Issue(s) encountered: Too many data sources when planning a cross-
border journey
Objective(s) of the measure/service: Seamless passenger information
between WAW and BER
Start of system/service 2010
Location single road/line city district whole city urban region
Transport mode(s)
concerned
public transport rail road car-sharing
bicycles pedestrians other:
Implementing
organisation
Public Transport Authority in Warsaw
VBB - Verkehrsverbund Berlin - Brandenburg GmbH
System / service
description
Technologies A programme of HaCon GmbH (Hannover, Germany), programme name:
HAFAS
Standards
2 . I M P L E M E N T A T I O N
Partners involved
Public authorities: ZTM Warsaw, VBB Berlin, EU Interreg IVC
Programme
Private stakeholders: Hacon
Others:
Organisational model
Management body: ZTM Warsaw, VBB Berlin
Operating body: Hacon
Financing body: EU Interreg IVC
Business model
Public investment:
Private / commercial framework:
Public-private partnership:
Investment costs €: 50’000
Operating costs € / year: no data yet person / year:

U R B A N I T S E X P E R T G R O U P
ITS Action Plan – Best Practices: Collection of projects 131
3 . R E S U L T S
Technical performance including a new planner into a ZTM Warsaw website
Implementation of
Innovation First cross-border door-to-door travel planner
Safety impacts no direct impact
Efficiency impacts increase of PT use efficiency expected
Environmental impacts no direct impact
Socio-economic impacts Providing reliable and accurate information regarding planned journey
Revenue generation no direct impact
User acceptance good users' opinion
4 . L E S S O N S L E A R N T
Factors for success Information on all stages of travel regardless of transport means used
Obstacles difficulties with access to railway timetable database
5 . M O R E I N F O R M A T I O N
Contact Person
Name: Tamas Dombi
Function: Specialist - department for Transport Development
Company: Public Transport Authority in Warsaw
Email: [email protected]
Phone:
Web link (if existing) http://wyszukiwarka.ztm.waw.pl

U R B A N I T S E X P E R T G R O U P
ITS Action Plan – Best Practices: Collection of projects 132
3.56 PL - Warsaw – Voice Portal
URBAN ITS
KEY APPLICATION
Traffic & Travel Information
Traffic & Access Management
Smart Ticketing
Urban Logistics
Other:
1 . G E N E R A L D E S C R I P T I O N
Problems to solve /
Objectives
Issue(s) encountered:
Objective(s) of the measure/service:
Start of system/service 20th October 2008
Location single road/line city district whole city urban region
Transport mode(s)
concerned
public transport rail road car-sharing
bicycles pedestrians other:
Implementing
organisation Primespeech, Warsaw Transport Authority (ZTM)
System / service
description Telephone dialog system
Technologies IVR (Interactive Voice Response), ASR (Automatic Speech Recognition),
TTS (Text-To-Speech)
Standards
2 . I M P L E M E N T A T I O N
Partners involved
Public authorities:
Private stakeholders:
Others:
Organisational model
Management body:
Operating body: Warsaw Transport Authority (ZTM)
Financing body: Warsaw Transport Authority (ZTM)
Business model
Public investment:
Private / commercial framework:
Public-private partnership:
Investment costs €:
Operating costs € / year: 25’000 person / year:
3 . R E S U L T S
Technical performance Provides information for 12 callers simultaneously. Connects up to 4
operators simultaneously.
Implementation of
Innovation
One of two public transport call centres that use speech recognition and
speech synthesis to provide fully automatic information about timetables,
fare reductions, ticket prices, news. Voice portal allows also to file
complaints.
Safety impacts none

U R B A N I T S E X P E R T G R O U P
ITS Action Plan – Best Practices: Collection of projects 133
Efficiency impacts Reduces operator overhead and customer waiting time.
Environmental impacts none
Socio-economic impacts none
Revenue generation Voice portal allowed to expand call centre from 3 to 12 channels/lines
without the need to hire new agents.
User acceptance Very good acceptance for young people such as students. Elderly people
prefer to talk to agents.
4 . L E S S O N S L E A R N T
Factors for success Intuitive voice portal dialog design
Obstacles Speech recognition and speech understanding technologies still have
many limitations.
5 . M O R E I N F O R M A T I O N
Contact Person
Name: Lucas Brocki
Function: CEO
Company: Primespeech
Email: [email protected]
Phone: +48 601 703 978
Web link (if existing) www.primespeech.pl

U R B A N I T S E X P E R T G R O U P
ITS Action Plan – Best Practices: Collection of projects 134
3.57 PL - Warsaw - Tickets on Mobile Phones in SkyCash™ and mPay Systems based on
Specialized Applications
URBAN ITS KEY APPLICATION
Traffic & Travel Information
Traffic & Access Management
Smart Ticketing
Urban Logistics
Other:
1 . G E N E R A L D E S C R I P T I O N
Problems to solve /
Objectives
Issue(s) encountered:
Objective(s) of the measure/service: Implementation of new fares
technology in urban area
Start of system/service 2008
Location single road/line city district whole city urban region
Transport mode(s)
concerned
public transport rail road car-sharing
bicycles pedestrians other:
Implementing
organisation
Urban Transport Authority
co-operators: mPay SA, the Polish Mint SA, Project Parking Sp. z o. o.
System / service
description
Implementation of mobile payments system for the passage using mobile
phone
Technologies The use of mobile payment systems: mPay, SkyCash, moBilet using the
GSM network
Standards GSM-SMS, GPRS
2 . I M P L E M E N T A T I O N
Partners involved
Public authorities:
Private stakeholders: Pay SA, the Polish Mint SA, Project Parking Sp. z
o. o.
Others:
Organisational model
Management body: Urban Transport Authority
Operating body: Pay SA, the Polish Mint SA, Project Parking Sp. z o. o.
Financing body: Pay SA, the Polish Mint SA, Project Parking Sp. z o. o.
Business model
Public investment: no
Private / commercial framework:
Public-private partnership:
Investment costs €: Urban Transport Authority is not liable for any costs of investment
Operating costs € / year: Urban Transport Authority pays only a commission depending on
sales volume person / year:
3 . R E S U L T S
Technical performance Mobile payments system developped by private partners.
Implementation of
Innovation Warsaw fare system data input into operators' sofware
U R B A N I T S E X P E R T G R O U P
ITS Action Plan – Best Practices: Collection of projects 135
Safety impacts A high level of transaction security
Efficiency impacts Increase of productivity of sales
Environmental impacts no negative impact
Socio-economic impacts Positive impact on customer service / customer satisfaction increase
Revenue generation Urban Transport Authority pays only a commission depending on sales
volume. Increase of revenue after system implementation.
User acceptance The form of mobile payments has a high acceptance of passengers
(specially young) using mobile phones
4 . L E S S O N S L E A R N T
Factors for success Mobile payment systems, GSM, widespread use of mobile phones
Obstacles Lack of mobile phones operating systems standardization
5 . M O R E I N F O R M A T I O N
Contact Person
Name: Dariusz Sztuczynski
Function: IT Manager
Company: Warsaw Urban Transport Authority
Email: [email protected]
Phone:
Web link (if existing) www.ztm.waw.pl
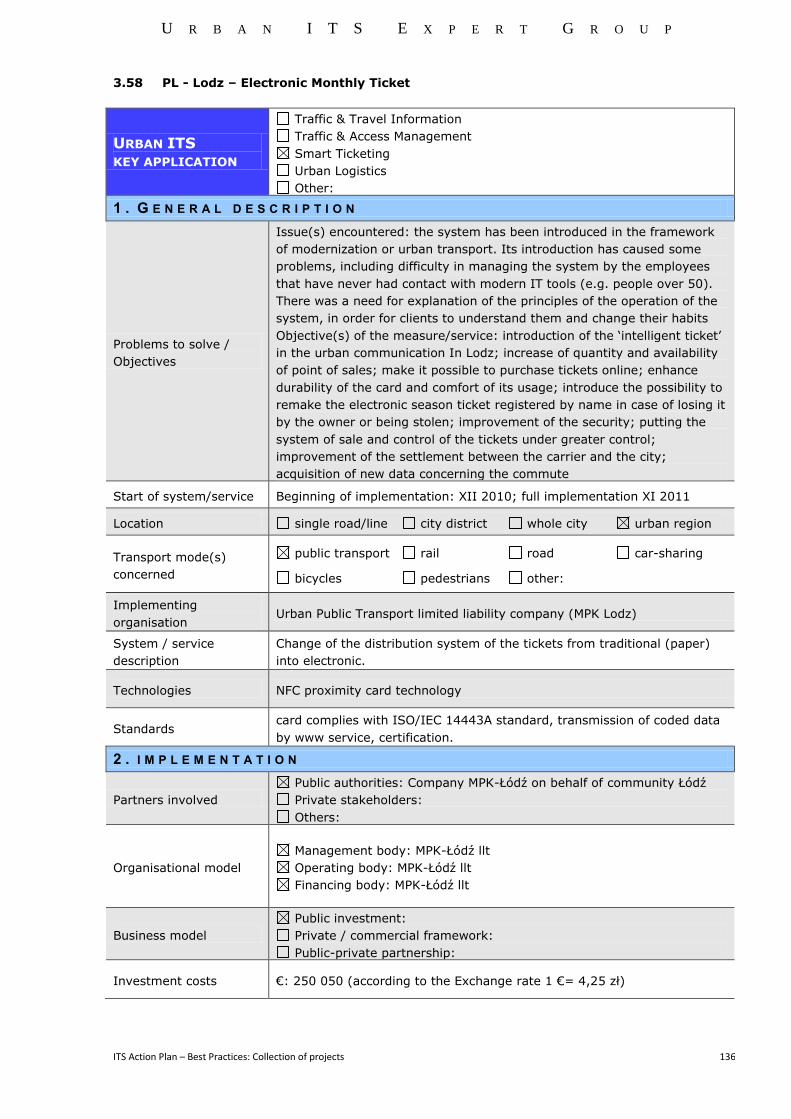
U R B A N I T S E X P E R T G R O U P
ITS Action Plan – Best Practices: Collection of projects 136
3.58 PL - Lodz – Electronic Monthly Ticket
URBAN ITS
KEY APPLICATION
Traffic & Travel Information
Traffic & Access Management
Smart Ticketing
Urban Logistics
Other:
1 . G E N E R A L D E S C R I P T I O N
Problems to solve /
Objectives
Issue(s) encountered: the system has been introduced in the framework
of modernization or urban transport. Its introduction has caused some
problems, including difficulty in managing the system by the employees
that have never had contact with modern IT tools (e.g. people over 50).
There was a need for explanation of the principles of the operation of the
system, in order for clients to understand them and change their habits
Objective(s) of the measure/service: introduction of the ‘intelligent ticket’
in the urban communication In Lodz; increase of quantity and availability
of point of sales; make it possible to purchase tickets online; enhance
durability of the card and comfort of its usage; introduce the possibility to
remake the electronic season ticket registered by name in case of losing it
by the owner or being stolen; improvement of the security; putting the
system of sale and control of the tickets under greater control;
improvement of the settlement between the carrier and the city;
acquisition of new data concerning the commute
Start of system/service Beginning of implementation: XII 2010; full implementation XI 2011
Location single road/line city district whole city urban region
Transport mode(s)
concerned
public transport rail road car-sharing
bicycles pedestrians other:
Implementing
organisation Urban Public Transport limited liability company (MPK Lodz)
System / service
description
Change of the distribution system of the tickets from traditional (paper)
into electronic.
Technologies NFC proximity card technology
Standards card complies with ISO/IEC 14443A standard, transmission of coded data
by www service, certification.
2 . I M P L E M E N T A T I O N
Partners involved
Public authorities: Company MPK-Łódź on behalf of community Łódź
Private stakeholders:
Others:
Organisational model
Management body: MPK-Łódź llt
Operating body: MPK-Łódź llt
Financing body: MPK-Łódź llt
Business model
Public investment:
Private / commercial framework:
Public-private partnership:
Investment costs €: 250 050 (according to the Exchange rate 1 €= 4,25 zł)
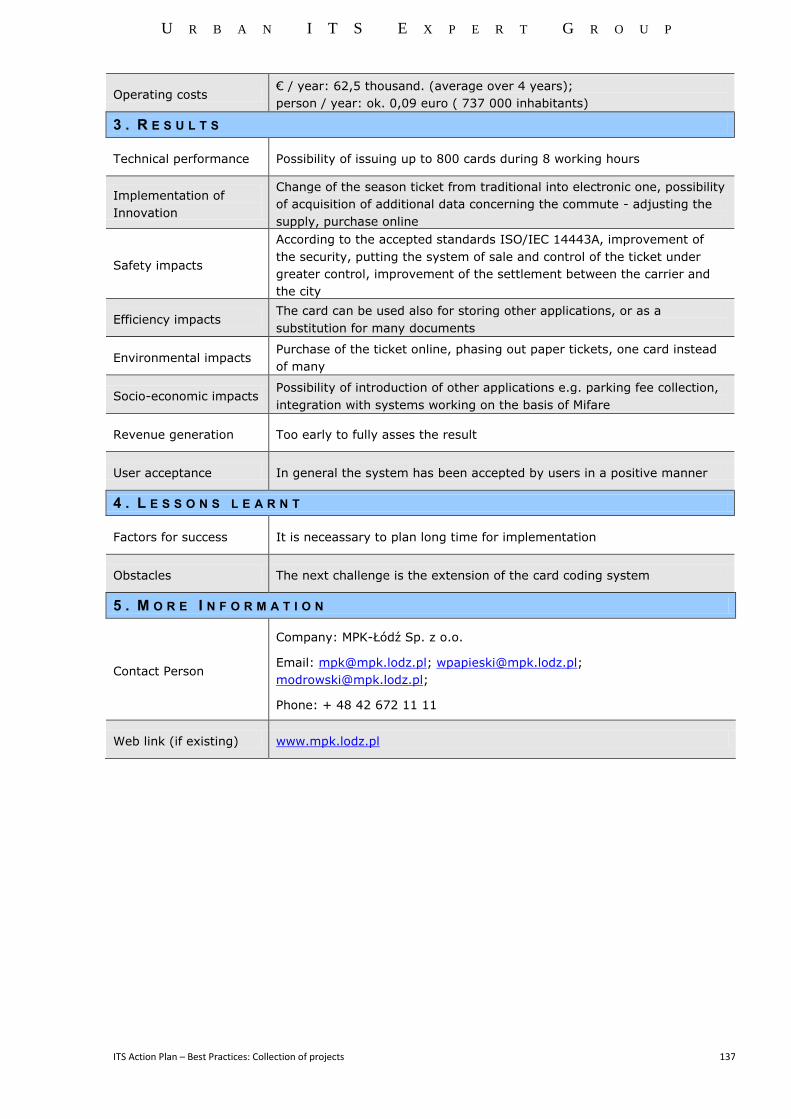
U R B A N I T S E X P E R T G R O U P
ITS Action Plan – Best Practices: Collection of projects 137
Operating costs € / year: 62,5 thousand. (average over 4 years);
person / year: ok. 0,09 euro ( 737 000 inhabitants)
3 . R E S U L T S
Technical performance Possibility of issuing up to 800 cards during 8 working hours
Implementation of
Innovation
Change of the season ticket from traditional into electronic one, possibility
of acquisition of additional data concerning the commute - adjusting the
supply, purchase online
Safety impacts
According to the accepted standards ISO/IEC 14443A, improvement of
the security, putting the system of sale and control of the ticket under
greater control, improvement of the settlement between the carrier and
the city
Efficiency impacts The card can be used also for storing other applications, or as a
substitution for many documents
Environmental impacts Purchase of the ticket online, phasing out paper tickets, one card instead
of many
Socio-economic impacts Possibility of introduction of other applications e.g. parking fee collection,
integration with systems working on the basis of Mifare
Revenue generation Too early to fully asses the result
User acceptance In general the system has been accepted by users in a positive manner
4 . L E S S O N S L E A R N T
Factors for success It is neceassary to plan long time for implementation
Obstacles The next challenge is the extension of the card coding system
5 . M O R E I N F O R M A T I O N
Contact Person
Company: MPK-Łódź Sp. z o.o.
Email: [email protected]; [email protected];
Phone: + 48 42 672 11 11
Web link (if existing) www.mpk.lodz.pl

U R B A N I T S E X P E R T G R O U P
ITS Action Plan – Best Practices: Collection of projects 138
3.59 RO– RATB Travel Card
URBAN ITS
KEY APPLICATION
Traffic & Travel Information
Traffic & Access Management
Smart Ticketing
Urban Logistics
Other:
1 . G E N E R A L D E S C R I P T I O N
Problems to solve /
Objectives
Issue(s) encountered: Improve the efficiency of public transport.
Objective(s) of the measure/service: Increase the public transport
attractiveness, by introducing fare integration and a flexible fare policy,
making use of contactless card technology.
Start of system/service 2006
Location single road/line city district x whole city urban region
Transport mode(s)
concerned
x public transport rail road car-sharing
bicycles pedestrians other:
Implementing
organisation RATB, METROREX
System / service
description
The implementation of the Automatic Ticketing System was intended to
integrate the public transport services at city level, following to assure a
flexible fare policy, in accordance with the passengers’ needs. As a start,
the integration was made between the biggest public transport operators:
METROREX (underground) and RATB (trams, buses and trolleybuses). The
system allows future integration with 6 more operators. Through the
implementation of the new system, the passengers have the possibility to
use the first contactless smart card, which allow them to travel in both
networks.
The contactless smart cards replaced the paper travel passes and tickets
and they can be found in two formats: customized and non- customized.
- The “ACTIV” type card is customized, unique (a person can have
only one ACTIVE type card) and designated to constant/permanent customers. On this card can be toped up passes for RATB and METROREX and it can be used as well as electronic purse. The “electronic purse” is a facility of “ACTIV” type card that consist in possibility to top up with an amount between 2,6RON and 50RON, which can be used for paying individual or group trips.
- The “MULTIPLU” type card is non-customized and addresses occasional travellers (2 to 10 trips, 1 day pass). This type of card can be used only for RATB and it cannot be recharged.
- The third type of card is the card for fine which is issued to fraudulent travellers after paying the fine and is valid till getting off the vehicle.
The system has as well a “Black list” facility which is a procedure for
sending and record to all the validating devices in the system (RATB and
METROREX) of IDs of stolen or lost card. The facility becomes active next
day after the card has been reported as lost or stolen.
The cards can be top up at sales point, at ATM and on-line using the RATB
webpage. The cards must be validated when getting in the public
transport mean.

U R B A N I T S E X P E R T G R O U P
ITS Action Plan – Best Practices: Collection of projects 139
Technologies MIFARE
Standards ISO14443
2 . I M P L E M E N T A T I O N
Partners involved
X Public authorities:
Private stakeholders:
Others: public transport operators RATB and METROREX
Organisational model
Management body: PARSONS BRINCKERHOFF Ltd. – S.C. Metroul S.A.
Consortium
Operating body: RATB, METROREX
Financing body: European Investment Bank, Bucharest Municipality
Business model
x Public investment: Bucharest Municipality
Private / commercial framework:
Public-private partnership:
Investment costs €: 12.000.000
Operating costs € / year: 260.000
person / year: subcontracting for maintenance (UTI Retail Solutions SRL)
3 . R E S U L T S
Technical performance - 1,877,019 «Activ» smart cards in use (January 2012)
- 984,072 «Multiplu» cards used
Implementation of
Innovation
- Diversification of the offer by introduction of contactless disposable (not rechargeable) cards addressed to occasional travellers (2 to 10 trips, 1 day pass) since May, 2011.
- Top-up online and at ATM’s
- New alternative for trip payment by using a dual card: bank card and contactless smart card, (can be use for both for RATB and METROREX) with automatic top-up option.
Safety impacts -
Efficiency impacts Operation optimization based on demand evaluation
Environmental impacts Reduce the waste by renouncing paper tickets/passes
Socio-economic impacts
- Reduce the fraud by eliminating fake travel passes/tickets
- Reduce the costs for paper and for printing passes/tickets
- Use a single card for the city public transport
- Optimisation of operational costs
Revenue generation Fraud reduction
User acceptance
Public survey and consultation before implementation
The number of cards in use raised constantly since the introduction of the
system (December 2006)
4 . L E S S O N S L E A R N T
Factors for success
- Develop the technical specifications in accordance with the transport policies and local conditions
- Analyse the possibility of fare integration with more public transport

U R B A N I T S E X P E R T G R O U P
ITS Action Plan – Best Practices: Collection of projects 140
operators (local, regional)
- Develop a market study
- Develop a proper marketing campaign for the new products
- Carry out a pilot project first, do not introduce the system at large scale
- Think long-term, act short-term
- Make it user friendly and easy to maintain
Obstacles Cut-off the budget which postpone the introduction of different facilities
5 . M O R E I N F O R M A T I O N
Contact Person
Name: Florin Dragomir
Function: Head of Technical Department
Company: Regia Autonoma de Transport Bucuresti
Email: [email protected]
Phone: +40213074190
Web link (if existing) http://www.ratb.ro; http://card.ratb.ro/
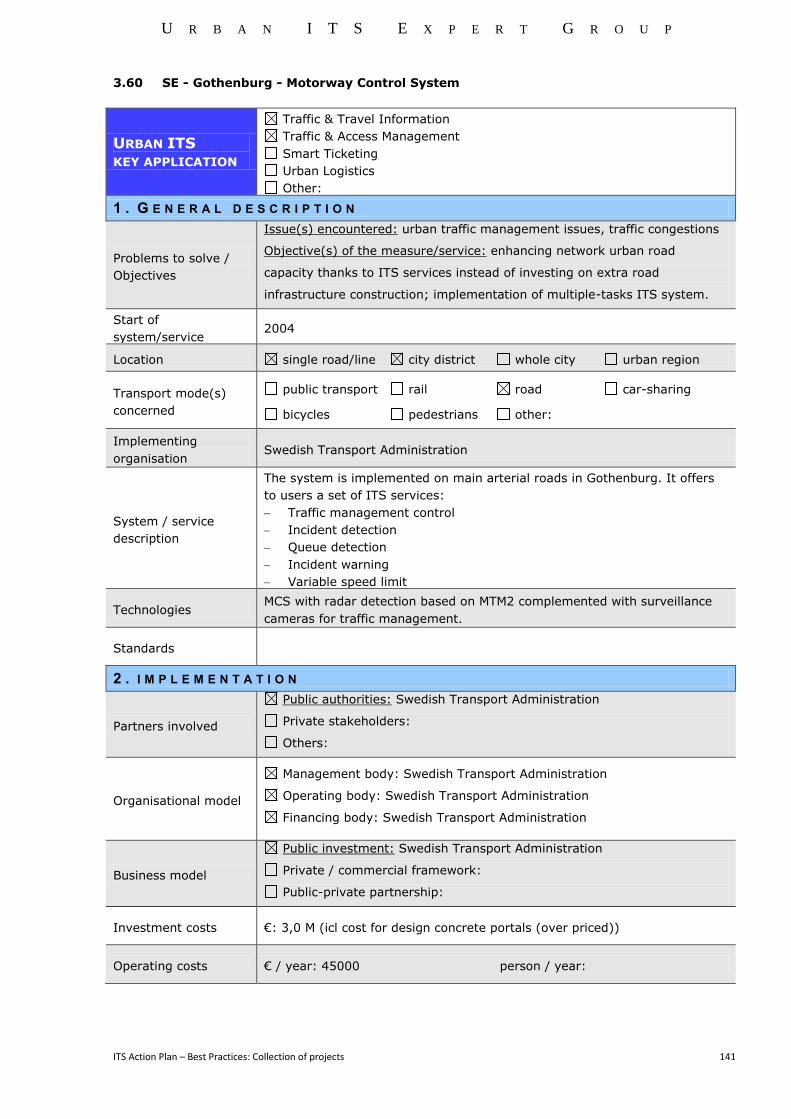
U R B A N I T S E X P E R T G R O U P
ITS Action Plan – Best Practices: Collection of projects 141
3.60 SE - Gothenburg - Motorway Control System
URBAN ITS
KEY APPLICATION
Traffic & Travel Information
Traffic & Access Management
Smart Ticketing
Urban Logistics
Other:
1 . G E N E R A L D E S C R I P T I O N
Problems to solve /
Objectives
Issue(s) encountered: urban traffic management issues, traffic congestions
Objective(s) of the measure/service: enhancing network urban road
capacity thanks to ITS services instead of investing on extra road
infrastructure construction; implementation of multiple-tasks ITS system.
Start of
system/service 2004
Location single road/line city district whole city urban region
Transport mode(s)
concerned
public transport rail road car-sharing
bicycles pedestrians other:
Implementing
organisation Swedish Transport Administration
System / service
description
The system is implemented on main arterial roads in Gothenburg. It offers
to users a set of ITS services:
Traffic management control
Incident detection
Queue detection
Incident warning
Variable speed limit
Technologies MCS with radar detection based on MTM2 complemented with surveillance
cameras for traffic management.
Standards
2 . I M P L E M E N T A T I O N
Partners involved
Public authorities: Swedish Transport Administration
Private stakeholders:
Others:
Organisational model
Management body: Swedish Transport Administration
Operating body: Swedish Transport Administration
Financing body: Swedish Transport Administration
Business model
Public investment: Swedish Transport Administration
Private / commercial framework:
Public-private partnership:
Investment costs €: 3,0 M (icl cost for design concrete portals (over priced))
Operating costs € / year: 45000 person / year:

U R B A N I T S E X P E R T G R O U P
ITS Action Plan – Best Practices: Collection of projects 142
3 . R E S U L T S
Technical performance The accessibility of the system during a evaluation period between 2003-
2008 was 99,5 %.
Implementation of
Innovation Recently tested: traffic control related to air quality
Safety impacts
Measurements after two years of operation showed the accident ratio being
reduced by 20 %. Due to a statistical too small basis, this result was
deemed too high. The socio-economic impact calculations have instead used
a reduction of 10 %, which is supported by international studies. The main
safety impact is related to decrease in sudden breaking manoeuvres, a more
harmonised flow resulting in a marginally improved traffic throughput as
well as a reduction in speed difference between lanes.
Efficiency impacts
Travel time was shortened by 22 sec in northbound direction, respectively
32 sec in southbound direction. The measured section includes both Åbro-
Kallebäck and Tingstadtunneln (12 km). In total this was a 5 %
improvement of the travel time.
Environmental
impacts
Due to the travel time improvement the carbon dioxide emissions have
increased slightly. Nevertheless, the calculation model could not take into
account the positive effects of the more homogenous traffic flow.
Socio-economic
impacts
The socio-economic calculations resulted in a cost-benefit ratio of more than
10. Calculations were done for a 20 year period, and was comprising - a positive time consumption benefit of € 3,6 M/year, - a road safety benefit of € 0,2 M/year (based on 10 % reduction in
the number of injury accidents) as well as - an environmental cost of € 0,26 M/year.
The total investment and operational costs for the whole period was
estimated to € 3,72 M.
Revenue generation N/A
User acceptance
Fairly many drivers admit that VSL have increased their respect for speed
limits – slightly more positive for those believing that the given speed limit
complies with traffic situation. Many drivers feel the speed limit is lower
than justified. Almost half of the drivers consider they are more attentive to
other vehicles after introduction of VSL.
For the section VSL Åbro-Kallebäck a first installation (first year) showed
signs with recommended speed limit, which were replaced with signs
showing regulatory speed. The attitude study showed that drivers did not
understand the difference between these two types.
4 . L E S S O N S L E A R N T
Factors for success
The implementation of such ITS system and services can compete with
traditional infrastructure construction: Reduced investment due to the fact that new lanes were not built, but
the hard shoulders were used instead. Can be used for accident management where hard shoulders are used
as an ordinary lane (after being upgraded from a construction point of view).
Ease of implementation (impacts on inhabitants, schedule) VSL highly beneficial in situations where sudden speed drops often occur
and where queues starts to build up
Bu using a flexible system (full graphical signs), the system can be used for
multiple functions. Future applications that may be discussed is buss
priority, HGV priority etc.
Obstacles Pedagogic information to the drivers about functioning of VSL systems need to be enhanced and widely distributed.

U R B A N I T S E X P E R T G R O U P
ITS Action Plan – Best Practices: Collection of projects 143
5 . M O R E I N F O R M A T I O N
Contact Person
Name: Susanne Planath
Function: Department Manager
Company: Swedish Transport Administration
Email: [email protected]
Phone: +46 31 635 222
Web link (if existing)
www.trafikverket.se
http://www.trafikverket.se/Privat/Resan-och-trafiken/Din-
resa/Hastighetsgranser-pa-vag/Variabla-hastigheter/
http://publikationswebbutik.vv.se/upload/4196/2008_98_variabel_hastighet
_trafikstyrd_vag_tillampningsrapport.pdf
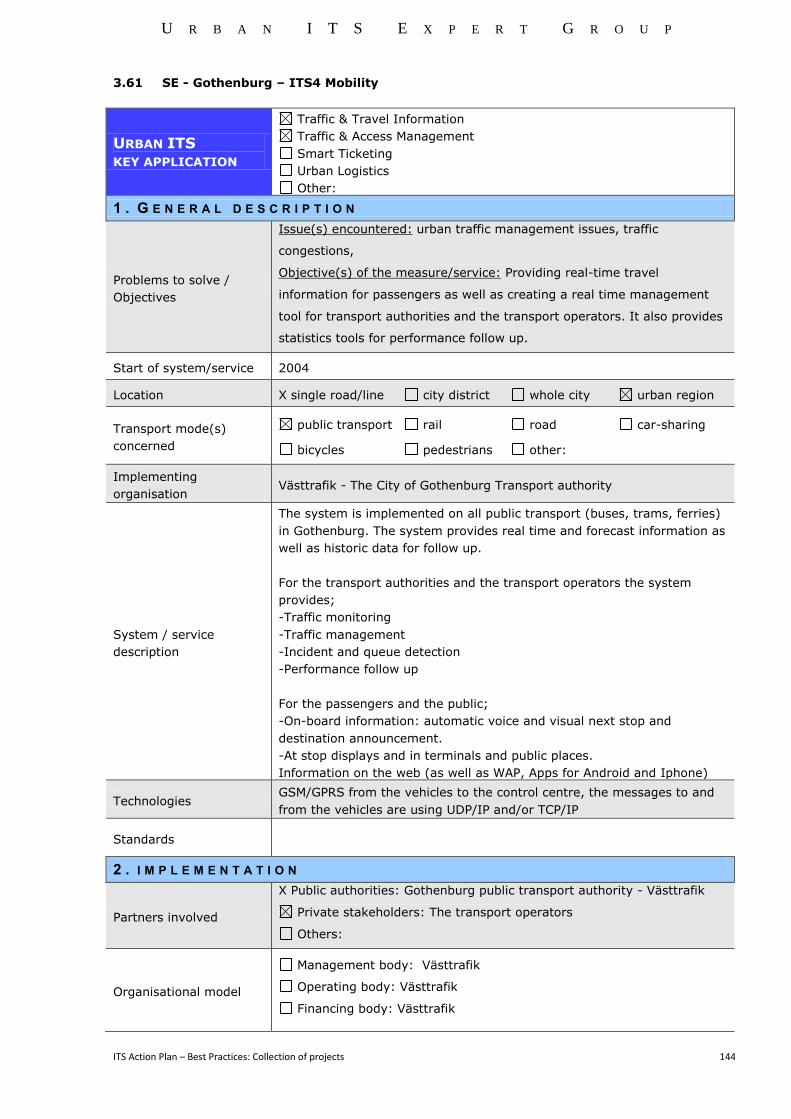
U R B A N I T S E X P E R T G R O U P
ITS Action Plan – Best Practices: Collection of projects 144
3.61 SE - Gothenburg – ITS4 Mobility
URBAN ITS
KEY APPLICATION
Traffic & Travel Information
Traffic & Access Management
Smart Ticketing
Urban Logistics
Other:
1 . G E N E R A L D E S C R I P T I O N
Problems to solve /
Objectives
Issue(s) encountered: urban traffic management issues, traffic
congestions,
Objective(s) of the measure/service: Providing real-time travel
information for passengers as well as creating a real time management
tool for transport authorities and the transport operators. It also provides
statistics tools for performance follow up.
Start of system/service 2004
Location X single road/line city district whole city urban region
Transport mode(s)
concerned
public transport rail road car-sharing
bicycles pedestrians other:
Implementing
organisation Västtrafik - The City of Gothenburg Transport authority
System / service
description
The system is implemented on all public transport (buses, trams, ferries)
in Gothenburg. The system provides real time and forecast information as
well as historic data for follow up.
For the transport authorities and the transport operators the system
provides;
-Traffic monitoring
-Traffic management
-Incident and queue detection
-Performance follow up
For the passengers and the public;
-On-board information: automatic voice and visual next stop and
destination announcement.
-At stop displays and in terminals and public places.
Information on the web (as well as WAP, Apps for Android and Iphone)
Technologies GSM/GPRS from the vehicles to the control centre, the messages to and
from the vehicles are using UDP/IP and/or TCP/IP
Standards
2 . I M P L E M E N T A T I O N
Partners involved
X Public authorities: Gothenburg public transport authority - Västtrafik
Private stakeholders: The transport operators
Others:
Organisational model
Management body: Västtrafik
Operating body: Västtrafik
Financing body: Västtrafik

U R B A N I T S E X P E R T G R O U P
ITS Action Plan – Best Practices: Collection of projects 145
Business model
X Public investment: Västtrafik
Private / commercial framework:
Public-private partnership:
Investment costs €: 5000 /vehicle + backoffice systems
Operating costs € / year: to define person / year:
3 . R E S U L T S
Technical performance
The performance, of the system can be followed up within several areas
of performance and for different stakeholders. The plan for Västtrafik is to
follow up the performance of the operators mainly on punctuality on a
monthly basis.
Implementation of
Innovation
The system is integrated in all vehicles and the central system is
integrated towards the traffic operators planning systems.
Safety impacts
The drivers of the vehicles have less manual work after the
implementation of the system which has impacted the safety of the
performance of the drivers. In case of an incident, the Automatic Vehicle
Location (AVL) of the vehicle helps the operator to locate the vehicle.
Efficiency impacts Real performance data is used as an input for better traffic management
scheduling.
Environmental impacts
The statistics reports help the traffic operators as well as the transport
authority of the city (Västtrafik) to analyse the traffic flow as well as
optimizing the traffic scheduling.
Socio-economic impacts
The system is an important part of creating an attractive public transport
within the area of Gothenburg. The demand for public transport has
grown significant during the years of implementation of the system.
Revenue generation
User acceptance
The drivers have embraced the system. It has eased their daily routines
and it is an integrated technical support tool for their daily work. The
passengers and the public have trust in the real time passenger
information of the system. The operators are using the system as an
integrated part of their traffic management systems.
4 . L E S S O N S L E A R N T
Factors for success A step by step approach for the implementation in the vehicles as well as
for implementing new functionality within the system.
Obstacles Traffic data needs to be correct and it takes time and effort to improve
the quality of the data.
5 . M O R E I N F O R M A T I O N
Contact
Person
Name:Maria Gustafsson
Function: Project Manager
Company: Vasttrafik
Email: [email protected]
Phone: +46 70-563 21 12
Web link
(if
existing)
http://www.vasttrafik.se/Trafiklaget/Avgangar-i-realtid/

U R B A N I T S E X P E R T G R O U P
ITS Action Plan – Best Practices: Collection of projects 146
3.62 SE - Gothenburg – Attractive Travel Service
URBAN ITS
KEY APPLICATION
Traffic & Travel Information
Traffic & Access Management
Smart Ticketing
Urban Logistics
Other:
1 . G E N E R A L D E S C R I P T I O N
Problems to solve /
Objectives
Multi modal traffic and travel support for commuting:
The concept Attractive Travel Service offer travelers along major
commuting routes in the greater Gothenburg area support for more
effective and sustainable transport. The concept is available before and
during a journey. The purpose is to provide support for true multi
modality (car, train, bus, tram, bike and walking) and thus a higher share
of public transport travelling.
Start of system/service 2013
Location single road/line city district whole city urban region
Transport mode(s)
concerned
public transport rail road car-sharing
bicycles pedestrians other:
Implementing
organisation
A cooperation between Gotheburg Transport Authority, the Swedish
Transport Administration and the regional public transport company and
operator Västtrafik.
System / service
description
2 of the 7 commuter routes into Gothenburg are used as pilot corridors for
an attractive multimodal travel service. The corridors are equipped with
real time information on car, bus, train and tram travelling. Information is
provided on road side, at bus stops, train stations and on the web. On
road side information signs travel times for different modes are
presented, marketing the more sustainable mode of transport. A multi
modal smart phone app has been created to support the traveler in
planning a journey from an individual preference point of view. The
service is also meant to be a support during a journey enabling the
traveler to change modes according to the actual traffic situation.
Technologies
Input through data collection from detectors, GPS from trains and busses,
as well as data from the traffic management centre. Information out
through several media such as - Smart phones
(https://market.android.com/details?id=se.goteborg.data.beta.vp.widget)
- The web, www.trafiken.nu/goteborg - Parking guidance information and smart parking through dynamic
message signs etc - Roadside dynamic message signs
- Dynamic signs with real time information at bus and tram stops, train
stations as well as shopping centres etc. - An application where employers can download tailor made information
regarding the closest stop for public transport has also been created. This low cost application can be used on any computer screen.
Standards
2 . I M P L E M E N T A T I O N
Partners involved
Public authorities: A cooperation between Gotheburg Transport
Authority, the Swedish Transport Administration and the regionalpublic

U R B A N I T S E X P E R T G R O U P
ITS Action Plan – Best Practices: Collection of projects 147
transport company and operator Västtrafik.
Private stakeholders:
Others:
Organisational model
Management body: Göteborg Transport Authority, Swedish Trasnsport
Administration and the public transport company Västtrafik.
Operating body: Göteborg Transport Authority, Swedish Transport
administration and the public transport company Västtrafik.
Financing body: Göteborg Transport Authority, Swedish Transport
administration and the public transport company Västtrafik.
Business model
X Public investment: Göteborg Transport Authority, Swedish Transport
administration and the public transport company Västtrafik.
Private / commercial framework:
Public-private partnership:
Investment costs
€: 305 000 (Mobile app) + €: 87 000 (individual messages) There are also
already implemented signs that are used in the concept. Investments for
these are not included in these figures.
Operating costs € / year: € 350 000
3 . R E S U L T S
Technical performance Overall concept not yet fully implemented. Mobile application currently in
demonstration phase.
Implementation of
Innovation -
Safety impacts Greater public transport share can lead to some positive safety impact.
Efficiency impacts
- Multimodal real time traffic information leads to efficient travelling where
the traveler can adjust their travel choices according to the current traffic
situation.
Environmental impacts
- The overall concept is designed to market public transport and to make
the public transport service more attractive. Increased public transport
share leads to reduction in environmental impact.
Socio-economic impacts
A bacis cost benefit analysis has been made for the different applications
involved in the concept.

U R B A N I T S E X P E R T G R O U P
ITS Action Plan – Best Practices: Collection of projects 148
(cost in red, benefit in blue)
The service provides the opportunity for individual travel planning when
and wherever. The service will be of greater benefit to those who are able
to switch modes than for those who daily make the same trip. On the
other hand the quality of traffic information will be raised for all modes.
Assumptions in the calculations:
� public transport passengers, about 200 000 - 50% are likely to use this
service 5 times a month
� car travelers - about 200 000 - 10% are likely to use this service 5
times
per month
� Flexi travelers - about 200 000 - 80% are assumed to use the service
five times per month
Revenue generation N/A
User acceptance
Simple planning and active travel support linked to the travelers personal
preferences, through the own mobile phone; increase the possibility for
the traveler to find the usability in the system.
4 . L E S S O N S L E A R N T
Factors for success
The collection and quality assurance of the correct input is essential to
provide good information to the traveler.
It is important that it is clear about who is responsible for different parts
of the system as a management stage, in order to service the system to
keep the best functionality.
All steps in the chain of information are for the traveler important that it
works and operate fast to optimize the effect for the traveler.
Obstacles
U R B A N I T S E X P E R T G R O U P
ITS Action Plan – Best Practices: Collection of projects 149
5 . M O R E I N F O R M A T I O N
Contact
Person
Name: Susanne Planath
Function: Department Manager
Company: Swedish Transport Administration
Email: [email protected]
Phone: +46 31 635 222
Web link
(if
existing
)
Beta version APP for Android:
https://market.android.com/details?id=se.goteborg.data.beta.vp.widget
Information in Swedish about the project:
http://fudinfo.trafikverket.se/fudinfoexternwebb/pages/ProjektVisaNy.aspx?ProjektId=110
5
Basel, 22.01.2013 / 67.083.3 / DGi / ChE
D3 - Best Practices - 20120827s.doc
U R B A N I T S E X P E R T G R O U P
ITS Action Plan – Best Practices: Collection of projects 150
3.63 UK - Urban Traffic Management & Control (UTMC) Open System Integration
URBAN ITS
KEY APPLICATION
Traffic & Travel Information
Traffic & Access Management
Smart Ticketing
Urban Logistics
Other:
1 . G E N E R A L D E S C R I P T I O N
Problems to solve /
Objectives
Issue(s) encountered:
i) Network management systems (eg traffic signals, Variable Message
Signs, Real time passenger information etc) were all bespoke with ‘buyer
lock in’ if systems needed to be expanded or upgraded.
ii) Lack of interoperability of systems constrained the potential for
systems to be used in combination to better manage the network and
inform travellers.
Objective(s) of the measure/service: To develop and maintain
specifications and standards acceptable to the highway authorities and
system suppliers to ensure interoperability between network management
systems. In essence ‘plug and play’. To develop a common database to
enable data to be shared between the systems and to enable ‘strategies’
to be operated. Eg a change to signal timings, messages on VMS signs,
diversion of bus services and live travel information could be an
automated response to a single incident.
Start of system/service 4 demonstrator projects 2000-2004
Location single road/line city district whole city urban region
Transport mode(s)
concerned
public transport rail road car-sharing
bicycles pedestrians other:
Implementing
organisation Department of Transport UK national government office
System / service
description
Promotion of a common database for use by the traffic manager based
around a set of common specifications and standards for all control centre
and on street applications.
Technologies
Incorporates a wide range of network management technologies including
urban traffic control systems for traffic signals, real time passenger
information systems, variable message signs, automatic number plate
recognition cameras, CCTV, traffic detection etc.
Standards UTMC is a set of (national) standards and specifications to promote open
standards and interoperability between systems.
2 . I M P L E M E N T A T I O N
Partners involved
Public authorities: UK Highway Authorities (HA (interurban trunk
roads) are developing interfaces to UTMC. UTMC
Private stakeholders: System suppliers
Others:
UTMC Development Group (UDG) is an organisation consisting of public
and private sector members who support the ongoing maintenance and
development of the UTMC standards.
Organisational model
Management body: UTMC Ltd
Operating body: UTMC Development Group (UDG)
Financing body: Maintenance of UTMC systems and standards is part
financed by central government through UTMC Ltd and part financed
through membership of UDG.

U R B A N I T S E X P E R T G R O U P
ITS Action Plan – Best Practices: Collection of projects 151
Implementation of UTMC systems is undertaken by highway authorities
through public funding and / or through private developer funding
contributions as part of a new development. Over 100 UK cities / regional
authorities have implemented UTMC systems.
Business model
Public investment: Development of the Systems and Standards was
part of a Central Government funded trial. Now UTMC is regarded as a UK
national standard with open standards promoting cost savings against
legacy systems.
Private / commercial framework: Suppliers have developed their systems
to be UTMC compliant at their own cost.
Public-private partnership:
Investment costs
€: 6million invested in the 6 year UTMC development programme. With
transfer of lessons learnt public sector investment costs could be
substantially lower with a new implementation of open systems and
standards.
Implementation costs of UTMC systems by the cities are comparable to
the implementation of the individual systems where there is no
integration, but without the benefits of integration. Where systems
subsequently need to be either extended or upgrade UTMC systems
provide cost savings as these latter stages can be competitively tendered.
Operating costs
€ / year: 80,000 per year to manage and maintain standards and
specifications with further variable development costs to continue
expanding open systems and interoperability as the market grows and
changes with technology.
person / year: 2 for management of systems and standards.
Where UTMC systems are implemented operation costs are comparable to
operating the same types of systems without the UTMC benefits although
it is possible to make savings with UTMC. Stratford Upon Avon
demonstrator trial showed approx 3,000 savings per annum.
3 . R E S U L T S
Technical performance
Implementation of
Innovation
Development and the successful implementation of UTMC has encouraged
innovation to make optimum use of the common database. UTMC has
been adopted by highway authorities across the UK as the platform for
future investment and development.
Safety impacts UTMC does not directly improve safety but the UTMC platform enables
more cost effective delivery of safety systems.
Efficiency impacts
UTMC enables authorities to make efficiency savings as follows:
i) improved ability to manage the network with network efficiency savings
(eg delays to vehicles).
ii) improved communications cost savings with greater flexibility to use
different communications and to share existing comms systems (eg fibre)
iii) more efficient use of existing systems through getting added value
from combining the information
iv) UTMC has opened up competition resulting in more competition from
suppliers and improved systems and services.
v) removal of ‘buyer tie in’ to particular products enabling authorities to
competitively tender extensions and upgrades to systems, ensuring best
value.
Environmental impacts UTMC enables traffic management systems to respond to environmental
effects –eg integrating air quality management with traffic signal timings.

U R B A N I T S E X P E R T G R O U P
ITS Action Plan – Best Practices: Collection of projects 152
Also more efficient network management systems with good travel
information can reduce congestion, encourage more sustainable modes of
travel and reduce carbon footprint.
Socio-economic impacts
UTMC helps authorities deliver an efficient multimodal network for the
efficient movement of goods and people which is essential to economic
growth
Revenue generation n/a
User acceptance
The adoption of UTMC by network managers has been very positive with
the
implementation of over 100 systems across the UK.
4 . L E S S O N S L E A R N T
Factors for success Developing a working partnership between public sector and suppliers to
develop systems and standards which are deliverable.
Obstacles
Technical integration
Balancing standardisation between ensuring interoperability but without
being over prescriptive and stifling development.
Ensuring effective working partnership between public and private sectors
5 . M O R E I N F O R M A T I O N
Contact Person
Name: Simon Beasley
Function: Network Manager
Company: Reading Borough Council
Email: [email protected]
Phone: +44 1189390228
Web link (if existing) http://www.utmc.uk.com/
U R B A N I T S E X P E R T G R O U P
ITS Action Plan – Best Practices: Collection of projects 153
3.64 UK - London: Urban Road User Charging
URBAN ITS
KEY APPLICATION
Traffic & Travel Information
Traffic & Access Management
Smart Ticketing
Urban Logistics
Other:
1 . G E N E R A L D E S C R I P T I O N
Problems to solve /
Objectives
Issue(s) encountered:
Objective(s) of the measure/service:
Reduce congestion;
Make radical improvements to bus services;
Improve journey time reliability for car users;
Make the distribution of goods and services more efficient.
Start of system/service Congestion Charging was introduced in Central London on 17th February
2003. The Western Extension was implemented on 19th February 2007.
Location single road/line city district whole city urban region
Transport mode(s)
concerned
public transport rail road car-sharing
bicycles pedestrians other:
Implementing
organisation
Capita Group was responsible for certain operational aspects of the
scheme until late 2009. The functions passed then to IBM.
System / service
description
The central London Congestion Charging Zone covers a total area of
approximately 42 square kilometres. The ‘original’ 2003 zone covers
approximately 22 square kilometres and the Western Extension
2007covers a further 20 square kilometres.
At a strategic level the London Congestion Charge is a traffic management
scheme. Its clear intention is to control traffic flow in the Central area of
London.
Users pay a daily charge to enter the Charging Zone. They can then exit
and enter as many times as they like during the day. The charge is
operational between the hours of 07:00 and 18:00 Monday to Friday. This
assumes payment in advance of travel.
The charge was originally set at £5 (€6) per day which rose to £8 (€9.60)
per day in July 2005.
Technologies
The system uses Closed Circuit Television (CCTV) and Automatic Number
Plate Recognition (ANPR) technologies.
The CCTV cameras record the vehicle registration (number plate) of all
vehicles that enter the charging zone between 07:00 and 18:00, Monday
to Friday. The ANPR technology converts the details captured in the image
into text which can be compared to the database of valid payments,
exemptions and discounts.
The charge can be paid in a number of ways: via internet, by telephone -
through a contact centre, in some retail outlets and petrol filling stations,
at self-service machines located in major car parks, by post, and users
can also register to pay the charge using their mobile phone - SMS text
messaging.
Standards
2 . I M P L E M E N T A T I O N
Partners involved
Public authorities: City of London, Cities of Westminster, Lambeth,
Southwark, Camden, Islington, Hackney and Tower Hamlets, Kensington,

U R B A N I T S E X P E R T G R O U P
ITS Action Plan – Best Practices: Collection of projects 154
Chelsea, Hammersmith, Fulham
Private stakeholders: Capita Group and IBM after 2009
Others:
Organisational model
Management body:
Operating body: Capita Group and IBM after 2009
Financing body:
Business model
Public investment:
Private / commercial framework:
Public-private partnership:
Investment costs €:
Operating costs € / year: person / year:
3 . R E S U L T S
Technical performance
Implementation of
Innovation
Safety impacts
Efficiency impacts
Traffic flow:
Following indicators observe the key percentage changes
between 2002 (before URUC launched) and 2006 (after) in
traffic entering the central London charging zone between
07:00 and 18:30.
- Amount of traffic, all vehicles (passenger cars and trucks) : -16%
- Amount of traffic, all potentially chargeable vehicles (passenger
cars and trucks) : -30%
- Amount of traffic, all non chargeable vehicles: +16%
Congestion:
- In 2002 traffic demand exceeds capacity during 2,3 min/km,
while in 2005 it drops to 1,8 min/km (-22% in congestion between
2002 and 2005)
- During 2006 congestion reduction fell to 8%, while in 2007
congestion returned to the levels experienced in 2002. This was
not due to a rise in traffic levels, which remain relatively
unchanged. It is thought the increase was caused by other
factors, in particular a notable rise in the street works projects
that have affected capacity on the road network and thus traffic
flow.
Public Transport Efficiency: Bus patronage up, reliability and
journey time improved.
Bus patronage figures for passengers entering Central London
increased year on year between 1999 and 2002 – from
approximately 70.000 passengers in 1999 to just below 88.000
passengers in 2002. There was a significant increase in 2003 to
approximately 104.000 passengers and a further rise to
116.000 in 2004. Patronage stabilised at around 116,000 in

U R B A N I T S E X P E R T G R O U P
ITS Action Plan – Best Practices: Collection of projects 155
2005 and 2006.
The Underground has seen less of a significant impact on
patronage since 2003. A recorded average of approximately
516,000 passengers exited stations in and around the central
charging zone during the morning peak period in 2002. This
rose to 523,000 in 2006 having been 498,000 in 2005.
Environmental impacts
It is challenging to attribute a direct impact of the Charging
Scheme on changes in vehicle emissions and measured air
quality. There have been a number of other factors which have
had an impact on air quality: technology changes to vehicles
and most recently the introduction of the London Low Emission
Zone.
However, the improvement in air quality – reducing emissions
to air – has been due in part to less traffic moving within
central London and that which remains in the area moving
more efficiently.
Overall CO2 emissions change between 2002 and 2003: -16,4%
Overall NOx emissions change between 2002 and 2003: -13,4%
Overall PM10 emissions change between 2002 and 2003: -15,5%
Socio-economic impacts
Revenue generation
TfL reported in 2007 that the scheme generated net revenues of
approximately £123 million in 2006/07 which is being spent on
improvements to transport across London, with an emphasis on improving
bus services.
0.6775 Livre (GBP) = 1 Euro (EUR) in 2007 => revenue created = 182
millions/year
User acceptance
Support rose from 40% in 2002, to 50-60%(in 2006) a year
after the implementation. Shortly after the scheme began, over
80% of respondents said they would accept charging if public
transport improved
4 . L E S S O N S L E A R N T
Factors for success
The scheme had political support at the national level – as early as
1998.
In March 2000 the ROCOL working group published a feasibility report
that supported the introduction of an area-wide scheme.
In May 2000 Ken Livingstone was elected Mayor of London – his
manifesto included a commitment to consult on road user charging; in
January 2001 a strategic plan for the delivery of congestion charging in
Central London was presented to the Mayor and subsequently adopted.
An extensive public information campaign helped to launch the
scheme successfully
Obstacles
The key barriers to the scheme were strong oppositions prior to
implementation. This included local authorities and some retailers. Fear of
the unknown was perpetuated by the media who considered the idea
flawed until Congestion Charging became operational.
It is testament to the strong leadership of the Mayor of London and a
dedicated team at TfL that the scheme was launched in 2003 despite a
number of barriers;
U R B A N I T S E X P E R T G R O U P
ITS Action Plan – Best Practices: Collection of projects 156
5 . M O R E I N F O R M A T I O N
Contact Person
Name:
Function:
Company: Transport for London and IBM
Email:
Phone:
Web link (if existing) http://www.curacaoproject.eu/workfiles/files/deliverables
year of study: 2009
U R B A N I T S E X P E R T G R O U P
ITS Action Plan – Best Practices: Collection of projects 157
3.65 UK - Bristol - Environmental Road Pricing
URBAN ITS
KEY APPLICATION
Traffic & Travel Information
Traffic & Access Management
Smart Ticketing
Urban Logistics
Other:
1 . G E N E R A L D E S C R I P T I O N
Problems to solve /
Objectives
Issue(s) encountered:
Objective(s) of the measure/service:
The overall objective of ELGAR within Bristol is to test a variety of
transport strategies to encourage a greater proportion of
motorists to switch to using public transport, thus achieving more
acceptable levels of environmental pollution.
The specific Environmental road pricing trial objective is more precisely to
determine changes in passenger behaviour in response to the trial. In
particular to quantify: the level of diversion to Park and Ride, the level of
diversion to other modes (rail, bus, cycle, walk), the extent to which
passengers are prepared to change route or change mode in response to
tolls which are implemented on days with poor air quality, the proportion
who would make a trip to an alternative out of town facility in order to
avoid paying a toll, the proportion of trips which would not be made at all
if road pricing were introduced.
A further objective is to determine whether the environmental road
pricing trial has influenced individuals’ perceptions of the willingness of car
drivers to accept road pricing , the likely effectiveness of road pricing in
encouraging passengers to change mode or use Park and Ride, with or
without a pollution episode
Start of system/service
Location single road/line city district whole city urban region
Transport mode(s)
concerned
public transport rail road car-sharing
bicycles pedestrians other:
Implementing
organisation
System / service
description
ELGAR (Environmentally Led Guidance And Restraint) is the acronym
assigned to the local demonstration being undertaken in Bristol as part of
the larger European CONCERT project.
Phase 1: Installation of 5 VMS signs informing drivers of times when
pollution levels in Bristol city centre are high. Strategically placed signs
encourage drivers to use Park & Ride as an alternative to driving into the
centre.
Phase 2: Improved bus priority measures. Real time bus information
provided at a bus stop. And an environmental road pricing trial, in
which a selection of volunteers were rewarded for switching to modes
other than private car for their journeys into the city- the rewards being
raised when pollution levels were advertised as high. This trail aimed to
simulate the volunteers’ likely reactions to being charged tolls for driving
to the city centre.
Technologies
The environmental road pricing subsystem comprises in-vehicle units (IVUs), roadside equipment, environmental road pricing (ERP) controller , communications links
Standards

U R B A N I T S E X P E R T G R O U P
ITS Action Plan – Best Practices: Collection of projects 158
2 . I M P L E M E N T A T I O N
Partners involved
Public authorities:
Private stakeholders:
Others:
Organisational model
Management body:
Operating body:
Financing body:
Business model
Public investment:
Private / commercial framework:
Public-private partnership:
Investment costs €:
Operating costs € / year: person / year:
3 . R E S U L T S
Technical performance
Implementation of
Innovation
Safety impacts
Efficiency impacts
The different charging regimes tested had an impact on the overall number of car trips passing through the A4 corridor via the main charging site at Hicks Gate : the number of
daily car trips per person was 15.1% lower when charge tariff was in force than in the period without road user charges.
Use of both public transport (bus or train) and Park-and-Ride rose (by 48% and 41% respectively) when the
higher charge tariff was used. The number of reported and/or monitored trips along the A4
trial corridor by alternative modes during the charging
periods more than accounted for the measured 15.1% reduction in car trips. This suggests that a high proportion of the car trip reduction was due to modal shift.
The reported and monitored information on use of alternatives to driving into Bristol during the charged periods gave the following split: Park and Ride 46%; Bus
21%; Train 21%; Car share 7%; Cycle or walk 5%. The trial data indicated a slight decrease in the proportion
of those using the Park and Ride from 9.9% to 7.5% when
the VMS displayed poor air quality messages.
Environmental impacts
Socio-economic impacts
Revenue generation
U R B A N I T S E X P E R T G R O U P
ITS Action Plan – Best Practices: Collection of projects 159
User acceptance
Attitudes of the trial participants, comprising regular car
drivers, towards their experiences of road pricing were
explored. Some of the key findings from this survey: Over half of the respondents thought that road pricing
would be effective in encouraging people to use public transport rather than driving into Bristol.
Opinion was split on whether road pricing would have a
positive or negative impact for the city of Bristol in general, with slightly more respondents citing negative impacts (such as impacts on businesses or shops) than positive
impacts (such as reduced pollution and traffic congestion). On a personal level the majority of respondents felt their
own lifestyles would be negatively affected by road pricing,
although a quarter of respondents could see ways in which their lives might be improved.
Of the people who said they had used public transport
during the trial, around three quarters felt generally positive about the experience.
Over half of the respondents thought that the revenue from
any future road pricing scheme should be spent on improving public transport.
Around a quarter of respondents said that no road user
charge would be reasonable. This compared with over 80 % of respondents who felt that their lifestyles would be
affected negatively by road pricing in Bristol.
4 . L E S S O N S L E A R N T
Factors for success
Obstacles
5 . M O R E I N F O R M A T I O N
Contact Person
Name:
Function:
Company:
Email:
Phone:
Web link (if
existing)
http://cordis.europa.eu/telematics/tap_transport/research/projects/concert.html
Year of study/report: 2009
U R B A N I T S E X P E R T G R O U P
ITS Action Plan – Best Practices: Collection of projects 160
3.66 UK - London – Oyster Card
URBAN ITS
KEY APPLICATION
Traffic & Travel Information
Traffic & Access Management
Smart Ticketing
Urban Logistics
Other:
1 . G E N E R A L D E S C R I P T I O N
Problems to solve /
Objectives
Issue(s) encountered: Speed of gate throughput, loss of revenue
Objective(s) of the measure/service: Safety, increased ridership/income
Start of system/service 2003
Location single road/line city district whole city urban region
Transport mode(s)
concerned
public transport rail road car-sharing
bicycles pedestrians other:
Implementing
organisation Transport for London
System / service
description Fare collection
Technologies Contactless smartcard
Standards ISO14443
2 . I M P L E M E N T A T I O N
Partners involved
Public authorities: Transport for London
Private stakeholders: TranSys (Cubic, EDS (HP))
Others:
Organisational model
Management body:
Operating body:
Financing body:
Business model
Public investment:
Private / commercial framework:
Public-private partnership:
Investment costs €: 200 million
Operating costs € / year: 100 million person / year: Year
3 . R E S U L T S
Technical performance 99.9% reliability of assets.
Implementation of
Innovation
Delivered without significant fault over a 3 year period. Widely accepted
to be an innovative scheme which has enhanced the attractiveness of
public transport
Safety impacts 40 people a minute through gates compared with 20 for magnetic. Thus
faster off loading and station egress
U R B A N I T S E X P E R T G R O U P
ITS Action Plan – Best Practices: Collection of projects 161
Efficiency impacts Up to £50m p.a. revenue recovered
Environmental impacts 100k few paper tickets per day, solid state technology and less
mechanical engineering demand.
Socio-economic impacts Far greater access to public transport demonstrated by greater ridership
where other options exist
Revenue generation Estimated at 5% increase on £3 billion per year attributed to Oyster Pay
As You Go
User acceptance 83% of all public transport trips on Oyster
4 . L E S S O N S L E A R N T
Factors for success Reliability and ease of use whilst achieving hitherto unparalleled levels of
performance reliability
Obstacles
Integrating all forms of rail travel in London
Keeping up with internet and mobile technologies as customer preferences
change
5 . M O R E I N F O R M A T I O N
Contact Person
Name: Peter Lewis
Function: Project Implementation Manager
Company: Transport for London
Email: [email protected]
Phone: +44 20 71262865
Web link (if existing) www.tfl.gov.uk
U R B A N I T S E X P E R T G R O U P
ITS Action Plan – Best Practices: Collection of projects 162
3.67 UK - London - The Low Emission Zone (LEZ)
URBAN ITS
KEY APPLICATION
Traffic & Travel Information
Traffic & Access Management
Smart Ticketing
Urban Logistics
Other:
1 . G E N E R A L D E S C R I P T I O N
Problems to solve /
Objectives
Issue(s) encountered: London air quality has an adverse affect on
public health with a 2008 study commissioned by the Greater London
Authority showing that poor air quality contributed to over 4,000 deaths
in London in that year . London does not currently comply with national
and European air quality objectives for particulate matter. The EU have
accepted the UK’s plans for particulate matter reduction and granted an
extension to the deadline for compliance with the EU air quality directive
for PM to December 2011. The Low Emission Zone is key in reducing
particulate matter to below legally mandated levels.
Objective(s) of the measure/service: The Low Emission Zone (LEZ)
aims to reduce air pollution in the capital by encouraging the oldest and
dirtiest diesel vehicles driving in London to become cleaner by levying a
substantial charge to non compliant vehicles driving within the LEZ.
The Low Emission Zone has been in place since 2008 and has been very
successful. Lorries, buses and coaches are required to limit pollution to a
given level (Euro III for particulate matter) or pay a daily charge to drive
in the capital. Nearly 100% of these vehicles driving in London now meet
these standards. In 2008 the LEZ saved 28 tonnes of particulate matter
from landing in London’s air: equal to saving 127 million km driven by a
Euro III Artic - that is160 return trips to the moon or approximately
677,000 times around the M25.
However to ensure that London meets the required standard by the end of
2012, LEZ standards are changing on 3rd January 2012: experience form
2008 shows that the majority of operators take action to clean up their
vehicle sin advance of LEZ standards coming into force so that the
majority of the benefits from the new LEZ standard will be delivered in
2011.
From January 2012 lorries, buses and coaches will need to meet a tighter
standard (Euro IV for particulate matter) to drive in London without
paying a daily charge.
Also in January 2012 vans and minibuses will be affected for the first time
and will need to meet a Euro 3 standards to drive in London without
paying a daily charge. Only the oldest and dirtiest vehicles in this group
(those over 10 years old) are targeted. The LEZ forms a part of the Mayoral Air Quality Strategy.
Start of system/service Phase 1 – Feb 2008, Phase 2 – July 2008, Phase 3 – January 2012
Location single road/line city district whole city urban region
Transport mode(s)
concerned
public transport rail road car-sharing
bicycles pedestrians other:
Implementing
organisation
Transport for London - local government body responsible for transport in
London
System / service
description
Vehicles are required to meet certain emissions standards to drive within
Greater London free of charge.
U R B A N I T S E X P E R T G R O U P
ITS Action Plan – Best Practices: Collection of projects 163
For diesel lorries and specialist vehicles over 3.5 tonnes Gross Vehicle
Weight (GVW); and buses and coaches over 5 tonnes (GVW) with more
than 8 passenger seats the standard is currently Euro III for particulate
matter rising to Euro IV for particulate matter from 3 rd January 2012. TfL
estimate that about 75,000– that is some 35% of these vehicles driving in
London – will need to take some action to meet the new standard. A
Euro III rigid truck – which meets the current LEZ standard - produces 5
times the particulate matter of a Euro IV vehicle - which will meet the
new standard in 2012.
For diesel lorries and specialist vehicles between 1.205 tonnes unladen
weight and 3.5 tonnes GVW; minibuses under 5 tonnes with more than 8
passenger seats ; and motorcaravans and ambulances between 2.5 and
3.5 tonnes GVW a Euro 3 standard for particulate matter will apply from 3
Janaury 2012. Vehicles bought before 1 January 2002 – so those over 10
years old in 2012 will not meet this standard. There are about 72,000
vehicles - around 12 % of these vehicles driving in London that will have
to take some action as a result of LEZ. A 15 year old van produces 4
times the PM pollution of a 9 yr old (Euro 3) van
Vehicles that do not meet the required standard and which travel into the
LEZ must pay a daily charge (£200 for a lorry bus or coach or £100 for a
larger van or minibus) or risk a penalty charge notice (£1,000 or £500
respectively). Daily charges are set high deliberately to encourage
operators to clean up their vehicles rather than pay the daily charges.
For all operators, there are a range of options to comply with the scheme:
buying a new or newer vehicle, fitted an approved particulate matter filter
, re-engining the vehicle or converting to gas with a spark ignition A
summary of the environmental benefits is detailed below.
Enforcement of the LEZ is through cameras placed throughout greater
London. These identify vehicle registration number and check them
against a database to determine if the vehicle is compliant, is exempt or
has paid the fee. However TfL would much prefer operators to meet the
required standard rather than pay a daily charge or risk a penalty charge.
The first time a non-complaint vehicle is seen in the zone the registered
keeper is issued with a warning notice rather than a penalty and is given
28 days during which no further action will be taken. This is keeping with
the aim of the scheme which to improve aim quality and not to penalise
vehicle operators.
Technologies
Operation ofthe scheme is sub-contracted to a number of suppliers. IBM
runs IT systems and operations. Siemens run cameras which are used for
enforcement.
A database was created to enable enforcement of the scheme using
information from Driver & Vehicle Licensing Agency (DVLA – the driver
licensing body for all of Great Britian), the Society of Motor Manufacturers
and Traders (SMMT – the motor manufacturing trade asssocition in the UK
) & operator own registration data. Foreign registered vehicles are held to
the same standards as UK registered vehicles and must register with TfL
to show they meet the required standards (currently TfL has over 120,000
foreign registered vehicles on its database). If any operator believes the
information held by TfL on their vehicle is incorrect they may provide
suitable evidence via a registration and TfL will update their vehicle entry.
Particulate filters sold in the UK are certified (by independent certification
bodies appointed by TfL) against a strict technical standard to ensure they
deliver the required reduction in particulate matter emissions on a given
U R B A N I T S E X P E R T G R O U P
ITS Action Plan – Best Practices: Collection of projects 164
vehicle. Vehicles fitted with an approved filter are then tested and
certified annually by VOSA : the UK Vehicle Operator and Service Agency
which manages all vehicle certification in the UK. Information regarding
vehicle certifications are passed directly to TfL to update the LEZ
database.
TfL recognises and accepts filter certifications from across Europe for
foreign registered vehicles, enabling retrofitted vehicles to demonstrate
that they meet the required emissions standards when then register with
TfL.
TfL provide information leaflets, a dedicated call-centre and operates a
website (www.tfl.gov.uk/lezlondon) giving full information on the scheme
including a vehicle compliance checker where GB operators can input their
license plate number and find out how the LEZ affects them. Foreign
registered operators can use the vehicle checker tool that will help them
understand how the scheme affects their vehicle. The scheme leaflet and
website are available in multiple European languages: any can be
provided on demand. In addition the call centre offers a foreign language
service.
TfL has run an information campaign both in the UK and across Europe
since January 2011 to inform operators of changes to the LEZ coming into
force in January 2012.
Standards
For diesel lorries and specialist vehicles over 3.5 tonnes Gross Vehicle
Weight (GVW); and buses and coaches over 5 tonnes (GVW) with more
than 8 passenger seats the standard is currently Euro III for particulate
matter rising to Euro IV for particulate matter from 3 rd January 2012
For diesel lorries and specialist vehicles between 1.205 tonnes unladen
weight and 3.5 tonnes GVW; minibuses under 5 tonnes with more than 8
passenger seats ; and motorcaravans and ambulances between 2.5 and
3.5 tonnes GVW a Euro 3 standard for particulate matter will apply from 3
January 2012
All approved particulate matter are tested against rigorous technical
standards to ensure they deliver the required reduction in particulate
matter emissions from a given vehicle whilst setting ground breaking
limitations on excess NO2 production. There are currently 13 approved
suppliers of particulate filters in the UK from companies across Europe.
2 . I M P L E M E N T A T I O N
Partners involved
Public authorities: Mayor of London, Greater London Authority, London
Boroughs
Private stakeholders: Service Providers (including IBM, Siemens,
DVLA, VOSA)
Others: Commercial vehicle operators affected by the LEZ zone
Organisational model
Management body: The scheme was implemented and is run by
Transport for London
Operating body: TfL
Financing body: TfL
Business model
Public investment: The scheme was funded from TfL's core business
plan. TfL derives funding from fare revenue, the Greater London
Authority and central Government's Department for Transport
Private / commercial framework:
Public-private partnership:
U R B A N I T S E X P E R T G R O U P
ITS Action Plan – Best Practices: Collection of projects 165
Investment costs 2008 Introduction £40M. 2012 changes £8.6M
Operating costs € / year: £10m in FY 2009/10 person / year:
3 . R E S U L T S
Technical performance
The Low Emission Zone has been in place since 2008 and has been very
successful. Lorries, buses and coaches are required to limit pollution to a
given level (Euro III for particulate matter) or pay a daily charge to drive
in the capital. Nearly 100% of these vehicles driving in London now meet
these standards. In 2008 the LEZ saved 28 tonnes of particulate matter
from landing in London’s air: equal to saving 127 million km driven by a
Euro III Artic - that is160 return trips to the moon or approximately
677,000 times around the M25.
Implementation of
Innovation
From 3rd January 2012 lorries, buses and coaches will need to meet a
tighter standard (Euro IV for particulate matter) to drive in London
without paying a daily charge.
Also from 3rd January 2012 vans and minibuses will be affected for the
first time and will need to meet a Euro 3 standards to drive in London
without paying a daily charge. Only the oldest and dirtiest vehicles in this
group (those over 10 years old) are targeted.
Safety impacts The LEZ has had no impact on vehicle volumes but has significantly
reduced the pollution emitted by diesel vehicle driving in the city.
Efficiency impacts N/A
Environmental impacts
LEZ reduces pollution at the road site – where the pollution is heaviest
and targets the kind of pollution – fine particles - which are most
hazardous to health.
Savings from the LEZ in 2008:
There has been a 28 tonne reduction in PM10. This corresponds to a
3.6% reduction in road traffic exhaust emissions and a 1.9% reduction in
total road traffic emissions.
PM2.5 has been reduced by 26 tonnes which corresponds to a 3.7%
reduction in road traffic exhaust emissions and a 2.4% reduction in total
road traffic emissions.
Road trafic exhaust emissions of NOx have been reduced by 529 tonnes
which corresponds to a 2% reduction
The changes to the LEZ standards in 2012 are broadly expected to double
the pollution reductions seen in 2008. The majority of the emissions
savings are expected to be achieved in the lead-up to (as a result of early
compliance with the emissions standards) and immediately following the
implementation of the scheme.
Socio-economic impacts
Despite improvements in recent years, London’s air quality is till a
concern and still falls below the legally mandated standards.
Air pollution affects the quality of life of a large number of Londoners,
especially those with respiratory and cardiovascular conditions, children,
the sick and the elderly. It is estimated that some 4,000 premature
deaths occur each year due to poor air quality in London.
Over the period 2008 to 2015, it’s estimated the LEZ will deliver health
benefits of up to £270M (EU methodology).

U R B A N I T S E X P E R T G R O U P
ITS Action Plan – Best Practices: Collection of projects 166
Revenue generation
The LEZ raises minimal revenue as almost 100 % of vehicles driving in
the zone meet the required air quality standards rather than paying a
daily charge or risking a fine. The scheme is designed to reduce pollution
in the capital, rather than act as a source of revenue: any revenue
generated is reinvested in London’s public transport.
User acceptance The current compliance rate for driving within the LEZ is almost 100%
4 . L E S S O N S L E A R N T
Factors for success
- Political will is a key to success, and the case to prioritise an
environmental agenda must be made. The political actors are influenced
by actors who lobby pro and contra.
- Extensive consultation and stakeholder engagement is critical, enabling
a scheme to be developed that the vehicle operators can implement
without excessively punitive changes to their operations: it is especially
important to give operators sufficient notice of upcoming changes. The
LEZ seeks to balance the need to reduce pollution against the economic
impact on local service such as the police and fire brigade, business,
charities and community groups all of which operate affected vehicles.
Detailed consultation is key to ensure the balance is struck fairly and
effectively whilst delivering the required pollution reductions over time.
The scheme has been significantly altered due to consultation in its life:
most recently the inclusion of vans and minibuses was delayed by some
15 months to give operators more time to prepare in the context of a very
difficult economic climate.
- Operators must have options to retrofit their vehicles rather than
replace: setting an age limit would very harshly penalize those operators
least able to respond economically and increase compliance costs for the
industry in general. Therefore extensive engagement with the abatement
industry is critical.
- Extensive communications campaigns enable compliance to be
delivered via this route rather than by enforcement. This lessens
significantly the impact on operators and ensures high compliance rates at
go live. This has worked well in London to date.
Obstacles
Driving forces against the scheme are:
- businesses & other organizations who experience increased costs due to
the LEZ regulations.
- Interest groups who are affected by the LEZ and lobby against inclusion.
- The lack of uniform access to foreign registered vehicle keeper details
has hampers scheme enforcement as it is not always possible to issue
penalties to non-compliant vehicles registered outside the UK. However
TfL employs a dedicated European debt collection agency and issues
penalties wherever possible, to ensure foreign registered and UK
registered operators are treated equally by the scheme
5 . M O R E I N F O R M A T I O N
Contact Person
Name: Samantha Kennedy
Function: Head of Strategy and Stakeholder Partnerships
Company: Transport for London
Email: [email protected]
Phone: +44 (0) 20 3054 1579
Web link (if existing) http://www.tfl.gov.uk/roadusers/lez/default.aspx

U R B A N I T S E X P E R T G R O U P
ITS Action Plan – Best Practices: Collection of projects 167
3.68 UK - Leicester - Traffic Information Service Database / Smart Ticketing
URBAN ITS
KEY APPLICATION
Traffic & Travel Information
Traffic & Access Management
Smart Ticketing
Urban Logistics
Other:
1 . G E N E R A L D E S C R I P T I O N
Problems to solve /
Objectives
Issue(s) encountered: Not implemented to expectations
Objective(s) of the measure/service: Better integration with Common DB
Start of system/service 09 / 11
Location single road/line city district X whole city urban region
Transport mode(s)
concerned
public transport rail road car-sharing
bicycles pedestrians other:
Implementing
organisation Leicester City Council
System / service
description Upgrade to Traffic Information Service Common Database
Technologies Common Database and Application server
Standards Single UTMC adapter and SQL database
2 . I M P L E M E N T A T I O N
Partners involved
Public authorities: Leicestershire / Rutland
Private stakeholders:
Others:
Organisational model
Management body:
Operating body:
Financing body:
Business model
Public investment: £100K
Private / commercial framework:
Public-private partnership:
Investment costs €: £100K
Operating costs € / year: £3K person / year: 2/1
3 . R E S U L T S
Technical performance Integration of Strategy management / Asset Management / Fault
management
Implementation of
Innovation User friendly reporting facility
Safety impacts
Efficiency impacts
U R B A N I T S E X P E R T G R O U P
ITS Action Plan – Best Practices: Collection of projects 168
Environmental impacts Reduce congestion / delay
Socio-economic impacts
Revenue generation No -
User acceptance Yes
4 . L E S S O N S L E A R N T
Factors for success Ask for delivery outcome in advance and demand regular meetings
/updates
Obstacles Goals and time scales changes
5 . M O R E I N F O R M A T I O N
Contact Person
Name: Jay Parmar
Function: Traffic Management
Company: Leicester City Council
Email: [email protected]
Phone: 0116 2995669
Web link (if existing)