urban impacts on regional rainfall climatology · urban impacts on regional rainfall climatology...
TRANSCRIPT

Urban Impacts on Regional Rainfall
Climatology
Dev Niyogi
Professor and State Climatologist
Purdue University
West Lafayette, IN 47907, USA
Landsurface.org

- What we know?
- What are we currently working on?
- Perspectives/ comments
Acknowledgements - NSF CAREER, NSF STRONG CITIES, NASA ESSF,
NSF AGS
Yang Long, Paul Schmid, Daniel Aliaga, Ignacio De Garcia at Purdue
Fei Chen, Marshall Shepherd, Bob Bornstein, Jorge Gonzalez, Jim Smith
2
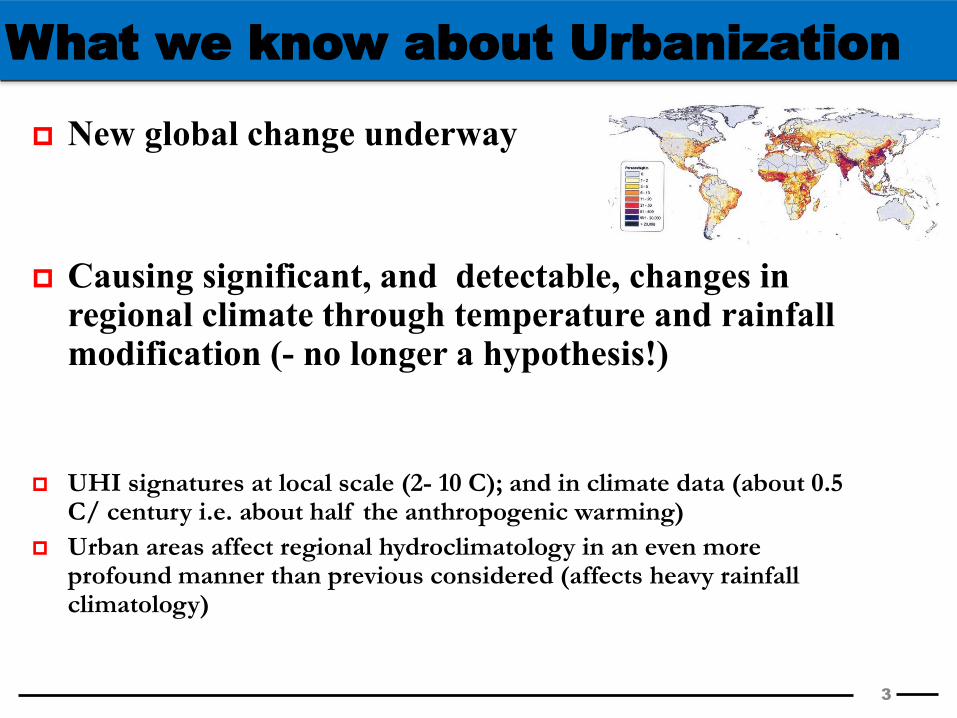
New global change underway
Causing significant, and detectable, changes in regional climate through temperature and rainfall modification (- no longer a hypothesis!)
UHI signatures at local scale (2- 10 C); and in climate data (about 0.5
C/ century i.e. about half the anthropogenic warming)
Urban areas affect regional hydroclimatology in an even more profound manner than previous considered (affects heavy rainfall climatology)
What we know about Urbanization
3

Heavy rainfall trend over India (Goswami et al 2006 Science)
only noted for urban grids (Kishtawal et al IJOC 2010)
Kishtawal et al. 2010, IJOC

Urbanization Impacts Scale Beyond the Surface
Temperature
Urbanization Temperature Change Humidity Change (warmer air can “hold” more water/ higher saturation potential)
/Surface Roughness Change
change in available energy (function of T and q)
Bigger thermals / air circulation from surface to the atmosphere Stronger convection potential
stronger regional gradients
Affect regional convergence/circulation
Modify location / depth of cloud formation
Modify timing, location, intensity, duration of Rainfall

Calm Conditions
Strong Regional
winds
Weak Regional
winds
Strong UHI
UHI
Upwind Divergence
Convergence
Lateral/Downwind
convergence
Convergence
Precip Maximum over
Urban Center
Precip Minimum over City.
Lateral and Downwind
Precip Maximum
Maximum Precip all
advected to downwind
urban edge
Urban Morphology and Size Significant to
Spatio-Temporal Patterns of
Convergence and Heating
After Formation
Aerosols Impact Precipitation Efficiency
(x,y,t) and Lightning
Other cross-cutting factors to consider:
Bifurcation-thermodynamic dome or physical barrier dome?
How does urban moisture and heat island affect local storm dynamics?
Seasonality? Diurnal effects? Topography?
Urban Precipitation Modification (NRC summary)

Example of Thunderstorms split/ intensify as they approach
cities (Niyogi et al. 2006, JGR)
GUTH
NRMN
KING
CHAN
SPEN
ELRE
SHAW MINC
WASH
CHIC
NINN BYAR
VANO ACME
PERK
GUTH
NRMN
KING
CHAN
SPEN
ELRE
SHAW MINC
WASH
CHIC
NINN BYAR
VANO ACME
PERK
GUTH
NRMN
KING
CHAN
SPEN
ELRE
SHAW MINC
WASH
CHIC
NINN BYAR
VANO ACME
PERK
0 20 40 60 dBZ
(a) (b)
Observed Base reflectivity (dBz) from OKC Radar representing nest 4 (1.33km) COAMPS simulation. Dashed figure represents OKC downtown urban area. Observed surface winds (full barb = 5 ms-1) are given by the OK mesonet stations.
1015 UTC 1100 UTC 1130 UTC
0 20 40 60 dBZ

June 13th, 2005 Radar Analysis
Individual storms show urban feedbacks
0002 UTC 14 June 0015 UTC 14 June 0029 UTC 14 June 0042 UTC 14 June 0055 UTC 14 June

Why is there an urban feedback on rainfall?
Not just urban but is a urban – rural heat flux gradients
(convergence / divergence) based feedback
• Triple Combination of – Thermal Properties –
(Albedo) – Surface Roughness –
(z0) – City size – (urban
sprawl) – Create mesoscale
convergence / divergence due to urban rural heterogeneities
Triple Interaction Term (F123)

Does every city affect every storm that passes over it? (or when we have cities as a permanent feature, why some
storms or studies do not show any modification / impact?)
• Majority (66+%) of the impact seen for day time slow moving storms, night time, fast moving storms show less impact
• First storm shows more impact, subsequent storms show lesser impact
• City size threshold needed (~ 25 km, Schmid and Niyogi, GRL)
• Not every storm will be split, or lead to more down wind rain (upwind enhancement is real; as is over city in some cases)
• Aerosols can interact with the dynamics and affect the location of convergence/divergence fields
• Difficulty translated in attribution and assessment in some climatological studies that do not consider dynamics!

Elaborating the urban dynamics and
aerosols perspective…
• Land surface interaction
– Urban heat island forms due from heat retained by built environment.
– Forces local updraft/downdraft couplets
– Size of updrafts independent of city size. Larger cities have more updrafts.
– Perturb storm inflow and updraft: rainout at city edge, delayed precipitation
over city center.
• Aerosol interaction
– Urban particulates (sulfates) act as CCN
– Narrower, more uniformly small cloud droplet size: more smaller droplets
– Suppresses warm rain
– Invigorates cold convective rain
– Deepens mixed phase
• Land surface is dominant. But aerosols are the variable saptiotemporal
forcing.
– Urban aerosol field often co-terminus with land surface.
– We may be attributing aerosol effect: enhanced convection due to cloud
modification to land-surface in some cases, and vice-versa.
11

• Upwind: aerosol boundary coterminus with land
surface.
• Downwind: aerosols transported multiple times of
city footprint (100km+).
• Scale of city
– Land surface perturbations require more time to modify
– Aerosols theoretically within minutes
• Aerosols lofted out of boundary layer by land
surface effects.
• Once storm rains
– Washes aerosol back to surface
– Reduces effectiveness of heat island
– Only roughness perturbations remain.
12

UPDATED HISTORY OF THE
LAPORTE ANOMALY

Chicago Urban Area
Chicago
Valparais
o
La Porte

LaPorte, 1968: The Original
Urban Rainfall Anomaly
• Changnon described anomaly in 1968. – LaPorte rainfall 30-40% higher than
upwind in Chicago.
– 20-25% more heavy rain days.
– Later (1977, 1980) noted peak rainfall had moved westward.
• Debate over existence: Observer bias? “Ended” when automated rain gauge installed.
• Select articles – The LaPorte Anomaly: Fact or
Fiction. (Changnon, 1968)
– The LaPorte Precipitation Fallacy. (Holzman, 1971)
– The LaPorte Anomaly – Fact. (Changnon, 1971)
• Led to METROMEX study in St. Louis metro area.
(Changnon & Huff, 1977)
(Changnon, 1973)

METROMEX: 1971-1975
• First organized study of urban convection. – St. Louis metro area
– Characterize urban precipitation patterns
– Provide hypotheses as to causes of anomalies
• Proposed mechanisms – Combination of heat island
and aerosol-cloud interaction.
– Heat island initiates storms
– Splitting/merging due to airflow around city
– Proposed giant CCN interaction.
Changnon et al., 1976.

Challenges to Verify LaPorte
• Peak anomaly was not stationary: Moving westward when first described.
• Processes not yet described – Helped begin new land surface research.
– Understanding of aerosol processes 30 years behind.
– Remote sensing and modeling unavailable.
• Extent of anomaly in part due to observer bias.
• Seasonality bias? Winter precipitation enhanced by Lake Michigan, not Chicago.
• Last extensive original research on LaPorte published 1980.
• Contemporary research in urban weather based on theories proposed from LaPorte – Urban/rural boundary interaction
– Urban heat island circulations
– Aerosol cloud interaction
– Oldest theories, correct or not, still presented as most likely.

Redid the whole analysis
Updated with radar datasets and improved dynamical/ aerosol
considerations…..“Final Word”:
Yes, the anomaly exists.
Ten year radar climatology (2005-2014) shows significant summertime rainfall
anomaly, downwind of Chicago, peaking south of Valparaiso.

Chicago/ La Porte Observational Analysis
NW to SE moving STRONG
anomaly
W to E moving weaker
anomaly SW Wind Weekend NO
ANOMALY
SW Wind Weekday Anomaly
present

Looking for Urban Signatures beyond rainfall –
effect on PBL height “climatology”
Evidence from High-Resolution Rawinsonde Observations

Objectives
21
The objectives of this study are twofold:
Detect urban signatures from the perspective of PBL heights
-Previous studies focus on urban heat island, urban rainfall
enhancement and urban aerosols ;
-PBL height is a key parameter controlling land-atmosphere
interactions;
Derive climatology of PBL heights for representative US sites
based on a high-resolution rawinsonde dataset
-Vertical resolution is a major source of uncertainty;

Selected Sites and sounding data
22
Four categories:
Inland urban
Inland rural
Coastal urban
Coastal rural
Eight Sites:
10-year sounding data
with a vertical
resolution about 30 m
Twice daily (11 UTC
and 23 UTC)
Non-rainy day

Methods
23
I Bulk-Richardson number based method:
Critical Richardson number is 0.25
II Statistics-based method (Schmid and Niyogi, 2012)
Basic theory: locate the top of the boundary layer by attempting to collocate a
change in the slope of virtual potential temperature with a dew point inversion

Inter-comparison between two methods
24
Consistency for afternoon-time PBL heights;
Richardson-number based method tend to underestimate morning-time
PBL heights;
Bias does not depend on land surface properties of sites;

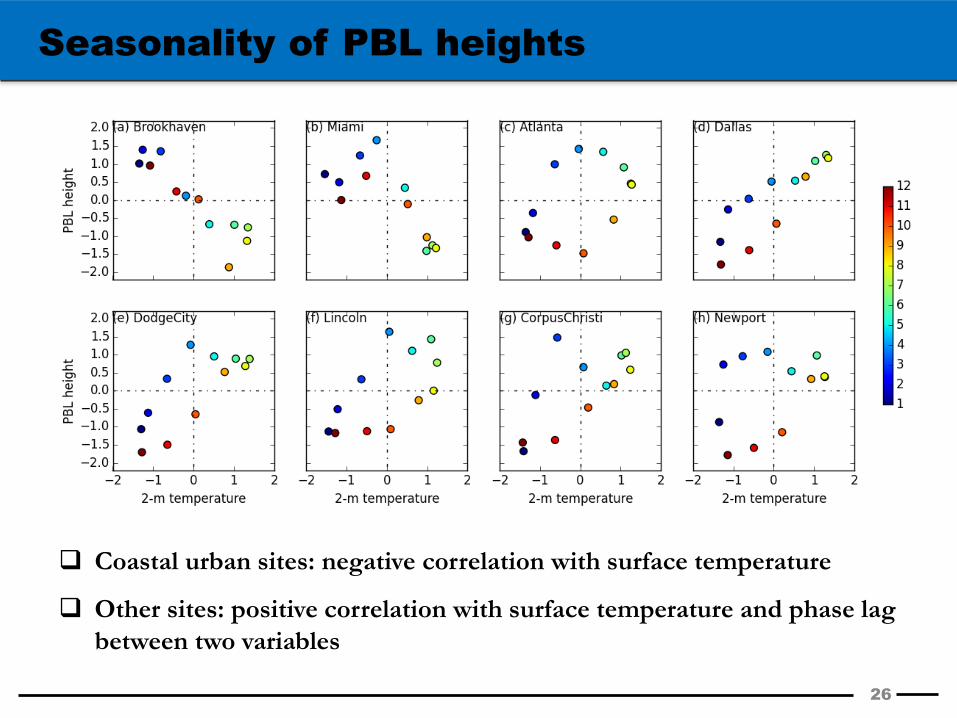
Seasonality of PBL heights
25
Morning-time PBL
heights do not vary
much seasonally
“unimodal” pattern
for coastal rural,
inland rural and
inland urban sites;
“bi-modal” pattern
for coastal urban
sites;
Noticeably larger
PBL heights for
urban sites than
rural sites;
Seasonality of PBL heights
26
Coastal urban sites: negative correlation with surface temperature
Other sites: positive correlation with surface temperature and phase lag
between two variables

Potential Mechanisms
27
Coastal urban: land-ocean temperature gradients dominant
Other sites: land surface properties (e.g., soil moisture) dominant

Impact of shape of city on regional climate
28
Urban coverage is projected to be doubled over Beijing Metropolitan Area in 2050s;
Different forms of urban development (compact vs. dispersed) could produce varied impacts on urban comfort and regional warming;
We evaluate contrast thermal environment between two different ways of urban development under the context of climate change;
We expect to provide suggestions to city planners for building future cities with more adaptability to climate change and heat-related risks;

Model Configuration & Validation
29
Three One-way Nested domains
Distribution of Model Bias
Three dataset for Boundary/Initial Conditions: JRA-55, ERA-interim and FNL
Simulated 2m temperature is not biased based on ERA-interim

Contrast Thermal Environment: Horizontal
30
Compact-City VS Dispersed-City
Regional Warming Effect
UHI intensity (UHII) = Turban - Trural
UHII: Disperse < Compact, ~0.5 K
Regional Warming: Disperse > Compact, ~0.1 K
Urban warming: Disperse < Compact, ~0.15 K

Contrast Thermal Environment: Vertical
31
Dispersed-City scenario produce a relatively deeper perturbation on vertical profile of potential temperature;
Implication for convective instability
Vertical perturbation on Potential temperature
Compact/Current climate
Disperse/ Current climate
Compact /Future climate
Disperse/Future climate

Relative Contributions to regional warming
32
Climate change contributes more than 80 % to total warming ;
Different warming effect induced by spatial patterns of urban coverage is 0.1 K (~3% of total warming);
City planners will need to weigh between regional warming and comfort in urban core region;
Other mitigation tools (e.g., green roof) are needed to enhance urban adaptability to climate change;

Urban procedural modeling for high
resolution modeling data input
33

34
