urban greenway use and benefits in diverse cities: a tale
TRANSCRIPT

Clemson UniversityTigerPrints
All Theses Theses
5-2016
Urban Greenway Use and Benefits in DiverseCities: A Tale of Two TrailsSamuel James KeithClemson University, [email protected]
Follow this and additional works at: https://tigerprints.clemson.edu/all_theses
This Thesis is brought to you for free and open access by the Theses at TigerPrints. It has been accepted for inclusion in All Theses by an authorizedadministrator of TigerPrints. For more information, please contact [email protected].
Recommended CitationKeith, Samuel James, "Urban Greenway Use and Benefits in Diverse Cities: A Tale of Two Trails" (2016). All Theses. 2396.https://tigerprints.clemson.edu/all_theses/2396

URBAN GREENWAY USE AND BENEFITS IN DIVERSE CITIES: A TALE OF TWO TRAILS
A Thesis Presented to
the Graduate School of Clemson University
In Partial Fulfillment of the Requirements for the Degree
Master of Science Parks, Recreation and Tourism Management
by Samuel James Keith
May 2016
Accepted by: Dr. Lincoln R. Larson, Committee Chair
Dr. Jeffrey C. Hallo Dr. C. Scott Shafer
Dr. Mariela Fernandez

ii
ABSTRACT
One type of urban park, greenways, represent unique “corridors of benefits” that
have attracted a great deal of attention from urban planners and recreation practitioners.
Well-designed greenways can contribute to sustainable urban development by improving
health and wellness, facilitating connections with nature, fostering social interaction and
inclusion, adding value to marginal land, and enhancing connectivity across the urban
landscape. However, little is known about the extent to which these benefits are realized
and how they are distributed across diverse populations in different types of settings. To
answer these questions, our study explored patterns of greenway use, constraints to use,
and public perceptions of benefits of two greenways: the Eastside Trail in Atlanta,
Georgia and the Leon Creek Greenway in San Antonio, Texas. Onsite user observations
(2,111 on Eastside Trail and 464 on Leon Creek Greenway) and intercept surveys (505
on Eastside Trail and 429 on Leon Creek Greenway) were conducted along both
greenways during summer 2015. Data were analyzed using Chi square tests, ANOVA,
and descriptive statistics to examine factors associated with the primary outcome
variables of interest: greenway use, constraints to use, and perceived benefits. The urban
Atlanta Beltline is located near the dense population of downtown Atlanta and therefore
had more users accessing the greenway by foot or bicycle, traveling to restaurants and
shops, and the majority of users were walking. The suburban Leon Creek Greenway is
located in a wooded San Antonio creek corridor and had more users accessing it by
personal vehicle, using the greenway for recreation and exercise, and the majority of

iii
users were bicycling. The majority (71%) of users observed on the Eastside Trail were
White, 13% were African American, 9% Hispanic/ Latino, 4% Asian and 3% Other. The
Leon Creek Greenway had a racial breakdown of 48% White, 44% Latino, 4% African
American, 3% Asian, and 1% Other. Users of both greenways recognized experiential
benefits derived from trail use, while the Eastside Trail users equally recognized cultural
benefits. Perceptions of environmental benefits associated with the trails were slightly
less important. Among the trail users we surveyed, constraints to using the greenways
were not commonly expressed, yet some differences between the greenways emerged.
Each of these greenways appeared to meet different needs and play distinctive roles in
their communities. This is likely due to the locations of the greenways within their
respective cities, and the populations of residents nearby. Greenway planners can use
these results to help determine the type of greenway they would like to implement in their
city: an “urban” greenway that enhances downtown infrastructure connecting destinations
and being used for transportation and recreation, or a recreation-centered “suburban”
greenway that provides a sense of solitude and interaction with nature, as well as
opportunities for improving health and wellbeing.

iv
ACKNOWLEDGEMENTS
I would first like to thank my lovely wife, Abby Keith, for her constant
encouragement, joy, love and support in my life. Abby agreed to marry me one week
before my last semester of graduate school, when I spent the entire semester writing this
thesis. She lifted me up when I was discouraged and celebrated with me during my
successes. I love you dearly, Abby!
I would also like to thank my family and friends. My family for helping shape me
in to the man I am today, and supporting me in my move from my home in Texas to
South Carolina. My friends for being stable encouragement throughout my life and
always pointing me towards truth; even if it wasn’t what I wanted to hear.
Doctors Scott Shafer (committee member), David Scott, John Crompton, Corliss
Outley and Gerard Kyle were foundational in my academic pursuit of parks and
recreation at Texas A&M University, and I am very grateful for the role they have played
in getting me to where I am. Doctors Jeff Hallo (committee member), Mariela Fernandez
(committee member), and Charles Chancellor have welcomed me in to Clemson
University and have provided care and guidance throughout my studies here.
Last, but certainly not least, I would like to thank my thesis advisor and
committee chair, Dr. Lincoln Larson. Dr. Larson showed immediate enthusiasm about
my research ideas from day one and his dedication to my development has been
persistent and empowering. Despite his busy schedule, he made plenty of time to direct
my research and professional goals thoroughly. I can’t thank Dr. Larson enough for his
investment in me

v
TABLE OF CONTENTS
TITLE PAGE ....................................................................................................................... i
ABSTRACT ........................................................................................................................ ii
ACKNOWLEDGEMENTS ............................................................................................... iv
LIST OF TABLES ............................................................................................................ vii
LIST OF FIGURES ......................................................................................................... viii
CHAPTER .............................................................................................................................
1. INTRODUCTION AND LITERATURE REVIEW ........................................................... 1
Introduction.............................................................................................................................. 1 Literature Review .................................................................................................................... 5 Thesis Format ........................................................................................................................ 22 References.............................................................................................................................. 24
2. DIFFERENT TRAILS, DIFFERENT TALES:AN ASSESSMENT OF GREENWAY USE, BENEFITS, AND MANAGEMENTIMPLICATIONS IN TWO DIVERSE URBAN COMMUNITIES ................................. 29
Introduction............................................................................................................................ 29 Methods ................................................................................................................................. 33 Results ................................................................................................................................... 41 Demographics of Sample ....................................................................................................... 41 Patterns of Greenway Use ..................................................................................................... 44 Motivations to Use Greenways and Importance of Trail Attributes ...................................... 48 Constraints to Greenway Use ................................................................................................ 50 Perceived Benefits of Greenways .......................................................................................... 52 Discussion .............................................................................................................................. 53 Urban Greenway Characteristics: Eastside Trail (Atlanta, Georgia) ..................................... 54 Suburban Greenway Characteristics: Leon Creek Greenway (San Antonio, Texas)............. 55 Similarities Between Urban and Suburban Greenways ......................................................... 58 Conclusions............................................................................................................................ 62 References.............................................................................................................................. 64
3. ECOSYSTEM SERVIES AND URBAN GREENWAYS:WHAT’S THE PUBLIC’S PERSPECTIVE? .................................................................. 67
Page

vi
Introduction............................................................................................................................ 67 Methods ................................................................................................................................. 71 Results ................................................................................................................................... 76 Description of Sample ........................................................................................................... 77 Exploratory Principle Component Analysis .......................................................................... 77 Perceived Benefits of Greenways .......................................................................................... 80 Environmental Benefits ......................................................................................................... 80 Cultural Benefits .................................................................................................................... 83 Experiential Benefits ............................................................................................................. 84 Discussion .............................................................................................................................. 84 Conclusion ............................................................................................................................. 89 References.............................................................................................................................. 91
4. CONCLUSIONS AND MANAGEMENT IMPLICATIONS ....................................... 101
Leon Creek Greenway – Suburban Greenway..................................................................... 101 Eastside Trail – Urban Greenway ........................................................................................ 103
APPENDICES..................................................................................................................107 Appendix A: Intercept Survey Instrument ...........................................................................108 Appendix B: Direct Observation Instrument .......................................................................109
Table of Contents (Continued)
Page

vii
LIST OF TABLES
2.1. Comparison of Eastside Trail and Leon Creek Greenway Features ......................34
2.2. Demographic Characteristics of Greenway Users .................................................43
2.3. Use Patterns of Eastside Trail and Leon Creek Greenway Users ..........................45
2.4. Greenway Use Classification Spectrum.................................................................58
3.1. Example ANOVA Examining Main Correlates of Perceived Environmental
Benefits of Greenway Users ..................................................................................76
3.2. Principal Component Analysis Illustrating Benefit Categories .............................79
PageTable

viii
LIST OF FIGURES
1.1. Benefits of Parks and Parks Usage ..........................................................................5
2.1. Map of Atlanta Beltline, including the Eastside Trail ...........................................35
2.2. Map of Howard W. Peak Greenway Trails System, including LC Greenway ......36
2.3. Proportional Distribution of Visitors to Eastside Trail by ZIP Code .....................46
2.4. Proportional Distribution of Visitors to LC Greenway by ZIP Code ...................47
2.5. Motivations for Using Eastside Trail and Leon Creek Greenway .........................49
2.6. Importance of Various Trail Attributes ..................................................................50
2.7. Constraints to Using Eastside Trail and LC Greenway More Often .....................52
2.8. Perceived Benefits of Eastside Trail and Leon Creek Greenway ..........................53
3.1. Eastside Trail Corridor ...........................................................................................72
3.2. Leon Creek Greenway Corridor.............................................................................73
3.3. Perceptions of Greenway Benefits by Trail ...........................................................81
3.4. Perceptions of Greenway Benefits by Race ...........................................................82
3.5. Perceptions of Greenway Benefits by Distance Traveled......................................83
PageFigure

1
CHAPTER ONE
INTRODUCTION AND LITERATURE REVIEW
Introduction
The rapid, outward growth of urban areas, commonly known as urban sprawl, is
consuming public green spaces within communities (Walmsley, 2006). While cities are
developing natural settings to build grey space (e.g., buildings, parking lots, roads)
(Swanwick, Dunnett, & Woolley, 2003), their population’s access to green space is
diminishing. Urban green space (UGS), which encompasses natural areas such as urban
forests as well as “created” green space that includes parks, lawns, and golf courses
(Landers & Nahlik, 2013), is often viewed as an amenity, rather than a necessity, and the
protection of these resources is not always prioritized.
One type of urban green space is the greenway: a form of linear park whose
popularity is growing in communities around the world (Fabos, 2004). Greenways are
also frequently referred to as “trails” and “urban trails.” There are many definitions for
greenways, but for the purpose of this paper we will use Shafer, Lee and Turner’s (2000)
definition: “multiple objective, open space corridors that perform natural functions while
offering desirable aesthetic qualities to humans as they recreate or commute along trails”
(p. 164). From this definition, it is evident that greenways serve their respective
communities in many different ways. Continued clarification of the various types,
functions and purposes of greenways is needed to help urban planners and park managers
understand how different types of greenways contribute to urban environments.

2
Recognizing this issue, Shafer, Scott, and Mixon (2000) created a Greenway
Classification System based on the Recreation Opportunity Spectrum (Clark & Stankey,
1979) that included a greenway planning process with key community stakeholders.
Three classifications of greenways emerged from this process, including (1) urban
greenways that are placed in densely populated, highly developed areas, (2) suburban
greenways located in more residential, moderately developed areas, and (3) rural
greenways with low levels of development and populations density adjacent to the trail.
Greenways offer a variety of unique benefits for both the ecosystem and the community
due to their unique linear, connective, and activity-promoting nature.
Greenways connect parks, neighborhoods, communities, businesses, and other
public spaces, providing bicycle/pedestrian access options for the user. In urban settings,
these trails can contribute to a higher quality of life among users (Shafer, Lee, & Turner,
2000) by enhancing their well-being (Chiesura, 2004), increasing social interaction and
inclusion (Kazmierczak & James, 2007), contributing to their health and wellness
(Harnik & Welle, 2011), providing alternative transportation opportunities (Shafer, Lee,
et al., 2000), and enabling people to interact with nature (Chon & Shafer, 2009; Gobster,
1995). They provide the opportunity to mitigate a diverse set of problems for
communities, helping users enjoy living in their community, saving residents and
government money, and delivering ecosystem services across a wide range of
neighborhoods, many of which may be socio-economically marginalized (Jennings,
Larson, & Yun, 2016).

3
Although many potential greenway-related benefits exist, they may not be equally
distributed among all segments of the urban population. Many past studies have
documented a lack of diversity on greenways. For example, research shows the vast
majority of greenway users are White, have a high annual income, and hold a higher
degree of education than non-users (Coutts & Miles, 2011; Lindsey, 1999; Lindsey, Han,
Wilson, & Yang, 2006; Reed, 2014; Wolch et al., 2010). This suggests minorities,
individuals from low-income households, and those with less education do not use these
linear trails very often. Such findings are particularly surprising when compared to other
studies noting inequitable distribution of greenway access, showing that low-income,
minority populations have greater access to trails than their high-income counterparts
(Lindsey, Maraj, & Kuan, 2001). These seemingly contradictory findings have raised
many questions about the social impacts of greenways, generating debates about
discrepancies in the anticipated and realized goals of urban trails and the populations they
are designed to serve. There is also some debate in the literature as to whether or not
green space acts as a “green wall,” acting as a boundary between neighborhoods with
different socioeconomic characteristics (Solecki & Welch, 1995), or a “green magnet,”
attracting different groups to a common space for positive interactions (Coutts & Miles,
2011; Gobster, 1998).
While urban trails and greenways provide many benefits, these benefits cannot be
realized unless planners and managers develop a holistic understanding of the social,
economic, and environmental impacts the resource has on a community. Enhanced
knowledge about who uses greenways, who doesn’t use greenways, and why will help

4
planners and managers maximize the distribution of greenway-related benefits across
diverse communities. Thus, the purpose of this study is to examine patterns of greenway
use, constraints to use, and perceived benefits associated with two types of greenways –
urban and suburban. The two greenways selected for this study were the Eastside Trail in
Atlanta, Georgia, and the Leon Creek Greenway in San Antonio, Texas. Both trails are
popular recreation destinations in large, diverse southern cities. The Eastside Trail
features many attributes of a classic urban greenway (e.g., connects many businesses,
high use levels), while the Leon Creek Greenway is a more representative of typical
suburban trails (e.g., encompasses entire flood plain, moderate development) (Shafer,
Scott, et al., 2000). By identifying factors that influence trail use in different types of
urban settings, this study should help inform greenway design and management to
improve urban health and well-being across diverse socio-economic contexts.

5
Literature Review
General benefits of urban green space
The benefits of urban green space (a term that encompasses a range of settings such as
public parks and greenways and urban forests) have been studied extensively, with results
revealing a range of diverse contributions to human health and wellbeing. For example,
Bedimo-Rung, Mowen, and Cohen (2005) conceptualized a model summarizing the
benefits of parks and park usage, including physical health, psychological health, social,
economic, and environmental benefits (Figure 1).
Figure 1. Benefits of parks and park usage (Bedimo-Rung et al., 2005, p. 160)
Parks serve as environments in which users can practice active lifestyles to
support their physical health. The 2008 Physical Activity Guidelines for Americans
(2008, p. vi) suggest at least 2 hours and 30 minutes of moderate-intensity physical

6
activity per week to reduce the risk of premature mortality, heart disease, hypertension,
colon cancer, diabetes, and other health risks. Despite the known benefits of physical
activity, half of adults and under one third of youth actually meet aerobic activity
recommendations (Centers for Disease Control, 2014). Parks are popular settings for
physical activities since they are often close to home and cost little to no financial
resources for participants, while providing many opportunities to participate in active
behaviors (Godbey & Mowen, 2010). For these reasons, park-based recreation helps to
improve health and reduce the risk of disease. Although opportunities to be physically
active are present in parks, many users remain inactive within parks. Because of their
linear nature, however, trails (i.e., greenways) force people to move (Kaczynski,
Potwarka, & Saelens, 2008). In a study of eight public parks in Los Angeles, Cohen,
McKenzie, Sehgal, Williamson, Golinello, and Lurie (2007), observed two thirds of the
park users engaging in sedentary behavior. Cohen et al. (2007) suggests if communities
have close proximity to parks (i.e., one mile from home to park), individuals would be
more inclined to be physically active in their transportation to parks (e.g., walking or
bicycling) even if they engaged in sedentary behaviors within the park. The various
features and settings located within parks, like trails and wooded areas, have been found
to encourage and promote physical activity among its users (Kaczynski et al., 2008).
Growing evidence suggests park use and park proximity may be key components of
healthy, active lifestyles, but parks provide a variety of other benefits to urban residents
as well.

7
The psychological benefits associated with outdoor recreation in natural areas are
also well documented (Bratman, Hamilton, & Daily, 2012). Contact with green space has
been shown to reduce stress (Kaplan, 1995; Thompson et al., 2012). Experiences in
nature also help direct attention, increase positive feelings, and increase focus (Kaplan,
2001; Kaplan, 1995), which can be a potential remedy for Attention Deficit Disorder
(Kuo & Faber Taylor, 2004; Laumann, Gärling, & Stormark, 2003; More & Payne, 1978;
Taylor & Kuo, 2009). Mood improvement, increased sense of pleasure and the reduction
of sadness are all outcomes associated with green space (Godbey & Blazey, 1983; More
& Payne, 1978). Chiesura (2004) found nature experiences to be a source of positive
feelings and enhanced well-being among visitors of a park. In today’s age of technology,
children are often participating in leisure activities indoors (e.g., video games, television,
computers) while having little exposure to the benefits of the outdoor environment. Many
fear this nature-deficit disorder among children may have negative consequences,
contributing to poor youth development (Kellert, 2002; Louv, 2008). Parks may help to
remedy this problem as well.
Urban parks, and greenways, are also positive places for community development
and socialization. They have been described as “green magnets”, suggesting parks are
spaces in which positive contact between different neighboring groups can improve
interpersonal relations (Gobster, 1998). Kazmierczak and James (2007) support this
assertion, claiming green space can foster community development, which facilitates
social inclusion and community cohesion. Coley, Sullivan, and Kuo (1997) conclude
natural elements promote social interaction opportunities that can lead to a more cohesive
8
community. Parks also play a role in the reduction of crime and violence within
communities. Through an analysis of crime rates in inner-city Chicago, Kuo and Sullivan
(2001) found green spaces reduce property and violent crimes. Another study conducted
by Crewe (2001) in Boston concluded crime rates were lower in houses adjacent to a
linear park than houses next to commercial streets. Urban green space has the opportunity
to bring diverse groups of people in to a public space to develop a community, resulting
in positive relations and increased safety.
Urban green space also provides a number of environmental benefits, which are
often described as ecosystem services. Specifically, the term ecosystem services refers to
“the benefits of nature to households, communities, and economies” (Boyd & Banzhaf,
2007, p. 616). These include provisioning services such as food, water, timber, and fiber;
regulating services that affect climate, floods, disease, wastes, and water quality; cultural
services that provide recreational, aesthetic, and spiritual benefits; and supporting
services such as soil formation, photosynthesis, and nutrient cycling (Millennium
Ecosystem Assessment, 2005). In cities, the environmental benefits associated with green
space include cooler climate, wildlife and vegetation habitat, air and water purification,
and storm water management (Bedimo-Rung et al., 2005; Benedict & McMahon, 2006;
Boyd & Banzhaf, 2007). These benefits do not only impact the environment, but also
have a positive impact on human welfare, reducing infrastructure costs within a
community (Boyd & Banzhaf, 2007). In the past five years, the urban ecosystem services
literature describing these benefits in cities has grown and is receiving much attention
(Elmqvist et al., 2013; Haase, Larondelle, Andersson, Artmann, Borgström, et al., 2014).

9
However, despite this growth, there is a persistent disconnect between the ecosystem
services frequently defined and measured by scientists and those that may be realized and
appreciated by the general public (Nahlik, Kentula, Fennessy, & Landers, 2012). These
perceptions might be important. For example, Baur, Tynon, Ries, and Rosenberger
(2014) concluded positive attitudes about ecosystem services are associated with the use
of green space. Although the benefits of urban green space and outdoor recreation in
urban parks abound, these benefits do not appear to be enjoyed by everyone (Jennings et
al., 2016). This vexing observation has inspired decades of research on constraints to
recreation and park visitation.
Park Use and Constraints to Use
In their influential article on leisure constraints, Crawford, Jackson, and Godbey
(1991) found a hierarchy of constraints that influenced individuals’ participation in
leisure activities. They identified three types of leisure constraints in an earlier article
(Crawford & Godbey, 1987): Intrapersonal constraints include individual psychological
conditions that effect leisure preferences such as stress and perceived self-skill.
Interpersonal constraints involve interactions and relationships with other individuals
that affect both leisure preference and participation such as the inability to find a leisure
partner. Structural constraints are typically constraints outside of the direct control of the
individual that effect leisure participation such as lack of financial resources and lack of
transportation opportunities. Individuals must sequentially negotiate the above

10
constraints, beginning with intrapersonal, moving to interpersonal and ending with
structural constraints (Crawford et al., 1991).
The notion of leisure constraints as a useful tool to explain leisure behavior has
been critiqued; while constraints are helpful to understand activity participation, they do
not prevent people from engaging in leisure altogether (Samdahl & Jekubovich, 1997).
The reduction of individual constraints may not enable participation; when multiple
constraints are present, the intensity of the constraints is magnified and more difficult to
negotiate (Shores, Scott, & Floyd, 2007).
Whether intrapersonal, interpersonal, or structural, recreation constraints may be a
particularly pernicious problem for racial/ethnic minorities. By 2050, the population of
the United States is projected to become much more diverse than today; between the
years 2040 and 2050, the majority of the population will be what we currently refer to as
“minorities” (Ortman & Guarneri, 2009). This has implications for the field of leisure
services because, based on previous reports, racial/ethnic minorities and low-income
individuals are less likely to be users of parks (Floyd, 1999; Ho et al., 2005; Larson,
Whiting, Green, & Bowker, 2014; Lee, Scott, & Floyd, 2001).
Of the theories that have been proposed to explain the various leisure patterns
among racial and ethnic groups; ethnicity and marginality hypotheses have gained
significant traction. Washburne (1978) explored these concepts in relation to African
American leisure preferences. The ethnicity hypothesis, or subculture hypothesis, states
differences in racial and ethnic groups’ value systems, norms, and socialization patterns
drive minority under-participation in outdoor recreation. Substantial research suggests

11
that, for many racial/ethnic minority groups, apparent intrapersonal recreation constraints
may simply be an artifact of divergent leisure preferences. African Americans have
indicated a lower preference for nature-based activities than Whites, while valuing
shopping, going to church, sports, fitness, social events, and explicitly non-outdoors
(Gobster, 2002; Ho et al., 2005; Shinew, Floyd, & Parry, 2004). Latinos and Asians often
visit nature-based spaces with large groups of family and friends more often than other
groups (Chavez, 2008; Shinew et al., 2004). Furthermore, Latinos and African Americans
commonly engage in inactive leisure behavior (Crespo, Smit, Andersen, Carter-Pokras, &
Ainsworth, 2000; Pearce, 1999) which can result in increased risk of poor health. Other
research suggests African Americans tend to prefer developed settings over natural areas
(Gobster, 2002; Ho et al., 2005). One’s culture is understood to be an important indicator
of leisure preferences, which includes both intra- and interpersonal constraints (Floyd,
Shinew, McGuire, & Noe, 1994; Washburne, 1978).
Although the ethnicity hypothesis has been supported by many studies, some
believe the findings are not credible due to an Anglo-conformity bias (Floyd, 1998; Floyd
et al., 1994; Woodard, 1988). The marginality hypothesis, focusing more on structural
and interpersonal constraints, relates racial and ethnic under-participation to their limited
access to economic resources based upon historical discrimination and suppression
(Floyd et al., 1994; Washburne, 1978). Resistance is another potential explanation for
underparticipation among minority groups, which suggests particular groups resist
conforming to White-mainstream activities to reinforce their unique subculture (Shinew
et al., 2004).

12
Constraints to park use among minorities may include perceptions of fear, lack of
safety, discomfort, and displacement in time or space due to another’s presence (Gobster,
1998). The most important changes that might result in greater park use among low-
income individuals were making the parks safer, providing more information about parks,
developing parks closer to home, providing more activities, and providing public
transportation to parks (Scott & Munson, 1994). While studies have found Whites to be
less constrained than minorities (Shores et al., 2007), Shinew et al. (2004) identified
minorities as less constrained than Whites and suggested this may be due to African-
Americans becoming accustomed to negotiating constraints and Caucasians having
different expectations of their park use.
Scott and Munson (1994) found low-income individuals were three times less
likely to use parks than individuals with high income. In that study, low-income
participants stated the most influential constraints to park usage were fear of crime, lack
of transportation to parks, lack of companionship, parks being too far from home, and
poor health.
Urban parks’ role in bringing surrounding neighborhoods together for social
interaction has been debated, with the terms “green walls” (Solecki & Welch, 1995) and
“green magnets” (Coutts & Miles, 2011; Gobster, 1998) being used to describe whether
or not green space is an effective atmosphere for community development. Solecki and
Welch (1995) claimed the poor condition of parks indicated that the park acted as a
boundary separating neighborhoods with different socioeconomic characteristics and,
therefore, encouraging social exclusion. Gobster (1998) counters this argument,

13
proposing green space can encourage positive interactions between diverse individuals
and act as green magnets that pull people together rather than green walls that drive them
apart. In a study examining whether greenways are “green walls” or “green magnets”, the
effects of racial composition of neighborhoods surrounding two greenways in Michigan
were examined (Coutts & Miles, 2011). The authors found that the greenway users were
more diverse than the surrounding neighborhoods, thus supporting Gobster’s (1998)
argument that greenways can facilitate racial comingling. With American communities
becoming more racially and ethnically diverse, the green wall/green magnet question
centering on the value of urban parks is becoming much more important. Perhaps
nowhere are these opportunities (and challenges) more evident than in the case of urban
greenways.
Greenways
Greenways are unique among all forms of urban parks and deserve careful
examination separate from other spaces (Moore & Shafer, 2001). Definitions of
greenways vary. The terms greenways and trails are often used interchangeably, but there
are many types of greenways. It is therefore important to understand the various contexts
in which particular greenways exist. Exclusively ecological greenways, for example,
usually do not contain trail systems due to the impact of human use on ecological
functions (Baschak & Brown, 1995). However, most greenways include trails and
multiple forms of outdoor recreation. Little (1990) claimed four definitions:

14
1. A linear open space established along either a natural corridor, such as a
riverfront, stream valley, or ridgeline, or overland along a railroad right-
of-way converted to recreational use, a canal, a scenic road, or other route.
2. Any natural or landscaped course for pedestrian or bicycle passage. 3.
An open-space connector linking parks, nature reserves, cultural features,
or historic sites with eachother or with populated areas. 4. Locally, certain
strips of linear parks designated as a parkway or greenbelt. (p. 1)
Searns (1995) identified the evolution of greenways over the course of several centuries
and concluded the modern generation (1985 onward) of greenways can be described as
“multi-objective greenways that go beyond recreation and beautification to address such
areas as habitat needs of wildlife, promoting urban flood damage reduction, enhancing
water quality, providing a resource for outdoor recreation, and other urban infrastructure
objectives” (p. 1). Others have moved beyond Searns’ and Little’s holistic definitions of
greenways to identify particular classifications of greenways. Shafer, Scott, et al. (2000)
based their “greenway classification system” on the Recreation Opportunity Spectrum by
outlining three categories for greenways dictated by their functions and attributes: urban,
suburban, and rural. Integrating elements from all types in this typology, Shafer, Lee, et
al. (2000) recognized greenways “in urban areas… can be summarized as multiple
objective, open space corridors that perform natural functions while offering desirable
aesthetic qualities to humans as they recreate or commute along trails” (p. 164). Because
this definition integrates both the natural functions and recreational qualities of
15
greenways while simultaneously emphasizing the role of trails, it is the definition that is
used in the context of this thesis.
The movement toward urban trails began in the late 1800s with Frederick Law
Olmsted, the claimed “father” of the greenway movement (Little, 1990), and his famous
design of Boston’s Emerald Necklace. Charles Eliot, Olmsted’s apprentice, continued to
work on Olmsted’s vision to create a network of parks and greenways around the entire
Boston Metropolitan Region (Fabos, 2004). In the early 1900s, Olmsted’s sons (the
Olmsted Brothers, Henry Wright and Charles Eliot II) expanded their father’s vision and
produced the “40-Mile Loop” in Portland, Oregon (Little, 1990). During the
environmental decades (1960s and 1970s), landscape planners Phil Lewis, Ian McHarg,
Ervin Zube, and Julian Fabos further propelled the movement, setting up the modern day
greenway climate (Fabos, 2004). The President’s Commission on Americans Outdoors
(1987) and Charles Little’s book, Greenways for America (Little, 1990), are seminal
works that have influenced and named the modern day greenway movement (Fabos,
2004). Americans Outdoors (1987) recommended “a vision for the future: A living
network of greenways… to provide people with access to open spaces close to where
they live, and to link together the rural and urban spaces in the American landscape…
threading their way through cities and countrysides like a giant circulatory system” (p.
142).
Based on the thousands of projects that have been reported at urban parks
congregations since the 1980s, the modern greenway movement has been described as
the “fastest among all planning and design activities in the United States” (Fabos, 2004,

16
p. 329). Today, many individuals and organizations are working to make the greenway
vision a reality. For examples, the Rails-to-Trails Conservancy (RTC), with the mission
of “transform[ing] unused rail corridors into vibrant public spaces – ensuring a better
future for America made possible by trails and the connections they inspire,” has
converted more than 21,000 miles of rail corridors into trails in the United States ("About
Us," 2014). And the RTC is only one of the many advocates of greenways, along with
other national, state, local, and non-governmental agencies (Fabos, 2004) such as
American Trails; the East Coast Greenway Alliance; Rivers, Trails, and Conservation
Assistance Program of the National Park Service, among others.
In recent decades, the greenway movement has been buoyed by a concurrent
wave of urban sustainability initiatives such as Green Infrastructure (Benedict &
McMahon, 2006), New Urbanism (Katz, Scully, & Bressi, 1994), Smart Growth and
Smart Conservation (Walmsley, 2006). Green Infrastructure refers to an “interconnected
network of natural areas and other open spaces that conserves natural ecosystem values
and functions, sustains clean air and water, and provides a wide array of benefits to
people and wildlife” (Benedict & McMahon, 2006, p. 1). New Urbanism is “focused on
bringing order and coherence to escalating ‘Edge Cities’ on the urban fringe, based on
walkable, mixed-use towns, villages and neighborhoods with integrated open-space
systems” (Walmsley, 2006, p. 252). Smart Conservation’s goal is to “establish the larger
framework of necessary green corridors that should be preserved and permanently
maintained as open space for predominantly ecological functions, without being
adversely impacted by development” (Walmsley, 2006, p. 264). Smart Conservation’s

17
counterpart, Smart Growth, “considers environmental, social, economic and other factors
in directing development into areas where… ‘gray’ and ‘social’ infrastructures are either
in place or can be readily provided” (Walmsley, 2006, p. 264). As support from these
initiatives is substantiated, the greenway movement is becoming even more enriched,
credible, and relevant (Walmsley, 2006).
General benefits and use of greenways
As noted previously, urban green space offers many benefits to both users and
non-users. Greenways, a unique type of green space, offer these benefits as well as other
benefits related to their linear and connective nature (Ahern, 2002). Having been
identified as “corridors of benefits,” greenways provide opportunities for outdoor
recreation, alternative transportation, economic benefits, open-space protection, and sense
of place (Moore & Ross, 1998). Fabos (1995) claims “greenways can provide healthy
environments in which one can restore a sense of well-being and explore and satisfy a
range of active and passive recreation needs and desires” (p. 10). In a study of three
greenway trails in Texas, Shafer, Lee, et al. (2000) gauged the greenways’ contribution to
the quality of life of their users. They concluded greenways contributed most to quality of
life through health and fitness, presence of natural areas, accessibility to recreation, and
land use patterns. As these studies all suggest, greenway provide a wide range of diverse
benefits, or urban ecosystem services, in the communities where they are located.
In past studies in Chicago, Dallas, and Los Angeles, some of the most significant
predictors of trail use were found to be intrinsic motivation to engage in physical activity,

18
perceived distance to the trail, and perceived trail safety (Wolch et al. 2010). Wolch et al.
(2010) also concluded that greenway use was significantly influenced by individual
characteristics and perceptions, trailside neighborhood built and social environment, trail
characteristics, and weather. While there is ample opportunity for sedentary activity (e.g.,
sitting, picnicking) in many urban parks (Cohen et al., 2007), the majority of greenway
users are active. Gobster (1995), comparing local, regional and state greenways in
Chicago, found an average of roughly 23% of users walking or running and over 74%
bicycling. Coutts and Miles (2011) observed 45.7% walking, 45.7% bicycling, and 7.4%
running, in a study of two greenways in Michigan. Reynolds et al. (2007) in Dallas,
Chicago and Los Angeles, observed 67% bicycling, 14% jogging, 13% walking, and 5%
skating. Lindsey et al. (2006) found 60% bicycling, 19% walking, 11% running, and 6%
skating. Based on these numbers, it is clear the vast majority of greenway users around
the country are active, and thus more likely to avoid poor health conditions than average
park users.
One of the primary reasons why greenways can make important contributions to
public health is their accessibility. Research suggests most greenway users live close to
greenways, traveling between 0 and 5 miles from their home to an access point. Gobster
(1995) found a median of 4 miles distance for users to access a system of greenways in
Chicago. Most users of the Capital Area Greenway System in Raleigh, North Carolina
came from within 5 miles of the greenway (Furuseth & Altman, 1991). Examining a rail-
trail in Spartanburg, South Carolina, Reed, Hooker, Muthukrishnan, and Hutto (2011)
found, on average, trail users lived 2.9 miles away. According to all of these studies,

19
residents living within five miles of greenway access tend to be the highest density of
users. Local trail users accessed greenways by bicycle or walking (76%), 54% of regional
trail users accessed by automobile, and 77% of state trail users accessed by automobile.
Since the majority of greenway users live adjacent to or nearby the trail,
understanding the perceptions of greenways among neighboring landowners is important
(Ivy & Moore, 2007). In a study of adjacent (property that physically touches the
greenway right-of-way) and nearby (property within one quarter mile of the greenway
right-of-way, but not adjacent) landowner perceptions of a proposed greenway in Cary,
North Carolina, only 32% of the participants living within one-quarter mile of the
proposed greenway knew about the trail before participating in the study (Ivy & Moore,
2007). Adjacent landowners were more likely than nearby landowners to have negative
attitudes regarding the potential for crime, property damage, landowner liability,
trespassing, reduced privacy, and reduced property value. They were also more likely to
indicate the establishment of a network of greenways should be a lower priority and less
likely to agree that greenways should be a basic feature of development. Adjacent
landowners were more pessimistic than nearby landowners about the potential benefits of
the proposed greenway such as enhanced opportunities for recreation, aesthetic beauty
and community pride. According to Ivy and Moore (2007), the adjacent residents’
negative perceptions of the proposed greenway was not surprising since their property
directly abutted the corridor and could be most affected by potential problems caused by
the greenway. In a similar study of neighboring landowners’ attitudes toward three
diverse rail-trails across the United States, Moore, Graefe, and Gitelson (1994), found
20
landowners were overall supportive of the rail-trails. Adjacent landowners experienced
more problems with the trails than nearby landowners. As the rail-trails aged, the
majority of neighboring households reported using the trails, where the oldest trail
included 99% of neighboring household use and the youngest trail reported 76% of
neighboring household use (Moore et al., 1994). This would suggest that the longer the
greenway is around, the more a community will use it.
As support for greenways among diverse populations grows, participation in the
planning of greenways by the public is becoming more important (J. Taylor, Paine, &
FitzGibbon, 1995, p. 62). Although the “greenways plan is big and bold… its success will
be determined by people’s perceptions of the small, individual encounters that occur
along the trail.” Furthermore, greenways have the opportunity to be “viewed as new types
of public space specifically designed to overcome the constraints and obstacles posed by
difference” (Lindsey et al., 2001, p. 344).
Greenway users and constraints to use
Urban greenways are also different from many other urban parks for another
reason: the demographics of greenway users are not diverse, but fairly uniform. Along
trails in Indianapolis, Indiana, and Lansing and Battle Creek, Michigan, the percent of
White users ranged from over 81% to 93% (Coutts & Miles, 2011; Lindsey, 1999), far
higher than the proportion of White residents in those city populations. Furuseth and
Altman (1991) found the typical user of the Capital Area Greenway System in Raleigh
was “White… employed, well-educated, and have above average incomes” (p. 329).

21
Comparing three diverse rail-trails across the United States, Moore (1992) found between
93-98% of their users were White and only 21% of the users of one of the greenways had
an income of under $40,000. Wolch et al. (2010) found people with a high income, more
education, and better general health are more likely to use urban trails in Chicago, Dallas
and Los Angeles. More recently, in a three year (2011-2013) study of the Swamp Rabbit
Trail (SRT) in Greenville, South Carolina, Reed (2014) found 92% of the SRT users to
be White.
Lindsey et al. (2006) suggests people with a higher social status are more likely to
be users of urban trails; they also assert that trails passing through neighborhoods with
high-income, more educated residents are preferred. For example, higher income (i.e.,
$45,000+) participants reported they were not interested in using the Swamp Rabbit Trail
in Greenville more frequently (61.4%) than those with lower household incomes. In that
lower-income demographic group, the most common (81.9%) constraint was ‘physical
limitations’ (Reed, 2014).
Somewhat ironically, although the majority of greenway users are White and have
a high income, minorities and low-income households often have disproportionally high
access to greenways (Lindsey, Maraj, & Kuan, 2001). For instance, the nearby residents
of the Indianapolis Greenway System have a lower income and have a higher proportion
of African Americans than the county in which the greenway system is located (Lindsey
et al., 2001). Even with greater physical access, and despite the fact that greenways are
often seen by individuals in low-income neighborhoods as “a means to address a number
of problems, including disorder and decline” (p. 343), minorities and low-income

22
individuals do not appear to be using the trails proportionately. Constraints among the
minority and low-income populations are believed to include perceived threats, disorder
(destabilization and neighborhood decline), and differences in race or class (Lindsey et
al., 2001). This has led to the question of whether or not greenway development should
be a priority in disadvantaged neighborhoods (Lindsey et al., 2001).
Considering all of the benefits and challenges of urban greenways outlined above,
the purpose of this study was to examine patterns of greenway use, constraints to use and
perceived benefits associated with two types of greenways – urban and suburban. The
following are the guiding research questions for this study:
• What types of people are using these greenways? Are they representative of
broader city populations?
• What are the use patterns and preferences along greenways (e.g., activity types,
access modes, distance to trail, attribute preferences), and how do they differ by
trail and/or demographic group?
• What motivates people to visit these greenways?
• What are the constraints to greenway use, and how do they differ by trail and/or
demographic group?
• How do users perceive greenway-related benefits? Do these perceptions differ by
trail, activity participation, use patterns, or demographic group?
Thesis Format
This thesis is written in manuscript format. Chapter 1 introduces the study,

23
summarizes past research on benefits of green space, park use, constraints to park use,
general information about greenways, benefits of greenways, and use of greenways. This
chapter also presents the general research objectives that guided the study. Chapters 2 and
3 are manuscripts that will be submitted for publication. Although recommendations and
management implications are incorporated throughout the manuscript-style chapters,
Chapter 4 provides a concise summary and recommendations based on results of the
overall project. Chapter titles are listed below:
• Chapter 1 – Introduction, Literature Review and Thesis Format
• Chapter 2 – Different Trails, Different Tales: An Assessment of Greenway Use,
Benefits, and Management Implications in Two Diverse Urban Communities
• Chapter 3 – Ecosystem Services and Urban Greenways: What’s the Public’s
Perspective?
• Chapter 4 – Summary and Management Implications

24
References
Ahern, J. (2002). Greenways as strategic landscape planning: theory and application
Wageningen Universiteit. Americans Outdoors: the Legacy, the Challenge. (1987). Washington, D.C.: Island Press. Baschak, L. A., & Brown, R. D. (1995). An ecological framework for the planning,
design and management of urban river greenways. Landscape and Urban
Planning, 33(1), 211-225. Baur, J. W., Tynon, J. F., Ries, P., & Rosenberger, R. S. (2014). Urban Parks and
Attitudes about Ecosystem Services: Does Park Use Matter? Journal of Park and
Recreation Administration, 32(4), 19-34. Bedimo-Rung, A. L., Mowen, A. J., & Cohen, D. A. (2005). The significance of parks to
physical activity and public health: a conceptual model. American journal of
preventive medicine, 28(2), 159-168. Benedict, M. A., & McMahon, E. T. (2006). Green infrastructure: linking landscapes
and communities: Island Press. Boyd, J., & Banzhaf, S. (2007). What are ecosystem services? The need for standardized
environmental accounting units. Ecological Economics, 63(2), 616-626. Bratman, G. N., Hamilton, J. P., & Daily, G. C. (2012). The impacts of nature experience
on human cognitive function and mental health. Annals of the New York Academy
of Sciences, 1249(1), 118-136. Chavez, D. J. (2008). Serving the needs of Latino recreation visitors to urban-proximate
natural resource recreation areas. Recreation Visitor Research: Studies of
Diversity, 53. Chiesura, A. (2004). The role of urban parks for the sustainable city. Landscape and
Urban Planning, 68(1), 129-138. Chon, J., & Shafer, C. S. (2009). Aesthetic responses to urban greenway trail
environments. Landscape Research, 34(1), 83-104. Clark, R. N., & Stankey, G. H. (1979). The Recreation Opportunity. Cohen, D. A., McKenzie, T. L., Sehgal, A., Williamson, S., Golinelli, D., & Lurie, N.
(2007). Contribution of public parks to physical activity. American journal of
public health, 97(3), 509-514. Coley, R. L., Sullivan, W. C., & Kuo, F. E. (1997). Where does community grow? The
social context created by nature in urban public housing. Environment and
behavior, 29(4), 468-494. Coutts, C. J., & Miles, R. (2011). Greenways as green magnets: The relationship between
the race of greenway users and race in proximal neighborhoods. Crawford, D. W., & Godbey, G. (1987). Reconceptualizing barriers to family leisure.
Leisure sciences, 9(2), 119-127. Crawford, D. W., Jackson, E. L., & Godbey, G. (1991). A hierarchical model of leisure
constraints. Leisure sciences, 13(4), 309-320. Crespo, C. J., Smit, E., Andersen, R. E., Carter-Pokras, O., & Ainsworth, B. E. (2000).
Race/ethnicity, social class and their relation to physical inactivity during leisure

25
time: results from the Third National Health and Nutrition Examination Survey, 1988–1994. American journal of preventive medicine, 18(1), 46-53.
Crewe, K. (2001). Linear parks and urban neighbourhoods: a study of the crime impact of the Boston south-west corridor. Journal of Urban Design, 6(3), 245-264.
Elmqvist, T., Fragkias, M., Goodness, J., Güneralp, B., Marcotullio, P. J., McDonald, R. I., . . . Seto, K. C. (2013). Urbanization, biodiversity and ecosystem services:
challenges and opportunities: Springer. Fabos, J. G. (2004). Greenway planning in the United States: its origins and recent case
studies. Landscape and Urban Planning, 68(2), 321-342. Floyd, M. F. (1998). Getting beyond marginality and ethnicity: The challenge for race
and ethnic studies in leisure research. Journal of leisure research, 30(1), 3-22. Floyd, M. F. (1999). Race, ethnicity and use of the National Park System. Floyd, M. F., Shinew, K. J., McGuire, F. A., & Noe, F. P. (1994). Race, class, and leisure
activity preferences: marginality and ethnicity revisited. Journal of leisure
research. Furuseth, O. J., & Altman, R. E. (1991). Who's on the greenway: Socioeconomic,
demographic, and locational characteristics of greenway users. Environmental
Management, 15(3), 329-336. Gobster, P. H. (1995). Perception and use of a metropolitan greenway system for
recreation. Landscape and Urban Planning, 33(1), 401-413. Gobster, P. H. (1998). Urban parks as green walls or green magnets? Interracial relations
in neighborhood boundary parks. Landscape and Urban Planning, 41(1), 43-55. Gobster, P. H. (2002). Managing urban parks for a racially and ethnically diverse
clientele. Leisure sciences, 24(2), 143-159. Godbey, G., & Blazey, M. (1983). Old people in urban parks: An exploratory
investigation. Journal of leisure research. Godbey, G., & Mowen, A. (2010). The benefits of physical activity provided by park and
recreation services: The scientific evidence: National Recreation and Park Association Ashburn, VA, USA.
Haase, D., Larondelle, N., Andersson, E., Artmann, M., Borgström, S., Breuste, J., . . . Hansen, R. (2014). A quantitative review of urban ecosystem service assessments: Concepts, models, and implementation. Ambio, 43(4), 413-433.
Harnik, P., & Welle, B. (2011). From Fitness Zones to the Medical Mile: How Urban
Park Systems Can Best Promote Health and Wellness. Retrieved from History of RTC and the Rail-Trail Movement. (2014). Retrieved from
http://www.railstotrails.org/about/history/ Ho, C.-h., Sasidharan, V., Elmendorf, W., Willits, F. K., Graefe, A., & Godbey, G.
(2005). Gender and ethnic variations in urban park preferences, visitation, and perceived benefits. Journal of leisure research, 37(3), 281.
Ivy, M. I., & Moore, R. L. (2007). Neighboring landowner attitudes regarding a proposed greenway trail: assessing differences between adjacent and nearby residents. Journal of Park and Recreation Administration, 25(2).
Jennings, V., Larson, L., & Yun, J. (2016). Advancing Sustainability through Urban Green Space: Cultural Ecosystem Services, Equity, and Social Determinants of

26
Health. International journal of environmental research and public health, 13(2), 196.
Kaczynski, A. T., Potwarka, L. R., & Saelens, B. E. (2008). Association of park size, distance, and features with physical activity in neighborhood parks. American
journal of public health, 98(8), 1451-1456. Kaplan, R. (2001). The nature of the view from home psychological benefits.
Environment and behavior, 33(4), 507-542. Kaplan, S. (1995). The restorative benefits of nature: Toward an integrative framework.
Journal of environmental psychology, 15(3), 169-182. Katz, P., Scully, V. J., & Bressi, T. W. (1994). The new urbanism: Toward an
architecture of community (Vol. 10): McGraw-Hill New York. Kazmierczak, A., & James, P. (2007). The role of urban green spaces in improving social
inclusion. Kellert, S. R. (2002). Experiencing nature: Affective, cognitive, and evaluative
development in children. Children and nature: Psychological, sociocultural, and
evolutionary investigations, 117-151. Kuo, F. E., & Faber Taylor, A. (2004). A potential natural treatment for attention-
deficit/hyperactivity disorder: evidence from a national study. American journal
of public health, 94(9), 1580-1586. Kuo, F. E., & Sullivan, W. C. (2001). Environment and crime in the inner city does
vegetation reduce crime? Environment and behavior, 33(3), 343-367. Landers, D. H., & Nahlik, A. M. (2013). Final ecosystem goods and services
classification system (FEGS-CS) EPA United States Environmental Protection
Agency. Report number EPA/600/R-13/ORD-004914. Larson, L., Whiting, J. W., Green, G. T., & Bowker, J. (2014). Physical Activity Levels
and Preferences of Ethnically Diverse Visitors to Georgia State Parks. Journal of
leisure research, 46(5), 540-562. Laumann, K., Gärling, T., & Stormark, K. M. (2003). Selective attention and heart rate
responses to natural and urban environments. Journal of environmental
psychology, 23(2), 125-134. Lee, J.-H., Scott, D., & Floyd, M. F. (2001). Structural inequalities in outdoor recreation
participation: A multiple hierarchy stratification perspective. Journal of leisure
research, 33(4), 427. Lindsey, G. (1999). Use of urban greenways: insights from Indianapolis. Landscape and
Urban Planning, 45(2), 145-157. Lindsey, G., Han, Y., Wilson, J., & Yang, J. (2006). Neighborhood correlates of urban
trail use. Journal of Physical Activity & Health, 3, S139. Lindsey, G., Maraj, M., & Kuan, S. (2001). Access, equity, and urban greenways: An
exploratory investigation. The Professional Geographer, 53(3), 332-346. Little, C. E. (1990). Greenways for America. Baltimore, MD: Johns Hopkins University
Press. Louv, R. (2008). Last child in the woods: Saving our children from nature-deficit
disorder: Algonquin Books.

27
Moore, R. L. (1992). The impacts of rail-trails: A study of the users and property owners
from three trails: United States Govt Printing Office. Moore, R. L., Graefe, A. R., & Gitelson, R. J. (1994). Living near greenways:
neighboring landowners' experiences with and attitudes toward rail-trails. Journal
of Park and Recreation Administration, 12(1), 79-93. Moore, R. L., & Ross, D. T. (1998). Trails and recreational greenways: corridors of
benefits. Parks & Recreation (Ashburn), 33(1), 68-79. Moore, R. L., & Shafer, C. S. (2001). Introduction to special issue trails and greenways:
opportunities for planners, managers, and scholars. Journal of Park and
Recreation Administration, 19(3), 1-16. More, T. A., & Payne, B. R. (1978). Affective responses to natural areas near cities.
Journal of leisure research, 10(1), 7-12. Nahlik, A. M., Kentula, M. E., Fennessy, M. S., & Landers, D. H. (2012). Where is the
consensus? A proposed foundation for moving ecosystem service concepts into practice. Ecological Economics, 77, 27-35.
Ortman, J. M., & Guarneri, C. E. (2009). United States population projections: 2000 to 2050. United States Census Bureau.
Pearce, K. D. (1999). Race, ethnicity, and physical activity. Journal of Physical
Education, Recreation & Dance, 70(1), 25-28. Prevention, C. f. D. C. a. (2014). State Indicator Report on Physical Activity. Retrieved
from Atlanta, GA: Reed, J. A. (2014). Greenville Health System Swamp Rabbit Trail: Year 3 Findings.
Retrieved from Greenville, SC: Reed, J. A., Hooker, S. P., Muthukrishnan, S., & Hutto, B. (2011). User demographics
and physical activity behaviors on a newly constructed urban rail/trail conversion. Journal of Physical Activity and Health, 8(4), 534.
Reynolds, K. D., Wolch, J., Byrne, J., Chou, C.-P., Feng, G., Weaver, S., & Jerrett, M. (2007). Trail characteristics as correlates of urban trail use. American Journal of
Health Promotion, 21(4s), 335-345. Samdahl, D. M., & Jekubovich, N. J. (1997). A critique of leisure constraints:
Comparative analyses and understandings. Journal of leisure research, 29(4), 430.
Scott, D., & Munson, W. (1994). Perceived Constraints to Park Usage. Journal of Park
and Recreation Administration. Searns, R. M. (1995). The evolution of greenways as an adaptive urban landscape form.
Landscape and Urban Planning, 33(1), 65-80. Services, U. S. D. o. H. a. H. (2008). 2008 Physical Activity Guidelines for Americans.
Retrieved from Washington, D.C.: Shafer, C. S., Lee, B. K., & Turner, S. (2000). A tale of three greenway trails: user
perceptions related to quality of life. Landscape and Urban Planning, 49(3), 163-178.
Shafer, C. S., Scott, D., & Mixon, J. (2000). A greenway classification system: Defining the function and character of greenways in urban areas. Journal of Park and
Recreation Administration, 18(2).

28
Shinew, K. J., Floyd, M. F., & Parry, D. (2004). Understanding the relationship between race and leisure activities and constraints: Exploring an alternative framework. Leisure sciences, 26(2), 181-199.
Shores, K. A., Scott, D., & Floyd, M. F. (2007). Constraints to outdoor recreation: A multiple hierarchy stratification perspective. Leisure sciences, 29(3), 227-246.
Solecki, W. D., & Welch, J. M. (1995). Urban parks: green spaces or green walls? Landscape and Urban Planning, 32(2), 93-106.
Swanwick, C., Dunnett, N., & Woolley, H. (2003). Nature, role and value of green space in towns and cities: An overview. Built Environment, 29(2), 94-106.
Taylor, A. F., & Kuo, F. E. (2009). Children with attention deficits concentrate better after walk in the park. Journal of attention disorders, 12(5), 402-409.
Thompson, C. W., Roe, J., Aspinall, P., Mitchell, R., Clow, A., & Miller, D. (2012). More green space is linked to less stress in deprived communities: Evidence from salivary cortisol patterns. Landscape and Urban Planning, 105(3), 221-229.
Walmsley, A. (2006). Greenways: multiplying and diversifying in the 21st century. Landscape and Urban Planning, 76(1), 252-290.
Washburne, R. F. (1978). Black under‐participation in wildland recreation: Alternative explanations. Leisure sciences, 1(2), 175-189.
Wolch, J. R., Tatalovich, Z., Spruijt-Metz, D., Byrne, J., Jerrett, M., Chou, C.-P., . . . Reynolds, K. (2010). Proximity and perceived safety as determinants of urban trail use: findings from a three-city study. Environment and planning. A, 42(1), 57.
Woodard, M. D. (1988). Class, regionality, and leisure among urban Black Americans: The post-civil rights era. Journal of leisure research.

29
CHAPTER 2
DIFFERENT TRAILS, DIFFERENT TALES:
AN ASSESSMENT OF GREENWAY USE, BENEFITS, AND MANAGEMENT
IMPLICATIONS IN TWO DIVERSE URBAN COMMUNITIES
Introduction
The rapid, outward growth of urban areas, commonly known as urban sprawl, is
consuming green spaces within communities (Walmsley, 2006). While many cities are
developing natural settings to build grey space (e.g., buildings, parking lots, roads)
(Swanwick et al., 2003), their population’s access to green space is diminishing. Urban
green space (UGS), which encompasses natural areas such as urban forests as well as
“created” green space that includes parks, lawns, and golf courses (Landers & Nahlik,
2013), is typically viewed as an amenity, rather than a necessity, and the protection of
these resources is not always prioritized. However, not only does green space provide
creative and meaningful leisure experiences that impact physical, mental, and social
wellbeing (Larson, Jennings, & Cloutier, in review), it also provides many other benefits
to a community such as increased vegetation and wildlife habitat, storm water
management, air and water purification, climate regulation, and economic opportunities
(Benedict & McMahon, 2006; Boy & Banzhaf, 2007; Palau, Forgas, Blasco, & Ferrer,
2012).
One type of urban green space is the greenway: a form of linear park that is
growing in popularity in communities around the world (Fabos, 2004). The greenway

30
movement has been described as “the fastest [movement] among all planning and design
activities in the United States” (p. 329). Greenways are common resources that promote
the functionality of Green Infrastructure (Benedict & McMahon, 2006). The concept of
Green Infrastructure has been introduced to integrate urban infrastructure with
conservation of natural resources and promotion of public health (Tzoulas et al., 2007),
and it has resulted in proactive development of interconnections among green spaces and
habitats. . Although greenways are designed in many forms, they are generally viewed as
key elements of green infrastructure that represent “multiple objective, open space
corridors that perform natural functions while offering desirable aesthetic qualities to
humans as they recreate or commute along trails” (Shafer, Lee and Turner, 2000, p. 164).
From this definition, it is evident that greenways serve their respective communities in
many different ways.
Continued clarification of the various types, functions and purposes of greenways
is needed to help urban planners and park managers understand how different types of
greenways contribute to urban environments. Recognizing this issue, Shafer, Scott, et al.
(2000) created a Greenway Classification System based on the Recreation Opportunity
Spectrum (Clark & Stankey, 1979) that included a greenway planning process with key
community stakeholders College Station, Texas. Three classifications of greenways
emerged from this process, including (1) urban greenways that are placed in densely
populated, highly developed areas, (2) suburban greenways located in more residential,
moderately developed areas, and (3) rural greenways with low levels of development and
populations density adjacent to the trail. This Greenway Classification Spectrum claimed

31
urban and suburban greenways shared primary functions, such as flood control,
recreation, transportation and aesthetic quality, with economic development being a
unique primary function associated with urban greenways. This typology provides
helpful distinctions regarding the key elements that define greenways and greenway
related benefits, but it does not investigate how these attributes influence greenway use
and perceptions of greenway-related benefits.
Greenways of all types – and particularly those in urban and suburban areas - can
provide a set of benefits for people that are unique to the linear, connective, and activity-
promoting nature of these trails. They often connect parks, neighborhoods, communities,
businesses, and other public spaces, providing bicycle/ pedestrian access options for the
user. Greenways also enhance quality of life (Shafer, Lee, et al., 2000) by positively
affecting well-being (Chiesura, 2004), contributing to health and wellness (Harnik &
Welle, 2011) increasing social interaction and inclusion (Kazmierczak & James, 2007),
providing alternative transportation opportunities (Shafer, Lee, et al., 2000), and
facilitating interactions between humans and nature (Chon & Shafer, 2009; Gobster,
1995).
Although many potential greenway-related benefits exist, they may not be equally
distributed among all segments of the urban population. Many past studies have
documented a lack of diversity on greenways. For example, research shows the vast
majority of greenway users are White, have a high annual income, and hold a higher
degree of education than non-users (Coutts & Miles, 2011; Lindsey, 1999; Lindsey et al.,
2006; Reed, 2014; Wolch et al., 2010). This suggests minorities, low-income households,

32
and those with less education do not use these linear trails very often. However, some
studies have found an inequitable distribution of greenway access, showing low-income,
minority populations have greater access to trails than their high-income counterparts
(Lindsey, Maraj, & Kuan, 2001). Theses seemingly contradictory findings have raised
many questions about the social impacts of greenways, generating debates about
discrepancies in the anticipated and realized goals of urban trails and the populations they
are designed to serve. There is debate in the literature as to whether or not green space
acts as a “green wall,” acting as a boundary between neighborhoods with different
socioeconomic characteristics (Solecki & Welch, 1995), or a “green magnet,” attracting
different groups to a common space for positive interactions (Coutts & Miles, 2011;
Gobster, 1998).
For all of these complex reasons, planners and managers must develop a more
holistic understanding of the social, environmental, and economic impacts that different
types of greenways have on communities. Thus, the purpose of this study was to further
explore the value of greenways by examining patterns of greenway use and preferences,
constraints to use, and perceptions of greenway-related benefits on two different
greenways in slightly different settings: an urban greenway in Atlanta, Georgia (the
Eastside Trail of the Atlanta Beltline), and a suburban greenway in San Antonio, Texas
(the Leon Creek Greenway of the Howard W. Peak Greenway Trail System).
Specifically, our investigation sought to compare and contrast an urban and suburban
greenway by addressing these guiding research questions:

33
• Who is using these greenways? What are their use patterns (e.g., activity type, trip
purpose, mode of access, distance to trail)?
• What motivates users to visit these greenways, and what is important to them on
the trail?
• What are some constraints to greenway use?
• How do greenway users perceive greenway-related benefits?
By enhancing understanding of the functions of an urban and suburban greenway, this
study could help to inform greenway planning, design and management that improves
public health and well-being across diverse populations.
Methods
Study Sites
The two greenways selected for this study were the Eastside Trail in Atlanta,
Georgia (Figure 2.1) and the Leon Creek Greenway in San Antonio, Texas (Figure 2.2).
These greenways were selected due to their qualities as urban and suburban greenways in
large, diverse cities (Table 2.1). Construction began on the Leon Creek Greenway in
2009, while ground was broken for the Eastside Trail in 2010. Both greenways are part of
larger urban trail systems that are under construction, and there are master plans in place
for the future of the two greenways to encircle their entire city. The Leon Creek
Greenway currently includes 13.5 miles of paved, multi-use trail, while the Eastside Trail
is 2.25 miles of paved trail. Since both greenways remain under development (with future

34
plans for expansion), the results of this study could be used to inform both future
development and current management.
Table 2.1.
Comparison of Eastside Trail (Atlanta, Georgia) and Leon Creek Greenway (San
Antonio, Texas) Features
Comparison of Study Sites
Eastside Trail Leon Creek Greenway
Location Near downtown Atlanta,
Georgia Suburbs of San Antonio,
Texas
Current distance of
greenway 2.25 miles 13.5 miles
Trail surface Concrete Concrete/Asphalt
Adjacent population density High Medium
Connections of interest High quantity of restaurants,
stores, residential areas
Low quantity of restaurants and stores. Medium quantity
of residential areas.
Surrounding corridor
Narrow strip of vegetation, with heavy adjacent
development
Wide, wooded, creek flood plain, no adjacent
development
Access points Road crossings, no parking
lots Parking lots

35
Figure 2.1: Map of the Atlanta Beltline (Atlanta, Georgia), including the Eastside Trail
("Atlanta BeltLine TAD," 2014). This is the planned Beltline, yet few portions of the trail
have actually been built.

36
Figure 2.2: Map of the Howard W. Peak Greenway Trails System ("Howard W. Peak
Greenway Trails System," 2016), including the Leon Creek Greenway (San Antonio,
Texas)

37
Data Collection
We collected data along both greenways using direct observations and intercept
surveys of trail users during May to August 2015.
Direct Observation
Observations of greenway users at each greenway were conducted using an
adapted version of the System for Observing Play and Recreation in Communities
(SOPARC), a tool designed to collect data on recreation participants’ physical activity
levels in community settings (McKenzie, Cohen, Sehgal, Williamson, & Golinelli, 2006).
It has been confirmed as a reliable and efficient strategy for assessing activity levels and
behaviors in various recreation environments (Bocarro et al., 2009; McKenzie et al.,
2006; Parra et al., 2010; Whiting, Larson, & Green, 2012). Specifically, SOPARC has
been useful for assessing trail use in previous studies (Librett, Yore, & Schmid, 2006;
Reed, 2014; Reed et al., 2008). The SOPARC observations tracked user activity at
different greenway access points during 30-minute intervals across three different stages
of the day: Morning – 7:00am to 11:59am, Afternoon – 12:00pm to 3:59pm, Evening –
4:00pm to 8:00pm. We scheduled observation sessions using a stratified random
sampling protocol to ensure adequate coverage across all times of the day on both
weekdays and weekends.
During the SOPARC observations, we observed and recorded specific
information about every greenway user passing a specified sampling location. Because

38
the Eastside Trail has a much higher volume of users than the Leon Creek Greenway,
every user passing by the observer was counted on the Leon Creek Greenway, but only
users going in a particular direction (alternating between northbound to southbound
users) were counted on the Eastside Trail. User attributes recorded demographics (e.g.,
age range, gender, race/ethnicity) and specific activities (e.g., bicycling, running,
walking, skating) for each individual observed (See Appendix B). Other variables such as
weather were also noted. The observer was trained by an experienced SOPARC
researcher and coding accuracy was validated prior to data collection. These data enabled
the construction of a basic profile of greenway users in each city. Overall, 464 users were
observed on the Leon Creek Greenway during a total of fifteen 30-minute observation
periods; 2,111 users were observed on the Eastside Trail during twenty-five 30-minute
observation periods.
Intercept Surveys at Access Points
Intercept surveys of greenway users were conducted at key access points
(identified by greenway managers) along each greenway. This method has produced
reliable and valid data on other trail-based studies (Troped, Whitcomb, Hutto, Reed, &
Hooker, 2009). Survey data sampling was scheduled in conjunction with SOPARC
observations to ensure adequate temporal coverage. Previous greenway user surveys were
used to inform data collection and instrument design.
To recruit participants, we held up the survey attached to a clipboard to captures
users’ attention from a distance, giving them time to slow down and stop. The survey

39
took 5-10 minutes to complete. Cool water and shade were offered or already in place as
an incentive to pause and fill out the questionnaire. Every Leon Creek Greenway user age
18 years or older who passed a sampling location was approached and asked if he/she
would be willing to participate in a brief survey about greenway use. However, due to the
high volume of users on the Eastside Trail (where it was not feasible to sample every
user), systematic random sampling was used at that location. On the Eastside Trail we
approached every kth visitor, depending on user density at the time of observation. Upon
consent, trail users were given one of two survey versions; both version were identical
with the exception of different sections on constraints and perceived benefits (analyses
for these particular variables were therefore based on approximately 50% of the sample).
On the survey instrument (Appendix A), participants were first asked how often
they visited the trail, followed by “check ALL the activities you participated in during
your visit to the [greenway] today,” with options including typical greenway activities
such as walking, running, bicycling, skating, dog walking, wildlife viewing/photography
or others. Participants were then asked about mode of trail access (e.g., walk/bicycle, car
or public transportation) and where they are typically going when they use the trail (e.g.,
no destination – just recreation, parks/historic sites, work, school, restaurants/stores, or
other destination). To evaluate motivations, we used items adapted from Larson, Whiting,
and Green (2013) that asked participants “how IMPORTANT are the following factors to
you during your visit to the [greenway]?” with 11 items rated on a scale from 1 = not at
all important, to 5 = extremely important. To assess potential constraints to visitation, we
asked participants items adapted from Wilhelm-Wilhelm-Stanis et al. (2009)to “indicate

40
whether each of the following obstacles or barriers is a reason that KEEPS YOU from
visiting the Beltline trail as often as you would like,” with 10 items rated on a scale
ranging from scale of 1= not a reason to 5 =major reason. To characterize perceptions of
greenway-related benefits, we asked respondents to “please state whether you AGREE or
DISAGREE with the following statements concerning the [greenway];” on a scale from 1
= strongly disagree to 5 = strongly agree. Benefits items were adapted from the
ecosystem services framework and inspired by Brown and Raymond (2007), Crossman et
al. (2013), and Kremen and Ostfeld (2005). Since ecosystem services literature has little
to say about public perceptions of ecosystem services (Kremen & Ostfeld, 2005), we
created our own items that stemmed from concepts in the literature. Gender,
race/ethnicity, highest level of completed education, and home zip code were also asked.
A comment box was included for participants to provide suggestions or recommendations
for greenway managers.
Refusal rates and reasons were recorded to calculate response rates and identify
potential sampling bias. We made an effort to collect at least 400 surveys at each location
to facilitate accurate inferences (+/- 5%) about the larger urban population of interest
(Vaske, 2008).
Data Analysis
Data (observations and surveys) were analyzed using various non-parametric
(e.g., Chi square tests) and parametric tests (e.g., t-tests, ANOVA) to compare the two
trails and examine factors associated with the primary outcome variables of interest:

41
greenway use, constraints to use, and perceived benefits. A principal component analysis
was used to reduce the benefits items into three broader categories: environmental,
experiential and cultural. Environmental benefits refer to the ecological benefits provided
by the greenway, including things such as air/water quality regulation and enhanced
storm water management. Experiential benefits are derived from use of the trail,
encompassing elements such as natural habitat, attractive scenery, and in the opportunity
for outdoor recreation participation. Cultural benefits are those directly involving people
and culture, such as the local economy, heritage and community connectivity. Distance
between ZIP Code and the nearest point on the greenway was measured using the Near
tool in ArcGIS.
Results
A total of 429 questionnaires were collected at the Leon Creek Greenway and 505
on the Eastside Trail, resulting in a 78% response rate on the Leon Creek Greenway and
65% on the Eastside Trail. There did not seem to be a high non-response bias in the
intercept survey sampling effort, yet there were some notable differences. Overall, we
observed higher proportions of White users, men, and walkers in the non-response
sample relative to greenway users who responded to the survey. Because each of these
groups was also well represented in our response set, coverage errors were not a major
concern.
Demographics of Sample

42
Table 2.2 illustrates the demographic characteristics of users on both trails using
both SOPARC observation and intercept survey data, with comparisons to general
population in both cities (Table 2.2). Both the SOPARC observations and intercept
surveys yielded similar demographic ratios, providing an acceptable measure of cross-
validation. On the Eastside Trail, the largest user groups were male (54%), adult (96%)
and White (71%). On the Leon Creek Greenway, the majority of observed users were
male (62%) and adult (92%). White and Hispanic/Latino users were equally represented
on the Leon Creek Greenway. In fact, the majority (52%) of users on the Leon Creek
Greenway were non-White. Though the Eastside Trail’s gender distribution is close to the
general population of Atlanta, females were underrepresented on the Leon Creek
Greenway. On both greenways, African American individuals were underrepresented
compared to the general population of their respective cities; for example, African
Americans represent the majority of residents in Atlanta (52.4%). While Latinos
accounted for 44% of observed users on the Leon Creek Greenway, they remained
underrepresented in a city with a Latino population of 63% of its residents. There were
few children or teenagers observed on either trail. The vast majority of users on each trail
held a college degree.
Self-reported demographic characteristics on the intercept surveys closely
matched observed demographic characteristics documented through the SOPARC
observations, enabling us to conclude that the intercept survey sample was representative
of the general population of trail users at both locations.

43
Table 2.2.
Demographic Characteristics of Greenway Users on the Eastside Trail (Atlanta) and Leon
Creek Greenway (San Antonio), Summer 2015
Eastside
Trail
(Urban)
Atlanta
Pop.a
Leon Creek
Greenway
(Suburban)
San
Antonio
Pop.a SOPARC
Obs. n=2,111
Intercept Surveys n=505
SOPARC Obs.
n=464
Intercept Surveys n=429
Gender
Female 46.2 47.1 50.5 38.4 37.1 51.1 Male 53.8 52.9 49.5 61.6 62.9 48.9
Age Group
Child (0-12) 3.0 0.0 18.7 5.8 0.0 26.3 Teen (13-17) 0.9 0.0 0.9 0.0 Adult (18+) 96.1 100.0 81.3 93.3 100.0 73.7
Race/Ethnicity
White/ Caucasian 71.2 67.7 36.4 47.6 44.3 26.3
Hispanic/ Latino 9.2 6.7 5.6 43.8 45.8 63.3
Black/Af. American 12.8 18.7 52.4 4.3 2.7 6.4
Asian 4.3 5.3 3.8 3.4 5.0 2.3 Other 2.5 1.6 1.8 0.9 2.2 1.7
Education
(highest level)
Some high school 1.4 8.3 2.0 9.5
High School or GED 5.7 19.7 17.8 25.5
Associate’s/ Bachelor’s 49.0 32.0 54.0 23.1
Master’s/ Doctorate 43.9 19.8 26.2 8.9
a Overall population estimates based on 2014 American Community Survey. Education estimates refer to the residents ages 25 and older.

44
Patterns of Greenway Use
Users on the Eastside Trail and Leon Creek Greenway were observed walking,
running, bicycling, and skating, and each trail had a unique distribution of activities
(Table 2.3). While walking was the most commonly observed activity on the Eastside
Trail, bicycling was most common on the Leon Creek Greenway. We observed a very
high density of users (168 users per 30 minutes) on the urban Eastside Trail.
Overall, 64% of Eastside Trail users lived less than 3 miles from the trail, 69%
travel to the trail by walking or bicycling, and the average user visited the trail 11 times
per month. Most users (56%) on the more suburban Leon Creek Greenway indicated the
trail was over 3 miles from their homes, making car travel the most popular mode of trail
access (78%). Users of the Leon Creek Greenway visited the trail, on average, 8 times per
month. Both greenways hosted users from all over their respective cities (Figures 2.3 &
2.4).

45
Table 2.3.
Use Patterns of Eastside Trail (Atlanta, Georgia) and Leon Creek Greenway (San
Antonio, Texas) Users
Eastside
(Urban)
Leon Creek
(Suburban) Difference
Tests
SOPARC Obs.
n=2,111
Intercept Surveysa
n=505
SOPARC Obs.
n=464
Intercept Surveysa
n=429 Activity
X2(3)=31.1 p<0.001
Walk 45.6 33.3 32.8 11.0 Run 18.4 16.6 22.8 36.0 Bicycle 34.2 23.8 43.8 35.2 Skate 1.8 1.2 0.6 0.2 Other/Multiple 25.1 17.7
Mean user density (per
30 minutes) 168.3 24.9 t(41)=7.028 p<0.001
Mean visits in last
month 10.56 8.35 t(921)=2.992 p<0.001
Destination1 X2(4)=283.3 p<0.001 No destination, just
recreation 85.9 95.1
Parks/Historic sites 26.0 3.3 Work/School 10.9 3.0 Restaurants/Stores 47.6 0.7 Other/Multiple 4.4 3.7
Median time spent on
trail (in hours) 1.5 1.25
Mode of access to trail X2(2)=189.7 p<0.001 Walk/Bicycle 69.3 24.6
Car 32.1 77.8 Public transportation 0.4 0.2
Distance from home to
trail (in miles)b
X2(2)=51.9 p<0.001
0-1 22.6 24.9 1-3 41.4 19.7 3+ 36.0 55.5
a Self-reported activities and destinations are not mutually exclusive b Based on centroid of home ZIP Code to nearest point on trail

46
Figure 2.3: Proportional Distribution of Visitors to Eastside Trail by ZIP Code

47
Figure 2.4: Proportional Distribution of Visitors to Leon Creek Greenway by ZIP Code

48
Motivations to Use Greenways and Importance of Trail Attributes
Because both greenways traversed diverse neighborhoods in distinct settings they
attracted diverse visitors with many different motivations (Figure 2.5). Though both
locations attracted users who were highly motivated to exercise (Eastside Trail: 90%,
Leon Creek: 96% Very/Extremely Important) and escape city life (Eastside Trail: 77%,
Leon Creek: 78% Very/Extremely Important), social motivations varied by trail. Eastside
Trail users were more motivated by spending time with family or friends (Eastside Trail:
73%, Leon Creek: 54% Very/Extremely Important) and using this urban greenway for
transportation (Eastside Trail: 52%, Leon Creek: 22% Very/Extremely Important) than
Leon Creek Greenway users. Along the more suburban Leon Creek Greenway,
discovering and experiencing nature was a more common reason for visiting than along
the urban Eastside Trail (Eastside Trail: 59%, Leon Creek: 68% Very/Extremely
Important).

49
Figure 2.5: Mean Importance of Different Motivations (with 95% CI error bars) for using
Eastside Trail (Atlanta, Georgia) and Leon Creek Greenway (San Antonio, Texas),
Summer 2015
Respondents were asked to rate the importance of particular attributes or aspects
of the trail (Figure 2.6). Overall, the most important factors to users of both trails were
“safety and security along the trail” (Eastside Trail: 88%, Leon Creek: 86%
Very/Extremely Important) and “condition and maintenance of trail” (Eastside Trail:
86%, Leon Creek: 89% Very/Extremely Important). The biggest differences between the
trails can be seen in the importance ratings of “connections to attractions and points of
interest” (Eastside Trail: 77%, Leon Creek: 35% Very/Extremely Important) and “places
1
1.5
2
2.5
3
3.5
4
4.5
5Im
po
rta
nc
e
Eastside Trail (Urban)
Leon Creek Greenway
(Suburban)

50
to sit and gather along the trail” (Eastside Trail: 52%, Leon Creek: 39% Very/Extremely
Important) where the Leon Creek Greenway rates lower than the Eastside Trail. The Leon
Creek Greenway users (84% Very/Extremely Important) also hold more value on natural
scenery than Eastside Trail users (75% Very/Extremely Important).
Figure 2.6: Mean Importance of Various Trail Attributes (with 95% CI error bars) for
Users on the Eastside Trail (Atlanta, Georgia) and Leon Creek Greenway (San Antonio,
Texas), Summer 2015
Constraints to Greenway Use
1
1.5
2
2.5
3
3.5
4
4.5
5
Imp
or
tan
ce
Eastside Trail (Urban)
Leon Creek Greenway
(Suburban)

51
Since users were able to use the trail at the time of the intercept survey,
constraints were assumed to be very low. The only constraint that was cited as even a
minor constraint (mean of 2.0 or higher) was lack of free time, while each of the other
constraints were rated as less than minor constraints. However, there were a few notable
differences between the greenways (Figure 2.7). Leon Creek Greenway Users were
significantly more constrained by lack of free time than Eastside Trail users, yet Eastside
Trail users were significantly more constrained by poor accessibility than Leon Creek
Greenway users. Fear of crime was rated slightly higher on the suburban Leon Creek
Greenway than the Eastside Trail.
Users of different ethnicities claimed certain constraints more than others. For
instance, users of other races feared crime significantly more than White or African
American users, F(3, 445)=5.331, p=0.001. Users of other races also claimed lack of
information about the greenways was a bigger constraint than White, Latino, and African
American users, F(3,446)=6.197, p<0.001.

52
Figure 2.7: Constraints to Using the Eastside Trail and Leon Creek Greenway (with 95%
CI error bars), Summer 2015
Perceived Benefits of Greenways
Overall, intercept survey participants recognized a number of benefits that both
greenways provide (Figure 2.8). Experiential and cultural benefits were more widely
recognized than environmental benefits on both trails. Differences between trails were
also observed, however. Environmental (Eastside Trail: 34%, Leon Creek: 45%
Agree/Strongly Agree) and experiential (Eastside Trail: 86%, Leon Creek: 96%
Agree/Strongly Agree) benefits were more frequently reported on the Leon Creek
Greenway than the Eastside Trail. Cultural benefits (Eastside Trail: 78%, Leon Creek:
1
1.5
2
2.5
3
3.5
4
4.5
5N
ot
a r
ea
so
n -
---
Min
or
re
as
on
---
Ma
jor
re
as
on
Eastside Trail (Urban)
Leon Creek Greenway
(Suburban)

53
53% Agree/Strongly Agree), on the other hand, were more frequently reported on the
Eastside Trail than the Leon Creek Greenway (Table 2.4).
Figure 2.8. Perceived Benefits of Using the Eastside Trail (Atlanta, Georgia) and Leon
Creek Greenway (San Antonio, Texas) (with 95% CI error bars), Summer 2015
Discussion
Results from this study highlight differences and similarities between an urban
and a suburban greenway trail based on patterns of use, users’ motivations to visit and
trail-based preferences, constraints to use, and perceptions of greenway-related benefits.
Although these two greenways are similar in many respects, our findings build upon
1
1.5
2
2.5
3
3.5
4
4.5
5
Environmental Cultural Experiential
Dis
ag
re
e -
----
----
----
----
----
---
Ag
re
e
Eastside Trail (Urban)
Leon Creek Greenway
(Suburban)

54
Shafer et al.’s (2000) Greenway Classification System to illustrate how both types of
greenways can play unique roles in their community.
Urban Greenway Characteristics: Eastside Trail (Atlanta, Georgia)
The Eastside Trail epitomized many characteristics of Gobster’s (1995)
classification of local greenway trails, where the majority of its users lived nearby,
accessed the trail by bicycle or foot, primarily walked and used the greenway for
transportation. The high density of trail users, easy access to the trail from high
population density residential areas (most users lived within 3 miles of the trail), and the
amount of shops and restaurants along this urban greenway likely made walking more
common than any other activity. This proximity to dense urban neighborhoods gives
Atlanta residents an opportunity to access the Eastside Trail easily on foot or by bicycle
and use the greenway for transportation, recreation and exercise. The design and location
of this urban greenway clearly improves the walkability of the community, which can
generate a number of benefits. Compared to less walkable communities, walkable
communities are known to increase residents’ physical activity levels, decrease body
mass index, reduce vehicle miles traveled, produce fewer grams of oxides of nitrogen
(NOx) and volatile organic compounds (VOC) emitted, and create a more healthy overall
living environment (Frank et al., 2006). The accessibility and connectivity of the Eastside
Trail may explain why users to be more motivated by spending time with family or
friends and using this urban greenway for transportation than Leon Creek Greenway
users, whose trail does not connect many points of interest. Cultural benefits were likely

55
rated higher on the Eastside Trail due to its location near the city’s central business
district, its connections to popular shops and restaurants, and the number of high-density
urban neighborhoods along the trail. Greenway use numbers, though more
racially/ethnically diverse than reported in previous urban greenway studies, did not
reflect the demographics of Atlanta as a whole, where the majority of the population is
African American (United States Census Bureau, 2010). The underrepresentation African
Americans on the trail was also notable because the trail passes byseveral high-density
African American neighborhoods.
Suburban Greenway Characteristics: Leon Creek Greenway (San Antonio, Texas)
Gobster’s (1995) regional or state greenways loosely describe the suburban Leon
Creek Greenway, which includes similarities such as the majority of users accessing the
greenway by car and bicycling as the primary activity on the trail. The high numbers of
bicyclists on the suburban Leon Creek Greenway could be a function of the lower density
of users along the trail, arguably making this suburban greenway one of the best places in
the city to ride a bicycle continuously separated from road traffic. As a result, the Leon
Creek greenway acted as a destination for recreation and exercise first and foremost,
more than other purposes. Because Leon Creek is primarily a recreation destination rather
than an integral part of the community’s transportation infrastructure (like the Eastside
Trail), users may visit Leon Creek Greenway less often. Access is also more challenging
– Leon Creek Greenway users, on average, travel over 3 miles to the greenway, a
majority of them access it using a car, supporting the notion that lack of transportation to

56
urban parks can be a major constraint to use (Scott & Munson, 1994). The Leon Creek
Greenway’s users may be more motivated by discovering and experiencing nature than
Eastside Trail users because of the wide creek-side flood plain and riparian vegetation
zone that runs along Leon Creek. Since the Leon Creek Greenway’s corridor (the green
space surrounding the trail) is much wider and natural than the Eastside Trail corridor, it
is not surprising that users were more likely to recognize the environmental benefits
associated with the Leon Creek Greenway. Because most of the experiential benefits
associated with greenway use were derived from contact with the natural world – a rarity
in cities - it makes sense that the Leon Creek Greenway ranked higher in that category as
well.
The finding that non-White users represented 52% of users on the Leon Creek
Greenway counters other published studies of urban greenway trails, which have
typically shown a heavy White majority among users(Furuseth & Altman, 1991; Lindsey,
1999; Moore, 1992; Reed, 2014). Along the Leon Creek Greenway, 44% of the users
were Hispanic/Latino. This may be partially due to the effects of acculturation on the
Latino population of San Antonio (Fernandez, Shinew, & Stodolska, 2015). Since almost
84% of the Hispanics in San Antonio were born in the United States (Yerardi, 2013), and
73% of San Antonio Hispanics racially identify themselves as White (U.S. Census
Bureau, 2010), these individuals may have become more acculturated in to White culture,
making their recreation patterns comparable to White residents. It is also important to
note that 75% of the Hispanic/Latino users on the Leon Creek Greenway held a college
degree (53% Associate’s or Bachelor’s degree, 22% Masters or Doctorate degree),

57
aligning with past research revealing higher educated individuals are more likely to use
greenways than less educated individuals (Furuseth & Altman, 1991; Reed, 2014; Wolch
et al., 2010). More research is needed to determine if and how the unprecedented
racial/ethnic distribution of greenway users in San Antonio would translate to other cities.
Major differences between the two trails are represented in the typology below
(Table 2.4). Based on results from the two cases we examined, this table represents an
effort to summarize some of the most important use characteristics of urban and suburban
greenways. It is important to note that large urban trail systems might include specific
greenway segments with a variety of different attributes and functions. An entire
greenway may not always be classified as urban or suburban alone, but sections of the
greenway may be. For example, the urban Eastside Trail is a section of the Atlanta
Beltline, which will eventually have other sections that will likely have characteristics of
suburban greenways. Sections of greenways also may not fall perfectly in to one of these
categories, as some may contain characteristics of both urban and suburban greenways.

58
Table 2.4
Greenway Use Classification Spectrum
Atlanta’s Eastside Trail
(Urban Greenway)
San Antonio’s Leon Creek
Greenway
(Suburban Greenway)
Context
High surrounding population density Connects many shops & restaurants Connects schools & businesses
Medium surrounding population density
Few connected destinations, primarily used for recreation or exercise
Use
Walking is most common activity High density of users Most users access by walking or
bicycling High visitation frequency Most users live within 3 miles away
Bicycling is most common activity Medium density of users Most users access by car High visitation frequency Most users live more than 3 miles
away
Motivations
Exercise Rest, relax & escape city life Spending time with family/friends
Exercise Rest, relax & escape city life Experience nature
Important
Factors
Safety and security Condition and maintenance of trail Connections to attractions/points of
interest
Safety and security Condition and maintenance of trail Natural scenery
Benefits
Outdoor recreation Cultural/economic Experience nature/aesthetics Community connectivity Cultural/historical significance
Outdoor recreation Experience nature/aesthetics Habitat for plants & animals Protect city air quality Economic
*Motivations, important factors and benefits are listed in order of priority, based on results
Similarities Between the Urban and Suburban Greenways
Despite a number of notable differences, the Eastside Trail and Leon Creek
Greenway share similar characteristics that define most urban and suburban greenways.
Users visited each trail frequently, ranging from a mean of 8 times per month on the Leon

59
Creek Greenway to a mean of 11 times per month on the Eastside Trail. These greenways
play an integral role in the lives of many of their users. The majority of users on each
greenway are traveling within 4 miles from their home, a consistent finding in other
greenway literature (Feeney, 1998; Furuseth & Altman, 1991; Gobster, 1995; Reed et al.,
2011). The motivations to visit the greenways were similar, in that the top two rated
motivations for each are “exercising and being physically active,” supporting Wolch et al.
(2010), and “resting, relaxing and escaping city life.” Safety and condition of the trail
were also both rated as the two most important factors to users of both greenways, a
finding that is also consistent with other studies on the topic (Gobster & Westphal, 2004).
Outdoor recreation opportunities were a shared top benefit by users of each greenway,
while experiencing nature was in the top three benefits for each, similar to greenways in
other studies (Shafer, Lee, et al., 2000). Overall, users of both greenways claimed higher
levels of experiential and cultural benefits than environmental benefits. Though the
context and placement of greenways plays a large role in function and use, different types
of greenways may ultimately generate the same general benefit for city residents:
enhanced quality of life.
Although Green Infrastructure is typically praised for its ability to deliver
valuable environmentally-based benefits (e.g., flood control, air quality protection,
wildlife/vegetation habitat) in dense urban areas (Benedict & McMahon, 2006), it also
seems like greenways, a key component of Green Infrastructure, have the opportunity to
deliver unique social and cultural benefits (e.g., connecting neighborhoods, economic
benefits) (Tzoulas et al., 2007). In a world with rapidly expanding urban populations

60
(United Nations, 2010), public support for Green Infrastructure will significantly impact
the health and sustainability of urban ecosystems. Understanding the benefits derived
from using greenways can also help managers facilitate benefits for their users (Allen,
1996; Allen & McGovern, 1997). Benefits derived from greenway use can play a role in
a “benefit chain of causality” (Driver, 2008), influencing other spheres of one’s life and
affecting the communities in which they live. Managers should specify the benefits they
would like their users to achieve through their experience on the greenway, and design
the space to encourage the experience of these benefits (Manning, 1998). While
greenways provide environmental benefits to their communities, realization of the critical
role greenways (and other green spaces) play in providing unique experiential and
cultural benefits for urban residents could produce more dynamic greenway systems that
serve many purposes in communities around the world. Whether they are generating
environmental, cultural, or experiential benefits, it seems that greenways can serve as a
conduit to community support (Nahlik et al., 2012). By helping to develop connections
between cities and nature, greenways provide a key mechanism that allows municipalities
to weave Green Infrastructure in to the environmental, economic, and social framework
of their city.
Another important and somewhat unexpected finding was the lack of children and
teenagers on each of the greenways. Overall, 93% of Leon Creek Greenway users and
96% of Eastside Trail users were adults. Other studies of greenways have revealed
similar results, with 75% or more of users in the adult age category (Coutts, 2009; Reed,
2014). With childhood obesity rates continuing to grow, it has become increasingly

61
important for children to participate in physically active lifestyles (Blanck et al., 2012;
"Childhood Obesity Facts," 2015). Outdoor recreation is one of the strongest correlate of
children’s physical activity (Sallis et al., 2006), and public green spaces (e.g., greenways)
can be valuable contexts for children to participate in physically-active outdoor recreation
(Maller, Townsend, Pryor, Brown, & St Leger, 2006). It is clear that greenways may not
be achieving their full potential on this front, and more should be done to help youth
utilize and connect with urban trails.
Several limitations should be acknowledged when evaluating implications of this
study. First, our description of the various greenway types was defined by the single
cases we sampled, and may not be generalizable to greenways in other cities. Both
greenways were also located in a different city, so differences between the urban
greenway in Atlanta and suburban greenway in San Antonio may be due to the city
context in which they are located and not differences inherent to each trail. Benefits were
self-reported (i.e., perceived), and may not represent actual benefits derived from the
trails. Additionally, our sampling approach did not cover the trail during all possible
periods of use (just randomly selected days during the summer season). It is likely that
greenway use in these southern cities would be even higher during cooler winter months.
At Leon Creek, llooding also affected our sampling calendar and limited our sampling
coverage in San Antonio, hindering our ability to make inferences based on smaller
subset of user observations. Finally, our study focused exclusively on users and we did
not contact non-users to understand their perceptions of these greenways. Assessment of

62
greenway-related attitudes and preferences among non-users living in greenway
proximate neighborhoods could help to tell a more complete story of the role of
greenways in urban settings (Ivy & Moore, 2007).
Conclusions
Greenways are popular amenities in cities around the world, and it is important to
understand the unique role they play in urban communities. Since they are so complex
with many variables affecting types of use and functions, careful attention is needed to
holistically understand the many different ways that people use and interact with both
urban and suburban greenways.
Our study supported a clear typology of trails based on a variety of attributes and
desired outcomes (Table 2.4). For instance, urban greenways may be used more often by
adjacent residents to support an active lifestyle while socializing and using the trail for
transportation. Suburban greenways serve the community as a more definitive recreation
destination, where users will come to experience nature while participating in more active
recreation such as bicycling. Though the suburban greenway in this study provided more
opportunity to experience the natural world, urban greenway users remained highly
motivated by escaping city life and still perceived some nature-based benefits from the
trail. This underscores the importance of preserving natural vegetation on both urban and
suburban trails whenever possible, in an effort to give city-dwellers the rare opportunity
to seek and experience solitude or respite from the city along greenway’s more natural
corridors. By providing this type of unique refuge in a concrete jungle, urban greenways

63
can provide a range of valuable ecosystems that positively impact public health (Jennings
et al., 2016).
To better serve communities, urban planners should consider the location of
proposed greenways and needs and expectations of local constituents (Shafer, Lee, et al.,
2000), not only an emphasis on more or longer trails (Gobster, 1995). When
municipalities or organizations begin to think about locations, goals, and outcomes for
their desired greenway trail, our typology should help to identify certain site selection
criteria that could help to maximize trail-related benefits for a diverse range of potential
users. Our Greenway Use Classification Spectrum (Table 4), derived from prominent
trails in two large U.S. cities, complements Shafer, Scott and Mixon’s (2000) initial
Greenway Classification System, offering more insight into the users, functions, and
attributes that define urban and suburban trails. Future research should sample more
greenways in more cities to compare findings and attempt to better understand use
patterns and user characteristics across different types of greenways (e.g., urban,
suburban, rural). Perceptions of non-users, and especially greenway-proximate residents
who might not use the trails, could also be more explicitly integrated into planning and
management frameworks to better understand the broader impacts that greenways have
on entire communities. As the study or urban greenways progresses, planners and park
managers can use various typologies to better inform greenway development and
improve quality of life across diverse urban neighborhoods.

64
References
Benedict, M. A., & McMahon, E. T. (2006). Green infrastructure: linking landscapes
and communities: Island Press. Bocarro, J. N., Floyd, M., Moore, R., Baran, P., Danninger, T., Smith, W., & Cosco, N.
(2009). Adaptation of the System for Observing Physical Activity and Recreation in Communities (SOPARC) to assess age groupings of children. Journal of
Physical Activity & Health, 6(6), 699-707. Boyd, J., & Banzhaf, S. (2007). What are ecosystem services? The need for standardized
environmental accounting units. Ecological Economics, 63(2), 616-626. Chiesura, A. (2004). The role of urban parks for the sustainable city. Landscape and
Urban Planning, 68(1), 129-138. Chon, J., & Shafer, C. S. (2009). Aesthetic responses to urban greenway trail
environments. Landscape Research, 34(1), 83-104. Clark, R. N., & Stankey, G. H. (1979). The Recreation Opportunity. Coutts, C. J., & Miles, R. (2011). Greenways as green magnets: The relationship between
the race of greenway users and race in proximal neighborhoods. Fabos, J. G. (2004). Greenway planning in the United States: its origins and recent case
studies. Landscape and Urban Planning, 68(2), 321-342. Feeney, S. J. (1998). The Mohawk-Hudson Bike-Hike Trail: Analysis of Trail Use,
Regional Benefits & Economic Impact. Retrieved June, 11, 2009. Furuseth, O. J., & Altman, R. E. (1991). Who's on the greenway: Socioeconomic,
demographic, and locational characteristics of greenway users. Environmental
Management, 15(3), 329-336. Gobster, P. H. (1995). Perception and use of a metropolitan greenway system for
recreation. Landscape and Urban Planning, 33(1), 401-413. Gobster, P. H. (1998). Urban parks as green walls or green magnets? Interracial relations
in neighborhood boundary parks. Landscape and Urban Planning, 41(1), 43-55. Gobster, P. H., & Westphal, L. M. (2004). The human dimensions of urban greenways:
planning for recreation and related experiences. Landscape and Urban Planning,
68(2), 147-165. Harnik, P., & Welle, B. (2011). From Fitness Zones to the Medical Mile: How Urban
Park Systems Can Best Promote Health and Wellness. Retrieved from Jennings, V., Larson, L., & Yun, J. (2016). Advancing Sustainability through Urban
Green Space: Cultural Ecosystem Services, Equity, and Social Determinants of Health. International journal of environmental research and public health, 13(2), 196.
Kazmierczak, A., & James, P. (2007). The role of urban green spaces in improving social inclusion.
Landers, D. H., & Nahlik, A. M. (2013). Final ecosystem goods and services classification system (FEGS-CS) EPA United States Environmental Protection
Agency. Report number EPA/600/R-13/ORD-004914. Larson, L. R., Jennings, V., & Cloutier, S. A. (in press). Public parks and wellbeing in
urban areas of the United States. PLOS ONE.

65
Librett, J. J., Yore, M. M., & Schmid, T. L. (2006). Characteristics of physical activity levels among trail users in a US national sample. American journal of preventive
medicine, 31(5), 399-405. Lindsey, G. (1999). Use of urban greenways: insights from Indianapolis. Landscape and
Urban Planning, 45(2), 145-157. Lindsey, G., Han, Y., Wilson, J., & Yang, J. (2006). Neighborhood correlates of urban
trail use. Journal of Physical Activity & Health, 3, S139. McKenzie, T. L., Cohen, D. A., Sehgal, A., Williamson, S., & Golinelli, D. (2006).
System for Observing Play and Recreation in Communities (SOPARC): reliability and feasibility measures. Journal of Physical Activity & Health, 3, S208.
Moore, R. L. (1992). The impacts of rail-trails: A study of the users and property owners
from three trails: United States Govt Printing Office. Palau, R., Forgas, S., Blasco, D., & Ferrer, B. (2012). An Analysis of Greenways from an
Economic Perspective. Tourism Planning & Development, 9(1), 15-24. Parra, D. C., McKenzie, T. L., Ribeiro, I. C., Hino, A. A. F., Dreisinger, M., Coniglio, K.,
. . . Hoehner, C. M. (2010). Assessing physical activity in public parks in Brazil using systematic observation. American journal of public health, 100(8), 1420.
Reed, J. A. (2014). Greenville Health System Swamp Rabbit Trail: Year 3 Findings. Retrieved from Greenville, SC:
Reed, J. A., Arant, C., Wells, P., Stevens, K., Hagen, S., & Harring, H. (2008). A descriptive examination of the most frequently used activity settings in 25 community parks using direct observation. Journal of Physical Activity & Health,
5, S183. Reed, J. A., Hooker, S. P., Muthukrishnan, S., & Hutto, B. (2011). User demographics
and physical activity behaviors on a newly constructed urban rail/trail conversion. Journal of Physical Activity and Health, 8(4), 534.
Scott, D., & Munson, W. (1994). Perceived Constraints to Park Usage. Journal of Park
and Recreation Administration. Shafer, C. S., Lee, B. K., & Turner, S. (2000). A tale of three greenway trails: user
perceptions related to quality of life. Landscape and Urban Planning, 49(3), 163-178.
Shafer, C. S., Scott, D., & Mixon, J. (2000). A greenway classification system: Defining the function and character of greenways in urban areas. Journal of Park and
Recreation Administration, 18(2). Solecki, W. D., & Welch, J. M. (1995). Urban parks: green spaces or green walls?
Landscape and Urban Planning, 32(2), 93-106. Swanwick, C., Dunnett, N., & Woolley, H. (2003). Nature, role and value of green space
in towns and cities: An overview. Built Environment, 29(2), 94-106. Troped, P. J., Whitcomb, H. A., Hutto, B., Reed, J. A., & Hooker, S. P. (2009).
Reliability of a brief intercept survey for trail use behaviors. Journal of Physical
Activity & Health, 6(6), 775. United States Census Bureau / American FactFinder. “DP05 : ACS Demographic and
Housing Estimates.” 2010 – 2014 American Community Survey. U.S. Census

66
Bureau’s American Community Survey Office, 2011. Web. 1 April 2016 <http://factfinder.census.gov>.
Vaske, J. J. (2008). Survey research and analysis: Applications in parks, recreation and
human dimensions: Venture Publishing State College, PA. Walmsley, A. (2006). Greenways: multiplying and diversifying in the 21st century.
Landscape and Urban Planning, 76(1), 252-290. Whiting, J. W., Larson, L. R., & Green, G. T. (2012). Monitoring visitation in Georgia
state parks using the System for Observing Play and Recreation in Communities (SOPARC). Journal of Park and Recreation Administration, 30(4), 21-37.
Wolch, J. R., Tatalovich, Z., Spruijt-Metz, D., Byrne, J., Jerrett, M., Chou, C.-P., . . . Reynolds, K. (2010). Proximity and perceived safety as determinants of urban trail use: findings from a three-city study. Environment and planning. A, 42(1), 57.

67
CHAPTER 3
ECOSYSTEM SERVICES AND URBAN GREENWAYS:
WHAT’S THE PUBLIC’S PERSPECTIVE?
Introduction
The concept of ecosystem services (ES) has been proposed and widely adopted as
a framework for understanding and evaluating the direct and indirect contributions of
ecosystems to human well-being (Braat & de Groot, 2012). These services are most
commonly grouped into several key categories that include provisioning services (e.g.,
food, fresh water, biomass), regulating services (e.g., climate and air regulation, water
purification, flood control), supporting services (e.g., nutrient cycling, soil formation,
photosynthesis) and cultural services (e.g., aesthetic and recreational experiences)
(Millenium Ecosystem Assessment, 2005; TEEB, 2010). Although ES is useful for
understanding the “value” of nature, there is a major disconnect between the services
frequently defined and measured by scientists and those that may be realized and
appreciated by the general public (Nahlik et al., 2012). This gap suggests there is a
growing need for research that explicitly considers ES as components of nature that are
directly enjoyed, consumed, or used to yield human well-being (Boyd & Banzhaf, 2007;
Landers & Nahlik, 2013). Such an approach requires an enhanced understanding of
public perspectives regarding benefits provided by nature, particularly in urban settings.
Over one half of the world’s people currently live in cities, and that ratio is
rapidly increasing (United Nations, 2010). As urban populations grow, it becomes

68
increasingly important to understand ES derived from cities and the ways in which these
services affect the well-being of urban residents. Scholars have recently synthesized a
wide, interdisciplinary body of literature investigating the range of services provided by
urban ecosystems (Gomez-Baggethun et al., 2013; Haase, Larondelle, Andersson,
Artmann, Borgstrom, et al., 2014). Most studies examining the value of urban ecosystems
have centered on measuring and quantifying biophysical attributes that yield material
benefits (Haase, Larondelle, Andersson, Artmann, Borgstrom, et al., 2014). Though
provisioning, regulating, and supporting services are undoubtedly important in urban
areas, they generally fail to account for non-material benefits that people obtain from
direct experience with and appreciation of natural settings (e.g., recreation and aesthetic
appreciation). In fact, the non-material benefits associated with cultural ecosystem
services may be among the most valuable contributions that urban green space has to
offer (Chiesura, 2004; Gobster, Nassauer, Daniel, & Fry, 2007).
For instance, many studies have shown that proximity to and use of parks is
positively associated with physical activity levels and cardiovascular health of urban
residents (Cohen et al., 2007; Godbey & Mowen, 2010). Other research has revealed the
complex ways that connecting with nature and urban green space affects different aspects
of well-being including mental and emotional health (Mitchell & Popham, 2008; Russell
et al., 2013; White, Alcock, Wheeler, & Depledge, 2013), cognitive functioning (Bratman
et al., 2012), expression of cultural values (Clark et al., 2014), and community attachment
(Arneberger & Eder, 2012). Concern about distributional equity of urban green space also
raises doubt about the realization of cultural ES service benefits in certain parts of cities –
69
particularly low-income and racial/ethnic minority neighborhoods (Dai, 2011; Kabisch &
Haase, 2014; Low, 2013). Such concerns must be answered before policy-makers can
effectively integrate well-being and ES principles to make equitable and informed
management decisions that reflect the interests and needs of diverse residents.
Despite the importance of cultural services in urban areas, they remain poorly
integrated into conventional ES frameworks (Daniel et al., 2012; Gomez-Baggethun et
al., 2013). Challenges to integration include intangible impacts that are difficult to
specify, subjective outcomes that conflict with conventional market-oriented valuation
strategies, and variations in utility associated with different cultural and geographical
contexts (Chan et al., 2012; Daniel et al., 2012; de Groot, Alkemade, Braat, Hein, &
Willemen, 2010). Our study will attempt to address a growing need to define and
operationalize cultural services provided by urban ecosystems and directly link those
services to key domains of human health and well-being.
To better understand the specific contributions of ES to human well-being in
urban areas, we will focus on one particular amenity that has become increasingly
prominent in many city landscapes: urban greenways. Greenways are unique among all
types of urban green space because of their linear, connective, and activity-promoting
nature. As a result, they may also have a unique capacity to provide a diverse array of
benefits (i.e., ecosystem services) to urban residents. These diverse benefits have
propelled greenway implementation into one of the fastest urban planning and design
movements in the United States (Fabos, 2004). In addition to providing corridors of
natural vegetation that affect wildlife habitat, air quality, water quality, urban flood

70
mitigation, and a variety of other supporting and regulatory ES in cities (Benedict &
McMahon, 2006), greenways also serve an epicenter for cultural services. They often
connect parks, neighborhoods, communities, businesses, and other public spaces,
providing bicycle/ pedestrian access options for the user. Greenways also enhance quality
of life through active outdoor recreation (Shafer, Lee, et al., 2000), which can positively
impact well-being (Chiesura, 2004), contribute to health and wellness (Harnik & Welle,
2011), increase social interaction and inclusion (Kazmierczak & James, 2007), foster
alternative transportation opportunities (Shafer, Lee, et al., 2000), and encourage human-
nature interactions (Chon & Shafer, 2009; Gobster, 1995). A key question then becomes:
which of these services are most valuable, and to whom? This question has typically been
addressed through an economic lens, reducing services to environmental accounting units
(Boyd & Banzhaf, 2007), or an ecological lens, which focuses primarily on broader
ecological structure and functions (Elmqvist et al. 2015). However, when utilized as a
recreation destination or social gathering space, urban amenities such as greenways
become a cultural hub – a place where city dwellers have a rare opportunity to experience
nature (Shafer, Lee, et al., 2000). It is this aspect of greenways, which centers on cultural
ES, that may be critically important to urban residents; yet it is this aspect that is often
overlooked or underestimated in conventional ES frameworks (Baur, Tynon, Ries, &
Rosenberger, 2016; Daniel et al. 2012; Chan et al. 2012).
Understanding if and how people perceive the benefits associated with urban
greenways is a critical step in urban park planning and management. Enhanced
knowledge of these diverse benefits could help to garner support from community

71
stakeholders and enable park and greenway managers to better meet the needs of their
constituents. Our study investigated public perceptions of ecosystem services associated
with urban greenways. Specifically, we examined users’ perceptions of greenway-related
benefits on two urban trails: the Eastside Trail of the rapidly expanding Atlanta Beltline
(in Atlanta, GA), and the Leon Creek Greenway, a segment of the larger Howard W.
Peak Greenway Trails System (in San Antonio, TX). The purpose of our study was to (1)
identify different categories of ecosystem services (or benefits) recognized by greenway
users, (2) compare the relative value of the ES on both trails, and (3) identify other
factors that might influence greenway users’ perceptions of ES.
Methods
Study Sites
The two greenways selected for this study were the Eastside Trail in Atlanta,
Georgia and the Leon Creek Greenway in San Antonio, Texas. These greenways were
selected due to their location in large, diverse cities. Construction began on the Leon
Creek Greenway in 2009, while ground was broken for the Eastside Trail in 2010. Both
greenways are part of larger systems that are under construction and there are master
plans in place for the future of the two greenways. The Leon Creek Greenway includes
13.5 miles of paved trail in the suburbs of San Antonio, while the Eastside Trail’s 2.25
miles of paved trail can be found near downtown Atlanta. The physical differences
between the two greenways’ surrounding corridor are noteworthy, as they may play a role
in the users’ perceptions of ecosystem services. The Eastside Trail (Figure 3.1) has a high

72
adjacent population density, connecting many restaurants, stores, and residential areas,
with a narrow greenway corridor encompassing few recently planted trees and limited
green space. The Leon Creek Greenway’s corridor (Figure 3.2), on the other hand,
includes dense riparian greenery along a creek-side flood plain, with limited development
at access points.
Figure 3.1. Eastside Trail (Atlanta, Georgia)

73
Figure 3.2. Leon Creek Greenway (San Antonio, Texas)
Data Collection
Intercept surveys of greenway users were conducted at key access points
(identified by greenway managers) along each greenway during May to August 2015.
This method has produced reliable and valid data on other trail-based studies (Troped et
al., 2009). Survey data sampling was scheduled to ensure adequate temporal coverage.
Previous greenway user surveys were used to inform data collection protocols and
instrument design (Gobster, 1995; Reed, 2014).

74
To recruit participants, we held up the survey attached to a clipboard to capture
users’ attention from a distance, giving them time to slow down and stop. Cool water and
shade were offered or already in place as an incentive to pause and fill out the
questionnaire. Every Leon Creek Greenway user age 18 years or older who passed a
sampling location was approached and asked if he/she would be willing to participate in a
brief survey about greenway use. However, due to the high volume of users on the
Eastside Trail (where it was not feasible to sample every user), systematic random
sampling was used where we approached every kth visitor, depending on the user density
at the time. Upon consent, trail users were given one of two survey versions; only the
second version contained items related to perceived benefits (analyses for this particular
variable, the focus of this study, was therefore based on approximately 50% of the
sample). On the survey instrument, participants answered questions about demographic
information, greenway use (e.g., frequency, intensity, activity type and purpose),
greenway access (e.g., distance traveled), and perceived benefits associated with
greenways (e.g., experiential, cultural, and environmental benefits). A comment box was
also included for participants to provide suggestions or recommendations for greenway
managers. The participants were asked to rate perceived benefits associated with
greenways on a scale from 1 to 5, with 1 representing “Strongly Disagree” and 5
representing “Strongly Agree.” Because the ES literature has little to say about public
perceptions of ecosystem services (Baur, Tynon, Ries, & Rosenberger, 2016; Kremen &
Ostfeld, 2005), we could not find an existing scale to suit our research context. We
therefore developed a concise set of items based on key urban ecosystem services

75
identified in previous studies (Brown & Raymond, 2007; Crossman et al., 2013; Haase,
Larondelle, Andersson, Artmann, Borgstrom, et al., 2014; Kremen & Ostfeld, 2005). We
made an attempt to ensure that both environmentally-oriented and culturally-oriented ES
benefits were represented, with more items focused on the historically understudied
cultural services that might be particularly relevant in a greenway context.
Refusal rates and reasons were recorded to calculate response rates and identify
potential sampling bias. We made an effort to collect at least 400 surveys at each location
to facilitate accurate inferences (+/- 5%) about the larger urban population of interest
(Vaske, 2008).
Data Analysis
An exploratory principal component analysis using the pooled sample of
respondents was conducted to identify broader categories of urban ecosystem services
based on the benefits items. Data were then analyzed using various non- parametric (e.g.,
Chi square tests) and general linear modeling approaches (e.g., ANOVA) to examine
factors associated with the primary outcome variable of interest: perceived benefits of
greenways (for example ANOVA, see Table 3.1). The independent variables were trail,
distance from home to trail race, gender, and activity type because these variables were
all hypothesized to be potential correlates of perceived benefits of greenways. Distance
between respondents’ home ZIP Code and the nearest point on the greenway was
measured using the Near tool in ArcGIS.

76
Table 3.1.
Example ANOVA Examining Main Correlates of Perceived Environmental Benefits of
Users on Eastside Trail (Atlanta, Georgia) and Leon Creek Greenway (San Antonio,
Texas)
Source df Type III SS F p η2 Intercept 1 3219.58 5219.85 0.000 0.928 Trail 1 3.26 5.28 0.022 0.013 Distance 2 0.96 0.779 0.460 0.004 Gender 1 0.57 0.925 0.337 0.002 Race 3 1.72 0.932 0.425 0.007 Activity 3 1.74 0.938 0.422 0.007 Error 406 250.42 Total 417 5879.64 Note: Scores were measured on a five-point Likert-type scale where “five” indicated higher levels of the construct.
Results
A total of 429 questionnaires were collected at the Leon Creek Greenway and 505
on the Eastside Trail, resulting in a 78% response rate on the Leon Creek Greenway and
65% on the Eastside Trail. Because we employed two survey versions with slightly
different content, our effective sample size for the perceived benefit items was 252 on the
Eastside Trail and 208 on the Leon Creek Greenway. There did not seem to be a high
non-response bias, yet there were some slight differences. Overall, White users, men, and
walkers were less likely to participate in the intercept surveys, while other groups
responded proportionally well.
Description of Sample

77
On the Eastside Trail, the largest user groups were female (51%) and White
(68%). On the Leon Creek Greenway, the majority of users were male (62%) and adult
(92%). White (42%) and Hispanic/Latino (46%) users were represented on the Leon
Creek Greenway almost equally. In fact, the majority (58%) of the Leon Creek Greenway
participants were non-White. There were hardly any children or teenagers observed on
each trail. The vast majority of users on each trail held a college degree. Overall, 64% of
Eastside Trail users lived less than 3 miles from the trail, while 54% of Leon Creek
Greenway users lived over 3 miles from their home.
Exploratory Principal Component Analysis
The exploratory principal components analysis resulted in three categories of
benefits of ES (Table 3.2). Factor one had an eigenvalue of 4.45 (44.5% of the variance),
factor two had an eigenvalue of 1.312 (13.1% of the variance), and factor three had an
eigenvalue of 1.032 (10.3% of the variance); rotations converged in four iterations. We
named the three categories environmental, cultural, and experiential benefits based on the
common themes underlying the items within the categories. After rotating the factors,
three items loaded strongly (≥0.5) on the environmental benefit factor, three items loaded
strongly (≥0.5) on the cultural benefits factor, and four items loaded strongly (≥0.5) on
the experiential benefits factor. Environmental benefits refer to the ecological benefits
provided by the greenway, including things such as air/water quality regulation and
enhanced storm water management. They are analogous to regulatory/maintenance ES.
Cultural benefits are those directly involving people and culture, such as the local

78
economy, heritage and community connectivity. They are analogous to cultural ES.
Experiential benefits are derived from use of the trail, encompassing elements relating to
the natural setting such as natural habitat, attractive scenery, and the opportunity for
outdoor recreation participation. There is currently no analog to experiential benefits in
conventional ES frameworks. Some view these benefits as intermediate services or the
human capital investment needed to generate final ecosystem services (Boyd & Banzhaf,
2007) though many scholars lump the social benefits into the cultural ES category.
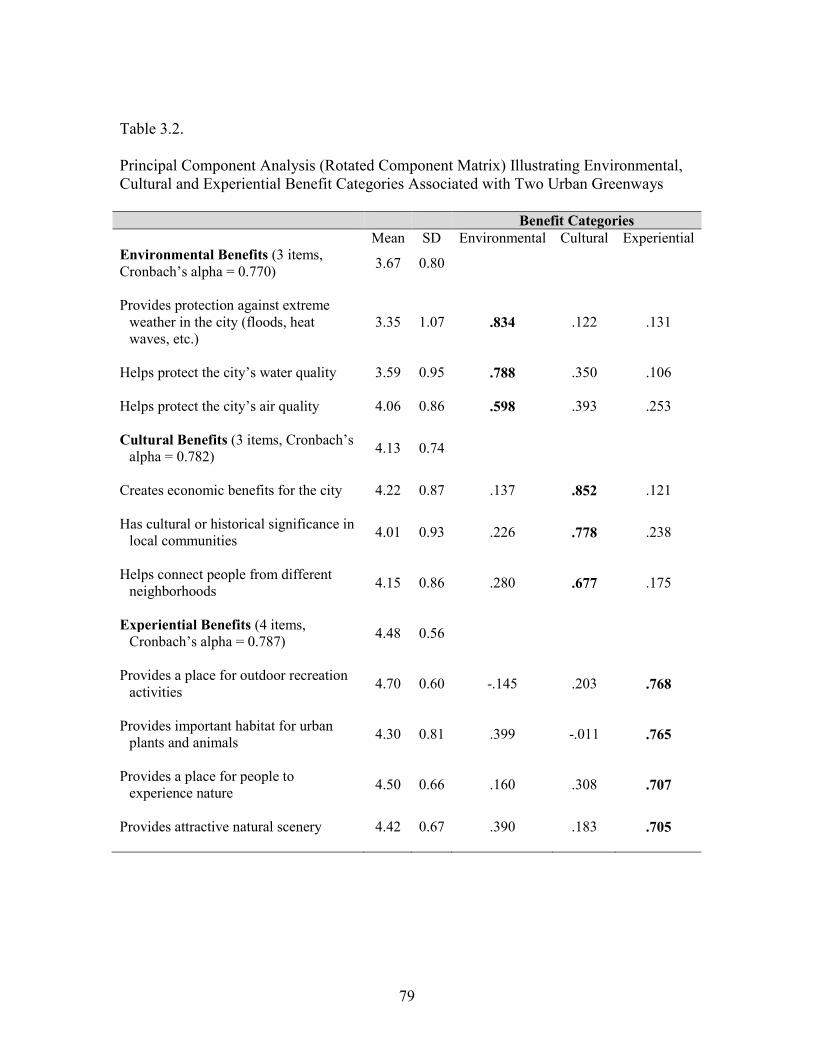
79
Table 3.2.
Principal Component Analysis (Rotated Component Matrix) Illustrating Environmental, Cultural and Experiential Benefit Categories Associated with Two Urban Greenways
Benefit Categories
Mean SD Environmental Cultural Experiential Environmental Benefits (3 items, Cronbach’s alpha = 0.770) 3.67 0.80
Provides protection against extreme weather in the city (floods, heat waves, etc.)
3.35 1.07 .834 .122 .131
Helps protect the city’s water quality 3.59 0.95 .788 .350 .106
Helps protect the city’s air quality 4.06 0.86 .598 .393 .253
Cultural Benefits (3 items, Cronbach’s alpha = 0.782) 4.13 0.74
Creates economic benefits for the city 4.22 0.87 .137 .852 .121
Has cultural or historical significance in local communities 4.01 0.93 .226 .778 .238
Helps connect people from different neighborhoods 4.15 0.86 .280 .677 .175
Experiential Benefits (4 items, Cronbach’s alpha = 0.787) 4.48 0.56
Provides a place for outdoor recreation activities 4.70 0.60 -.145 .203 .768
Provides important habitat for urban plants and animals 4.30 0.81 .399 -.011 .765
Provides a place for people to experience nature 4.50 0.66 .160 .308 .707
Provides attractive natural scenery 4.42 0.67 .390 .183 .705

80
Perceived Benefits of Greenways
Overall, intercept survey respondents recognized a number of benefits (or ES)
provided by both greenways. Experiential and cultural benefits were more widely
recognized than environmental benefits on both trails. The following sections explore
greenways users’ perceptions of the different benefit categories and the factors associated
with those perceptions.
Environmental benefits
Overall, environmental benefits represented the lowest perceived benefit out of
the three categories. Eastside Trail users perceived significantly less environmental
benefits than Leon Creek Greenway users, F(1,406)=5.280, p=0.022 (Figure 3.3). There
were no significant differences in perceptions of environmental benefits between activity
types, F(3,406)=0.938, p=0.422. Therefore, walkers, runners, bicyclists, and other users
held the same level of agreement regarding environmental benefits. Males and females
also held similar perceptions of environmental benefits, F(1,406)=0.925, p=0.337. White,
Hispanic/Latino, African American and users of other races held no differences in
perceptions of environmental benefits, F(3,406)=0.932, p=0.425, (Figure 3.4). There
were also no significant differences between users living different distances from the
greenway (Figure 3.5), F(2,406)=0.779, p=0.460.

81
Figure 3.3. Perceptions of different categories of greenway-related benefits (or ecosystem
services) among users on two urban trails, the Atlanta Beltline (in Atlanta, GA) and the
Leon Creek Greenway (in San Antonio, TX), in summer 2015. Mean responses based on
scale from 1 to 5, with 1 representing “Strongly Disagree” and 5 representing “Strongly
Agree”, with error bars representing 95% confidence intervals.
1
1.5
2
2.5
3
3.5
4
4.5
5
Leon Creek Greenway (Suburban) Eastside Trail (Urban)
Environmental
Cultural
Experiential
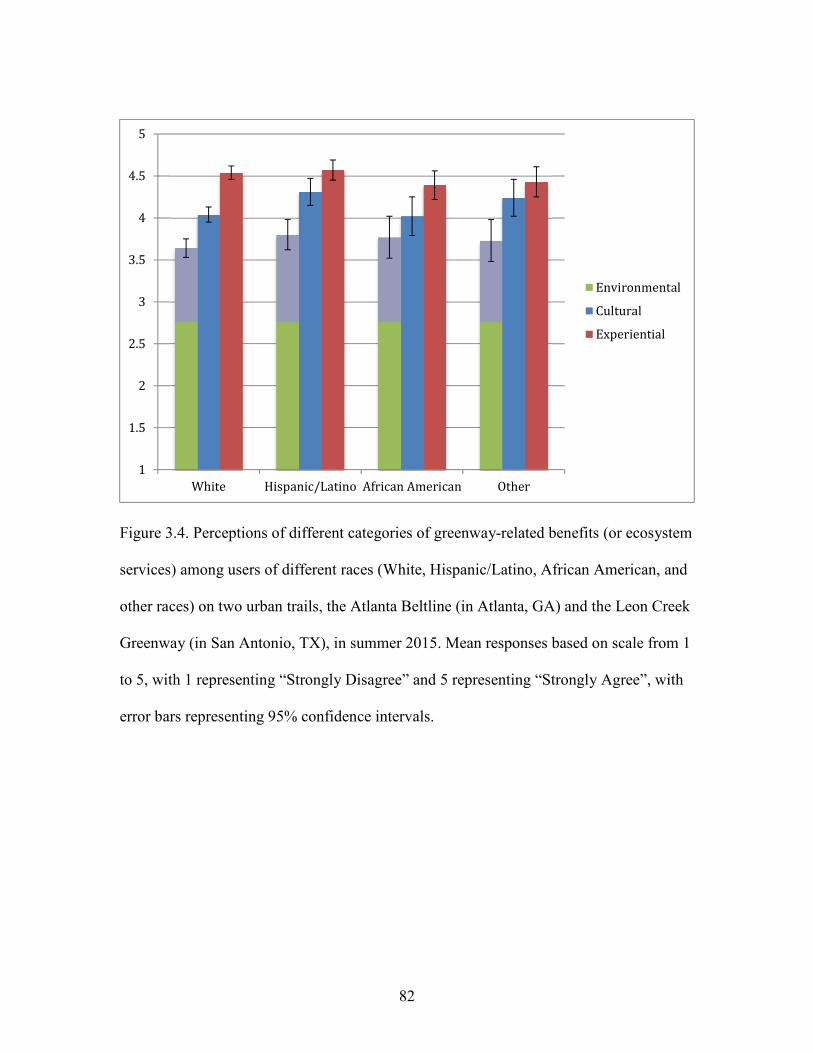
82
Figure 3.4. Perceptions of different categories of greenway-related benefits (or ecosystem
services) among users of different races (White, Hispanic/Latino, African American, and
other races) on two urban trails, the Atlanta Beltline (in Atlanta, GA) and the Leon Creek
Greenway (in San Antonio, TX), in summer 2015. Mean responses based on scale from 1
to 5, with 1 representing “Strongly Disagree” and 5 representing “Strongly Agree”, with
error bars representing 95% confidence intervals.
1
1.5
2
2.5
3
3.5
4
4.5
5
White Hispanic/Latino African American Other
Environmental
Cultural
Experiential

83
Figure 3.5. Perceptions of different categories of greenway-related benefits (or ecosystem
services) among users traveling different distances from their home to two urban trails,
the Atlanta Beltline (in Atlanta, GA) and the Leon Creek Greenway (in San Antonio,
TX), in summer 2015. Mean responses based on scale from 1 to 5, with 1 representing
“Strongly Disagree” and 5 representing “Strongly Agree”, with error bars representing
95% confidence intervals.
Cultural benefits
The Eastside Trail users were significantly more likely to recognize cultural
benefits associated with the Eastside Trail than the users of the Leon Creek Greenway
were, F(1,406)=27.728, p<0.001 (Figure 3.3). There were no differences in perceptions
1
1.5
2
2.5
3
3.5
4
4.5
5
0-1 mile 1-3 miles 3+ miles
Environmental
Cultural
Experiential

84
of cultural benefits among the different activities, F(3,406)=1.189, p=0.314. Significant
differences were not present between genders in relation to perceptions of cultural
benefits, F(1,406)=0.010, p=0.919,. Hispanic/Latino users were more likely to perceive
cultural benefits than White users, F(3,406)=2.948, p=0.033, (Figure 3.4). Users
travelling more than three miles from their home to the greenway perceived significantly
less cultural benefits than users living less than three miles away, F(2,406)=5.371,
p=0.005 (Figure 3.5).
Experiential benefits
Leon Creek Greenway users perceived significantly more experiential benefits
than Eastside Trail users, F(1,406)=9.497, p=0.002 (Figure 3.3).There were no significant
differences between activity types, F(3,406)=0.565, p=0.638, or gender, F(1,406)=1.380,
p=0.241, in relation to their perceptions of experiential benefits. Users of different races
did not perceive experiential benefits differently, F(3,406)=1.486, p=0.218 (Figure 3.4).
Finally, there were also no differences in experiential benefit ratings among users
travelling different distances to reach the trail, F(2,406)=2.923, p=0.055 (Figure 3.5).
Discussion
Our findings support earlier assertions that greenways provide a number of
diverse benefits to urban residents (Gobster, 1995; Shafer, Lee, et al., 2000). Results also
support the limited body of previous research (e.g., Baur et al. 2016) that suggests the
general public may recognize many of the broader benefits (i.e., ecosystem services)

85
associated with urban green space. However, the different categories of benefits were
realized to varying degrees. Experiential benefits may be the most important to greenway
users regardless of trail type, likely due to these benefits having a direct, tangible impact
on the user, such as reduction of stress (Thompson et al., 2012) and physical health
(Godbey & Mowen, 2010). Cultural benefits were perceived as equally important to
experiential benefits on the urban Eastside Trail, but were of less importance and almost
equivalent to perceived environmental benefits on the Leon Creek Greenway.
Environmental benefits were recognized on both trails, but typically not to the same
degree as experiential and cultural benefits, overall. Environmental benefits are the only
set of benefits that were not directly experienced by greenway users (e.g., greenway users
do not get to experience, or witness, the city’s air quality being protected through time
spent on one of these greenways). Therefore, this could play a role in determining the
participants’ lower recognition or acknowledgement of environmental benefits, though
they were still highly regarded. Other research on public perceptions of urban ecosystem
services has reached different conclusion, citing higher support for factors like watershed
and ecological health than factors such as recreation and aesthetics (Baur et al. 2016).
This research, however, was conducted near urban forests in Oregon, a context that
differs drastically from the recreation-oriented setting of urban greenways in southeastern
states. Variation in public perceptions of ES might therefore be expected. As Fisher et al.
(2009) note, assessments of ES depend on of which service is being valued and who is
doing the valuing; different individuals will obtain different benefits from the same
ecosystem processes depending on their perspective.

86
The Leon Creek Greenway’s surrounding corridor that encompasses a creek-side
flood plain consisting of dense foliage likely influenced its users to perceive more
environmental benefits than Eastside Trail users, whose trail has a very narrow corridor
with building developments surrounding it. Leon Creek Greenway users also perceived
significantly more experiential benefits than Eastside Trail users, again likely due to the
Leon Creek Greenway traversing through a much more natural, wooded greenway
corridor than the Eastside Trail. The natural world has been shown to have positive
impacts on the health and welfare of those interacting with nature (Bratman et al., 2012;
Hartig, Mitchell, De Vries, & Frumkin, 2014; Jennings et al., 2016). The Eastside Trail
users were significantly more likely to recognize cultural benefits than the users of the
Leon Creek Greenway. The Eastside Trail’s location near downtown Atlanta, connecting
many residential areas, restaurants and stores may have enabled its users to perceive more
cultural benefits than the Leon Creek Greenway, which is located in the suburbs without
much development (e.g., restaurants, shops, residential areas) surrounding it. These
cultural benefits can play a role in the social inclusion of a community in a variety of
nature contexts (Zelenski, Dopko, & Capaldi, 2015). Based on this evidence, it seems as
if the location of each greenway, whether suburban or urban, plays a great role in
determining perceived benefits or ES associated with the resource (Gobster, 1995;
Shafer, Lee, et al., 2000; Shafer, Scott, & Mixon, 2000).
Some of the greenway-related benefits were recognized to different degrees
within particular user groups. The finding that White users held significantly lower
perceptions of cultural benefits than Hispanic/Latino users supports the results of

87
previous studies suggesting Latinos place greater value on spending leisure time in the
outdoors socializing with larger groups (Chavez, 2008; Shinew et al., 2004). However,
this finding may also be an unintended artifact of Latino respondents’ propensity to
report higher scores on Likert-type scales (Warnecke et al., 1997). The finding that users
of different races did not perceive any differences between environmental and
experiential benefits contrasts with findings from other studies about differences in
outdoor recreation behavior, specifically regarding African Americans’ low participation
rates (Floyd, Shinew, McGuire, & Noe, 1994; Gobster, 2002; Ho et al, 2005; Payne,
Mowen, & Orsega-Smith, 2002; Shinew, Floyd, & Parry, 2004).
Greenway users living less than three miles from the greenways perceived
cultural benefits significantly more than users living over three miles away, yet each
group agreed that the greenways provided experiential benefits. This may be due to the
fact that users living closer to the greenways have the opportunity to walk or bike there
and feel like the greenway is a part of their home experience (Gobster, 1995). When
greenways function as a part of the cultural infrastructure in the communities in which
they are located (Shafer, Lee, et al., 2000; Zelenski et al., 2015), people who live near the
trail will likely recognize the unique cultural benefits they provide.
From our analysis, it is clear that researchers need to strongly consider cultural
and experiential benefits when creating scales that measure urban ecosystem services.
Based on our principal component analysis, it seems as if the traditional cultural ES, as
defined by the Millenium Ecosystem Assessment (2005) and many subsequent ES reports
(e.g., TEEB 2010), could be separated in to two different categories– cultural and

88
experiential. Following conventional ES thinking, cultural ecosystem services focus on
tangible outcomes for people and communities, which may include socio-economic
outputs directly derived from ecosystems including elements centered on aesthetic,
economic, or spiritual value (Chan et al. 2012). In our analysis, cultural benefits focused
on connectivity of destinations, historical or cultural significance, and economic impacts.
Experiential benefits, on the other hand, are a bit more difficult to conceptualize.
They are based on the concept of intermediate ecosystem services, which require other
inputs such as human, social, and built capital to ultimately produce a final ecosystem
service (Boyd & Banzhaf, 2007). Recreation, the most important benefit provided by
urban greenways in our sample, is a prime example of this. Boyd and Banzhaf (2007)
contend that recreation is not a final ecosystem service because it requires the
combination of other human (e.g., someone to participate) and capital inputs (e.g., a place
to do it). Similarly, Fisher et al. (2009) view recreation as a transformative element that
translates basic ecological factors (e.g., urban green space) into a tangible psychological
and physiological benefits and positive health outcomes (Manfredo & Driver, 1996;
Stein, Denny, & Pennisi, 2003). Through this interpretation, the natural setting (in this
case, the greenway) forms the foundation for experiential benefits. We therefore propose
that recreation, specifically, and experiential benefits, more generally, should be
explicitly integrated into ES narratives, whether or not they constitute “final” services or
outputs. Data from greenway users supports this assertion, as do results from other
studies examining public perceptions of urban ecosystem services (Baur et al. 2016).
While the principal component analysis conducted in this study suggests our scale is a

89
good start, other studies must be done to further investigate the extent to which this scale
is consistently reliable and valid across multiple samples.
Our scale focused primarily on cultural services in an effort to better understand
the cultural and experiential benefits derived from urban green space – two important
factors that have long been overlooked in the ES literature (Chan et al., 2012; Daniel et
al. 2012). We intentionally excluded items pertaining to categories such as provisioning
services, which are not particularly relevant on urban greenways (unless one considers
the rare case of urban foragers). Future research could include an equal representation of
items across all categories of ES, including those that are environmentally-centered (e.g.,
provision, regulation, and supporting services). Nevertheless, it is important to reiterate
that cultural and experiential benefits were more widely recognized among greenway
users in our sample than environmental benefits. Studies that use the scale we have
presented as a foundation could be conducted in other green spaces (including other
greenways) to further explore the generalizability our findings.
Conclusion
Our results should help urban planners and park managers understand how the
general public perceives the environmental, cultural, and experiential benefits associated
with urban trails. As the world’s population continues to move in to urban areas (United
Nations, 2010), access to large quantities of green space and the ecosystem services they
provide will diminish. While the biophysical aspects of urban ecosystems are important,
they represent only a portion of the total benefits people derive from urban green space.
For the general public, the perceived value of cultural and experiential benefits centered

90
on recreation, nature experiences, natural aesthetics and community connectivity may
exceed that of environmental services such as flood control and air/water quality
enhancement. Managers might therefore consider marketing urban green spaces – and
greenways specifically - for their cultural and experiential benefits in an effort to garner
more support from diverse stakeholders in the community (Baur, Tynon, Ries, &
Rosenberger, 2016; Chiesura, 2004; Gobster, Nassauer, Daniel, & Fry, 2007). There may
also be opportunity for practitioners to educate the public about the broader
environmental benefits (including provisioning, regulating, and supporting ecosystem
services) that green spaces provide. As ecosystem services-oriented thinking continues to
expand and transcend disciplinary boundaries to impact human health and wellbeing
(Jennings, Larson, & Larson, 2016), thorough understanding of public perceptions
regarding the benefits provided by nature in cities will become even more critical. This
study represents an important step in this process toward an inclusive, sustainable future.

91
References
About Us. (2014). Retrieved from http://www.railstotrails.org/about Ahern, Jack. (2002). Greenways as strategic landscape planning: theory and application:
Wageningen Universiteit. Allen, LR. (1996). A primer: benefits-based management of recreation services. Parks &
Recreation (Arlington), 31(3), 64-76. Allen, LR, & McGovern, D. (1997). BBM: It's working! Parks & Recreation (Ashburn),
32(8), 48-55. Americans Outdoors: the Legacy, the Challenge. (1987). Washington, D.C.: Island Press. Arneberger, A., & Eder, R. (2012). The influence of green space on community
attachment of urban and suburban residents. Urban Forestry & Urban Greening,
11, 41-49. doi:10.1016/j.ufug.2011.11.003 Atlanta BeltLine TAD. (2014). Retrieved from
https://www.investatlanta.com/development/commercial-incentives/tax-allocation-districts/atlanta-beltline/
Baschak, Lawrence A, & Brown, Robert D. (1995). An ecological framework for the planning, design and management of urban river greenways. Landscape and
Urban Planning, 33(1), 211-225. Baur, Joshua WR, Tynon, Joanne F, Ries, Paul, & Rosenberger, Randall S. (2014). Urban
Parks and Attitudes about Ecosystem Services: Does Park Use Matter? Journal of
Park and Recreation Administration, 32(4), 19-34. Baur, Joshua WR, Tynon, Joanne F, Ries, Paul, & Rosenberger, Randall S. (2016). Public
Attitudes about Urban Forest Ecosystem Services Management: A case study in Oregon cities. Urban Forestry & Urban Greening.
Bedimo-Rung, Ariane L, Mowen, Andrew J, & Cohen, Deborah A. (2005). The significance of parks to physical activity and public health: a conceptual model. American journal of preventive medicine, 28(2), 159-168.
Benedict, Mark A, & McMahon, Edward T. (2006). Green infrastructure: linking
landscapes and communities: Island Press. Blanck, Heidi M, Allen, Diana, Bashir, Zarnaaz, Gordon, Nina, Goodman, Alyson,
Merriam, Dee, & Rutt, Candace. (2012). Let's go to the park today: the role of parks in obesity prevention and improving the public's health. Childhood Obesity
(Formerly Obesity and Weight Management), 8(5), 423-428. Bocarro, Jason N, Floyd, Myron, Moore, Robin, Baran, Perver, Danninger, Tom, Smith,
William, & Cosco, Nilda. (2009). Adaptation of the System for Observing Physical Activity and Recreation in Communities (SOPARC) to assess age groupings of children. Journal of Physical Activity & Health, 6(6), 699-707.
Boyd, J. W., & Banzhaf, S. (2007). What are ecosystem services? The need for standardized environmental accounting units. Ecological Economics, 63, 616-626.
Boyd, James, & Banzhaf, Spencer. (2007). What are ecosystem services? The need for standardized environmental accounting units. Ecological Economics, 63(2), 616-626.

92
Braat, L. C., & de Groot, R. (2012). The ecosystem services agenda: Bridging the worlds of natural science and economics, conservation and development, and public and private policy. Ecosystem Services, 1, 4-15. doi:10.1016/j.ecoser.2012.07.011
Bratman, Gregory N, Hamilton, J Paul, & Daily, Gretchen C. (2012). The impacts of nature experience on human cognitive function and mental health. Annals of the
New York Academy of Sciences, 1249(1), 118-136. Brown, Gregory, & Raymond, Christopher. (2007). The relationship between place
attachment and landscape values: Toward mapping place attachment. Applied
geography, 27(2), 89-111. Bureau, U.S. Census. (2010). San Antonio, Texas Profile of General Population and
Housing Characteristics. Retrieved April 18, 2016 http://factfinder.census.gov/faces/tableservices/jsf/pages/productview.xhtml?src=CF
Chan, K. M. A., Guerry, A. D., Balvanera, P., Klain, S., Satterfield, T., Basurto, X., . . . Woodside, U. (2012). Where are cultural and social in ecosystem services? A framework for constructive engagement. BioScience, 62(8), 744-756. doi:10.1525/bio.2012.62.8.7
Chavez, Deborah J. (2008). Serving the needs of Latino recreation visitors to urban-proximate natural resource recreation areas. Recreation Visitor Research: Studies
of Diversity, 53. Chiesura, Anna. (2004). The role of urban parks for the sustainable city. Landscape and
Urban Planning, 68(1), 129-138. Childhood Obesity Facts. (2015). from Center for Disease Control and Prevention
http://www.cdc.gov/healthyschools/obesity/facts.htm Chon, Jinhyung, & Shafer, C Scott. (2009). Aesthetic responses to urban greenway trail
environments. Landscape Research, 34(1), 83-104. Clark, N. E., Lovell, R., Wheeler, B. W., Higgins, S. L., Depledge, M. H., & Norris, K.
(2014). Biodiversity, cultural pathways, and human health: a framework. Trends
in Ecology in Evolution, 29(4), 198-204. doi:10.1016/j.tree.2014.01.009 Clark, Roger N, & Stankey, George H. (1979). The Recreation Opportunity. Cohen, D. A., McKenzie, T. L., Sehgal, A., Williamson, S., Golinelli, D., & Lurie, N.
(2007). Contribution of parks to physical activity. American Journal of Public
Health, 97(509-514). doi:10.2105/AJPH.2005.072447 Cohen, Deborah A, McKenzie, Thomas L, Sehgal, Amber, Williamson, Stephanie,
Golinelli, Daniela, & Lurie, Nicole. (2007). Contribution of public parks to physical activity. American journal of public health, 97(3), 509-514.
Coley, Rebekah Levine, Sullivan, William C, & Kuo, Frances E. (1997). Where does community grow? The social context created by nature in urban public housing. Environment and behavior, 29(4), 468-494.
Coutts, Christopher. (2009). Multiple case studies of the influence of land-use type on the distribution of uses along urban river greenways. Journal of Urban Planning and
Development, 135(1), 31-38.

93
Coutts, Christopher J, & Miles, Rebecca. (2011). Greenways as green magnets: The relationship between the race of greenway users and race in proximal neighborhoods.
Crawford, Duane W, & Godbey, Geoffrey. (1987). Reconceptualizing barriers to family leisure. Leisure sciences, 9(2), 119-127.
Crawford, Duane W, Jackson, Edgar L, & Godbey, Geoffrey. (1991). A hierarchical model of leisure constraints. Leisure sciences, 13(4), 309-320.
Crespo, Carlos J, Smit, Ellen, Andersen, Ross E, Carter-Pokras, Olivia, & Ainsworth, Barbara E. (2000). Race/ethnicity, social class and their relation to physical inactivity during leisure time: results from the Third National Health and Nutrition Examination Survey, 1988–1994. American journal of preventive
medicine, 18(1), 46-53. Crewe, Katherine. (2001). Linear parks and urban neighbourhoods: a study of the crime
impact of the Boston south-west corridor. Journal of Urban Design, 6(3), 245-264.
Crossman, Neville D, Burkhard, Benjamin, Nedkov, Stoyan, Willemen, Louise, Petz, Katalin, Palomo, Ignacio, . . . Boyanova, Kremena. (2013). A blueprint for mapping and modelling ecosystem services. Ecosystem Services, 4, 4-14.
Dai, D. (2011). Racial/ethnic and socioeconomic disparities in urban green space accessibility: where to intervene? Landscape and Urban Planning, 102(4), 234-244. doi:10.1016/j.landurbplan.2011.05.002
Daniel, T. C., Muhar, A., Arnberger, A., Aznar, O., Boyd, J. W., Chan, K. M. A., . . . von der Dunk, A. (2012). Contributions of cultural services to the ecosystem services agenda. Proceedings of the National Academy of Sciences, 109(23), 8812-8819. doi:10.1073/pnas.1114773109
de Groot, R. S., Alkemade, R., Braat, L., Hein, L., & Willemen, L. (2010). Challenges in integrating the concept of ecosystem services and values in landscape planning, management and decision making. Ecological Complexity, 7, 260-272. doi:10.1016/j.ecocom.2009.10.006
Driver, Beverly L. (2008). Managing to optimize the beneficial outcomes of recreation: Venture Publishing.
Elmqvist, Thomas, Fragkias, Michail, Goodness, Julie, Güneralp, Burak, Marcotullio, Peter J, McDonald, Robert I, . . . Seto, Karen C. (2013). Urbanization,
biodiversity and ecosystem services: challenges and opportunities: Springer. Fabos, Julius G. (2004). Greenway planning in the United States: its origins and recent
case studies. Landscape and Urban Planning, 68(2), 321-342. Feeney, Stephen J. (1998). The Mohawk-Hudson Bike-Hike Trail: Analysis of Trail Use,
Regional Benefits & Economic Impact. Retrieved June, 11, 2009. Fernandez, Mariela, Shinew, Kimberly J, & Stodolska, Monika. (2015). Effects of
Acculturation and Access on Recreation Participation Among Latinos. Leisure
sciences, 37(3), 210-231. Floyd, Myron F. (1998). Getting beyond marginality and ethnicity: The challenge for
race and ethnic studies in leisure research. Journal of leisure research, 30(1), 3-22.

94
Floyd, Myron F. (1999). Race, ethnicity and use of the National Park System. Floyd, Myron F, Shinew, Kimberly J, McGuire, Francis A, & Noe, Francis P. (1994).
Race, class, and leisure activity preferences: marginality and ethnicity revisited. Journal of leisure research.
Frank, Lawrence D, Sallis, James F, Conway, Terry L, Chapman, James E, Saelens, Brian E, & Bachman, William. (2006). Many pathways from land use to health: associations between neighborhood walkability and active transportation, body mass index, and air quality. Journal of the American planning Association, 72(1), 75-87.
Furuseth, Owen J, & Altman, Robert E. (1991). Who's on the greenway: Socioeconomic, demographic, and locational characteristics of greenway users. Environmental
Management, 15(3), 329-336. Gobster, Paul H. (1995). Perception and use of a metropolitan greenway system for
recreation. Landscape and Urban Planning, 33(1), 401-413. Gobster, Paul H. (1998). Urban parks as green walls or green magnets? Interracial
relations in neighborhood boundary parks. Landscape and Urban Planning, 41(1), 43-55.
Gobster, Paul H. (2002). Managing urban parks for a racially and ethnically diverse clientele. Leisure sciences, 24(2), 143-159.
Gobster, Paul H, Nassauer, Joan I, Daniel, Terry C, & Fry, Gary. (2007). The shared landscape: what does aesthetics have to do with ecology? Landscape ecology,
22(7), 959-972. Gobster, Paul H, & Westphal, Lynne M. (2004). The human dimensions of urban
greenways: planning for recreation and related experiences. Landscape and
Urban Planning, 68(2), 147-165. Godbey, G., & Mowen, A. (2010). The benefits of physical activity provided by park and
recreation services: The scientific evidence. Retrieved from Ashburn, VA: Godbey, Geoffrey, & Blazey, Michael. (1983). Old people in urban parks: An
exploratory investigation. Journal of leisure research. Godbey, Geoffrey, & Mowen, Andrew. (2010). The benefits of physical activity provided
by park and recreation services: The scientific evidence: National Recreation and Park Association Ashburn, VA, USA.
Gomez-Baggethun, E., Gren, A., Barton, D. N., Langemeyer, J., McPhearson, T., O'Farrell, P., . . . Kremer, P. (2013). Urban ecosystem services. In T. Elmqvist, M. Fragkias, J. Goodness, B. Guneralp, P. J. Marcotullio, R. I. McDonald, S. Parnell, D. Haase, M. Sendstad, K. C. Seto, & C. Wilkinson (Eds.), Urbanization,
biodiversity and ecosystem services: Challenges and opportunities (pp. 175-251). London: Springer.
Haase, D., Larondelle, N., Andersson, E., Artmann, M., Borgstrom, S., Breuste, J., . . . Elmqvist, T. (2014). A quantitative review of urban ecosystem service assessments: Concepts, models, and implementation. Ambio, 43, 413-433. doi:10.1007/s13280-014-0504-0
Haase, Dagmar, Larondelle, Neele, Andersson, Erik, Artmann, Martina, Borgström, Sara, Breuste, Jürgen, . . . Hansen, Rieke. (2014). A quantitative review of urban

95
ecosystem service assessments: Concepts, models, and implementation. Ambio,
43(4), 413-433. Harnik, Peter, & Welle, Ben. (2011). From Fitness Zones to the Medical Mile: How
Urban Park Systems Can Best Promote Health and Wellness. Retrieved from Hartig, Terry, Mitchell, Richard, De Vries, Sjerp, & Frumkin, Howard. (2014). Nature
and health. Annual Review of Public Health, 35, 207-228. Ho, Ching-hua, Sasidharan, Vinod, Elmendorf, William, Willits, Fern K, Graefe, Alan, &
Godbey, Geoffrey. (2005). Gender and ethnic variations in urban park preferences, visitation, and perceived benefits. Journal of leisure research, 37(3), 281.
Howard W. Peak Greenway Trails System. (2016). Retrieved from https://www.sanantonio.gov/ParksAndRec/ParksFacilities/Trails/GreenwayTrails.aspx
Ivy, Mark I, & Moore, Roger L. (2007). Neighboring landowner attitudes regarding a proposed greenway trail: assessing differences between adjacent and nearby residents. Journal of Park and Recreation Administration, 25(2).
Jennings, Viniece L, Larson, Claire K, & Larson, Lincoln R. (2015). Ecosystem Services and Preventive Medicine: A Natural Connection. American journal of preventive
medicine. Jennings, Viniece, Larson, Lincoln, & Yun, Jessica. (2016). Advancing Sustainability
through Urban Green Space: Cultural Ecosystem Services, Equity, and Social Determinants of Health. International journal of environmental research and
public health, 13(2), 196. Kabisch, N., & Haase, D. (2014). Green justice or just green? Provision of urban green
spaces in Berlin, Germany. Landscape and Urban Planning, 122, 129-139. doi:10.1016/j.landurbplan.2013.11.016
Kaczynski, Andrew T, Potwarka, Luke R, & Saelens, Brian E. (2008). Association of park size, distance, and features with physical activity in neighborhood parks. American journal of public health, 98(8), 1451-1456.
Kaplan, Rachel. (2001). The nature of the view from home psychological benefits. Environment and behavior, 33(4), 507-542.
Kaplan, Stephen. (1995). The restorative benefits of nature: Toward an integrative framework. Journal of environmental psychology, 15(3), 169-182.
Katz, Peter, Scully, Vincent Joseph, & Bressi, Todd W. (1994). The new urbanism:
Toward an architecture of community (Vol. 10): McGraw-Hill New York. Kazmierczak, AE, & James, P. (2007). The role of urban green spaces in improving
social inclusion. Kellert, Stephen R. (2002). Experiencing nature: Affective, cognitive, and evaluative
development in children. Children and nature: Psychological, sociocultural, and
evolutionary investigations, 117-151. Kremen, Claire, & Ostfeld, Richard S. (2005). A call to ecologists: measuring, analyzing,
and managing ecosystem services. Frontiers in Ecology and the Environment,
3(10), 540-548.
96
Kuo, Frances E, & Faber Taylor, Andrea. (2004). A potential natural treatment for attention-deficit/hyperactivity disorder: evidence from a national study. American
journal of public health, 94(9), 1580-1586. Kuo, Frances E, & Sullivan, William C. (2001). Environment and crime in the inner city
does vegetation reduce crime? Environment and behavior, 33(3), 343-367. Landers, D. H., & Nahlik, A. M. (2013). Final Ecosystem Goods and Services
Classification System (FEGS-CS) (EPA/600/R-13/ORD-004914). Retrieved from Washington, DC:
Landers, Dixon H, & Nahlik, Amanda M. (2013). Final ecosystem goods and services classification system (FEGS-CS) EPA United States Environmental Protection
Agency. Report number EPA/600/R-13/ORD-004914. Larson, Lincoln R, Jennings, V, & Cloutier, S A. (in review). Public parks and wellbeing
in urban areas of the United States. PLOS ONE, 11(4). doi:10.1371/journal.pone.0153211
Larson, Lincoln R, Whiting, Jason W, & Green, Gary T. (2013). Young People's Outdoor Recreation and State Park Use: Perceived Benefits from the Parent/Guardian Perspective. Children Youth and Environments, 23(3), 89-118.
Larson, Lincoln R, Whiting, Jason W, Green, Gary T, & Bowker, JM. (2014). Physical Activity Levels and Preferences of Ethnically Diverse Visitors to Georgia State Parks. Journal of leisure research, 46(5), 540-562.
Laumann, Karin, Gärling, Tommy, & Stormark, Kjell Morten. (2003). Selective attention and heart rate responses to natural and urban environments. Journal of
environmental psychology, 23(2), 125-134. Lee, Jin-Hyung, Scott, David, & Floyd, Myron F. (2001). Structural inequalities in
outdoor recreation participation: A multiple hierarchy stratification perspective. Journal of leisure research, 33(4), 427.
Librett, John J, Yore, Michelle M, & Schmid, Thomas L. (2006). Characteristics of physical activity levels among trail users in a US national sample. American
journal of preventive medicine, 31(5), 399-405. Lindsey, Greg. (1999). Use of urban greenways: insights from Indianapolis. Landscape
and Urban Planning, 45(2), 145-157. Lindsey, Greg, Han, Yuling, Wilson, Jeffrey, & Yang, Jihui. (2006). Neighborhood
correlates of urban trail use. Journal of Physical Activity & Health, 3, S139. Lindsey, Greg, Maraj, Maltie, & Kuan, SonCheong. (2001). Access, equity, and urban
greenways: An exploratory investigation. The Professional Geographer, 53(3), 332-346.
Little, Charles E. (1990). Greenways for America. Baltimore, MD: Johns Hopkins University Press.
Louv, Richard. (2008). Last child in the woods: Saving our children from nature-deficit
disorder: Algonquin Books. Low, S. (2013). Public space and diversity: Distributive, procedural and interactional
justice for parks. In G. Young & D. Stevenson (Eds.), The Ashgate Research
companion to planning and culture (pp. 295-310). Surrey, UK: Ashgate Publishing.

97
Maller, Cecily, Townsend, Mardie, Pryor, Anita, Brown, Peter, & St Leger, Lawrence. (2006). Healthy nature healthy people:‘contact with nature’as an upstream health promotion intervention for populations. Health promotion international, 21(1), 45-54.
Manning, Robert E. (1998). Studies in outdoor recreation: Oregon State University Press Corvallis, OR.
McKenzie, Thomas L, Cohen, Deborah A, Sehgal, Amber, Williamson, Stephanie, & Golinelli, Daniela. (2006). System for Observing Play and Recreation in Communities (SOPARC): reliability and feasibility measures. Journal of Physical
Activity & Health, 3, S208. Millenium Ecosystem Assessment. (2005). Ecosystems and human well-being.
Washington, DC: Island Press. Mitchell, R., & Popham, F. (2008). Effects of exposure to natural environment on health
inequalities: An observational population study. Lancet, 372, 1655-1660. Moore, Roger L. (1992). The impacts of rail-trails: A study of the users and property
owners from three trails: United States Govt Printing Office. Moore, Roger L. (1994). Conflicts on multiple-use trails: Synthesis of the literature and
state of the practice. Moore, Roger L, Graefe, Alan R, & Gitelson, Richard J. (1994). Living near greenways:
neighboring landowners' experiences with and attitudes toward rail-trails. Journal
of Park and Recreation Administration, 12(1), 79-93. Moore, Roger L, & Ross, D Thomas. (1998). Trails and recreational greenways: corridors
of benefits. Parks & Recreation (Ashburn), 33(1), 68-79. Moore, Roger L, & Shafer, C Scott. (2001). Introduction to special issue trails and
greenways: opportunities for planners, managers, and scholars. Journal of Park
and Recreation Administration, 19(3), 1-16. More, Thomas A, & Payne, Brian R. (1978). Affective responses to natural areas near
cities. Journal of leisure research, 10(1), 7-12. Nahlik, Amanda M, Kentula, Mary E, Fennessy, M Siobhan, & Landers, Dixon H.
(2012). Where is the consensus? A proposed foundation for moving ecosystem service concepts into practice. Ecological Economics, 77, 27-35.
Ortman, Jennifer M, & Guarneri, Christine E. (2009). United States population projections: 2000 to 2050. United States Census Bureau.
Palau, Ramon, Forgas, Santiago, Blasco, Daniel, & Ferrer, Berta. (2012). An Analysis of Greenways from an Economic Perspective. Tourism Planning & Development,
9(1), 15-24. Parra, Diana C, McKenzie, Thomas L, Ribeiro, Isabela C, Hino, Adriano A Ferreira,
Dreisinger, Mariah, Coniglio, Kathryn, . . . Hoehner, Christine M. (2010). Assessing physical activity in public parks in Brazil using systematic observation. American journal of public health, 100(8), 1420.
Pearce, Kimberly D. (1999). Race, ethnicity, and physical activity. Journal of Physical
Education, Recreation & Dance, 70(1), 25-28. Prevention, Centers for Disease Control and. (2014). State Indicator Report on Physical
Activity. Retrieved from Atlanta, GA:
98
Reed, Julian A. (2014). Greenville Health System Swamp Rabbit Trail: Year 3 Findings. Retrieved from Greenville, SC:
Reed, Julian A, Arant, C, Wells, Princess, Stevens, Katherine, Hagen, Sandra, & Harring, Holly. (2008). A descriptive examination of the most frequently used activity settings in 25 community parks using direct observation. Journal of Physical
Activity & Health, 5, S183. Reed, Julian A, Hooker, Steven P, Muthukrishnan, Suresh, & Hutto, Brent. (2011). User
demographics and physical activity behaviors on a newly constructed urban rail/trail conversion. Journal of Physical Activity and Health, 8(4), 534.
Reynolds, Kim D, Wolch, Jennifer, Byrne, Jason, Chou, Chih-Ping, Feng, Guanjun, Weaver, Susan, & Jerrett, Michael. (2007). Trail characteristics as correlates of urban trail use. American Journal of Health Promotion, 21(4s), 335-345.
Russell, R., Guerry, A. D., Balvanera, P., Gould, R. K., Basurto, X., Chan, K. M. A., . . . Tam, J. (2013). Humans and nature: How knowing and experiencing nature affect well-being. Annual Review of Environment and Resources, 38, 473-502. doi:0.1146/annurev-environ-012312-110838
Sallis, James F, Cervero, Robert B, Ascher, William, Henderson, Karla A, Kraft, M Katherine, & Kerr, Jacqueline. (2006). An ecological approach to creating active living communities. Annu. Rev. Public Health, 27, 297-322.
Samdahl, Diane M, & Jekubovich, Nancy J. (1997). A critique of leisure constraints: Comparative analyses and understandings. Journal of leisure research, 29(4), 430.
Schneider, Ingrid E. (2000). Responses to Conflict in Urban-proximate Areas. Journal of
Park & Recreation Administration, 18(2). Scott, David, & Munson, Wayne. (1994). Perceived Constraints to Park Usage. Journal
of Park and Recreation Administration. Searns, Robert M. (1995). The evolution of greenways as an adaptive urban landscape
form. Landscape and Urban Planning, 33(1), 65-80. Services, U.S. Department of Health and Human. (2008). 2008 Physical Activity
Guidelines for Americans. Retrieved from Washington, D.C.: Shafer, C Scott, Lee, Bong Koo, & Turner, Shawn. (2000). A tale of three greenway
trails: user perceptions related to quality of life. Landscape and Urban Planning,
49(3), 163-178. Shafer, C Scott, Scott, David, & Mixon, Jennifer. (2000). A greenway classification
system: Defining the function and character of greenways in urban areas. Journal
of Park and Recreation Administration, 18(2). Shinew, Kimberly J, Floyd, Myron F, & Parry, Diana. (2004). Understanding the
relationship between race and leisure activities and constraints: Exploring an alternative framework. Leisure sciences, 26(2), 181-199.
Shores, Kindal A, Scott, David, & Floyd, Myron F. (2007). Constraints to outdoor recreation: A multiple hierarchy stratification perspective. Leisure sciences, 29(3), 227-246.
Solecki, William D, & Welch, Joan M. (1995). Urban parks: green spaces or green walls? Landscape and Urban Planning, 32(2), 93-106.

99
Swanwick, Carys, Dunnett, Nigel, & Woolley, Helen. (2003). Nature, role and value of green space in towns and cities: An overview. Built Environment, 29(2), 94-106.
Taylor, Andrea Faber, & Kuo, Frances E. (2009). Children with attention deficits concentrate better after walk in the park. Journal of attention disorders, 12(5), 402-409.
TEEB. (2010). The Economics of Ecosystems and Biodiverity: mainstreaming the
economics of nature - a synthesis of the approach, conclusions and
recommendations of TEEB. Malta: Progress Press. Thompson, Catharine Ward, Roe, Jenny, Aspinall, Peter, Mitchell, Richard, Clow,
Angela, & Miller, David. (2012). More green space is linked to less stress in deprived communities: Evidence from salivary cortisol patterns. Landscape and
Urban Planning, 105(3), 221-229. Troped, Philip J, Whitcomb, Heather A, Hutto, Brent, Reed, Julian A, & Hooker, Steven
P. (2009). Reliability of a brief intercept survey for trail use behaviors. Journal of
Physical Activity & Health, 6(6), 775.Tzoulas, Konstantinos, Korpela, Kalevi, Venn, Stephen, Yli-Pelkonen, Vesa,
Kaźmierczak, Aleksandra, Niemela, Jari, & James, Philip. (2007). Promoting ecosystem and human health in urban areas using Green Infrastructure: A literature review. Landscape and Urban Planning, 81(3), 167-178.
United Nations. (2010). Urban and rural areas 2009. Retrieved from New York: http://www.un.org/en/development/desa/population/publications/urbanization/urban-rural.shtml
Vaske, Jerry J. (2008). Survey research and analysis: Applications in parks, recreation
and human dimensions: Venture Publishing State College, PA. Walmsley, Anthony. (2006). Greenways: multiplying and diversifying in the 21st
century. Landscape and Urban Planning, 76(1), 252-290. Washburne, Randel F. (1978). Black under‐participation in wildland recreation:
Alternative explanations. Leisure sciences, 1(2), 175-189. White, M. P., Alcock, I., Wheeler, B. W., & Depledge, M. H. (2013). Would you be
happier living in a greener urban area? A fixed-effects analysis of panel data. Psychological Science, 24(6), 920-928. doi:10.1177/0956797612464659
Whiting, Jason W, Larson, Lincoln R, & Green, Gary T. (2012). Monitoring visitation in Georgia state parks using the System for Observing Play and Recreation in Communities (SOPARC). Journal of Park and Recreation Administration, 30(4), 21-37.
Wilhelm-Stanis, Sonja A, Schneider, Ingrid E, Chavez, Deborah J, & Shinew, Kimberly J. (2009). Visitor constraints to physical activity in park and recreation areas:Differences by race and ethnicity.
Wolch, Jennifer R, Tatalovich, Zari, Spruijt-Metz, Donna, Byrne, Jason, Jerrett, Michael, Chou, Chih-Ping, . . . Reynolds, Kim. (2010). Proximity and perceived safety as determinants of urban trail use: findings from a three-city study. Environment and
planning. A, 42(1), 57. Woodard, Michael D. (1988). Class, regionality, and leisure among urban Black
Americans: The post-civil rights era. Journal of leisure research.

100
Yerardi, Joe. (2013). S.A. sees fewer foreign migrants. Retrieved from http://www.mysanantonio.com/news/local_news/article/S-A-sees-fewer-foreign-migrants-4415526.php
Zelenski, John M, Dopko, Raelyne L, & Capaldi, Colin A. (2015). Cooperation is in our nature: Nature exposure may promote cooperative and environmentally sustainable behavior. Journal of environmental psychology, 42, 24-31.

101
CHAPTER 4
CONCLUSIONS AND MANAGEMENT IMPLICATIONS
The following summary, management implications, and suggestions represent a
synthesis of quantitative data, participant comments, and subjective observations by the
researcher during time spent on the Eastside Trail and Leon Creek Greenway. It should
be noted that the vast majority of users at each greenway were pleased with its current
conditions and see the trails as an important resource in their life and the community as a
whole. Though only two greenways were sampled, these implications could likely be
applied to other greenways sharing similar characteristics.
Leon Creek Greenway – Suburban Greenway
The Leon Creek Greenway is one of the most ethnically diverse trails seen
throughout studies across the country, with 52% of its users being non-White (44%
Hispanic/ Latino). With San Antonio’s high concentration of Hispanic/ Latinos, this may
not be surprising (Fernandez et al., 2015). Nevertheless, this outdoor recreation
resource’s unique ability to attract racially/ethnically diverse visitors could be a subject
for future investigation. Efforts should be made to attract more women, teens, children
and senior citizens to the greenway as they are represented in proportionately low
numbers. Though regular police patrols are present throughout the trail, likely deterring
criminal activity, extra efforts to increase physical safety (e.g., stripe the trail, separate
bicycle lane, etiquette education and enforcement) could attract more diverse users

102
(Gobster, 1995; Moore, 1994; Schneider, 2000). Making the trail safer through these
efforts, for walkers and runners could help to attract more people to use the greenway for
walking and running (as opposed to biking, which was the most commonly observed trail
activity). Special events (e.g., 5k, walks for charity) hosted on the greenway could help to
introduce underrepresented population groups to the resource.
This suburban greenway was used primarily for recreation, with users primarily
motivated to visit for exercise, escaping the city, and experiencing nature. Safety and
security, condition and maintenance of the trail and natural scenery were perceived to be
the most important factors in users’ visits to the Leon Creek Trail. Benefits directly
derived from spending leisure time in the natural environment were perceived as higher
than others, as users recognized experiential benefits at a higher level than either cultural
or environmental benefits. These experiential benefits should continue to be preserved by
protecting the surrounding natural corridor (Gobster, 1995).
Users were less satisfied with connections to attractions and points of interest than
any other trail attribute. Though the greenway has exceptional potential to help users
interact with natural, wooded environments, there would be opportunities to attract
different users if the trail were to connect more popular points of interest such as places
of business, schools, restaurants and stores. With lower numbers of users accessing the
trail by walking or bicycling (25%) and some users expressing concern for increased
accessibility, connecting the trail to nearby cross streets and other locations via sidewalks
could increase the amount of users walking or bicycling to the trail, thus creating more
space for people to park at trailheads. This could also persuade more nearby residents to

103
use the trail, especially since the average distance people are traveling from their home
ZIP code is currently almost 4 miles.
Surprisingly, environmental benefits were ranked lowest among the ecosystem
service benefit categories. Though participants recognized the greenway corridor helps
protect the city’s air quality (75% agreed or strongly agreed) they were less likely to
agree the corridor provides protection against extreme weather (50% agreed or strongly
agreed) and protect the city’s water quality (55% agreed or strongly agreed). Raising
awareness of these unseen environmental benefits could help users and non-users
embrace the idea that these greenways are not simply extraordinary recreation resources,
but are both economically and environmentally sustainable for the city. Increasing
awareness of the trail itself in adjacent communities could help the trail connect people
from different neighborhoods.
Eastside Trail – Urban Greenway
The majority of Eastside Trail users were White (71%), with African American
users being the second most common at 13% of the total amount of users. However, it is
important to note that – based on data from other studies (Coutts & Miles, 2011; Furuseth
& Altman, 1991; Lindsey, 1999; Moore, 1992; Reed, 2014) - this trail still supports more
racial/ethnic diversity of users than most other urban greenways around the country. The
Eastside Trail passes through expensive (i.e., gentrified) housing pockets immediately
adjacent to the trail, but there remain diverse populations within and closely beyond these
developments. Efforts could be made to bring awareness of the existence and benefits of

104
the trail to these nearby, diverse neighborhoods to attract more users from the area.
Children, teens and senior citizens use the Eastside Trail at very small rates, and efforts to
attract these age groups could prove beneficial to helping promoteactive lifestyles and
intergenerational interactions across the lifespan. Making the trail safer (e.g., trail
etiquette education/ enforcement, trail striping) for these sub-populations could attract
them to the trail (Moore, 1994; Schneider, 2000), while implementing programs or
structures for children (e.g., playgrounds) could increase their use of the resource.
Runners may be represented in low numbers (18%) due to the crowdedness of the trail.
More runners would likely utilize the Eastside Trail if expansions are made to disperse
use.
Eastside Trail users do not just use the trail for recreation, but are traveling to
many points of interest like parks, restaurants and stores. This unique corridor or
connectivity may be one of the most appealing functions of urban greenways, especially
when compared to their suburban counterparts. Efforts to make the Eastside Trail a
transportation corridor for locals hoping to access a variety of destinations (not just work)
should continue to be implemented. Through the planned expansion of the Atlanta
Beltline through different areas in Atlanta, there may be more opportunities for
transportation with users accessing work and school. Providing options for drinking water
could make the Eastside Trail experience more desirable to users. Safety and security on
the trail was highly important to survey participants, yet they ranked this variable lower
on satisfaction (4.08). Security options, such as patrols or lighting, could also be
considered, especially if users are able to traverse the trail at night.

105
The majority (69%) of Eastside Trail users walked or biked to the trail and, on
average, only traveled 1.3 miles from their home ZIP Code to the nearest trail access
point. Though the trail is also attracting users from further away in the city, visitors living
nearby are most common. Focusing on connecting (e.g., crosswalks, ramps, sidewalks,
bike lanes) nearby neighborhoods and cross streets to the trail should be considered, so
users can walk or bike back to their home conveniently. Accessibility on the trail was
ranked of high importance (4.34) to participants, but lower on satisfaction (4.05). This
may be due the very limited and highly congested parking situation. The enhance the
trails value as urban recreation destination for residents throughout the city of Atlanta, the
parking bottleneck should be addressed.
Environmental benefits were ranked lowest (3.55) by Eastside Trail users among
the three ecosystem service benefits categories. Experiential and cultural benefits seem to
be well-known, as these tend to be more tangible to the general public. Raising awareness
of unrecognized environmental benefits while leveraging the realized value of
experiential and cultural benefits could help garner more diverse support for the Atlanta
Beltline development effort.
Finally, articipants (on average) rated the trail as “slightly crowded.” During peak
use times (evenings and weekends), user density on the trail was extreme. If crowding
gets worse, it could ultimately deter users, cause conflict and even injury. As mentioned
before, the expansion of the Atlanta Beltline will likely help spread use out, but will also
attract new users.

106
Greenways are becoming increasingly important and their value to cities is
becoming more evident, thus the impacts – both good and bad – of greenways should be
carefully considered moving forward. As we link communities and ecosystems with
greenways, we have the opportunity to create vibrant spaces that are unique to any other
environment.

107
APPENDICES

APPENDIX A. INTERCEPT SURVEY INSTRUMENT
Leon Creek Greenway Visitor Survey
Clemson University is conducting a study of visitors to the Leon Creek Greenway trail. Your responses will help the city
manage the trail for your use and enjoyment. Please take a few minutes to complete this questionnaire.
Your help is voluntary and responses are anonymous and confidential.
1. Including today, how many times have you visited the Leon Creek trail in the past month?
_______ visits
2. How does your use of the Leon Creek trail change during October through March? (Check ONE.)
� Decreases � Does not change � Increases
3. How many people, if any, traveled with you to the trail today? _______ people
3a. How many of those traveling with you today are under age 18? _______ people
4. How much time will you spend on the trail today? ________ hour(s) and/or ___________ minutes
5. Please check ALL the activities you participated in during your visit to the Leon Creek trail today.
� Walking � Jogging/running � Biking
� Skating or skateboarding � Dog walking � Wildlife viewing/photography
� Other (specify): __________________________ __
6. How do you usually get to this trail? (Check ONE.)
� Walk or Bicycle � Car or personal motor vehicle � Public transportation (bus, train)
7. Where are you usually going when you use the Leon Creek trail? (Check ALL that apply.)
� No destination (just recreation) � Parks or historic sites
� Work � School
� Restaurants, stores, etc. � Other (specify): ________________
8. How IMPORTANT are the following factors to you during your visit to the Leon Creek trail?
(Circle ONE response for each item.)
Not At All
Important
Slightly
Important
Moderately
Important
Very
Important
Extremely
Important
Spending time with family and/or friends 1 2 3 4 5 Resting, relaxing, and escaping city life 1 2 3 4 5 Exercising and being physically active 1 2 3 4 5 Discovering and experiencing nature 1 2 3 4 5 Getting to and from places I want to be 1 2 3 4 5 Accessibility of the trail 1 2 3 4 5 Condition and maintenance of trail 1 2 3 4 5 Connections to attractions/points of interest 1 2 3 4 5 Safety and security along the trail 1 2 3 4 5 Natural scenery along the trail 1 2 3 4 5 Places to sit and gather along the trail 1 2 3 4 5
SA-1
Please turn over.
108

109
APPENDIX B. DIRECT OBSERVATION INSRUMENT
DATE ______ TRAIL ______ AREA ___________ WEATHER __________ TIME ______ OBS _____
Page _____ of _____
ACTIVITY GENDER AGE GROUP ETHNICITY
W R B S F M Child Teen Adult Sen W L B A O