urban ecological footprints: why cities cannot be ... ecological footprints: why cities cannot be...
TRANSCRIPT
Urban Ecological Footprints: Why Cities Cannot beSustainable—and Why They are a Key to Sustainability
William Rees and Mathis Wackernagel
Keywords: ecological footprint · sustainability · economics · resource use · energy · global trade ·environmental justice
Introduction: Transforming Human Ecology
It is sometimes said that the industrial revolution stimulated the greatest human migration in history.This migration swept first through Australia, Europe, and North America and is still in the pro-cess of transforming Asia and the rest of the world. We refer, of course, to the mass movementof people from farms and rural villages to cities everywhere. The seeming abandonment of thecountryside is creating an urban world—75% or more of the people in so-called industrializedcountries now live in towns and cities, and half of humanity will be city dwellers by the end ofthe century.
Although usually seen as an economic or demographic phenomenon, urbanization also representsa human ecological transformation. Understanding the dramatic shift in human spatial and materialrelationships with the rest of nature is a key to sustainability. Our primary purpose, therefore, isto describe a novel approach to assessing the ecological role of cities and to estimate the scaleof the impact they are having on the ecosphere. The analysis shows, that as nodes of energy andmaterial consumption, cities are causally linked to accelerating global ecological decline and are notby themselves sustainable. At the same time, cities and their inhabitants can play a major role inhelping to achieve global sustainability.
Starting Premise
Our analysis starts from the premise that the late 20th century marks a nontrivial turning pointin the ecological history of human civilization. For the first time, since the dawn of agricultureand the possibility of geographically fixed settlements 12,000 years ago, the aggregate scale ofhuman economic activity is capable of altering global biophysical systems and processes in waysthat jeopardize both global ecological stability and geopolitical security.
W. ReesSchool of Community and Regional Planning, University of British Columbia, 6333 Memorial Road. Vancouver, BCV6T 1Z2, Canadae-mail: [email protected]
Originally Published in 1996 in Environmental Impact Assessment Review 16:223–248.J.M. Marzluff et al., Urban Ecology,C© Springer 2008
537
538 W. Rees, M. Wackernagel
Examples abound—more artificial nitrate is now applied to the world’s croplands than is fixedfrom the atmosphere by microbial activity and other natural processes combined (Vitousek 1994);the rate of human-induced species extinctions is approaching the extinction rates driven by “thegreat natural catastrophes at the end of the Paleozoic and Mesozoic era—in other words, [they are]the most extreme in the past 65 million years” (Wilson 1988); “residuals” discharged by industrialeconomies are depleting stratospheric ozone and altering the preindustrial composition of the atmo-sphere, and both these trends contribute to (among other things) the threat of climate change, itselfthe most potent popular symbol of widespread ecological dysfunction. Perhaps most significantfrom an ecosystems perspective is the evidence that human beings, one species among millions,now consume, divert, or otherwise appropriate for their own purposes 40% of the product of netterrestrial photosynthesis (Vitousek et al. 1986) and up to 35% of primary production from coastalshelves and upwellings, the most productive marine habitats (Pauly and Christensen 1995). Were itnot for the fact that fish catches are in decline from stock depletion, both these proportions would besteadily increasing.
The empirical evidence suggests that the human economy is overwhelming the ecosphere fromwithin. This unprecedented situation has prompted some development analysts to argue that theworld has reached an historic turning point, a point at which the world must shift from the assump-tions of “empty-world” to those of “full-world” economics (Daly 1991).
Carrying Capacity as Maximum Human “Load”
An environment’s carrying capacity is its maximum persistently supportable load (Catton 1986).
The notion that humanity may be up against a new kind of limit has rekindled the Malthusiandebate about human carrying capacity (see, for example, Ecological Economics. November 1995.15(2)). Carrying capacity is usually defined as the maximum population of a given species that canbe supported indefinitely in a defined habitat without permanently impairing the productivity of thathabitat. However, because we humans seem to be capable of continuously increasing the human car-rying capacity of Earth by eliminating competing species, by importing locally scarce resources, andthrough technology, conventional economists and planners generally reject the concept as appliedto people. As Herman Daly critically observes, the prevailing vision assumes a world in which theeconomy floats free of any environmental constraints. This is a world “in which carrying capacity isinfinitely expandable”—and therefore irrelevant (Daly 1986).
By contrast, we argue that the economy is an inextricably embedded subsystem of the eco-sphere. Despite our technological and economic achievements, humankind remains in a state of“obligate dependence” on the productivity and life support services of the ecosphere (Rees 1990).The trappings of technology and culture aside, human beings remain biophysical entities. From atrophic-dynamic perspective, the relationship of humankind to the rest of the ecosphere is similarto those of thousands of other consumer species with which we share the planet. We depend forboth basic needs and the production of cultural artifacts on energy and material resources extractedfrom nature, and all this energy/matter is eventually returned in degraded form to the ecosphereas waste. The major material difference between humans and other species is that, in addition toour biological metabolism, the human enterprise is characterized by an industrial metabolism. Inthermodynamic terms, all our toys and tools (the human-made “capital” of economists) are “theexosomatic equivalent of organs” and, like bodily organs, require continuous flows of energy andmaterial to and from “the environment” for their production and operation (Sterrer 1993). Carryingcapacity therefore remains central to sustainabilty.
Because of this continuing functional dependence on ecological processes, some analysts havestopped thinking of natural resources as mere “free goods of nature.” Ecological economists now
Urban Ecological Footprints 539
regard the species, ecosystems, and other biophysical entities that produce required resource flowsas forms of “natural capital” and the flows themselves as types of essential “natural income” (Pearceet al. 1989; Victor 1991; Costanza and Daly 1992). This capital theory approach provides a valu-able insight into the meaning of sustainability—no development path is sustainable if it dependson the continuous depletion of productive capital. From this perspective, society can be said to beeconomically sustainable only if it passes on an undiminished per capita stock of essential capitalfrom one generation to the next (Pearce 1994; Solow 1986; Victor 1991).1
In the present context, the most relevant interpretation of this “constant capital stocks” criterionis as follows:
Each generation should inherit an adequate per capita stock of natural capital assets no less than the stock ofsuch assets inherited by the previous generation.2
Because of its emphasis on maintaining natural (biophysical) capital intact, the foregoing is a“strong sustainability” criterion (Daly 1990). The prevailing alternative interpretation would main-tain a constant aggregate stock of humanmade and natural assets. This latter version reflects theneoclassical premise that manufactured capital can substitute for natural capital and is referred to as“weak sustainability” (Daly 1990; Pearce and Atkinson 1993; Victor et al. 1995).
We prefer strong sustainability because it best reflects known ecological principles and themultifunctionality of biological resources “including their role as life support systems” (Pearceet al. 1989). Most importantly, strong sustainability recognizes that manufactured and natural capital“are really not substitutes but complements in most production functions” (Daly 1990). In otherwords, many forms of biophysical capital perform critical functions that cannot be replaced bytechnology. For sustainability, a critical minimal amount of such capital must be conserved intactand in place. This will ensure that the ecosystems upon which humans depend remain capable ofcontinuous self-organization and production.3
In this light, the fundamental question for ecological sustainability is whether remaining nat-ural capital stocks (including other species populations and ecosystems) are adequate to providethe resources consumed and assimilate the wastes produced by the anticipated human popula-tion into the next century, while simultaneously maintaining the general life support functions ofthe ecosphere (Rees 1996). In short, is there adequate human carrying capacity? At present, ofcourse, both the human population and average consumption are increasing, whereas the total areaof productive land and stocks of natural capital are fixed or in decline. In this light, we arguethat shrinking carrying capacity may soon become the single most important issue confrontinghumanity.
The issue becomes clearer if we define human carrying capacity not as a maximum population butrather as the maximum (entropic) “load” that can safely be imposed on the environment by people
1 We acknowledge that the heterogeneity and interdependence of various forms of natural capital make this criteriondifficult to operationalize. For example, ecosystems are constantly developing and evolving, and there are many com-binations of natural capital stocks that could be sustainable. However, this does not detract from the general principlethat for each potentially viable combination, sustainability requires some minimal individual and aggregate quantityof these component stocks.2 “Natural assets” encompasses not only material resources (e.g., petroleum, the ozone layer, forests, soils) butalso process resources (e.g., waste assimilation, photosynthesis, soils formation). It includes renewable as well asexhaustible forms of natural capital (Costanza and Daly 1992). Our primary interest here is in essential renewableand replenishable forms. Note that the depletion of nonrenewables could be compensated for through investment inrenewable natural capital.3 The only ecologically meaningful interpretation of constant stocks is in terms of constant physical stocks as isimplied here. However, some economists interpret “constant capital stock” to mean constant monetary value of stocksor constant resource income over time (for a variation on this theme, see Pearce and Atkinson 1993). These interpre-tations allow declining physical stocks as value and market prices rise over time.
540 W. Rees, M. Wackernagel
(Catton 1986). Human load is clearly a function not only of population but also of average per capitaconsumption. Significantly, the latter is increasing even more rapidly than the former due (ironically)to expanding trade, advancing technology, and rising incomes. As Catton (1986) observes: “Theworld is being required to accommodate not just more people, but effectively ‘larger’ people . . ..”For example, in 1790 the estimated average daily energy consumption by Americans was 11,000 kcalper capita. By 1980, this had increased almost 20-fold to 210,000 kcal/day (Catton 1986). As a resultof such trends, load pressure relative to carrying capacity is rising much faster than is implied bymere population increases.
Ecological Footprints: Measuring Human Load
By inverting the standard carrying capacity ratio and extending the concept of load, we have devel-oped a powerful tool for assessing human carrying capacity. Rather than asking what populationa particular region can support sustainably, the critical question becomes: How large an area ofproductive land is needed to sustain a defined population indefinitely, wherever on Earth that landis located? (Rees 1992; Rees and Wackernagel 1994). Most importantly, this approach overcomesany objection to the concept of human carrying capacity based on trade and technological factors.In the language of the previous section, we ask how much of the Earth’s surface is appropriated tosupport the “load” imposed by a referent population, whatever its dependence on trade or its levelof technological sophistication.
Since most forms of natural income (resource and service flows) are produced by terrestrialecosystems and associated aquatic ones,4 it should be possible to estimate the area of land/waterrequired to produce sustainably the quantity of any resource or ecological service used by a definedpopulation or economy at a given level of technology. The sum of such calculations for all significantcategories of consumption would provide a conservative area-based estimate of the natural capitalrequirements for that population or economy. We call this area the population’s true “ecologicalfootprint.”
A simple two-step mental experiment serves to illustrate the ecological principles behind thisapproach. First, imagine what would happen to any modern city as defined by its political boundariesif it were enclosed in a glass or plastic hemisphere completely closed to material flows. This meansthat the human system so contained would be able to depend only on whatever remnant ecosystemswere initially trapped within the hemisphere.
It is obvious to most people that the city would cease to function, and its inhabitants would perishwithin a few days. The population and economy contained by the capsule would have been cut offfrom both vital resources and essential waste sinks leaving it to starve and suffocate at the sametime. In other words, the ecosystems contained within our imaginary human terrarium—and anyreal world city—would have insufficient carrying capacity to service the ecological load imposed bythe contained population.
The second step pushes us to contemplate urban ecological reality in more concrete terms. Let’sassume that our experimental city is surrounded by a diverse landscape in which cropland and pas-ture, forests and water-sheds—all the different ecologically productive land-types—are representedin proportion to their actual abundance on the Earth and that adequate fossil energy is available tosupport current levels of consumption using prevailing technology. Let’s also assume our imaginaryglass enclosure is elastically expandable. The question now becomes: How large would the hemi-sphere have to grow before the city at its center could sustain itself indefinitely and exclusively on
4 Exceptions include the ozone layer and the hydrologic cycle both of which are purely physical forms of naturalcapital.
Urban Ecological Footprints 541
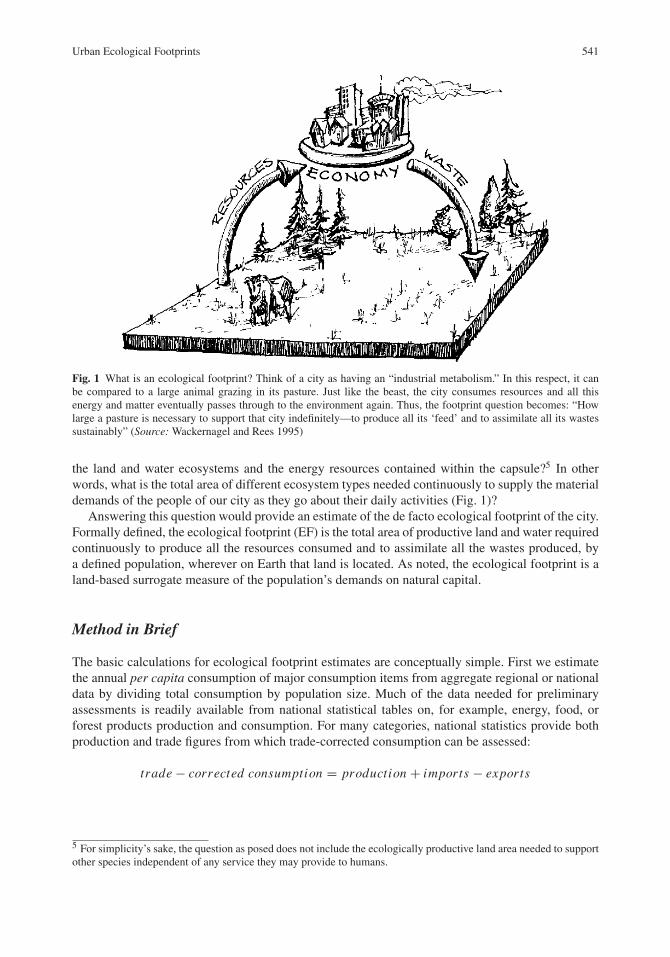
Fig. 1 What is an ecological footprint? Think of a city as having an “industrial metabolism.” In this respect, it canbe compared to a large animal grazing in its pasture. Just like the beast, the city consumes resources and all thisenergy and matter eventually passes through to the environment again. Thus, the footprint question becomes: “Howlarge a pasture is necessary to support that city indefinitely—to produce all its ‘feed’ and to assimilate all its wastessustainably” (Source: Wackernagel and Rees 1995)
the land and water ecosystems and the energy resources contained within the capsule?5 In otherwords, what is the total area of different ecosystem types needed continuously to supply the materialdemands of the people of our city as they go about their daily activities (Fig. 1)?
Answering this question would provide an estimate of the de facto ecological footprint of the city.Formally defined, the ecological footprint (EF) is the total area of productive land and water requiredcontinuously to produce all the resources consumed and to assimilate all the wastes produced, bya defined population, wherever on Earth that land is located. As noted, the ecological footprint is aland-based surrogate measure of the population’s demands on natural capital.
Method in Brief
The basic calculations for ecological footprint estimates are conceptually simple. First we estimatethe annual per capita consumption of major consumption items from aggregate regional or nationaldata by dividing total consumption by population size. Much of the data needed for preliminaryassessments is readily available from national statistical tables on, for example, energy, food, orforest products production and consumption. For many categories, national statistics provide bothproduction and trade figures from which trade-corrected consumption can be assessed:
trade − corrected consumption = production + imports − exports
5 For simplicity’s sake, the question as posed does not include the ecologically productive land area needed to supportother species independent of any service they may provide to humans.
542 W. Rees, M. Wackernagel
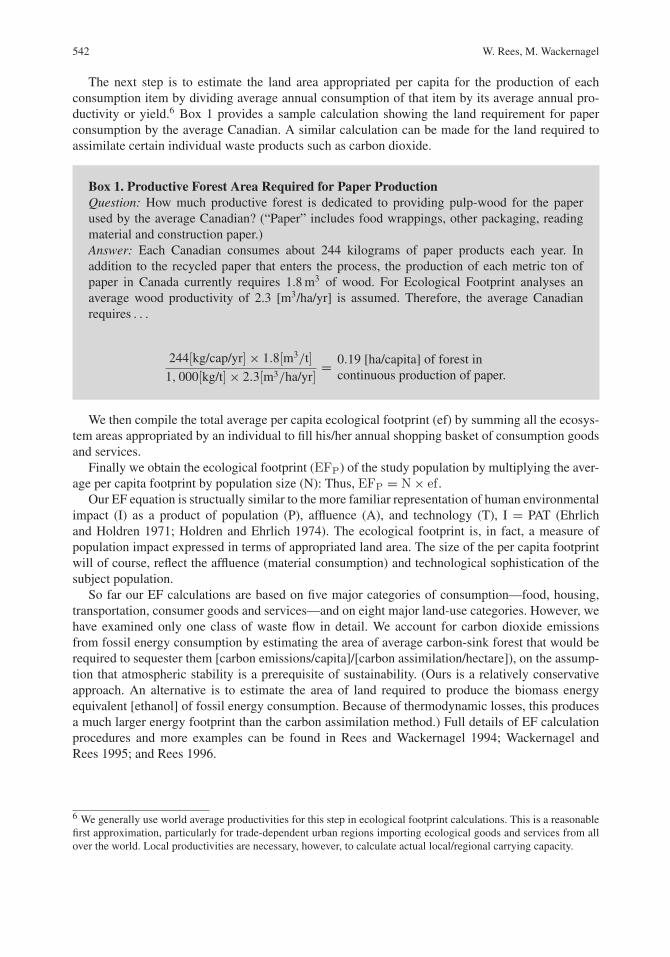
The next step is to estimate the land area appropriated per capita for the production of eachconsumption item by dividing average annual consumption of that item by its average annual pro-ductivity or yield.6 Box 1 provides a sample calculation showing the land requirement for paperconsumption by the average Canadian. A similar calculation can be made for the land required toassimilate certain individual waste products such as carbon dioxide.
Box 1. Productive Forest Area Required for Paper ProductionQuestion: How much productive forest is dedicated to providing pulp-wood for the paperused by the average Canadian? (“Paper” includes food wrappings, other packaging, readingmaterial and construction paper.)Answer: Each Canadian consumes about 244 kilograms of paper products each year. Inaddition to the recycled paper that enters the process, the production of each metric ton ofpaper in Canada currently requires 1.8 m3 of wood. For Ecological Footprint analyses anaverage wood productivity of 2.3 [m3/ha/yr] is assumed. Therefore, the average Canadianrequires . . .
244[kg/cap/yr] × 1.8[m3/t]1, 000[kg/t] × 2.3[m3/ha/yr]
= 0.19 [ha/capita] of forest incontinuous production of paper.
We then compile the total average per capita ecological footprint (ef) by summing all the ecosys-tem areas appropriated by an individual to fill his/her annual shopping basket of consumption goodsand services.
Finally we obtain the ecological footprint (EFP) of the study population by multiplying the aver-age per capita footprint by population size (N): Thus, EFP = N × ef .
Our EF equation is structually similar to the more familiar representation of human environmentalimpact (I) as a product of population (P), affluence (A), and technology (T), I = PAT (Ehrlichand Holdren 1971; Holdren and Ehrlich 1974). The ecological footprint is, in fact, a measure ofpopulation impact expressed in terms of appropriated land area. The size of the per capita footprintwill of course, reflect the affluence (material consumption) and technological sophistication of thesubject population.
So far our EF calculations are based on five major categories of consumption—food, housing,transportation, consumer goods and services—and on eight major land-use categories. However, wehave examined only one class of waste flow in detail. We account for carbon dioxide emissionsfrom fossil energy consumption by estimating the area of average carbon-sink forest that would berequired to sequester them [carbon emissions/capita]/[carbon assimilation/hectare]), on the assump-tion that atmospheric stability is a prerequisite of sustainability. (Ours is a relatively conservativeapproach. An alternative is to estimate the area of land required to produce the biomass energyequivalent [ethanol] of fossil energy consumption. Because of thermodynamic losses, this producesa much larger energy footprint than the carbon assimilation method.) Full details of EF calculationprocedures and more examples can be found in Rees and Wackernagel 1994; Wackernagel andRees 1995; and Rees 1996.
6 We generally use world average productivities for this step in ecological footprint calculations. This is a reasonablefirst approximation, particularly for trade-dependent urban regions importing ecological goods and services from allover the world. Local productivities are necessary, however, to calculate actual local/regional carrying capacity.
Urban Ecological Footprints 543
Strengths and Limitations of Footprint Analysis
The major strength of ecological footprint analysis is its conceptual simplicity. Our method providesan intuitive and visually graphic tool for communicating one of the most important dimensionsof the sustainability dilemma. It aggregates the ecological flows associated with consumption andtranslates them into appropriated land area, an indicator that anyone can understand. The ecologicalfootprint of any defined population can then be compared with the available supply of produc-tive land. Individuals can contrast their personal footprints with their ecological “fair Earthshares,”national footprints can be compared to domestic territories, and the aggregate human footprint canbe compared to the productive capacity of the entire planet.
In cases where the ecological footprint is significantly larger than a secure supply of productiveland, the difference represents a “sustainability gap” and “ecological deficit” (Rees 1996). This isthe amount by which consumption (or the measurable impact of consumption) must be reduced forlongterm ecological sustainability. Thus, unlike ordinary measures of total resource use, ecologicalfootprint analysis provides secondary indices that can be used as policy targets. The question thenbecomes: How large is our ecological deficit and what must be done to reduce it? (We should pointout that humanity’s ecological deficit may be far more important the fiscal deficit, yet the former istotally ignored in the current frenzy to reduce the latter in many countries.)
Although acknowledging its power to communicate a fundamental message, some commenta-tors have suggested that the footprint concept is too simplistic. For example, the model is static,whereas both nature and the economy are dynamic systems. Ecological footprinting therefore can-not directly take into account such things as technological change or the adaptability of socialsystems.
It is true, of course, that footprint analysis is not dynamic modeling and has no predictive capa-bility. However, prediction was never our intent. Ecological footprinting acts, in effect, as an eco-logical camera—each analysis provides a snapshot of our current demands on nature, a portrait ofhow things stand right now under prevailing technology and social values. We believe that this initself is an important contribution. We show that humanity has exceeded carrying capacity and thatsome people contribute significantly more to this ecological “overshoot” than do others. Ecologicalfootprinting also estimates how much we have to reduce our consumption, improve our technology,or change our behavior to achieve sustainability.
Moreover, if used in a time-series study (repeated analytic “snap-shots” over years or decades)ecological footprinting can help monitor progress toward closing the sustainability gap as newtechnlogies are introduced and consumer behavior changes. (After all, even a motion picture is aseries of snap-shots.) Footprint analysis can also be used in static simulation studies to test, forexample, the effect of alternative technologies or settlement patterns on the size of a population’secological footprint (see Walker 1995, for an example). To reiterate, ecological footprint analysis isnot a window on the future, but rather a way to help assess both current reality and alternative “whatif” scenarios on the road to sustainability.
A more substantive criticism of ecological footprinting is that it ignores many other factors at theheart of sustainability. It is certainly true that the ecological footprint does not tell the entire sus-tainability story—indeed, any single index can be misleading (consider the problems with GDP!).In fact, our calculations to date do not even tell the whole consumption story. Only major cate-gories of consumption have been included, and we are only beginning to examine the land areaimplications of waste discharges other than carbon dioxide. This means that our current footprintcalculations are almost certainly significant underestimates of actual ecosystem appropriations andthat improvements in the basic calculations will produce considerably larger footprint estimates. Inshort, improvements that increase the scope of our analyses will add to our sense of urgency but notnecessarily shift the direction of needed policy change.
544 W. Rees, M. Wackernagel
More important, ecological footprinting is precisely that—it provides an index of biophysicalimpacts. It therefore tells us little about the sociopolitical dimensions of the global change crisis.Of equal relevance to achieving sustainability are considerations of political and economic power,the responsiveness of the political process to the ecological imperative, and chronic distributionalinequity which is actually worsening (both within rich countries and between North and South) asthe market economy becomes an increasingly global affair. In fact, our current approach does noteven account for myriad indirect effects of production/consumption such as the disruption of tradi-tional livelihoods and damage to public health, which are often the most interesting local impacts ofexpanding economic activity on the environment. As use of the concept spreads, however, the term“footprint” is increasingly being used to encompass the overall impacts of high-income economieson the developing world (or of cities on the countryside) (see IIED 1995).
None of these limitations detracts from the fundamental message of ecological footprintanalysis—that whatever the distribution of power or wealth, society will ultimately have to dealwith the growing global ecological debt.7 Our original objective in advancing the ecologicalfootprint concept was to bolster our critique of the prevailing development paradigm and to forcethe international development debate beyond its focus on GDP growth to include ecological reality.This much seems to have been achieved. It is therefore gratifying that adherents to the ecologicalfootprint concept are now extending it to claim even more of the conceptual jousting grounds inthe quest for more holistic approaches to sustainability. The following section shows the footprintmodel at work.
Ecological Footprints of Modern Cities and “Developed” Regions
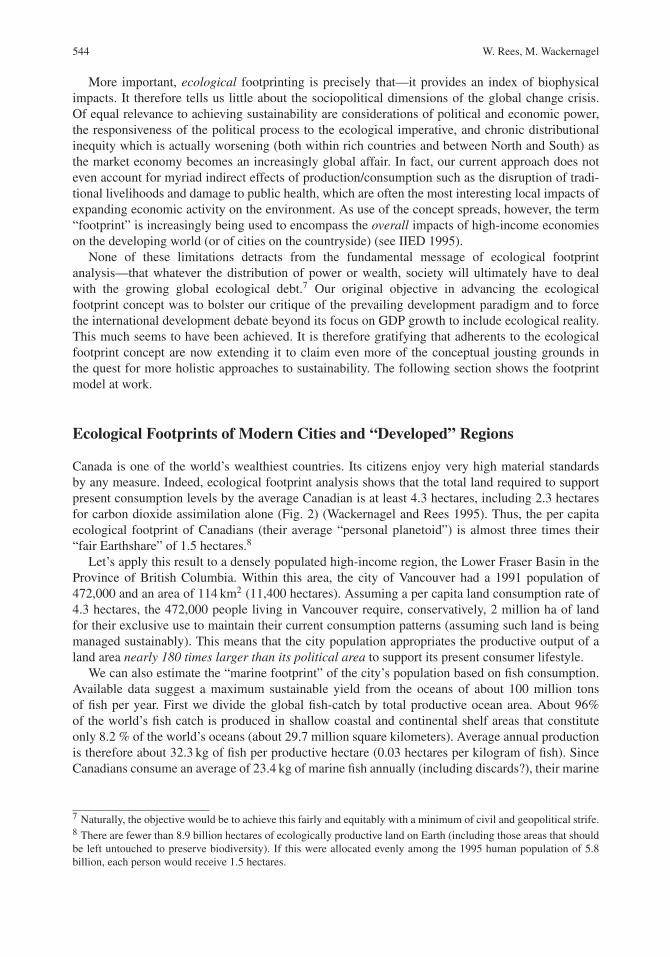
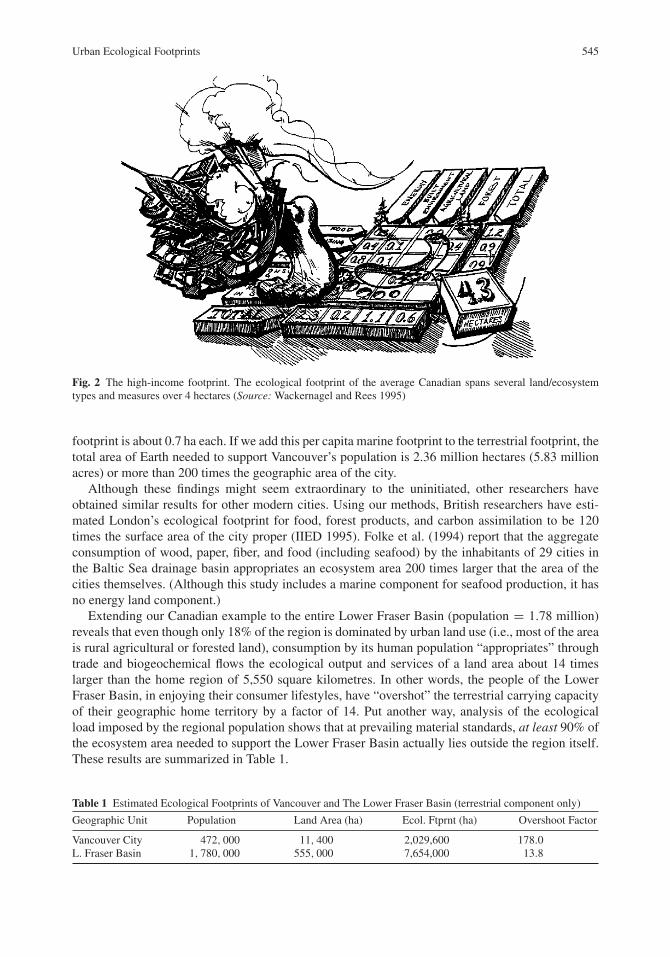
Canada is one of the world’s wealthiest countries. Its citizens enjoy very high material standardsby any measure. Indeed, ecological footprint analysis shows that the total land required to supportpresent consumption levels by the average Canadian is at least 4.3 hectares, including 2.3 hectaresfor carbon dioxide assimilation alone (Fig. 2) (Wackernagel and Rees 1995). Thus, the per capitaecological footprint of Canadians (their average “personal planetoid”) is almost three times their“fair Earthshare” of 1.5 hectares.8
Let’s apply this result to a densely populated high-income region, the Lower Fraser Basin in theProvince of British Columbia. Within this area, the city of Vancouver had a 1991 population of472,000 and an area of 114 km2 (11,400 hectares). Assuming a per capita land consumption rate of4.3 hectares, the 472,000 people living in Vancouver require, conservatively, 2 million ha of landfor their exclusive use to maintain their current consumption patterns (assuming such land is beingmanaged sustainably). This means that the city population appropriates the productive output of aland area nearly 180 times larger than its political area to support its present consumer lifestyle.
We can also estimate the “marine footprint” of the city’s population based on fish consumption.Available data suggest a maximum sustainable yield from the oceans of about 100 million tonsof fish per year. First we divide the global fish-catch by total productive ocean area. About 96%of the world’s fish catch is produced in shallow coastal and continental shelf areas that constituteonly 8.2 % of the world’s oceans (about 29.7 million square kilometers). Average annual productionis therefore about 32.3 kg of fish per productive hectare (0.03 hectares per kilogram of fish). SinceCanadians consume an average of 23.4 kg of marine fish annually (including discards?), their marine
7 Naturally, the objective would be to achieve this fairly and equitably with a minimum of civil and geopolitical strife.8 There are fewer than 8.9 billion hectares of ecologically productive land on Earth (including those areas that shouldbe left untouched to preserve biodiversity). If this were allocated evenly among the 1995 human population of 5.8billion, each person would receive 1.5 hectares.
Urban Ecological Footprints 545
Fig. 2 The high-income footprint. The ecological footprint of the average Canadian spans several land/ecosystemtypes and measures over 4 hectares (Source: Wackernagel and Rees 1995)
footprint is about 0.7 ha each. If we add this per capita marine footprint to the terrestrial footprint, thetotal area of Earth needed to support Vancouver’s population is 2.36 million hectares (5.83 millionacres) or more than 200 times the geographic area of the city.
Although these findings might seem extraordinary to the uninitiated, other researchers haveobtained similar results for other modern cities. Using our methods, British researchers have esti-mated London’s ecological footprint for food, forest products, and carbon assimilation to be 120times the surface area of the city proper (IIED 1995). Folke et al. (1994) report that the aggregateconsumption of wood, paper, fiber, and food (including seafood) by the inhabitants of 29 cities inthe Baltic Sea drainage basin appropriates an ecosystem area 200 times larger that the area of thecities themselves. (Although this study includes a marine component for seafood production, it hasno energy land component.)
Extending our Canadian example to the entire Lower Fraser Basin (population = 1.78 million)reveals that even though only 18% of the region is dominated by urban land use (i.e., most of the areais rural agricultural or forested land), consumption by its human population “appropriates” throughtrade and biogeochemical flows the ecological output and services of a land area about 14 timeslarger than the home region of 5,550 square kilometres. In other words, the people of the LowerFraser Basin, in enjoying their consumer lifestyles, have “overshot” the terrestrial carrying capacityof their geographic home territory by a factor of 14. Put another way, analysis of the ecologicalload imposed by the regional population shows that at prevailing material standards, at least 90% ofthe ecosystem area needed to support the Lower Fraser Basin actually lies outside the region itself.These results are summarized in Table 1.
Table 1 Estimated Ecological Footprints of Vancouver and The Lower Fraser Basin (terrestrial component only)
Geographic Unit Population Land Area (ha) Ecol. Ftprnt (ha) Overshoot Factor
Vancouver City 472, 000 11, 400 2,029,600 178.0L. Fraser Basin 1, 780, 000 555, 000 7,654,000 13.8
546 W. Rees, M. Wackernagel
It seems that the “sustainability” of the Lower Fraser Basin of British Columbia depends onimports of ecologically significant goods and services whose production requires an area elsewhereon Earth vastly larger than the internal area of the region itself. In effect, however healthy the region’seconomy appears to be in monetary terms, the Lower Fraser Basin is running a massive “ecologicaldeficit” with the rest of Canada and the world.
Global Context
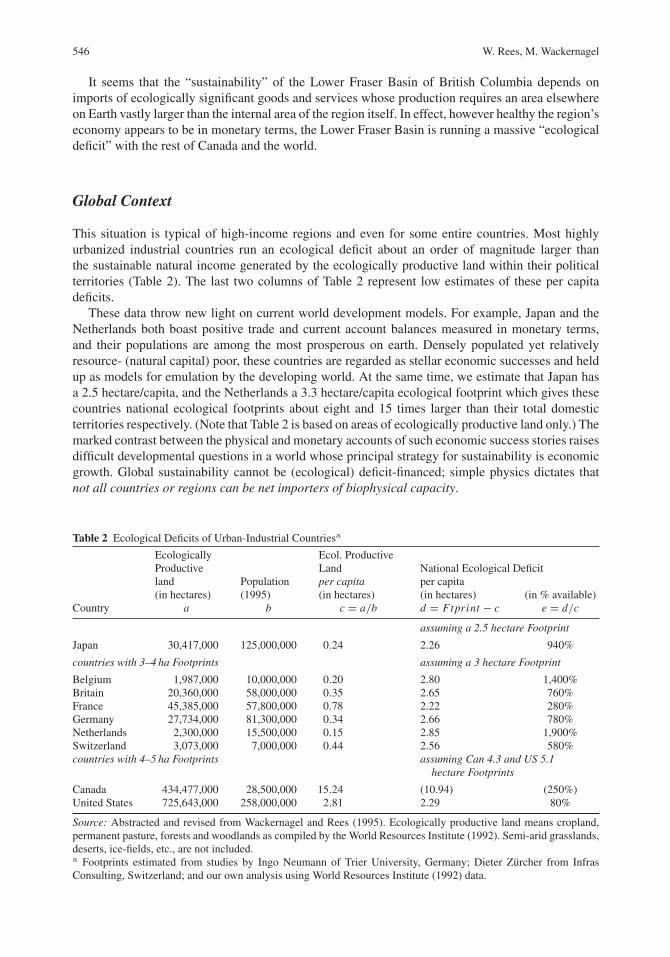
This situation is typical of high-income regions and even for some entire countries. Most highlyurbanized industrial countries run an ecological deficit about an order of magnitude larger thanthe sustainable natural income generated by the ecologically productive land within their politicalterritories (Table 2). The last two columns of Table 2 represent low estimates of these per capitadeficits.
These data throw new light on current world development models. For example, Japan and theNetherlands both boast positive trade and current account balances measured in monetary terms,and their populations are among the most prosperous on earth. Densely populated yet relativelyresource- (natural capital) poor, these countries are regarded as stellar economic successes and heldup as models for emulation by the developing world. At the same time, we estimate that Japan hasa 2.5 hectare/capita, and the Netherlands a 3.3 hectare/capita ecological footprint which gives thesecountries national ecological footprints about eight and 15 times larger than their total domesticterritories respectively. (Note that Table 2 is based on areas of ecologically productive land only.) Themarked contrast between the physical and monetary accounts of such economic success stories raisesdifficult developmental questions in a world whose principal strategy for sustainability is economicgrowth. Global sustainability cannot be (ecological) deficit-financed; simple physics dictates thatnot all countries or regions can be net importers of biophysical capacity.
Table 2 Ecological Deficits of Urban-Industrial Countriesa
EcologicallyProductiveland Population
Ecol. ProductiveLandper capita
National Ecological Deficitper capita
(in hectares) (1995) (in hectares) (in hectares) (in % available)Country a b c = a/b d = Ftprint − c e = d/c
assuming a 2.5 hectare Footprint
Japan 30,417,000 125,000,000 0.24 2.26 940%
countries with 3–4 ha Footprints assuming a 3 hectare Footprint
Belgium 1,987,000 10,000,000 0.20 2.80 1,400%Britain 20,360,000 58,000,000 0.35 2.65 760%France 45,385,000 57,800,000 0.78 2.22 280%Germany 27,734,000 81,300,000 0.34 2.66 780%Netherlands 2,300,000 15,500,000 0.15 2.85 1,900%Switzerland 3,073,000 7,000,000 0.44 2.56 580%countries with 4–5 ha Footprints assuming Can 4.3 and US 5.1
hectare Footprints
Canada 434,477,000 28,500,000 15.24 (10.94) (250%)United States 725,643,000 258,000,000 2.81 2.29 80%
Source: Abstracted and revised from Wackernagel and Rees (1995). Ecologically productive land means cropland,permanent pasture, forests and woodlands as compiled by the World Resources Institute (1992). Semi-arid grasslands,deserts, ice-fields, etc., are not included.a Footprints estimated from studies by Ingo Neumann of Trier University, Germany; Dieter Zürcher from InfrasConsulting, Switzerland; and our own analysis using World Resources Institute (1992) data.
Urban Ecological Footprints 547
It is worth noting in this context that Canada is one of the few high (money) income countriesthat consumes less than its natural income domestically (Table 2). Low in population and rich innatural resources, this country has yet to exceed domestic carrying capacity. However, Canada’snatural capital stocks are being depleted by exports of energy, forest, fish, agricultural products, etc.,to the rest of the world. In short, the apparent surpluses in Canada are being incorporated by tradeinto the ecological footprints of other countries, particularly that of the United States (although theentire Canadian surplus would be insufficient to satisfy the US deficit!). How should such biophys-ical realities be reflected in local and global strategies for ecologically sustainable socioeconomicdevelopment?
Discussion and Conclusions: Cities and Sustainability
Ecological footprint analysis illustrates the fact that as a result of the enormous increase in per capitaenergy and material consumption made possible by (and required by) technology, and universallyincreasing dependencies on trade, the ecological locations of high-density human settlements nolonger coincide with their geographic locations. Twentieth-century cities and industrial regions forsurvival and growth depend on a vast and increasingly global hinterland of ecologically productivelandscapes. Cities necessarily “appropriate” the ecological output and life support functions of dis-tant regions all over the world through commercial trade and natural biogeochemical cycles. Perhapsthe most important insight from this result is that no city or urban region can achieve sustainabilityon its own. Regardless of local land use and environmental policies, a prerequisite for sustainablecities is sustainable use of the global hinterland.
The other side of this dependency coin is the impact urban populations and cities have on ruralenvironments and the ecosphere generally. Combined with rising material standards and the spreadof consumerism, the mass migration of humans to the cities in this century has turned urban indus-trial regions into nodes of intense consumption. The wealthier the city and the more connected tothe rest of the world, the greater the load it is able to impose on the ecosphere through trade andother forms of economic leverage. Seen in this light and contrary to popular wisdom, the seemingdepopulation of many rural areas does not mean they are being abandoned in any ecofunctionalsense. Whereas most of the people may have moved elsewhere, rural lands and ecosystem functionsare being exploited more intensely than ever in the service of newly urbanized human populations.
Cities and the Entropy Law
As noted, the populations of “advanced” high-income countries are 75% or more urban and estimatessuggest that over 50% of the entire human population will be living in urban areas by the end of thecentury. If we accept the Brundtland Commission’s estimate that the wealthy quarter of the world’spopulation consume over three-quarters of the world’s resources (and therefore produce at least75% of the wastes), then the populations of wealthy cities are responsible for about 60% of currentlevels of resource depletion and pollution. The global total contribution from cities is probably 70%or more.
In effect, cities have become entropic black holes drawing in energy and matter from all over theecosphere (and returning all of it in degraded form back to the ecosphere). This relationship is aninevitable expression of the Second Law of Thermodynamics. The second law normally states thatthe entropy of any isolated system increases. That is, available energy spontaneously dissipates, gra-dients disappear, and the system becomes increasingly unstructured and disordered in a inexorableslide toward thermodynamic equilibrium. This is a state in which “nothing happens or can happen”(Ayres 1994).
548 W. Rees, M. Wackernagel
What is often forgotten is that all systems, whether isolated or not, are subject to the same forcesof entropic decay. In other words, any complex differentiated system has a natural tendency to erode,dissipate, and unravel. The reason open, self-organizing systems such as modern cities do not rundown in this way is that they are able to import available energy and material (essergy) from theirhost environments which they use to maintain their internal integrity. Such systems also exportthe resultant entropy (waste and disorder) into their hosts. The second law therefore also suggeststhat all highly-ordered systems can grow and develop (increase their internal order) only “at theexpense of increasing disorder at higher levels in the systems hierarchy” (Schneider and Kay 1992).Because such systems continuously degrade and dissipate available energy and matter, they arecalled “dissipative structures.”
Clearly, cities are prime examples of highly-ordered dissipative structures. At the same time,these nodes of intense economic activity are open sub-systems of the materially closed, nongrowingecosphere. Thus, to grow, or simply to maintain their internal order and structure, cities necessarilyappropriate large quantities of useful energy and material from the ecosphere and “dissipate” anequivalent stream of degraded waste back into it.
This means that in the aggregate, cities (or the human economy) can operate sustainably onlywithin the thermodynamic load-bearing capacity of the ecosphere. Beyond a certain point, the costof material economic growth will be measured by increasing entropy or disorder in the “environ-ment.” We would expect this point (at which consumption by humans exceeds available naturalincome) to be revealed through the continuous depletion of natural capital—reduced biodiversity,fisheries collapse, air/water/land pollution, deforestation, desertification, etc. Such trends are thestuff of headlines today. World Bank ecologist Robert Goodland uses them to argue that “currentthroughout growth in the global economy cannot be sustained” (Goodland 1991). It seems we havealready reached the entropic limits to growth.
This brings us back to our starting premise, that with the onset of global ecological change,the world has reached an historic turning point that requires a conceptual shift from empty-worldto full-world economics (and ecology). Ecological footprint analysis underscores the urgency ofmaking this shift. As noted, the productive land “available” to each person on Earth has decreasedincreasing rapidly with the explosion of human population in this century. Today, there are onlyabout 1.5 hectares of such land for each person, including wilderness areas that probably shouldn’tbe used for any other purpose.
At the same time, the land area appropriated by residents of richer countries has steadilyincreased. The present per capita ecological footprints of North Americans (4–5 ha) represents threetimes their fair share of the Earth’s bounty. By extrapolation, if everyone on Earth lived like theaverage North American, the total land requirement would exceed 26 billion hectares. However thereare fewer than 9 billion hectares of such land on Earth. This means that we would need three suchplanets to support just the present human family. In fact, we estimate that resource consumption andwaste disposal by the wealthy quarter of world’s population alone exceeds global carrying capacityand that total global overshoot is as much as 30% (Wackernagel and Rees 1995). (Again, these areunderestimates based on the assumption that our present land endowment is being used sustainably,which it is not.)
Cities and Global Trade
The structure of trade, as we know it at present, is a curse from the perspective of sustainable development(Haavelmo and Hansen 1991, p. 46).
Acknowledging the energy and material dependence of cities also forces recognition of the city’srole as an engine of economic growth and global trade. According to the conventional view, trade
Urban Ecological Footprints 549
increases both incomes and carrying capacity. Individual trading regions can export local surplusesand thereby earn the foreign exchange needed to pay for imports of locally scarce resources. Henceboth the economy and the population are freed to grow beyond limits that would otherwise beimposed by regional carrying capacity. The fact that 40% of global economic growth today is sus-tained by trade supports this argument.
There are, however, serious flaws in the conventional interpretation. First, trade reduces the mosteffective incentive for resource conservation in any import region, the regional population’s other-wise dependence on local natural capital. For example, the Vancouver region’s seasonal access tocheap agricultural imports from California and Mexico reduces the potential money income fromlocal agricultural land.9 Fraser Valley farmers themselves therefore join the developers in pressingfor conversion of agricultural land to urban uses which produce a higher short-term return. Becauseof trade, the consequent loss of foodlands in the Fraser basin proceeds without immediate penaltyto the local population. Indeed, the latter are actually rewarded in the short-term by the boost tothe local economy! Ironically, then, while appearing to do the opposite, trade actually reduces bothregional and global carrying capacity by facilitating the depletion of the total stock of natural capital.By the time market prices reflect incipient ecological scarcity, it will be too late to take correctiveaction.
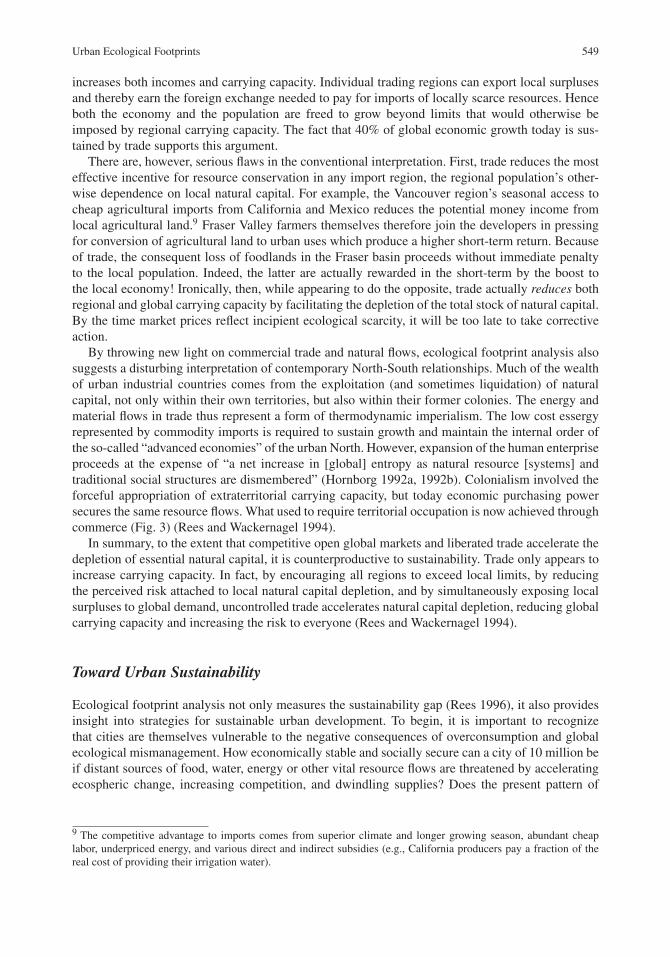
By throwing new light on commercial trade and natural flows, ecological footprint analysis alsosuggests a disturbing interpretation of contemporary North-South relationships. Much of the wealthof urban industrial countries comes from the exploitation (and sometimes liquidation) of naturalcapital, not only within their own territories, but also within their former colonies. The energy andmaterial flows in trade thus represent a form of thermodynamic imperialism. The low cost essergyrepresented by commodity imports is required to sustain growth and maintain the internal order ofthe so-called “advanced economies” of the urban North. However, expansion of the human enterpriseproceeds at the expense of “a net increase in [global] entropy as natural resource [systems] andtraditional social structures are dismembered” (Hornborg 1992a, 1992b). Colonialism involved theforceful appropriation of extraterritorial carrying capacity, but today economic purchasing powersecures the same resource flows. What used to require territorial occupation is now achieved throughcommerce (Fig. 3) (Rees and Wackernagel 1994).
In summary, to the extent that competitive open global markets and liberated trade accelerate thedepletion of essential natural capital, it is counterproductive to sustainability. Trade only appears toincrease carrying capacity. In fact, by encouraging all regions to exceed local limits, by reducingthe perceived risk attached to local natural capital depletion, and by simultaneously exposing localsurpluses to global demand, uncontrolled trade accelerates natural capital depletion, reducing globalcarrying capacity and increasing the risk to everyone (Rees and Wackernagel 1994).
Toward Urban Sustainability
Ecological footprint analysis not only measures the sustainability gap (Rees 1996), it also providesinsight into strategies for sustainable urban development. To begin, it is important to recognizethat cities are themselves vulnerable to the negative consequences of overconsumption and globalecological mismanagement. How economically stable and socially secure can a city of 10 million beif distant sources of food, water, energy or other vital resource flows are threatened by acceleratingecospheric change, increasing competition, and dwindling supplies? Does the present pattern of
9 The competitive advantage to imports comes from superior climate and longer growing season, abundant cheaplabor, underpriced energy, and various direct and indirect subsidies (e.g., California producers pay a fraction of thereal cost of providing their irrigation water).
550 W. Rees, M. Wackernagel
Fig. 3 Ecological inequity. In today’s ecologically overloaded world, we all compete for the finite natural incomeflows produced by the ecosphere. The high money incomes and excessive consumption of affluent countries extendstheir ecological footprints into ecological space that could otherwise be occupied by the poorer nations. Even withincountries, footprint sizes vary significantly as income disparity increases (Source: Wackernagel and Rees 1995)
global development, one that increases interregional dependence on vital natural income flows thatmay be in jeopardy, make ecological or geopolitical sense? If the answer is “no,” or even a cautious“possibly not,” circumstances may already warrant a restoration of balance away from the presentemphasis on global economic integration and interregional dependency toward enhanced ecologicalindependence and greater intraregional self-reliance. (If all regions were in ecological steady-state,the aggregate effect would be global stability.)
To reduce their dependence on external flows, urban regions and whole countries may choose todevelop explicit policies to invest in rehabilitating their own natural capital stocks and to promotethe use of local fisheries, forests, agricultural land, etc. This would increase regional independence

Urban Ecological Footprints 551
thus creating a hedge against rising international demand, global ecological change, and potentiallyreduced productivity elsewhere.
Although greater regional self-reliance is a desirable goal on several grounds, we are not arguingfor regional closure. In any event, self-sufficiency is not in the cards for most modern urban regions.The more important issue before us is to assure urban security and define an appropriate role of citiesin achieving global sustainability. How can we be certain “that the aggregate performance of citiesand urban systems within nations and worldwide is compatible with sustainable development goals”(Mitlan and Satterthwaite 1994) and—we would add—compatible with shrinking global carryingcapacity?
Ecological Pros and Cons of Cities
A major conclusion of ecological footprint analysis and similar studies is that urban policy shouldstrive to minimize the disruption of ecosystems processes and massively reduce the energy and mate-rial consumption, associated with cities. Various authorities share the view of the Business Councilon Sustainable Development that “industrial world reductions in material throughput, energy use,and environmental degradation of over 90% will be required by 2040 to meet the needs of a growingworld population fairly within the planet’s ecological means” (BCSD 1993).
Addressing these issues shows that cities present both unique problems and opportunities. First,the fact that cities concentrate both human populations and resource consumption results in a varietyof ecological impacts that would not occur, or would be less severe, with a more dispersed settle-ment pattern. For example, cities produce locally dangerous levels of various pollutants that mightotherwise safely be dissipated, diluted, and assimilated over a much larger area.
More importantly from the perspective of ecosystems integrity, cities also significantly alternatural biogeochemical cycles of vital nutrients and other chemical resources. Removing peopleand livestock far from the land that supports them prevents the economic recycling of phosphorus,nitrogen, other nutrients, and organic matter back onto farms and forests. As a consequence ofurbanization, local, cyclically integrated ecological production systems have become global, hor-izontally disintegrated, throughput systems. For example, instead of being returned to the land,Vancouver’s daily appropriation of Saskatchewan mineral nutrients goes straight out to sea. As aresult, agricultural soils are degraded (half the natural nutrients and organic matter from much ofCanada’s once-rich prairie soils have been lost in a century of mechanized export agriculture), andwe are forced to substitute nonrenewable artificial fertilizer for the once renewable real thing. Allof this calls for much improved accounting for the hidden costs of cities, of transportation, and ofmechanized agriculture, and a redefinition of economic efficiency to include biophysical factors.
While urban regions certainly disrupt the ecosystems of which they are a part, the sheer concen-tration of population and consumption also gives cities enormous leverage in the quest for globalsustainability. Some of the advantages of urban settlements are as follows (based on Mitlin andSatterthwaite 1994):
� lower costs per capita of providing piped treated water, sewer systems, waste collection, and mostother forms of infrastructure and public amenities;
� greater possibilities for, and a greater range of options for, material recycling, re-use, remanufac-turing, and the specialized skills and enterprises needed to make these things happen;
� high population density, which reduces the per capita demand for occupied land;� great potential through economies of scale, co-generation, and the use of waste process heat from
industry or power plants, to reduce the per capita use of fossil fuel for space-heating;� great potential for reducing (mostly fossil) energy consumption by motor vehicles through walk-
ing, cycling, and public transit.
552 W. Rees, M. Wackernagel
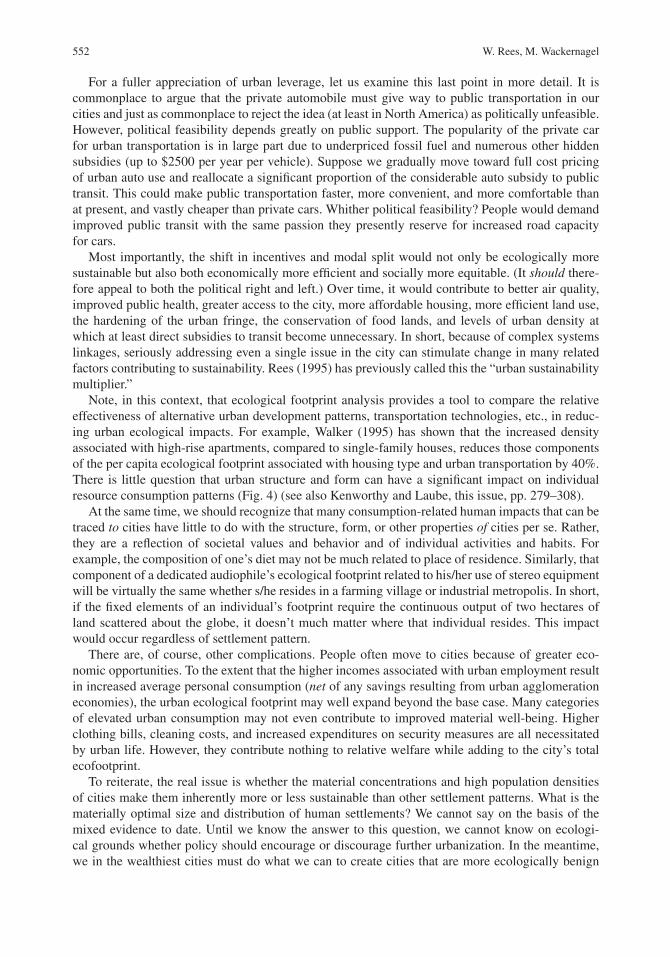
For a fuller appreciation of urban leverage, let us examine this last point in more detail. It iscommonplace to argue that the private automobile must give way to public transportation in ourcities and just as commonplace to reject the idea (at least in North America) as politically unfeasible.However, political feasibility depends greatly on public support. The popularity of the private carfor urban transportation is in large part due to underpriced fossil fuel and numerous other hiddensubsidies (up to $2500 per year per vehicle). Suppose we gradually move toward full cost pricingof urban auto use and reallocate a significant proportion of the considerable auto subsidy to publictransit. This could make public transportation faster, more convenient, and more comfortable thanat present, and vastly cheaper than private cars. Whither political feasibility? People would demandimproved public transit with the same passion they presently reserve for increased road capacityfor cars.
Most importantly, the shift in incentives and modal split would not only be ecologically moresustainable but also both economically more efficient and socially more equitable. (It should there-fore appeal to both the political right and left.) Over time, it would contribute to better air quality,improved public health, greater access to the city, more affordable housing, more efficient land use,the hardening of the urban fringe, the conservation of food lands, and levels of urban density atwhich at least direct subsidies to transit become unnecessary. In short, because of complex systemslinkages, seriously addressing even a single issue in the city can stimulate change in many relatedfactors contributing to sustainability. Rees (1995) has previously called this the “urban sustainabilitymultiplier.”
Note, in this context, that ecological footprint analysis provides a tool to compare the relativeeffectiveness of alternative urban development patterns, transportation technologies, etc., in reduc-ing urban ecological impacts. For example, Walker (1995) has shown that the increased densityassociated with high-rise apartments, compared to single-family houses, reduces those componentsof the per capita ecological footprint associated with housing type and urban transportation by 40%.There is little question that urban structure and form can have a significant impact on individualresource consumption patterns (Fig. 4) (see also Kenworthy and Laube, this issue, pp. 279–308).
At the same time, we should recognize that many consumption-related human impacts that can betraced to cities have little to do with the structure, form, or other properties of cities per se. Rather,they are a reflection of societal values and behavior and of individual activities and habits. Forexample, the composition of one’s diet may not be much related to place of residence. Similarly, thatcomponent of a dedicated audiophile’s ecological footprint related to his/her use of stereo equipmentwill be virtually the same whether s/he resides in a farming village or industrial metropolis. In short,if the fixed elements of an individual’s footprint require the continuous output of two hectares ofland scattered about the globe, it doesn’t much matter where that individual resides. This impactwould occur regardless of settlement pattern.
There are, of course, other complications. People often move to cities because of greater eco-nomic opportunities. To the extent that the higher incomes associated with urban employment resultin increased average personal consumption (net of any savings resulting from urban agglomerationeconomies), the urban ecological footprint may well expand beyond the base case. Many categoriesof elevated urban consumption may not even contribute to improved material well-being. Higherclothing bills, cleaning costs, and increased expenditures on security measures are all necessitatedby urban life. However, they contribute nothing to relative welfare while adding to the city’s totalecofootprint.
To reiterate, the real issue is whether the material concentrations and high population densitiesof cities make them inherently more or less sustainable than other settlement patterns. What is thematerially optimal size and distribution of human settlements? We cannot say on the basis of themixed evidence to date. Until we know the answer to this question, we cannot know on ecologi-cal grounds whether policy should encourage or discourage further urbanization. In the meantime,we in the wealthiest cities must do what we can to create cities that are more ecologically benign
Urban Ecological Footprints 553
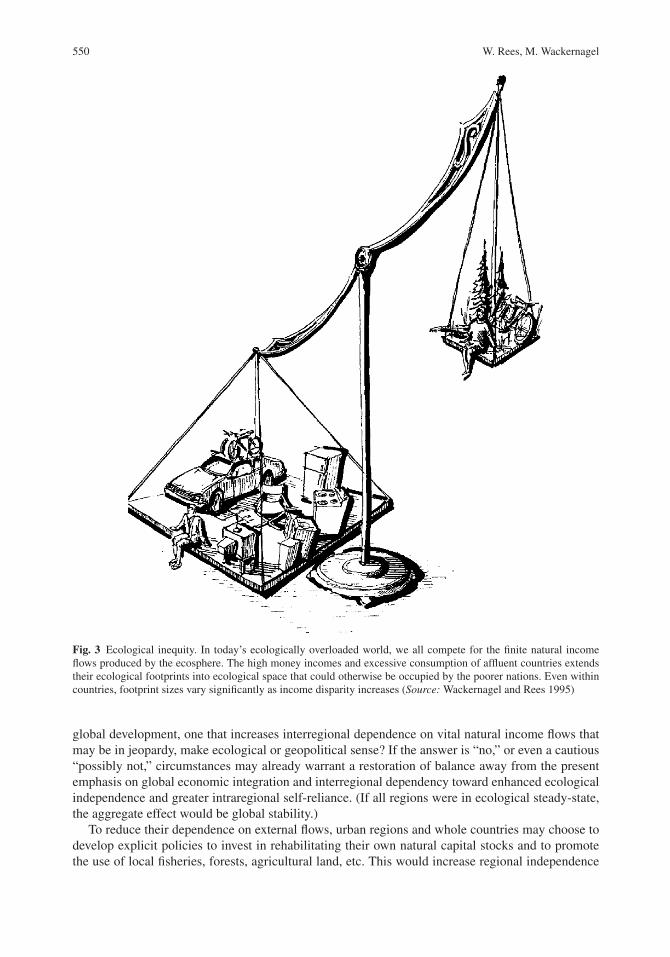
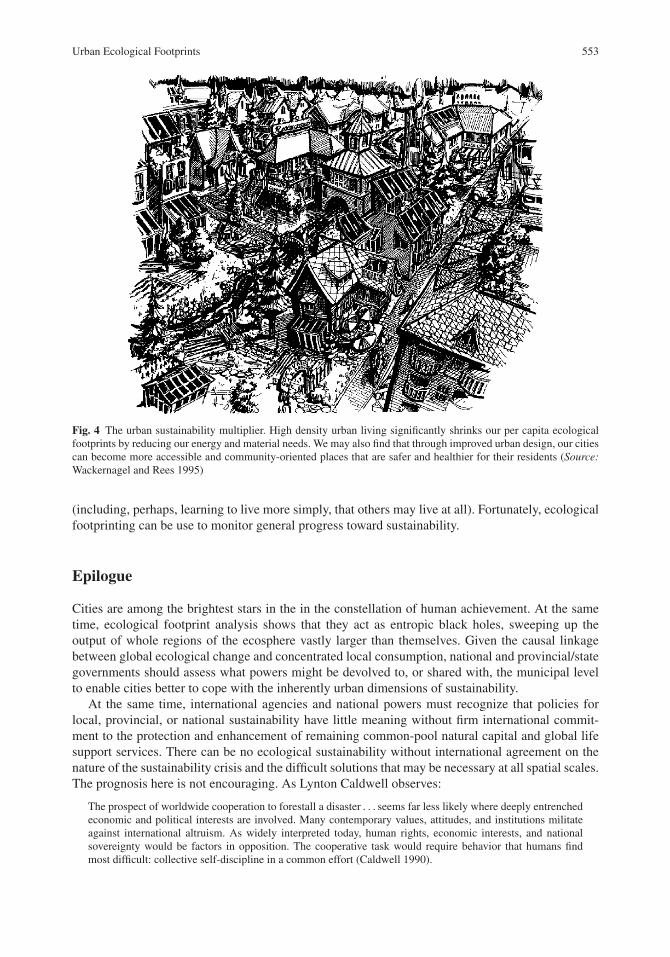
Fig. 4 The urban sustainability multiplier. High density urban living significantly shrinks our per capita ecologicalfootprints by reducing our energy and material needs. We may also find that through improved urban design, our citiescan become more accessible and community-oriented places that are safer and healthier for their residents (Source:Wackernagel and Rees 1995)
(including, perhaps, learning to live more simply, that others may live at all). Fortunately, ecologicalfootprinting can be use to monitor general progress toward sustainability.
Epilogue
Cities are among the brightest stars in the in the constellation of human achievement. At the sametime, ecological footprint analysis shows that they act as entropic black holes, sweeping up theoutput of whole regions of the ecosphere vastly larger than themselves. Given the causal linkagebetween global ecological change and concentrated local consumption, national and provincial/stategovernments should assess what powers might be devolved to, or shared with, the municipal levelto enable cities better to cope with the inherently urban dimensions of sustainability.
At the same time, international agencies and national powers must recognize that policies forlocal, provincial, or national sustainability have little meaning without firm international commit-ment to the protection and enhancement of remaining common-pool natural capital and global lifesupport services. There can be no ecological sustainability without international agreement on thenature of the sustainability crisis and the difficult solutions that may be necessary at all spatial scales.The prognosis here is not encouraging. As Lynton Caldwell observes:
The prospect of worldwide cooperation to forestall a disaster . . . seems far less likely where deeply entrenchedeconomic and political interests are involved. Many contemporary values, attitudes, and institutions militateagainst international altruism. As widely interpreted today, human rights, economic interests, and nationalsovereignty would be factors in opposition. The cooperative task would require behavior that humans findmost difficult: collective self-discipline in a common effort (Caldwell 1990).
554 W. Rees, M. Wackernagel
This statement suggests that as a result of political inertia, the world may well simply stay itspresent development course in the blind hope that things will all work out. If so, and the analysispresented in this article is correct, humans may well become the first species to document in exquisitedetail the factors leading to its own demise (without acting to prevent it).
Acknowledgments Our work on ecological footprinting was supported by a Canadian Tri-Council EcoResearchGrant to the University of British Columbia in which Rees is a co-investigator. The sections on ecological footprintanalysis are adapted from Rees (1996) and Wackernagel and Rees (1995). The drawings in Figures 1–4 were preparedby Phil Testamale.
References
Ayres, R.U. 1994. Information, Entropy and Progress: A New Evolutionary Paradigm. Woodbury, NY: AIP Press.BCSD. 1993. Getting Eco-Efficient. Report of the BCSD First Antwerp Eco-Efficiency Workshop, November 1993.
Geneva: Business Council for Sustainable Development.Caldwell, L.K. 1990. Between Two Worlds: Science, the Environmental Movement, and Policy Choice. Cambridge,
UK: Cambridge University Press.Catton, W. 1986. Carrying capacity and the limits to freedom. (18 August, 1986). Paper prepared for Social Ecology
Session 1, New Delhi, India: XI World Congress of Sociology.Costanza, R., and Daly, H. 1992. Natural capital and sustainable development. Conservation Biology 1:37–45.Daly, H. 1986. Comments on “Population Growth and Economic Development.” Population and Development Review
12:583–585.Daly, H. 1990. Sustainable development: From concept and theory towards operational principles. In Steady State
Economics, 2nd ed., Washington: Island Press.Daly, H. 1991. From empty world economics to full world economics: Recognizing an historic turning point
in economic development. In Environmentally Sustainable Economic Development: Building or Brundtland,R. Goodland, H. Daly, S. El Serafy, and B. von Droste (eds). Paris: UNESCO.
Ecological Economics 15:2. Special “Forum” on economic growth, carrying capacity, and the environment.Ehrlich, P., and Holdren, J. 1971. Impact of population growth. Science 171:1212.Folke, C., Larsson, J., and Sweitzer, J. 1994. Renewable resource appropriation by cities. Paper presented at “Down To
Earth: Practical Applications of Ecological Economics,” Third International Meeting of the International Societyfor Ecological Economics, San Jose, Costa Rica, October 24–28.
Goodland, R. 1991. The case that the world has reached limits. In Environmentally Sustainable Economic Develop-ment: Building on Brundtland, R. Goodland, H. Daly, S. El Serafy, and B. Von Droste (eds). Paris: UNESCO.
Haavelmo, T., and Hansen, S. 1991. On the strategy of trying to reduce economic inequality by expanding the scale ofhuman activity. In Environmentally Sustainable Ecological Development: Building on Brundtland, R. Goodland,H. Daly, S. El Serafy, and B. von Droste, (eds). Paris: UNESCO
Holdren, J., and Ehrlich, P. 1974. Human population and the global environment. American Science 62:282–292.Hornborg, A. 1992a. Machine fetishism, value, and the image of unlimited goods: Toward a thermodynamics of
imperialism. Man 27:1:1–18.Hornborg, A. 1992b. Codifying complexity: Towards an economy of incommensurable values. Paper presented to the
Second Meeting of the International Society for Ecological Economics (Investing in Natural Capital). Stockholm,August 3–6.
IIED. 1995. Citizen Action to Lighten Britain’s Ecological Footprint. A report prepared by the International Institutefor Environment and Development for the UK Department of the Environment. London: International Institute forEnvironment and Development.
Mitlin, D., and Satterthwaite, D. 1994. Cities and Sustainable Development. Background paper prepared for “Globalforum ’94,” Manchester, June 24–28. London: International Institute for Environment and Development.
Pauly, D., and Christensen, V. 1995. Primary production required to sustain global fisheries. Nature 374:255–257.Pearce, D. 1994. Valuing the Environment: Past Practice, Future Prospect. CSERGE Working Paper PA 94-02.
London: University College Centre for Social and Economic Research on the Global Environment.Pearce, D., and Atkinson, G. 1993. Capital theory and the measurement of sustainable development: An indicator of
weak sustainability. Ecological Economics 8:103–108.Pearce, D., Markandya, A., and Barbier, E. 1989. Blueprint for a Green Economy, London: Earthscan Publications.Rees, W. 1990. Sustainable Development and the Biosphere, Teilhard Studies Number 23. American Teilhard Asso-
ciation for the Study of Man, or: The ecology of sustainable development. The Ecologist 20(1):18–23.
Urban Ecological Footprints 555
Rees, W. 1992. Ecological footprints and appropriated carrying capacity: What urban economics leaves out. Environ-ment and Urbanization 4(2):121–130.
Rees, W. 1995. Achieving sustainability: Reform or transformation? Journal of Planning Literature 9:343–361.Rees, W. 1996. Revisiting carrying capacity: Area-based indicators of sustainability. Population and Environment
17(3):195–215.Rees, W.E., and Wackernagel, M. 1994. Ecological footprints and appropriated carrying capacity: Measuring the
natural capital requirements of the human economy. In Investing in Natural Capital: The Ecological EconomicsApproach to Sustainability, A-M. Jansson, M. Hammer, C. Folke, and R. Costanza (eds). Washington: Island Press.
Schneider, E., and Kay, J. 1992. Life as a manifestation of the second law of thermodynamics. Preprint from: Advancesin Mathematics and Computers in Medicine, Waterloo, Ont.: University of Waterloo Faculty of EnvironmentalStudies, Working Paper Series.
Solow, R. 1986. On the intergenerational allocation of natural resources. Scandinavian Journal of Economics 88:1.Sterrer, W. 1993. Human economics: A non-human perspective. Ecological Economics 7:183–202.Victor, P., Hanna, E., and Kubursi, A. 1995. How strong is weak sustainability? Economie Appliquée XLVIII:75–94.Victor, Peter A. 1991. Indicators of sustainable development: Some lessons from capital theory. Ecological Economics
4:191–213.Vitousek, P. 1994. Beyond global warming: Ecology and global change. Ecology 75(7):1861–1876.Vitousek, P., Ehrlich, P., Ehrlich, A., and Matson, P. 1986. Human appropriation of the products of photosynthesis.
BioScience 36:368–374.Wackernagel, M., and Rees, W. 1995. Our Ecological Footprint: Reducing Human Impact on the Earth. Gabriola
Island, BC, and Philadelphia, PA: New Society Publishers.Walker, L. 1995. The Influence of Dwelling Type and Residential Density on the Appropriated Carrying Capacity of
Canadian Households, Unpublished MSc Thesis. Vancouver: UBC School of Community and Regional Planning.Wilson, E.O. 1988. The current state of biological diversity. In: Biodiversity, E.O. Wilson (ed). Washington, DC:
National Academy Press.World Resources Institute. 1992. World Resources 1992–93, New York: Oxford University Press.