urban agriculture, price ,and food security in
TRANSCRIPT

Munich Personal RePEc Archive
Urban Agriculture, Price
Volatility.Drought ,And Food Security In
Developing Countries.
Jatta, Sylvester
University of Rome "Tor Vergata".
25 April 2013
Online at https://mpra.ub.uni-muenchen.de/46544/
MPRA Paper No. 46544, posted 27 Apr 2013 10:29 UTC
1
URBAN AGRICULTURE, PRICE VOLATILITY. DROUGHT, AND FOOD SECURITY IN DEVELOPING COUNTRIES Abstract Urban agriculture may have an important role to play in addressing food insecurity problems, which are bound to become increasingly vital with the secular trends towards the urbanization of poverty and of population in developing countries. Our understanding of the importance, and food security implications of urban agriculture is however plagued by a lack of high quality, reliable data. While studies based on survey research data do exists for several major cities, much of the evidence is still qualitative if not anecdotal. Using a recently created data set bringing together comparable, nationally representative household survey data for 15 developing or transition countries, this paper analyzes in a comparative international perspective the importance of urban agriculture for the urban poor and food insecure. On the one hand, the potential for urban agriculture to play a substantial role in urban poverty and food insecurity reduction should not be overemphasized, as its share in income and overall agricultural production is often quite limited. On the other hand, though, its role should also not be too easily dismissed, particularly in much of Africa agriculture provides a substantial share of income for the urban poor, and for those groups of households for whom it constitutes an important source of livelihood. We also find fairly consistent evidence of a statistical association between engagement in urban agriculture and dietary adequacy indicators. Keywords: Urban agriculture; Food security; Nutrition, Household surveys 1.Introduction Urban agriculture (UA) is defined as the production of crops and livestock within cities and towns. According to some accounts, 200 million people are employed in urban farming and related enterprises, contributing to the food supply of 800 million urban dwellers (UNDP,1996) In African countries 40% of urban dwellers are said to be engaged in some sort of agricultural activity and this percentage rises to 50% in Latin American countries (see studies quoted in Ruel et al .(1998) If these numbers are accurate (and they may well not be, as we discuss in this paper ) urban agriculture may have an important role to play in addressing urban food insecurity problems, which are bound to become increasingly important with the secular trend towards the urbanization of poverty and of the overall population in developing countries. Ravallion et al. (2007) estimate that about one quarter of the developing countries’ poor live in urban areas, but also that poverty is becoming more urban, and that the poor are urbanizing faster than the population as a whole. The recent world food price crisis has rendered the importance of understanding and confronting the causes of food insecurity of the urban poor even more apparent. Poor urban dwellers, being largely net food buyers and depending mostly on markets for their food suppliers, are particularly vulnerable to adverse food price shocks, and are consistently the group in society that suffers most from higher food prices (25) and (Dessus et al., 2008). Analyzing the extent to which urban agriculture might help shield the rural and urban poor from some of these shocks becomes therefore a topical policy question.
2
Our understanding of the importance, nature and food security implications of urban agriculture however hindered by a lack of good quality, reliable data, while studies based on survey data do exist for several major cities, much of the evidence is still qualitative if not anecdotal. This paper attempts to fill some of the key research gaps in this area, using a recently created dataset bringing together comparable nationally representative household survey data for 15 developing countries. Taking advantage of the wealth of data, this paper analyzes, in a comparative international perspective, the importance of urban agriculture for the urban poor and their food security. This paper sets out to address two basis research questions:(i) what is the magnitude of urban and of rural agriculture, both in terms of households engaged in agricultural activities and in terms of income derived from it, and (ii) is there evidence of any significant relationship between urban agriculture and household food security, dietary diversity and calorie intake. After a brief review of the literature (Section ‘’The importance and the role rural agriculture :facts and artifacts. A brief review of the literature ‘’), and a discussion of data and definitions, this paper sets out to quantify (Section “Opening the urban agriculture black box: what the data say’’) the importance of rural agricultural in terms of rural households ‘participation in agricultural activities, the share of income and rural households generate from farming (in particular with reference to the poor); and the relative importance of crop versus livestock production. In section “Urban agriculture and food security ‘’, both descriptive statistics and multivariate analysis are used to gauge how participation in urban agriculture impacts on dietary diversity and calorie intake. The key findings and policy conclusions of this paper are briefly outlined in the final Section: The importance and role of urban agriculture. 2.Characterizing urban and rural agriculture In this paper urban agriculture is defined as the production of agricultural goods by urban residents, according to the official definition of the urban space utilized by the surveys we work with. Our definition is eminently driven by the definition of rurality adopted by national governments and reflected in our dataset and we do not deal with the conceptual definitional issues discussed for instance by (FAO, 1996) and (Ellis and Sumbergs 1998). The two main problems with our data, which will be explained in following section are (i) the comparability of the definition of rural and urban across countries, and (ii) that we have information on where the household resides, not necessarily on where their agricultural production is located. In that sense we should be strictly speaking of ‘’agriculture practiced by urban households” But having made those caveats, we will for simplicity stick to the standard expression ‘urban agriculture.’.1 One of the aims of this paper is to aim to a rigorous quantification of the size of urban agriculture in a reasonable large cross-section-of countries, responding to the need for more efforts in this direction expressed by several of the authors who have contributed to this literature Egal et. al. (2001) and Ellis and Sumberg (1998) . Possible the most widely quoted claim concerning urban agriculture is ‘’ the United Nations Development Programme estimates that 8000 million people are engaged in Urban Agriculture world-wide ‘’ (Mougeot(2000) , and see also Armar –Klemesu (2001) and Nelson (2001)). Tracing this source background in time we arrived at UNDP

3
(1996). Their table 2.1 reports the following estimates: 800 million people actively engaged in urban agriculture, of which 200 million produce goods for market sale, with a full-time jobequivalent estimate in production and processing of 150 million jobs. The source of the table is however ‘’estimates by by the Urban agriculture Network based on the authors’ experience and observations and extrapolation from data’’. The authors also caution that their intent is simply to ‘’present a thumbnail sketch’’ and that a more systematic estimation would be needed. Unfortunately many of their readers and critics have overlooked this caveat and the figures are frequently quoted as hard evidence. This may be partly due to the fact that one substantial strand ofthe literature on urban agriculture is driven by advocacy, more than by analytical rigor (Ellis and Sumberg, 1998). A very different figure is quoted by FA0 (1996), which states (ironically quoting again a UNDP publication) that 100 million people are estimated to earn some income directly from urban farming (one eighth of the 800 million urban agricultural producers and one half of the 200 million commercial urban farmers mentioned above). Rigorous quantifications are in fact available, but are mostly case studies. Reviews of these studies can be found in [Egziaber et al.], [FAO, 1996], [Ellis and Sumberg, 1998] and [23]. An annotated bibliography of 170 pages compiled by Sida and ETC 2003 also provides an interesting overview of the available figures as well as of the magnitude and directions in which the urban agriculture literature has expanded. Figures vary widely between and within countries and regions, and differences indefinitions and methodologies compound the uncertainty. 3.Urban Agriculture, livelihood and food security One major theme of the literature on urban/rural agriculture is the discussion of how it can contribute to the food security and nutrition of cities as a whole, and of the households that are engaged in farming within urban cities. One distinction that is often made in the literature refers to the extent to which urban households that engage in agriculture have some degree of market orientation or are purely producing agricultural goods for their own consumption. There seems to be a consensus, based on case study reviews that the direct food security purpose prevails, but that a substantial number of urban farmers also sell their produce on the market, and also more in Latin America than in Africa( [10] and [Eliis and Sumberg, 1998). There are a number of ways through which urban/ rural and urban agricultural can, in principle, have an impact on urban food security. At the household level, urban and ruaral agriculture can be a source of income, can provide direct access to a large number of nutritionally rich food (vegetables, fruit, meat and a more varied diet, can increase the stability of household food consumption against seasonality or other temporary shortages, and can increase the time mothers spend caring for their children, as opposed to non- agricultural activities that are more likely to be located further away from home ([10], Maxwell et al., 1998], [1] and Egal et al, 2001]).There is also some evidence based on case studies, that it is the poor households that are mostly engaged in urban agricultural, although not necessarily the poorest, which may lack access to land (Ruel et al,.,1998) Moving beyond the household to a more aggregate level, urban agriculture can account for an important share of the production of some foods, particularly the more perishable ones such as vegetables and milk, and there is evidence that this is indeed the case in several of the case studies mentioned above. Despite the relatively large number of students that have looked at the link between rural and urban agriculture and food security, the amount of quantitative work that has been published is

4
surprisingly limited . We could only identify one paper (Maxwell et al. 1998) that explored this link using a multivariate framework . These results based on data from Kampala , indicate that there is indeed an impact of rural urban agriculture on child nutrition status, which is an outcome indicator of food and nutrition security. Also farming plays and important role in the livelihoods of developing countries households. More than 85% of rural households in developing countries grow crops. Rural households in developing countries tends to be semi-subsistent homesteads engaged in crop and livestock production for home consumption and commercial purposes, while heavily dependent on remittances from employed family members. Farming activities in the rural areas therefore are crucial in securing the livelihoods of the population. Farming practices rely on rainy seasons usually from September to March. Rice is the dominant crop, taking up 86% of the area planted in developing countries. Crop failure, caused by drought is becoming more common, making household vulnerable to food insecurity. Virtually all households that are engaged in farming activities use family labour. It can be assumed therefore that illness and death would affect the farming decisions and activities of rural households. The escalating tropical disease combined with the recurrent drought will have an impact on food security.. Tropical disease was declared a national disaster in tropical developing countries and therefore governments declared a state of national emergency over drought, tropical disease and poverty. For the past three cropping season, developing countries have experienced poor rains leading to shortfalls in food production, particularly in the rural areas. The food situation in developing countries varies by agro-ecological zone. The country vulnerability assessment for every year, found that the worst affected areas would incur income and food deficits and were rural areas. The least affected areas were in the urban areas and were going to incur less deficit.The assessment also revealed that 153,000 people would require food assistant during the dry seasons and that this number would increase to 265,000 during winter. The rainfall season for the current cropping seasons has continued to be erratic, indicating another year of below average harvests and complete crop failure in some areas. The assessment also noted that the tropical disease pandemic was having a major impact on nutrition, food security and agricultural . Also in the mid 1970s as rapidly increasing price caused a global food crisis , food security emerged as a concept. Attention focused first on foods availability but then quickly moved to food access and food use and, most recently to the human right to the adequate food. The international Covenant on Economic, Social and Cultural Rights, ratified by 153 states, obligates these states to progressively realize the right to food. The commonly accepted definition of food security is as follows: when all the people, at all times have physical, social, and economic access to sufficient, safe and nutritious food to meet their dietary needs and food preferences for an active and healthy life. The chronically food insecure never have enough to eat. The seasonally food insecure fall below adequate consumption levels in the lean season, and the transitory food insecure fall below adequate consumption threshold as a result of an economic or natural shock such as a drought, sometimes with long lasting consequences. Investments in agriculture are important to increase food security. The channels are complex and multiple. Rising productivity increases rural incomes and lowers food prices, making food more accessible to the poor and other investments such as improved irrigation and drought tolerant crops reduce price and income variability by mitigating the impact of drought. Productivity gains are key to food security in countries with foreign exchange shortage. or limited infrastructure to import
5
food. The same applies to household with poor access to food markets. Nutritionally improved crops give access to better diets, in particular through biofortification which improves crop nutrients content. The contribution that agriculture makes to food security needs to be complimented by medium-term programmes to raise incomes of the poor, as well as insurance and safety nets including food aid to protect the poor. 4.Secure world, insecure household The world is generally food secure, producing enough food to meet the dietary needs of todays global population although future global food security should not be taken for granted because of uncertainties from growing resource and climate change. Yet 850 million people remain undernourished. According , the first Millennium Development Goal includes the target of halving hunger as tracked by the measure of undernourishment given by the Food and Agricultural Organization of the UN (FAO) . The highest incidence of undernourishment is in Sub-Saharan Africa, where one in every three persons suffer from chronic hunger. The greatest number of undernourished is in South Asia (299 million closely followed by East Asia (225 million). East Asia has reduced the prevalence of under nourishment in the past decade by more than 3 percent a year and South Asia by 1.7 percent a year, but the failure to reduce the absolute number undernourished remains a cause for concern. In the 1970s 37 million people were removed from the ranks of the undernourished, 100 million in the 1980s, only 3 million were removed. What accounts for these millions of food insecure individuals?. Food security depends on adequate and stable food availability, access to adequate and appropriate food, and proper use and good health to ensure that individual consumers enjoy the full nutritional benefits of available, accessible food. Availability is necessary but not enough to ensure access which is necessary but not enough for effective use. 5.Food availability producing enough to eat The price increases in the mid 1970s world food crises were exacerbated by low foreign exchange reserves, limiting food importation in many food-deficits countries. This rise in prices prompted some countries to look inward, striving for food sufficiency through domestic production . But today with deeper international markets, low real prices and more countries with convertible prices and exchange rates trade can stabilize food availability and prices for most countries. And most countries have diversified their export base, increasing their capacity to import. However food availability is still at risk in some agriculture-based countries. Many countries have declining domestic production per capita of food staples. Burundi, Ethiopia, Ethiopia, Kenya, Madasgascar, Nigeria, Sudan, Tanzania, and Zambia all had negative per capita annual growth rates in staple food of -1.0 to -1.7 percent from1995 to 2004. In addition staple food production in many agriculture-based countries is largely rain fed and experiences large fluctuations caused by climatic variability. In Sudan, for example, the coefficient of variation of domestic stable food production is 25 percent. This means that a shortfall of at least 25 percent of average production occurs, on average, every six years. Many other countries have similarly high coefficients: Niger and Malawi at 18 percent; Ruanda; at 15 percent and Burkina Faso, Chad, Kenya, Uganda, and the Republic of Yemen above 10%.

6
Stagnation or decline in domestic production and large fluctuation clearly raise a potential problem of food availability at the national level. Can this problem be addressed through imports?. In many countries the answer is. In other countries, however the main staples consumed have a low degree of tradability and are barely traded internationally. Poor infrastructure implies high costs for food to reach isolated areas, even when the capital city and coastal cities are well served by international markets. Beyond tradability issues with adequate infrastructure and internationally traded staples, low foreign exchange availability often limits the capacity to import. Consider the case of Ethiopia that would import on average 8% of its staple food consumption (assuming no food aid) to maintain current levels. Additionally, a 9% shortfall in production, which occurs on average every six years, could only be compensated by a doubling of imports. Many agricultural countries are net importers of food staples, importing on average 14% of their total consumption over the past 10 years, but reaching high dependency levels of more than 40% in Guinea-Bissau, Haiti and the Republic of Yemen. With such levels of dependency with food imports often representing more than 20% of the available foreign exchange, world price fluctuations place additional strain on import capacity and therefore domestic food availability. World price variability remains high, with a coefficient of variation of around 20%.Because of the low price elasticity of demand for food staples and the thinness of markets. Problems in food availability (from low domestic production or lack of imports) translates intolarge spikes in domestic prices and reduction in real incomes of poor consumers. Even in countries that engage in trade, transportation and marketing costs results in a large wedge between import and export parity within which domestic prices can fluctuate without triggering trade. Price variability, which is already high even in capital cities with mostly liberalized markets, is exacerbated in inland more remote regions. 6.FOOD ACCESS ---HAVING ENOUGH TO EAT But for most malnourished people, the lack of access to food is a greater problem than food availability. Nobel laureate Amartya Sen famously wrote that ‘’starvation is a matter of some people not having enough food to eat, and not a matter of there being not enough food to eat’’. The irony is that most of the food insecure live in rural areas where food is produced, yet they are net food buyers rather than sellers. Poverty constrains their access to food in the marketplace. According to the UN Hunger Task Force about half of the hungry are smallholders, a fifth are landless and a tenth agro-pastoralists, fisherfolk, and forest users. The remaining fifth live in urban areas. Today, agriculture’s ability to generate income for the poor, particularly women is more important for food security than its ability to increase local food supplies. Women, more than men spend their income on food. In Guatemala, the amount spent on food in households whose profits from non-traditional agricultural exports were controlled by women was double that of households whose men controlled the profits. India has moved from food deficits to food surpluses reducing, poverty significantly and reaching a per capita income higher than that in most of Sub-Saharan Africa. Yet it remains hometo 210 million undernourished people and 39 percent of the world’s underweight children. Bangladesh, India and Nepal occupy three of the top four positions in the global ranking of the

7
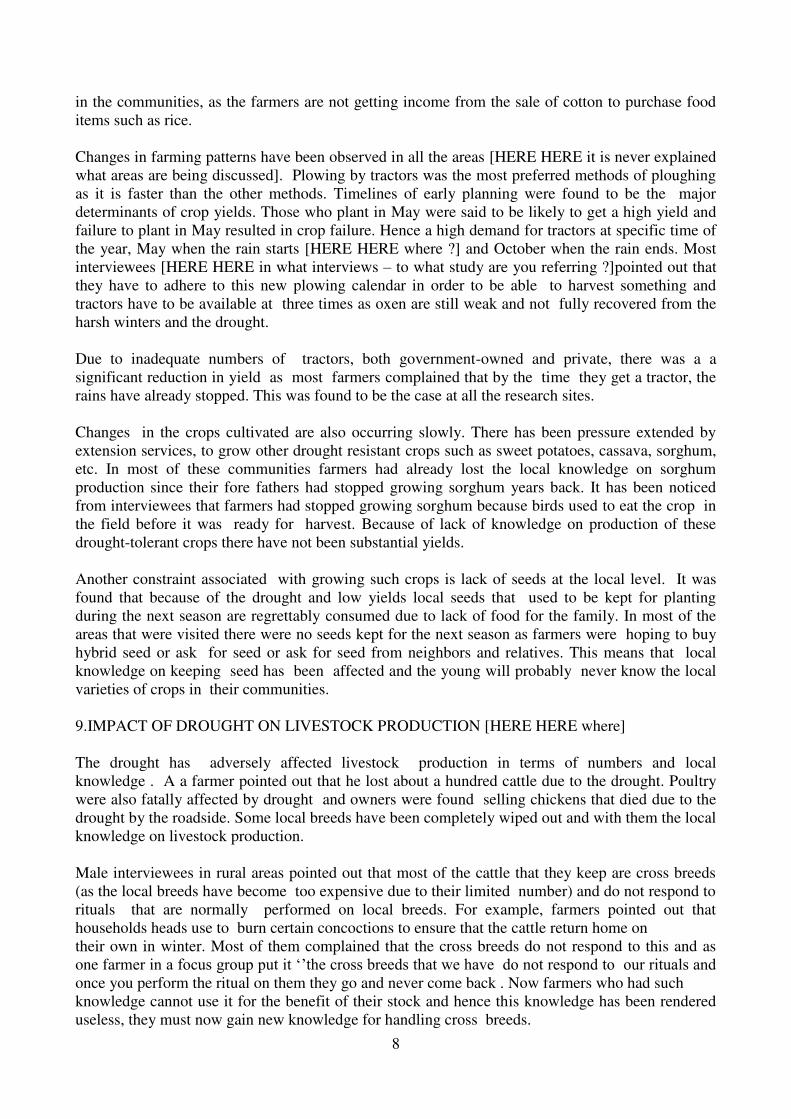
underweight children. Ethiopia is the fourth, with the same incidence of underweight children as India. Many believe that the inferior status of women in South Asia has to some extent offset the food security benefits of agriculture led poverty reduction. 7.FOOD USE , ENDING HUNGER Food use translates food security into nutrition security. Malnutrition has significant economic consequences, leading to estimated individual productivity losses equivalent to 10 percent of lifetime earnings and gross domestic earnings and gross domestic product (GDP) losses of 2 to 3 percent in the worst- affected countries. But malnutrition is not merely a consequences of limited access to calories. Food must not only be available and accessible but also be of the right quality and diversity (in terms of energy and micronutrients), be safely prepared and be consumed by a healthy body, as disease hinders the body’s ability to turn food consumption into adequate nutrition. Lack of dietary diversity and poor diet quality lead to micronutrient malnutrition or hidden hunger, even when energy intakes are sufficient. Hidden hunger can cause illness, blindness, and premature death as well as impair the cognitive development of survivors. In the next 12 months malnutrition will kill 1 million children before the age of five. Iron deficiency among female agricultural workers in Sierra Leone will cost the economy $100 million in the next five years. Although increased production of horticulture products and livestock has been agriculture’s main avenue to improve diet quality, agriculture now offers an additional pathway to address hidden hunger. Biofortification is enhancing staple crop varieties and improving diet quality with higher levels of vitamins and minerals through conventional crop-breeding and biotechnology. In the future, agriculture will continue to play a central role in tackling the problem of food insecurity. It can maintain an increase global food production, ensuring food availability. It can be the primary means to generate income for the poor, securing their access to food and through new and improved crop varieties, it can improve food quality and diversity and foster the link between food security and nutrition security. 8. THE IMPACT OF DROUGHT ON CROP PRODUCTION [HERE HERE where?] Drought has resulted in the decline of yields and reduction in the production of certain crops. As has already indicated rice has been affected by drought in many ways and this has resulted in food insecurity, as rice is a staple crop . There are different reasons why farmers continue to grow this crop despite its weak defenses against drought. First, there is knowledge and experience around rice production. Second there is a certain social status associated with good yields of rice. Third there is the belief that the rains will eventually come back and lastly there is a gender issue whereby certain crops are considered feminine and therefore inferior and men who grow such crops are not respected among males . For example: a male farmer in one of the developing countries wanted to know what he would do without rice, when advised that he could grow sweet potatoes he responded by saying I won’t produce a woman’s crop. Changes have also been observed in production of commercial crops, cotton is a good example. Many farmers have abandoned this crop because it is labour intensive, they have experienced a drop in selling prices, and there is a lack of farmer financial support systems in terms of inputs . In addition there has been a decline in the yield as a result of continuous drought, the cost of production are high compared to the revenue generated and the market for the crop is unfavorable . The decline in production of cotton indicates over time there could be a loss of local knowledge, about its production. Currently the decline in the production has further worsened food insecurity
8
in the communities, as the farmers are not getting income from the sale of cotton to purchase food items such as rice. Changes in farming patterns have been observed in all the areas [HERE HERE it is never explained what areas are being discussed]. Plowing by tractors was the most preferred methods of ploughing as it is faster than the other methods. Timelines of early planning were found to be the major determinants of crop yields. Those who plant in May were said to be likely to get a high yield and failure to plant in May resulted in crop failure. Hence a high demand for tractors at specific time of the year, May when the rain starts [HERE HERE where ?] and October when the rain ends. Most interviewees [HERE HERE in what interviews – to what study are you referring ?]pointed out that they have to adhere to this new plowing calendar in order to be able to harvest something and tractors have to be available at three times as oxen are still weak and not fully recovered from the harsh winters and the drought. Due to inadequate numbers of tractors, both government-owned and private, there was a a significant reduction in yield as most farmers complained that by the time they get a tractor, the rains have already stopped. This was found to be the case at all the research sites. Changes in the crops cultivated are also occurring slowly. There has been pressure extended by extension services, to grow other drought resistant crops such as sweet potatoes, cassava, sorghum, etc. In most of these communities farmers had already lost the local knowledge on sorghum production since their fore fathers had stopped growing sorghum years back. It has been noticed from interviewees that farmers had stopped growing sorghum because birds used to eat the crop in the field before it was ready for harvest. Because of lack of knowledge on production of these drought-tolerant crops there have not been substantial yields. Another constraint associated with growing such crops is lack of seeds at the local level. It was found that because of the drought and low yields local seeds that used to be kept for planting during the next season are regrettably consumed due to lack of food for the family. In most of the areas that were visited there were no seeds kept for the next season as farmers were hoping to buy hybrid seed or ask for seed or ask for seed from neighbors and relatives. This means that local knowledge on keeping seed has been affected and the young will probably never know the local varieties of crops in their communities. 9.IMPACT OF DROUGHT ON LIVESTOCK PRODUCTION [HERE HERE where] The drought has adversely affected livestock production in terms of numbers and local knowledge . A a farmer pointed out that he lost about a hundred cattle due to the drought. Poultry were also fatally affected by drought and owners were found selling chickens that died due to the drought by the roadside. Some local breeds have been completely wiped out and with them the local knowledge on livestock production. Male interviewees in rural areas pointed out that most of the cattle that they keep are cross breeds (as the local breeds have become too expensive due to their limited number) and do not respond to rituals that are normally performed on local breeds. For example, farmers pointed out that households heads use to burn certain concoctions to ensure that the cattle return home on their own in winter. Most of them complained that the cross breeds do not respond to this and as one farmer in a focus group put it ‘’the cross breeds that we have do not respond to our rituals and once you perform the ritual on them they go and never come back . Now farmers who had such knowledge cannot use it for the benefit of their stock and hence this knowledge has been rendered useless, they must now gain new knowledge for handling cross breeds.

9
10. IMPACT OF DROUGHT ON NATURAL RESOURCES The drought has had a drastic effect on natural capital. Dry climatic conditions like those found in the studied areas [HERE HERE where ???] damage the environment. The findings indicate that many tree species are no longer present in the communities and those that are, are less fertile than they were. The drought has also resulted in extinction of plants eaten by wild animals, thus threatening game with extinction The government has built game reserves to protect the remaining animals., meaning that communities have been deprived of their cheap source of protein from game meat. The rivers have been reduced to small streams by the drought and communities can barely get water for domestic use let alone irrigation. Also the natural and man-made reservoirs have dried up resulting in serious shortages of water for both human and animal consumption and irrigation. The few rivers and streams are now shared between human and animals and this can cause illness. The harsh weather conditions have also affected the ecosystem as there has been a decline in edible insects that use to be plentiful in the past. Most of the edible insects only come out from the ground after there has been heavy rain. Because of the drought these have not been seen over a long period. The unavailability of these edible insects resulted in the decline of the nutritional value, as these were a source of protein in the summer and autumn seasons. The drought has also affected wild edible plants and fruits . Workshop participants identified some wild edible plants that are no longer available or can hardly be seen including cassava and yam. All of these have been affected by the weather conditions . Mushrooms for example were no longer available as they only surface after rain. 11.IMPACT OF THE DROUGHT ON TECHNOLOGY Weather conditions have had a negative impact on local knowledge for technology. Local knowledge about drought power has been lost as farmers’ drought animals (mainly oxen) have been killed by the drought or are too weak to work during the dry months. Interviewees called upon government to provide them with tractors as the ground was too dry for oxen to plough. Donkey power is being encouraged by agricultural extension workers as donkeys needs less grazing area than oxen, they can work for longer hours, the manure is good for fertilizer, and they are drought-resistant. However, donkey power was found to be used only to a limited extent as some agricultural beliefs have prohibited its widespread adoption. This signifies a shift in need for local knowledge and from traditiuonal plowing technologies to the use of tractors and donkey power 12.THE IMPACT OF DROUGHT ON NUTRITIONAL STATUS The persistent drought has also caused a decline in the nutritional status of the rural communities that were visited. Nutritional foods that are grown have lost some of the nutritional value because of the drought. Certain varieties of maize such as the local varieties like silver king have been replaced by drought tolerant varieties that are low in nutritional value. Farmers pointed out that they grow certain legume varieties that are drought tolerant but significantly low in nutritional content.
10
In the majority of the communities studied the breakfast meal was made up of thin porridge from the yellow maize that is received as food aid. Some have sour porridge (emahewu) for breakfast,, while for others this would be their meal for the whole day. 13. FOOD RELIEF To mitigate the effects on food security, outside assistance from international organization is also present to assist in food security i.e NGOs such as World Vision, Lutheran Development Services, Red Cross, IFAD,FAO,IMF,and World Bank. There were complaints in the rural areas of developing countries that although there was food insecurity they do not receive any food aid. There are a few programmes that provide food for orphans using both food aid and the farming of communal land. While food aid seems to be appreciated there has been complains by the communities that rations are not adequate to last them for a month, the food is not palatable and causes skin rashes, and not all the homesteads are benefiting from the programme as the selection criteria for the beneficiaries is questionable. CONSEQUENCES OF DROUGHT TO FOOD INSECURITY The persistent drought in the communities in rural and urban areas that were brought about food insecurity and other challenges. The following coping strategies have been used: i)Begging for food from neighbors especially by the aged ii)Asking for food from relatives in areas that had better harvests iii)Working for neighbors in exchange of food, e.g. harvesting labour, fetching water etc iv)Some men indulge in traditional beer which is also regarded as a source of food to satisfy their hunger v)Some people have borrowed land from high rainfall areas to farm f)Temporary migration to areas where drought is not severe 14.DESCRIPTION OF URBAN AGRICULTURE Urban agriculture describes crop and livestock production within cities and towns and surrounding areas. It can involve anything from small vegetable gardens in the backyard to farming activities on community lands by an association or neighborhood group. In peri-urban areas production is often intensive and commercially oriented, but farming within cities generally occurs on a smaller scale. It is commonly practiced on fallow public and private spaces, wetlands and underdeveloped areas; rarely is it found on lands specially designated for agriculture. In many countries urban agriculture is informal and sometimes even illegal.
11
Competition for land is a frequent source of conflict. Other contentious issues include the environmental impact of urban agriculture and food safety concerns, particularly relating to livestock production. Agriculture is very important for urban ares. Farming in cities and towns can improve food security, especially of urban poor. Depending on the local interest, policy makers should seize the opportunities of urban agriculture or promote alternative ways to fight hunger. While data are scares, urban agriculture is an important reality in many developing countries. Up to 70% of households participate in agricultural activities, according to the first systematic quantification of urban agriculture conducted by FAO, based on data from 15 developing and transition countries for which for which comparable statistics are available (from the Rural Income Generating Activities database) Urban agriculture seems particularly important in low-income countries such as Malawi, Nepal and Vietnam (see figure last pages) But even in wealthier economies such Panama, a significant share of urban households is involved in farming activities. Indeed in three quarters of the countries analyzed the share of urban households participating in crop and to a lesser extent- livestock production exceeds 30 percent. In other countries such as Indonesia , the share is much lower, but it is not clear whether these differences are due to different economic or policy factors or due to differences in measurement of agriculture or urban areas. The graph (shown later) shows that urban agriculture is particularly important for lower income groups. With very few exceptions, poor urban dwellers are more likely to participate in crop and livestock production than richer household. In many countries more than half of all urban households in the poorest expenditure quantile rely in part on agricultural activities to satisfy their food needs. 15.MORE AND BETTER FOOD Urban agricultural production is generally geared towards consumption within the household. Only in a few countries, including Bangladesh, Madagascar and Nepal is more than a third of production sold on markets. Urban agriculture is thus not primarily a source of cash income, although in some countries (Notably Madagascar and Nigeria) the share of income derived from urban agriculture exceeds 50 percent in the lowest income quintile. The food security benefits of engaging in urban agriculture materialize mostly through better access to additional and more nutritious food. Indeed urban households engaged in farming activities tend to consume greater quantities of food, some times as much as 30% more. They also seem to have a more diversified diet, as indicated by an increase in the number of food crops consumed. Relatively higher consumption of vegetables, fruits and meat products translates into overall higher calorie intake. 16. SEIZING OPPORTUNITIES Urban agriculture can thus have important benefits for food security. Although it might be a small share of total food production, it can be crucial for some groups of society, such as the urban poor as well as women of reproductive age and children. Policy responses will vary across countries or even within the same city depending on the specific
12
local situation. They might also differ between specific activities, as livestock production in urban centers can be expected to pose greater challenges than maintaining a backyard garden. In some cases benefits from urban agriculture will clearly outweigh potential negative consequences, such as environmental pollution or competition over scarce resources. In these cases policy makers should actively promote urban agriculture and finds ways to integrate it into urban land-use planning. Providing guidance or training on food production techniques, for example, could minimize risks such as health hazards, water contamination and food safety concerns. In others there might be more efficient ways to raise food security of the poor such as promoting alternative income generating activities, expanding non-agricultural employment opportunities or improving the functioning of urban food markets. Policy makers should thus carefully weigh available options. Simply banning farming activities in cities has often been done in the past, and it is not the best alternative. Policy responses could instead focus on improving land use rights and specifying which activities are allowed and where. Without a careful analysis of existing opportunities and risks, policy makers will miss an opportunity to integrate agricultural activities into urban development and ensure that it helps to achieve social, economic and environmental sustainability. 17. INFORMATION AND DEFINITIONS. As previously mentioned, this research study is completely different from any other research work on urban agriculture, we are aware of it as much as it uses (a) nationally representative data; (b) a comparable description of agricultural activities; and (c) a comparative international perspective. The data in this research work do not allow dealing with another dimension of comparability, which is the description of what constitutes an urban area. Countries have their own unique mechanisms of defining what constitutes urban or rural, and these mechanisms determine the definition of urban and rural in the data set used. On the other hand it may make sense to use government definition since presumably these reflect local information about what constitutes rural and it is the definition used to administer government programs. One additional important caveat is that with the information available we identify an agricultural activity to be urban through the domicile of the household, not the location of the activity. It is probably that a number of what we identify as urban agriculture activities in this research are in fact taking place in nearby rural areas. In that sense the study and research discussion focuses on urban households’ involvement in agriculture, rather than strictly urban agricultural activities, and for that reason our results may not be fully comparable with other research on urban agriculture which only include crop and livestock activities taking place within the city boundaries. A narrow definition of agricultural income is used, whereby agricultural income accounts for the sale of crops and livestock, crop and livestock by products, sharecropping earnings, the consumption of home-grown crops and livestock products, net of all expenditure s related to these activities, such as seed and fertilizer purchases and the hiring of farm labour. Participation in agriculture is defined as the production of any crop or livestock product, whether for sale or domestic consumption. Activities related to the marketing and processing of agricultural goods are therefore not included in our definition of urban agricultural activities.
13
Our analysis is based on the rural Income Generating Activities (RIGA) database which constructed a pool of several Living standards Measurements Study (LSMS) and other multi- purpose household surveys made available by the World Bank and other national and international institutions. The choice of countries to be included in the dataset was guided by the desire to ensure geographic coverage across the four principal development regions: Asia, Africa, Eastern Europe and Latin America, as well as adequate quality, and sufficiently comparability in codification and nomenclature. Furthermore, an effort was made to include a number of IDA (International Development Association ) countries as these represent developing countries with the highest levels of poverty and are therefore of particular interest concerning development and poverty reduction Using these criteria, survey data from the following countries were utilized (corresponding survey years in parenthesis): (1998), Madagascar (2001), Malawi(2004), Nigeria(2004); Bangladesh (2000), Indonesia(2000), Nepal(20003), Pakistan (2001), Vietnam 81998), Albania(2005), Bulgaria(2001), Equador (1995); Guatemala(2000), Nigaragua(200019; Panama(2003). While clearly not representative of all developing countries, the list does represent different regions and has proved useful in providing insights into the fundamental of livelihood strategies of households in the developing world (Davies et al,2010),( Winters et al,2009) and (22) . The RIGA database consists of income and household characteristic variable that were constructed using the same definitions and data handling protocols drawing on data that are collected using broadly similar survey instruments. Clearly some differences in questionnaire design across countries remain, but the degree of comparability in the RIGA data is very high. While most of these data are fairly recent (collected within the last decade ), three of them were collected in the 1990’s. In the presence of rapid urban transformation, the picture we paint for a few of the countries covered by our data may therefore have become out of date. 18. THE BLACK BOX AND THE DATA OF THE URBAN AGRICULTURE . The first research question of this paper ,i.e the quantification of the magnitude of the UA phenomenon in a cross- section of countries is addressed in this section. To quantify the magnitude of urban agriculture in the countries at hand we first look at the rates of participation in, and the shares of income from, urban agriculture. The nature of our data also allows us to separate agricultural income from crop and livestock activities. The picture that emerges from these data is one of an extremes variation (see Table 1). The shares of urban income generating activities from agriculture varies from 11% in Indonesia to almost 70% in Vietnam and Nicaragua. In 11 of the 15 countries in our dataset, the share of households participating is over 30%. In general livestock activities are less common than cropping activities, but there are cases ( like Bangladesh, Nepal, Ecuador, and Nicaragua) in which livestock are reared by about one in three urban households. Looking at regional patterns no clear regularity can be found in terms of participation rates while it is interesting to note that it is the four African countries in the sample that display the four largest income shares. Should this result represents Africa at large one may indeed be inclined to conclude that urban agriculture is a significant source of livelihoods for urban households in Africa. Outside of Africa, the highest share of income in our dataset are in Nepal at 11% and

14
Vietnam at 9% , with most other countries displaying shares of 5% of less, and in several cases much lower. It needs to be emphasized however that these averages across the urban population may mask the fact that there are particular groups in urban areas for which agriculture makes up a sizeable share of their livelihoods. When only households engaged in urban agriculture are taken into consideration, average share of income from primary activities are in fact much more substantial. The African countries are still maintaining the lead on the table, but three among the Asian countries also have income shares around 20% or more and another three countries have income shares or more than 10% (shown in third column in table 2 ).In the African countries of the sample for 18 and 20% of all urban households agriculture constitutes 30% of total income or more. This percentage is also the same in Nepal and 7-10% of households in Guatamala, Nicaragua and Vietnam (shown in fourth column in table 2) . The results above show how urban agriculture which by no means negligible does not appear to be the major urban economic activity that its most enthusiastic advocates sometimes claim it to be. On the other hand, the data do confirm that in a number of countries there is a significant share of the urban population that relies on the production of agricultural crops and livestock products for their survival. By decomposing participation rates and income share by quantile of expenditure (Living standard Measure of the World Bank) we find some results that urban agriculture is eminently an activity practiced by the poor. With very few exceptions a clear negative correlation between participation in agricultural activities and level of welfare is seen. Participation rates for the poorest quantile is extremely high, over 50% in 8 out of 15 countries, proving how urban agriculture plays an important role for a non-negligible number of poor households in developing countries (fig.1) The importance of the part played by urban and rural activities can be best perceived by looking at the shares of income derived from agricultural activities in urban and rural areas across quantiles of consumption expenditure (see fig 2). The picture that emerges, points to a stark contrast between African countries in our data sets and other regions. Ghana, Madagascar& Nigeria stand out with over 30% of the income of the poorest quantile originating in agriculture, but rates higher than 20% , are also found in the poorest strata of the sample of Malawi as well. Outside Africa only a handful of of the Quintiles in Guatemala, Nepal and Vietnam display shares surpassing 10%, with all the others well below that number. Again, should this picture be confirmed by a larger cross-section of countries, it is hard to see urban agriculture playing a substantial role in poverty alleviation outside Africa.6 Also no clear pattern seem to emerge from these data in terms of how participation and income shares may evolve with the level of development (e.g. a possible decline in participation and income share as GDP levels increase), but this may also be due to the small sample size. A final point concerns the quantification of the role of urban agriculture as a proportion of total agricultural production and its degree of market orientation (seeTable 3 below). According to the data in the surveys we use, from developing countries urban agriculture accounts for 5-15%of total agricultural production with perks above 20% in Madagascar and Nicaragua and a low of 3% in Malawi. 7 A common feature of urban agriculture in
15
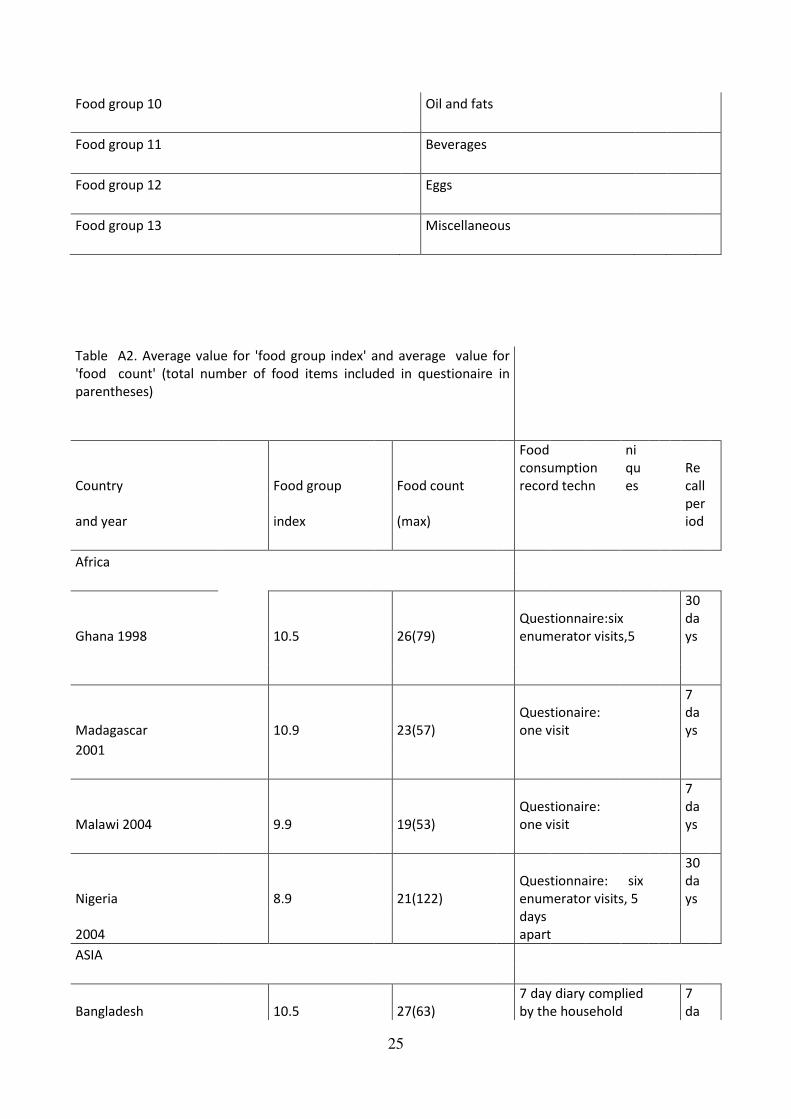
most countries appears to be that it is largely for own-consumption. In only four of the countries in our sample data (Madagascar, Bangladesh, Napal and Nicaragua) is more than a third of agricultural production marketed. In the other seven countries sales account for between 15% and 26% of the total volume of agricultural production. In the remaining two countries for which this could be computed as much as 92% to 93% of the production is consumed within the household. Fig.1. (see last pages of this paper) Percentages of households participating in urban farming, by expenditure quantile, Note: The bars correspond to expenditure quantiles, from the poorest (‘’poorest quintile; on the left) to the richest (5th ; on the right). Countries are ordered by level of purchasing power parity GDP per capita. Figure 2.(see last pages of this article) Share of income from urban agriculture, by expenditure quantile. Note :The bars correspond to expenditure quantiles, from the poorest (‘poorest quintile:on the left) to the richest(5th ; on the right). Countries are ordered by level of purchasing power parity GDP per capita 19. URBAN AGRICULTURE AND FOOD SECURITY Urban agriculture, as explained in this section ‘’The importance and role of urban agriculture: acts and artifacts. A brief review of the literature ‘’, can have a positive impact on household food security as it generates direct income for the household concerned as well as providing direct access to the food produced. Households engaged in farming may have access to comparatively cheaper food and to a wider variety of particularly nutritious food, such as vegetables and products of animal origin (milk, eggs, meat). The later mechanism may be particularly relevant should urban food markets, particularly in the poorer neighborhoods, be inefficient. Under such conditions direct access to food may allow households to consume greater amounts of food and a more diversified diet, richer in valuable micronutrients. In this section we analyze whether this is the case, by looking at the correlation between participation in agricultural activities within urban areas and a series of indicators of dietary adequacy. We will first look at two dietary diversity indicators for which we have data for the full set of countries. Dietary diversity is often used as food security proxy in nutrition surveys, and has been generally found to be closely correlated to both caloric adequacy (the amount of kilocalories consumed ) and anthropometric outcomes (for a review see Ruel (2006). We use two measures of dietary diversity. One is based on 13 food groups, including a food group to account for prepared food that could not be otherwise classified, which are listed in appendix Table 1. We will refer to model 1 in what follows. The second is a sample of the different food items household reports having consumed during the survey reference period. This is model 2.Appendix table 2 reports key summary statistics for the dietary diversity variables as well as synthetic information on the questionnaire design (number of items listed, recall period, type of survey instrument used). We then perform a somewhat more detailed analysis of a subsector of four countries (Malawi, Bangladesh, Guatemala and Nicaragua) for which data on Kilocalorie consumption were available.For these four countries we also investigate whether any association can be detected between engagement in urban agriculture and (a) the total amount of kilocalories per capita

16
consumed (model 3) and (b) changes in the composition of the diets as measured by share of calories from different major food groups (model 4). As previously mentioned we could only find one study (Maxwell et al., 1998) that investigates the link between urban agriculture and food security in a multivariate framework, using child nutritional status as the dependent variable. Our dependent variable are however different, and they allow us to look at only part(albeit a large part) of the food security picture or situation. In fact dietary diversity and kilocalorie consumption are the product of the food access, availability and stability dimensions of food security, but do not reflect the dimension concerning the utilization of food, its preparation and sanitation practices that can instead be measured using anthropometric indicators. The analytical model used is very simple, and builds on the conceptual links between household food security and participation in urban agriculture previously outlined. Models 1-3 are thus specified as follows: Outcome αo ± α1P-onfarm ± α2x ± € Where outcome is our dietary diversity measure (simple count of food on food groups for models 1 and 2 respectively).or total calorie consumption (model 3) p-onfarm is the dummy variable indicating whether the household participates in agriculture and x is a vector of household demographic and socio-economic control variable including per capita consumption expenditure, land, ownership in hectares, household size, education and age of the household head, the female share of the working age adults and the number of children aged between 0 and 5.The regression also include a set of geographic dummy variables and square terms for the age and education variables and €, an independently, identically distributed error term. Model 4 is different in that it consists of a system of simultaneous equations, specified as Follows: Kilocalories f ≥ α0f ± α1fp-onfirm ± α2fx ± f Subject to constrains as follows: ∑ 10 α1∩P-onfarm ≥ [HERE HERE what ?!?] where Kilocalories f are the amount of Kilocalories consumed for each 10 food groups, f. The constrains allows quantifying how the composition of food consumption changes with participation in agriculture keeping the total amount of kilocalories constant. The other variables are defined as in Eq.(1) above. The models are run separately for the full urban sample for each country, so that we have 15 regressions in total for each of modules 1 and 2, and four regressions each for modules 3 and 4 .As it would be cumbersome to report the complete results for all the regressions, we summarize in Table 4 the results related to the main explanatory variable of interest, participation urban agriculture. After introducing the set of controls specified above, we do find evidence that engagement in farming in urban areas is positively associated with greater dietary diversity in 10 out of 15 countries when it is measured using the dietary diversity score, and in 11 out of 15 when it

17
is measured with the simple food count. Positive and significant are found at least one model specification in the four Latin American countries, the five Asian ones, Nigeria and Ghana in Africa, and in Albania and Bulgaria. These results provide a fairly robust confirmation of earlier suggestions of city case studies, of nutritional surveys , and qualitative and anecdotal observations, that engagement in farming by urban households can allow them consuming better, more nutritious food. The magnitude of the coefficients varies quite extensively suggesting that engagement in urban agriculture may be associated with increases in the average number of food consumed in the order of 34% in Albania, 11% in in Panama, 9% in Nicaragua, and 6-7% in Bangladesh. Nepal, Vietnam Guatemala and Ecuador. The associated increase in the number of food groups consumed is obviously smaller, in the range of 1-5% . This is not surprising however, given that the variability in the food diversity variable is not all that large either, as it is in this surveys the recall period for food consumption is quite long, usually between 2 weeks to 1 month. When looking at calorie consumption the results are in a similar direction (Table 5). In two of the four countries (Bangladesh and Guatamala) for which data on calorie consumption were obtainable a positive and statistically significant association between calorie availability and engagement in urban agriculture was noted. That is related to higher consumption of calories of meat and fruits and vegetables (Guatemala). In Malawi no statistically significant difference in calorie consumption can be detected, but involvement in agriculture is nevertheless associated with higher consumption of calories from fruits and vegetables and staples, partly offset by lower amounts of calories from meat. In Bangladesh the diet of urban households engaged in agriculture appears to have a smaller staple component. Taken together these results confirm the existence of an association between urban agriculture and indicators of sufficiency and diversity in a majority of the countries for which we have data. We find that controlling for other factors, household engaged in urban agriculture are more likely, in several but not all countries, to enjoy a more diverse diet, to consume more calories and to have access to a greater number of calories from both basic staples and fruit and vegetables products. It is worth recalling that an increase in calorie consumption is not necessary a positive development if it is concentrated in households that already consume an adequate amount of calories. Obesity is a problem even in a low income countries such as Guatemala (Marini and Gragnolati, 2003, 20039, and these results should therefore be interpreted with some care. 20.THE NEGATIVE EFFECTS OF PRICE VOLATILITY ON FOOD SECURITY IN THE SHORT TERM The benefits go primarily to farmers with access to sufficient land and other resources, while the poorest of the poor buy more food than they produce. In addition to harming the urban poor, high food prices also hurt many of the rural poor, who are typically net food buyers. The diversity ofimpacts within countries also points to a need for improved data and policy analysis. 21. FOOD PRICE VOLATILITY AS INCENTIVES FOR INCREASED LONG-TERM INVESTMENT IN AGRICULTURE WHICH CAN CONTRIBUTE TO IMPROVE FOOD SECURITY . Domestic food prices increased substantially in most countries during the year 2006 to 2008

18
world food crises at both retail and farm-gate levels. Despite higher fertilizer prices, this led to a strong supply response in many countries. It is essential to build upon this short term supply response with increased investment in agriculture including initiatives that target smallholder farmers and help them to access markets. 22. FOOD SECURITY STRATEGY BASED ON A COMBINATION OF INCREASED PRODUCTIVITY IN AGRICULTURE, POLICY PREDICTABILITY, AND FREE TRADE Restrictive trade policies can protect domestic prices from world market volatility, but these policies can also results in increased domestic price volatility, as a results of domestic supply shocks, especially if government policies are unpredictable and erratic. Government policies that are more predictable and that promote participation by the private sector in trade will generally decrease price volatility. AGRICULTURAL INVESTMENT REMAINS CRITICAL TO SUSTAINABLE LONG-TERM FOOD SECURITY Investment in agriculture will improve the competitiveness of domestic production, increase farmers profits and make food more affordable for the poor. For example, cost-effective irrigation and improved practices and seeds developed through agricultural research can reduce the production risks facing farmers, especially smallholders, and reduce price volatility. Private investment will form the bulk of the needed investment , but public investment has a catalytic role to play in supplying public goods that the private sector will not provide. These investment should consider the rights of existing users of land and related natural resources, benefit local communities, promote food security and not cause undue harm to the government. 23. PRICE VOLATILITY MAKES SMALLHOLDER FARMERS AND POOR CONSUMERS VULNERABLE TO POVERTY. Food represents a large share of farmer’s income and the budget of the poor consumers, large price changes have large effects on real income. Thus, even short episodes of high prices for consumers or low prices for farmers can cause productive assets i.e. land and livestock to be sold at a low prices, leading to potential poverty traps. In addition, smallholders farmers are less likely to invest in measures to raise productivity when price changes are unpredictable. 24. HIGH VOLATILE FOOD PRICES DUE TO POPULATION INCREASE. Demand from consumers in rapidly growing economies, and a continuously increasing population and any further growth in biofuels will place additional demand on food system . On the supply side, there are challenges due to increasingly scarce natural resources in some rural and urban areas, as well as declining rates of yield growth for some commodities. Food price volatility may increase due to stronger linkages between agricultural and energy markets, as well as an increased frequency of weather shocks. 25. CONCLUDING REMARKS These paper set out to tackle two very specific research questions concerning (1) the importance and magnitude of agricultural activities for urban households and (2) the relationship between engagement in urban agriculture and household food security. Our findings indicates that

19
agriculture is indeed a not negligible reality of the urban economy, involving anywhere between 10-70% of urban households. In terms of income generation, though its role appears to be much more limited, with the important exception of the African countries in our sample, and of the households, in the poorer quintiles in Nepal and Vietnam. Our data confirm that urban agriculture is an activity in which the poor are disproportionately represented, and that this occurs in all regions. This study also highlights that urban agriculture does appear to be associated with greater food diversity and calorie availability, both measures of an improved diet and hence closely related to food security. In two thirds of the countries analyzed results, showed a correlation between an active participation of urban household in agricultural activities and greater food diversity, this after controlling for income and a set of household characteristics. Using a smaller dataset, some evidence is also found of a relationship with greater calorie consumption, with fruits and vegetables being the food group more consistently found to contribute to the increase in calorie consumption associated with the engagement in urban agriculture. In the context of the recent trends in food markets and overall economic crises, and in light of the well-known fact that the poor are the most vulnerable to an increase in food prices, these findings acquire particular policy relevance. A common household response to a real term increase in food prices (or corresponding decrease in disposable income) is to adjust consumption towards cheaper sources of calories which often means trading off a richer set of micronutrients in the diet to keep calorie consumption constant. This type of response can be detrimental for the nutrition of specific population subgroups such as women of reproductive age and children, with the effects likely to persist over the longer term. Having direct access to a wider variety of food (especially to more fruits and vegetable) via urban agriculture can therefore play a potentially important role in protecting the poorest urban dwellers as they cope with an economic crisis. However it is important to reiterate that results traced on possible impact were small, and that this should be taken into account when assessing the likely contribution of urban agriculture to address food insecurity problems in urban areas. More in depth country case studies are needed to better grasps the precise magnitude of these effects under different circumstances, and to fully explore the existence of causal links. Thus far such studies have been limited to large cities, and expanding these to nationally representative samples of the urban population should form part of the research agenda on this topic. It is not for a paper of this kind to make specific recommendation about what urban planners should do about urban agriculture. We know very well from case studies literature that cities are very different in the characteristics of their urban agriculture, and that even different neighborhoods in the same cities might require different approaches. The evidence presented seems however strong enough to urge urban planners and policy makers to think twice before making drastic action against urban agriculture as has often been the case in the past. At a minimum the poverty and food security implications this might have on the households that participate in urban agriculture should be properly assessed. If urban households are engaging in agriculture (and the data suggests this to be true for a fair number of households) this means that, under certain circumstances, they are benefiting from their involvement in this activity. How large these benefits are, and to whom they accrue is difficult to measure quantitatively, but the message that comes from our analysis is that they are often (but by no means always) large enough to play a non-negligible part in the livelihood and food
20
security strategies poor urban households. We do not want to overemphasize the potential for urban agriculture to play a role in urban poverty and food insecurity reduction: the agricultural production of households participating in this activity is often minimal as indicated by the income shares in table 2 and figure.2. Our view is that a more balanced, evidence based approach than what is found in some of the existing literature is needed. While some of the literature on urban agriculture is driven by advocacy purposes and is therefore some time guilty of ‘promoting’ the sector based on scant data, that argument should not be utilized to dismiss all arguments in favour of urban agriculture. Whether urban agriculture make economic sense is an empirical question. And will depend its profitability and on the extent to which it provides food for the food insecure at a lower opportunity cost in the use of their resources than alternative means of procuring that food. Whether urban agriculture is worthy of direct public policy support is debatable and not a question this research paper can address, as each case requires exploring specific alternative pathways out of poverty and possible alternative measures to increase households access to food, be it through the promotion of different income generating activities, and employment opportunities, or by improving the efficiency of the urban and rural food markets on which the rural and urban poor rely. REFERENCES Armar-Klemesu, M 2001, Urban agriculture and food security nutrition and health.Thematic chapter paper 4. In:Baker, N. et al. (Eds), Growing cities Gowing food: Urban Agriculture on the policy Agenda. DSE, Fefdafing. Carletto, B.G., Covarrubias, Krausova, M 2007, Rural Income Generating Activities (RIGA) Study: Income Aggregate Methodology. Agriculture Sector in Economic Development Service, FAO, Rome. Davis, B. Winters, P., Carletto, Covarubias, K., E.,Zezza, A., Stamoulis, K.Azzarri, C.,DiGiuseppe, S., 2010. A cross-country Comparison of rural income generating activities. World Development Report 38 (1), 48-63. Dessus, S. Herrera, S., de Hoyos, R., 2008. The impact of food inflation on urban poverty and its monetary cost: some back of the envelope calculations, Agricultural Economics 39 (Suppl. 417-429). Egal, F., Valstar, Meershoek, S. 2001. Urban Agriculture, Household Food Security and Nutrition in South Africa, Mimeo, FAO, Rome. Egziaber, A.C Lee A.G., Lee-Smith, D., Maxwell , D.G. , Memon P.A., L.J.A, Sawio. C.j., 1994. Cities Feeding People An Examination of Urban Agriculture in East Africa. IDRC, Ottawa. Ellis, F, Sumberg,J1998. Food Production urban areas and Policy response. Food policy 26(2). 213-225. FAO, 1996. The State of Food and Agriculture. FAO Rome. Marini.A. Gragnolati. M., 2003. Malnutrition and poverty in Guatamala. World Bank Policy research working paper no. 2967. World Bank Washington DC.

21
Maxwell, D., 2003.The importance of urban to food and agriculture . In:Annotated Bibliography on Urban Agriculture. Sida and ETC, Leusden, The Netherlands, pp. 22-129. Maxwell, D. ., Levin, C., Csete, J. 1998 Does urban agriculture help prevent malnutrition? Evidence from Kampala, Food policy 23 (5), 411-424. Mougeot, L.J,. 2000 The Hidden Significance of Urban Agriculture . 2020 Vision Focus 3. Brief 6 of 10, August. IFPRI Washington, DC Nelson T. 1996 . Closing the nutrient Loop. World watch. 9:6 November-December , pp. 10-17 Nugent. R., 2001. The impact of urban agriculture on household and local economies. Thermatic paper 3. In:Bakker N. et al (ed) . Growing cities , Growing food: Urban Agriculture the Policy Agenda. DSE Fefdafing. Ravallion, M.,Chen. S. Sangraula P., 2007. New evidence on the Urbanization of global poverty policy research working paper 4199. World Bank Washington, DC. Reul, M.T.,2006 0perationalizing dietary diversity: a review of measurement issues and research priorities . Journal of nutrition . Reul.M.T. Garrett. J.L., Morris S.S.Maxwell D., Oshaung A., Engle P., Menon, P., Slack , A , Haddad, L.1998, Urban Challenges to Food and Nutrition Security: Review of Food Security, Health and Caregiving in the Cities, FCND Discussion paper no. 51 . IFPRI Washington, DC. Sida and ETC, 2003. Annotated Bibliography . ETCLeusden, The Netherlands. UNDP, 1996. Urban Agriculture Urban agriculture, food, jobs and sustainable Cities United Nations Development Programme. Pubblication Series for Habitat H, Vol. UNDP, New York. Valdes , A. Foster, W. Anriquez, G., Azzarri, C., Covarubias, K., Davis, B., DiGuseppe S., Essam T., Hertz, T., de la O.A.P., Quinones, E, Stammoulis, K. Winters P., zezza, A 2009 , A Profile of the Rural Poor. ESA Working paper no. 09-04, FAO, Rome. Van Veenhuizen. R 2006. Cities farming for the future. Urban Ariculture for Green and Productive Cities. RUAF Foundation IDRG Ottawa. Winters, P.Davis, B. Carletto, G.Covarrubias, K., Quinones E.zecca. Azzari, C., Stimamoulis K., 2009 Assets,Activities and rural income Generation:evidence from a multicountry analysis. World Development 37(9)1435-1452. Zezza, A. Azzari , C.Davis, B.covarubias, K.,Tasciotti, L., Anriquez, G., 2008. The impact of rising food prices on the poor. FAO-ESA working 08-07. World Development Report 2008. Agriculture for Development, World Bank. The state of Food Insecurity in the World. How does international price volatility affect domestic economies and food security? , IFAD, WFP, org, FAO 2011

22
URBAN AGRICULTURE,DROUGHT AND FOOD SECURITY IN DEVELOPING COUNTRIES.
Table 1.Participation in urban agriculture.
Country
Total %
participation
Total %
participation
Total %
participation total %participation
and year in crop activities
In livestock
activities in agric activities
in
agricultural
urban sample urban sample urban sample
activities (urban
sample)
AFRICA
Ghana 38
14
41
89
1998
Madagas
2001 30
13
33
85
Malawi
2004 45
14
46
97
Nigeria
2004 29
12
32
90
ASIA
Banglade 26
14
30
90
2000
Indonesia
2000 10
3
11
64
Nepal
2003 52
36
57
98
Pakistan
2001 4
13
14
74
Vietnam
1998 65
35
69
99
EASTERN EUROPE
ALBANIA 18
10
19
95
2005
Bulgaria 23
13
27
78
LATIN AMERICA
Ecuador 17
28
35
93
1995
Guatamala
2000 35
21
42
93
Nicargua
2001 65
29
68
95
23
Panama
2003 31
12
34
87
Mean 33
18
37
88
max 65
36
69
99
Min 4 3 11 64
Full size table
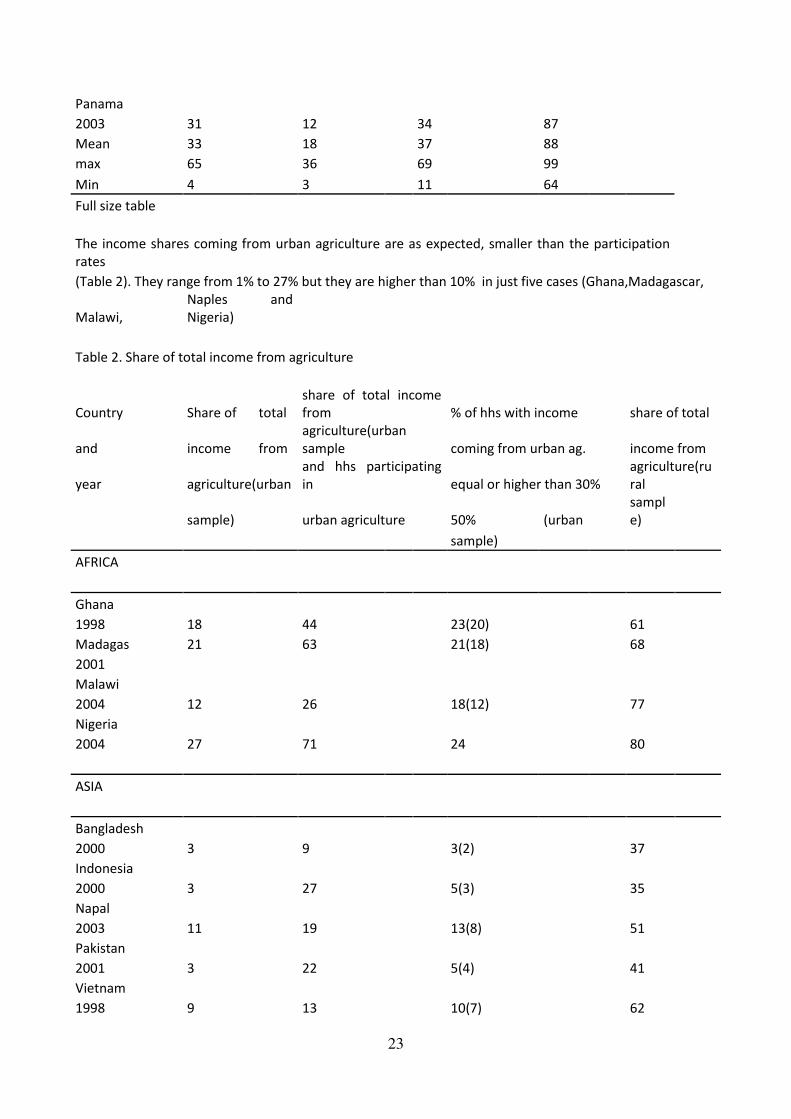
The income shares coming from urban agriculture are as expected, smaller than the participation
rates
(Table 2). They range from 1% to 27% but they are higher than 10% in just five cases (Ghana,Madagascar,
Malawi,
Naples and
Nigeria)
Table 2. Share of total income from agriculture
Country Share of total
share of total income
from % of hhs with income share of total
and income from
agriculture(urban
sample coming from urban ag. income from
year agriculture(urban
and hhs participating
in equal or higher than 30%
agriculture(ru
ral
sample)
urban agriculture
50% (urban
sampl
e)
sample)
AFRICA
Ghana
1998 18
44
23(20)
61
Madagas 21
63
21(18)
68
2001
Malawi
2004 12
26
18(12)
77
Nigeria
2004 27
71
24
80
ASIA
Bangladesh
2000 3
9
3(2)
37
Indonesia
2000 3
27
5(3)
35
Napal
2003 11
19
13(8)
51
Pakistan
2001 3
22
5(4)
41
Vietnam
1998 9
13
10(7)
62
24
EASTERN EUROPE
Albania
2005 3
14
3(1)
43
Bulgaria
2001 2 8 5(4) 20
LATIN AMERICA
ECUADOR
1995 2
4
3(2)
23
Guatamala
2000 5
11
9(5)
50
Nicaragua
2001 5
8
7(4)
57
PANAMA
2003 1 3 1(0.5) 35
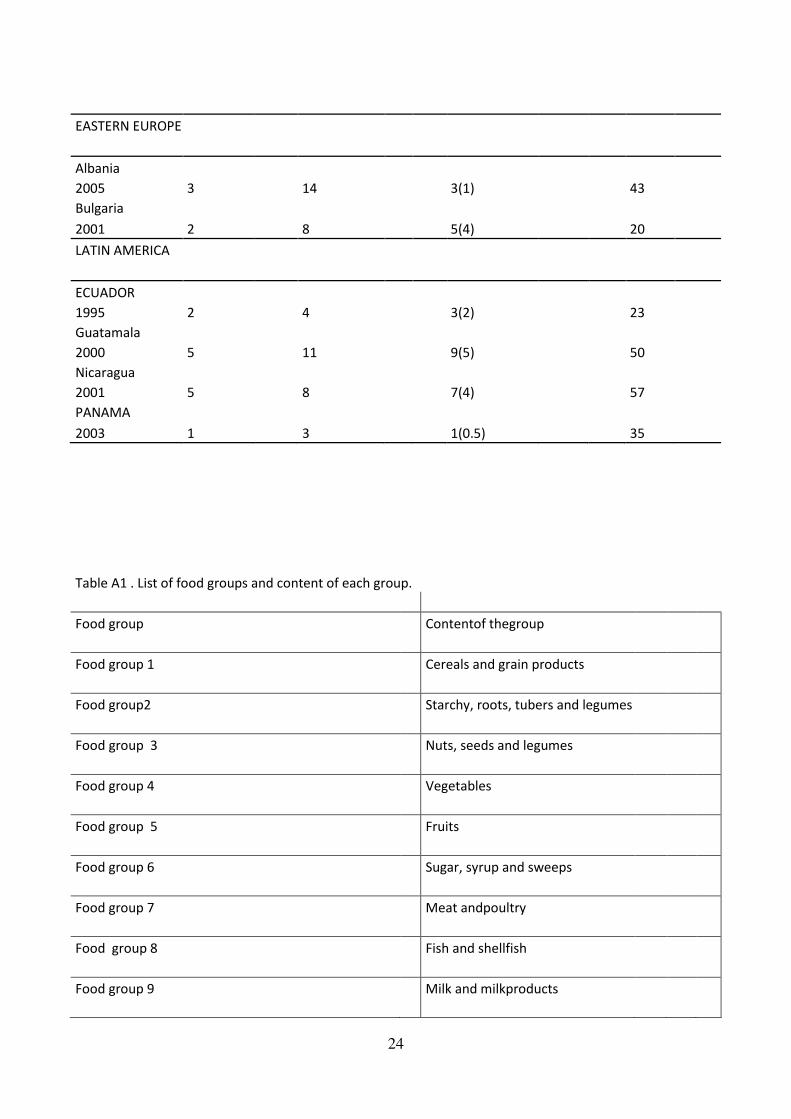
Table A1 . List of food groups and content of each group.
Food group Contentof thegroup
Food group 1 Cereals and grain products
Food group2 Starchy, roots, tubers and legumes
Food group 3 Nuts, seeds and legumes
Food group 4 Vegetables
Food group 5 Fruits
Food group 6 Sugar, syrup and sweeps
Food group 7 Meat andpoultry
Food group 8 Fish and shellfish
Food group 9 Milk and milkproducts
25
Food group 10 Oil and fats
Food group 11 Beverages
Food group 12 Eggs
Food group 13 Miscellaneous
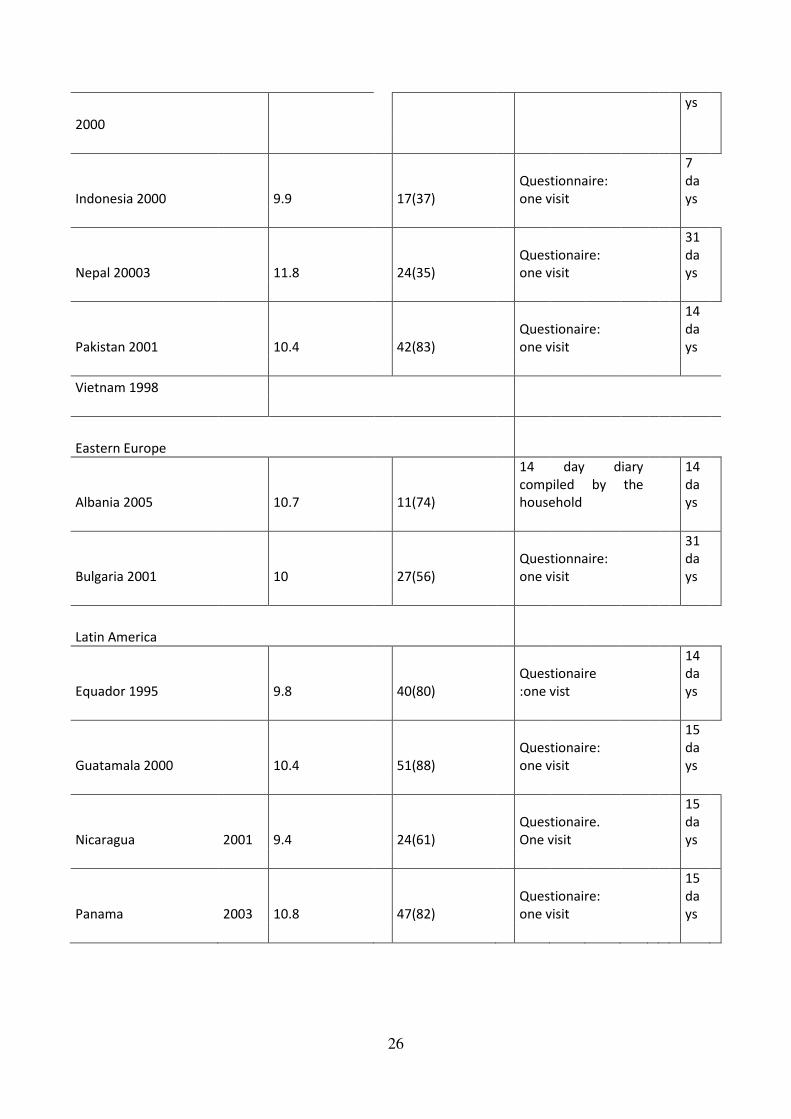
Table A2. Average value for 'food group index' and average value for
'food count' (total number of food items included in questionaire in
parentheses)
Country Food group Food count
Food
consumption
record techn
ni
qu
es
Re
call
and year index (max)
per
iod
Africa
Ghana 1998 10.5 26(79)
Questionnaire:six
enumerator visits,5
30
da
ys
Madagascar 10.9 23(57)
Questionaire:
one visit
7
da
ys
2001
Malawi 2004 9.9 19(53)
Questionaire:
one visit
7
da
ys
Nigeria 8.9 21(122)
Questionnaire: six
enumerator visits, 5
30
da
ys
2004
days
apart
ASIA
Bangladesh 10.5 27(63)
7 day diary complied
by the household
7
da
26
ys
2000
Indonesia 2000 9.9 17(37)
Questionnaire:
one visit
7
da
ys
Nepal 20003 11.8 24(35)
Questionaire:
one visit
31
da
ys
Pakistan 2001 10.4 42(83)
Questionaire:
one visit
14
da
ys
Vietnam 1998
Eastern Europe
Albania 2005 10.7 11(74)
14 day diary
compiled by the
household
14
da
ys
Bulgaria 2001 10 27(56)
Questionnaire:
one visit
31
da
ys
Latin America
Equador 1995 9.8 40(80)
Questionaire
:one vist
14
da
ys
Guatamala 2000 10.4 51(88)
Questionaire:
one visit
15
da
ys
Nicaragua 2001 9.4 24(61)
Questionaire.
One visit
15
da
ys
Panama 2003 10.8 47(82)
Questionaire:
one visit
15
da
ys

27