uputstvo za pisanje rada u casopisu...
TRANSCRIPT
Print ISSN 0554-5587 Online ISSN 2406-1123
UDK 631 (059)
POQOPRIVREDNA TEHNIKA
AGRICULTURAL ENGINEERING НАУЧНИ ЧАСОПИС SCIENTIFIC JOURNAL
УНИВЕРЗИТЕТ У БЕОГРАДУ, ПОЉОПРИВРЕДНИ ФАКУЛТЕТ, ИНСТИТУТ ЗА ПОЉОПРИВРЕДНУ ТЕХНИКУ
UNIVERSITY OF BELGRADE, FACULTY OF AGRICULTURE, INSTITUTE OF AGRICULTURAL ENGINEERING
Година XLI, Број 2, 2016. Year XLI, No. 2, 2016.

Издавач (Publisher) Универзитет у Београду, Пољопривредни факултет, Институт за пољопривредну технику, Београд-Земун University of Belgrade, Faculty of Agriculture, Institute of Agricultural Engineering, Belgrade-Zemun Уредништво часописа (Editorial board) Главни и одговорни уредник (Editor in Chief) др Горан Тописировић, професор, Универзитет у Београду, Пољопривредни факултет
Уредници (National Editors) др Ђукан Вукић, професор, Универзитет у Београду, Пољопривредни факултет др Стева Божић, професор, Универзитет у Београду, Пољопривредни факултет др Мирко Урошевић, професор, Универзитет у Београду, Пољопривредни факултет др Мићо Ољача, професор, Универзитет у Београду, Пољопривредни факултет др Анђелко Бајкин, професор, Универзитет у Новом Саду, Пољопривредни факултет др Милан Мартинов, професор, Универзитет у Новом Саду,Факултет техничких наука др Душан Радивојевић, професор, Универзитет у Београду, Пољопривредни факултет др Драган Петровић, професор, Универзитет у Београду, Пољопривредни факултет др Раде Радојевић, професор, Универзитет у Београду, Пољопривредни факултет др Милован Живковић, професор, Универзитет у Београду, Пољопривредни факултет др Зоран Милеуснић, професор, Универзитет у Београду, Пољопривредни факултет др Рајко Миодраговић, , Универзитет у Београду, Пољопривредни факултет др Александра Димитријевић, доцент, Универзитет у Београду, Пољопривредни факултет др Милош Пајић, доцент, Универзитет у Београду, Пољопривредни факултет др Бранко Радичевић, доцент, Универзитет у Београду, Пољопривредни факултет др Иван Златановић, доцент, Универзитет у Београду, Пољопривредни факултет др Милан Вељић, професор, Универзитет у Београду, Машински факултет др Драган Марковић, професор, Универзитет у Београду, Машински факултет др Саша Бараћ, професор, Универзитет у Приштини, Пољопривредни факултет, Лешак др Предраг Петровић, Институт "Кирило Савић", Београд Инострани уредници (International Editors) Professor Peter Schulze Lammers, Ph.D., Institut fur Landtechnik, Universitat, Bonn, Germany Professor László Magó, Ph.D., Szent Istvan University, Faculty of Mechanical Engineering, Gödöllő, Hungary Professor Victor Ros, Ph.D., Technical University of Cluj-Napoca, Romania Professor Sindir Kamil Okyay, Ph.D., Ege University, Faculty of Agriculture, Bornova - Izmir, Turkey Professor Pietro Picuno, Ph.D., SAFE School, University della Basilicata, Potenza, Italy Professor Nicolay Mihailov, Ph.D., University of Rousse, Faculty of Electrical Enginering, Bulgaria Professor Silvio Košutić, Ph.D., University of Zagreb, Faculty of Agriculture, Croatia Professor Selim Škaljić, Ph.D., University of Sarajevo, Faculty of Agriculture, Bosnia and Hercegovina Professor Zoran Dimitrovski, Ph.D., University "Goce Delčev", Faculty of Agriculture, Štip, Macedonia Professor Sitaram D. Kulkarni, Ph.D., Agro Produce Processing Division, Central Institute of Agricultural Engineering, Bhopal, India Professor Francesco Conto, Ph.D., Director of the Department of Economics, University of Foggia, Italy Professor Ladislav Nozdrovický, Ph.D., Faculty of Engineering, Slovak University of Agriculture, Nitra, Slovakia Контакт подаци уредништва (Contact) 11080 Београд-Земун, Немањина 6, тел. (011)2194-606, 2199-621, факс: 3163-317, 2193-659, e-mail: [email protected], жиро рачун: 840-1872666-79. 11080 Belgrade-Zemun, str. Nemanjina No. 6, Tel. 2194-606, 2199-621, fax: 3163-317, 2193-659, e-mail: [email protected] , Account: 840-1872666-79
POQOPRIVREDNA TEHNIKA
НАУЧНИ ЧАСОПИС
AGRICULTURAL ENGINEERING SCIENTIFIC JOURNAL
УНИВЕРЗИТЕТ У БЕОГРАДУ, ПОЉОПРИВРЕДНИ ФАКУЛТЕТ, ИНСТИТУТ ЗА ПОЉОПРИВРЕДНУ ТЕХНИКУ
UNIVERSITY OF BELGRADE, FACULTY OF AGRICULTURE, INSTITUTE OF AGRICULTURAL ENGINEERING

WEB адреса
www.jageng.agrif.bg.ac.rs
Издавачки савет (Editorial Council)
Проф. др Милан Тошић, Проф. др Петар Ненић, Проф. др Марија Тодоровић,
Проф. др Драгиша Раичевић, Проф. др Ђуро Ерцеговић, Проф. др Ратко Николић,
Проф. др Драгољуб Обрадовић, Проф. др Божидар Јачинац, Доц. др Еника Грегорић,
Проф. др Милош Тешић, Проф. др Блаженка Поповић
Техничка припрема (Technical editor)
“Linguae Mundi”, Земун
Лектура и коректура: (Proofreader)
“Linguae Mundi”, Земун
Превод: (Translation)
“Linguae Mundi”, Zemun
Штампа (Printed by)
"Академска издања" – Земун
Часопис излази четири пута годишње
Тираж (Circulation)
350 примерака
Претплата за 2016. годину износи 2000 динара за институције, 500 динара за појединце и
100 динара за студенте по сваком броју часописа.
Радови објављени у овом часопису индексирани су у базама (Abstracting and Indexing):
AGRIS (International Information System for the Agricultural Science and Technology),
SCIndeks, NAAS (National Academy of Agricultural Sciences - India), ScienceMedia
(ArgosBiotech), CiteFactor (International Academic Scientific Journals), J4F (Journals for Free).
Издавање часописа помоглo (Publication supported by)
Министарство просвете, науке и технолошког развоја Републике Србије
На основу мишљења Министарства за науку и технологију Републике Србије по решењу бр.
413-00-606/96-01 од 24. 12. 1996. године, часопис Пољопривредна техника је ослобођен
плаћања пореза на промет робе на мало.

S A D R Ž A J
SAMOHODNI APLIKATOR ZA UBRIZGAVANJE TEČNOG AZOTA U USEVU PŠENICE NA USITNJENIM ŽETVENIM OSTACIMA PIRINČA Jagvir Dixit, Jaskarn Singh Mahal ............................................................................................... 1-10
RAZVOJ I OCENA RADA MERNOG MEHANIZMA ZA SETVU SEMENA CRNOG LUKA (Allium Cepa L.) Ravinder Chhina, Rohinish Khurana ......................................................................................... 11-20
SPEKTRALNA ANALIZA ZA PRAĆENJE PORASTA USEVA POMOĆU TRAKTORSKOG SPEKTRORADIOMETRA I RUČNOG SENZORA STANJA USEVA U PAMUKU Kothawale Anil Gautam, Vishal Bector, Varinderpal Singh, Manjeet Singh .............................. 21-30
KOMPARATIVNA POLJSKA PROCENA RAZLIČITIH MEHANIZOVANIH TEHNIKA SADNJE U NAPIER-BAJRA Mahesh Kumar Narang, Rupinder Chandel, Rajesh Goyal, Davinder Pal Singh, Udham Singh Tiwana, Surinder Singh Thakur .......................................................................... 31-40
RAZVOJ I OCENA KARAKTERISTIKA MAŠINE ZA LJUŠTENJE I REZANJE Gourikutty Kunjurayan Rajesh, Ravi Pandiselvam, Aswathi Indulekshmi ................................. 41-50
RAZVOJ VERTIKALNOG RAZDELJIVAČA ZA ISPITIVANJE HIDRAULIČNIH PRSKALICA El-Sayed Sehsah....................................................................................................................... 51-60
RAZVOJ MULTIVARIJANTNOG MODELA REGRESIJE ZA APROKSIMATIVNU PROCENU SADRŽAJA VIGNA RADIATA KORIŠĆENJEM FURIJEOVE TRANSFORMACIJE – NIR SPEKTROSKOPIJE Ravi Pandiselvam, Shajahan Sunoj, Doraiswamy Uma ............................................................ 61-70
KONSTRUKCIJA I RAZVOJ PRIKLJUČKA ZA USITNJAVANJE NA KULTIVATORU Raghuvirsinh Pravinsinh Parmar, Ram Avtar Gupta ................................................................. 71-80
UPRAVLJANJE NAVODNJAVANJEM NE-MONSUNSKIH USEVA U OBLASTI GLAVNOG KANALA U ISTOČNOJ INDIJI, U USLOVIMA OGRANIČENOG SNABDEVANJA VODOM Sanjay K. Raul, Tanaya A. Shinde, Sudhindra N. Panda.......................................................... 81-92
FURIJEOVA TRANSFORMACIJA - SPEKTROSKOPIJA U BLISKOJ INFRACRVENOJ OBLASTI ZA BRZO I NEDESTRUKTIVNO MERENJE SADRŽAJA AMILOZE U ZRNU PIRINČA Ravi Pandiselvam, Venkatachalam Thirupathi, Palanisamy Vennila ...................................... 93-100
C O N T E N T S
SELF PROPELLED SPOKE WHEEL NITROGEN APPLICATOR FOR RICE RESIDUE MULCHED WHEAT CROP Jagvir Dixit, Jaskarn Singh Mahal ............................................................................................... 1-10
DEVELOPMENT AND EVALUATION OF METERING MECHANISM FOR SOWING OF ONION SEED (Allium Cepa L.) Ravinder Chhina, Rohinish Khurana ......................................................................................... 11-20
SPECTRAL ANALYSIS FOR MONITORING CROP GROWTH USING TRACTOR MOUNTED SPECTRORADIOMETER AND HAND HELD GREENSEEKER IN COTTON Kothawale Anil Gautam, Vishal Bector, Varinderpal Singh, Manjeet Singh .............................. 21-30
COMPARATIVE FIELD EVALUATION OF DIFFERENT MECHANIZED PLANTING TECHNIQUES IN NAPIER-BAJRA Mahesh Kumar Narang, Rupinder Chandel, Rajesh Goyal, Davinder Pal Singh, Udham Singh Tiwana, Surinder Singh Thakur .......................................................................... 31-40
DEVELOPMENT AND PERFORMANCE EVALUATION OF PLANTAIN PEELER CUM SLICER Gourikutty Kunjurayan Rajesh, Ravi Pandiselvam, Aswathi Indulekshmi ................................. 41-50
THE DEVELOPMENT OF VERTICAL PATTERNATOR TO EVALUATE THE HYDRAULIC SPRAYERS El-Sayed Sehsah....................................................................................................................... 51-60
DEVELOPMENT OF MULTIVARIATE REGRESSION MODEL FOR QUANTIFICATION OF PROXIMATE CONTENT IN VIGNA RADIATA USING FOURIER TRANSFORM - NIR SPECTROSCOPY Ravi Pandiselvam, S. Sunoj, D. Uma ........................................................................................ 61-70
DESIGN AND DEVELOPMENT OF PULVERIZING ATTACHMENT TO CULTIVATOR Raghuvirsinh Pravinsinh Parmar, Ram Avtar Gupta ................................................................. 71-80
IRRIGATION MANAGEMENT FOR NON-MONSOON CROPS IN A MAJOR CANAL COMMAND IN EASTERN INDIA UNDER WATER LIMITING ENVIRONMENT Sanjay K. Raul, Tanaya A. Shinde, Sudhindra N. Panda.......................................................... 81-92
FOURIER TRANSFORM – NEAR INFRARED SPECTROSCOPY FOR RAPID AND NONDESTRUCTIVE MEASUREMENT OF AMYLOSE CONTENT OF PADDY Ravi Pandiselvam, Venkatachalam Thirupathi, Palanisamy Vennila ...................................... 93-100
Univerzitet u Beogradu Poljoprivredni fakultet Institut za poljoprivrednu tehniku
Naučni časopis POLJOPRIVREDNA TEHNIKA
Godina XLI Broj 2, 2016. Strane: 1 – 10
University of Belgrade Faculty of Agriculture
Institute of Agricultural Engineering
Scientific Journal AGRICULTURAL ENGINEERING
Year XLI No. 2, 2016.
pp: 1 – 10
UDK: 633.11 Originalni naučni rad
Original scientific paper
SELF PROPELLED SPOKE WHEEL NITROGEN APPLICATOR
FOR RICE RESIDUE MULCHED WHEAT CROP
Jagvir Dixit1*
, Jaskarn Singh Mahal2
1Sher-E-Kashmir University of Agricultural Sciences and Technology of Kashmir,
Division of Agricultural Engineering, Shalimar, Srinagar (J&K) India 2Punjab Agricultural University, College of Agricultural Engineering and Technology,
Ludhiana, Punjab, India
Abstract: In order to reduce nitrogen losses sustained in broadcasting of urea under
high rice straw mulched wheat crop and to enhance crop yield, a self propelled spoke
wheel nitrogen applicator for injecting nitrogen in liquid form beneath the soil surface
was designed, developed and evaluated under actual field conditions. The machine
comprised four sets of spoke wheel having radial injectors attached to a distribution hub
with inline mounted flow control valve and cut-off system. Constant supply of liquid
urea to the distribution hub by means of a piston pump produced pressure adequate to
expel urea solution through the flow control valve as it opened. The opening and closing
of flow control valve was regulated through a specially designed lever and stationery
cam. The average field capacity and efficiency of the machine were found to be 0.36
ha·h-1
and 88.9%, respectively. Yield and nitrogen use efficiency (NUE) of wheat crop
fertilized with spoke wheel nitrogen applicator was 20 and 47 % respectively higher than
that of broadcasting method of nitrogen application. Lower nitrogen accumulation in
mulch and higher nitrogen uptake in wheat crop indicated reduced nitrogen losses in
case of point injected nitrogen application over broadcasting. Hence, spoke wheel
nitrogen applicator acquires a promising option not only for enhancing crop yield but
also environment protection.
Key words: spoke wheel nitrogen applicator, broadcasting, rice straw mulch
concentration, nitrogen use efficiency, nitrogen uptake, yield
*Corresponding author. E- mail: [email protected]

Dixit iMahal: Samohodni aplikator . . . / Polj. Tehn. (2016/2). 1 - 10 2
INTRODUCTION
The sustainable food security for ever-increasing human population along with
environmental protection and conservation of natural resources have emerged as the
prime concerns for the global agriculture. Green revolution changed Indian agriculture
scenario and Punjab had major contribution in this revolution. Use of fertilizers,
pesticides, insecticides, high yielding varieties, and advanced machines helped in
agriculture growth. Rice-wheat cropping system became popular in Punjab [8]. The
developments of machinery like ‘Happy seeder’ for simultaneously mulching rice straw
while sowing wheat have provided the option of surface applied rice residue rather than
burning and incorporation [7]. Mulched rice residue result in less N immobilization and
also provide benefits viz. conservation of soil, water and weed suppression. No
difference in grain yield and biomass production has been reported for direct drilling of
wheat in the rice stubbles compared to traditional method of sowing. Some field studies
from India and China with reduced or no-till wheat and other cereal crops revealed that
mulching rice residue increased crop productivity [1].
The rapid adoption of mulch-tillage system in wheat after rice has led to increased
demand of nitrogenous fertilizer (urea) due to inefficient and improper application
method. About 40% of the N fertilizer applied to irrigated wheat is only utilized by the
plants due to inefficiency in application (wrong method or timing of application) [9].
The mulch retained the broadcasted fertilizer granules and ammonia volatilization losses
enhances, leading to a low N efficiency. The presence of crop residues on the soil
surface containing urea increases the rate of urea hydrolysis, thus increasing the potential
for ammonia volatilization in no-till systems. Where urea or urea-based fertilizers are
surface applied, particularly in the presence of organic residues, crop yields are often
reduced. There have been reports in the literature that suggests that higher nitrogen rates
are required to crops sown in straw mulch because fertilizer use efficiency of the plants
is limited in such conditions and crop becomes deficient of nitrogen at recommended
rate of fertilizer application [3].
Therefore, a new innovation to overcome the problem of improper and inefficient
top dress nitrogen application in high residue mulched no-till wheat in the RW system is
warranted. An approach that has not been well explored is the use of point injection of
urea in mulch seeded wheat. The objective of this study was to design and develop a
spoke wheel nitrogen applicator for application of liquid urea in rice straw mulched
wheat crop.
MATERIAL AND METHODS
The self-propelled spoke wheel nitrogen applicator was designed and developed
based on its required function. The design of nitrogen (liquid urea) applicator is based on
the idea that using a narrow spoke wheel with injectors on its periphery shall work as
liquid urea applicator in straw mulched wheat crop. The cone shaped injector on spoke
wheel periphery would penetrate the straw mulch more easily by the weight of the
machine and require less vertical force. To increase further penetration of liquid urea in
the soil and also to prevent clogging of injectors, the liquid urea needs to be applied at
some pressure.

Dixit and Mahal: Self Propelled . . . / Agr. Eng. (2016/2). 1 - 10 3
Keeping in view conceptual and functional design, a prototype model of nitrogen
(liquid urea) application mechanism (Fig. 1) was fabricated and evaluated under
simulated conditions for its working performance. The water was applied at variable
operating pressure ranging from 2.0 to 4.0 kg·cm-2
with sprayer pump. It was observed
that operating pressure ≤ 2 kg·cm-2
leads to clogging of injectors and insufficient depth
of injection while operating pressure ≥ 3.5 kg·cm-2
leads to leakage and excessive
disturbance of soil. The prototype model worked satisfactorily at operating pressures
ranging from 2.0 to 3.5 kg·cm-2
. The average depth of injection was found varying from
25.80 -36.50 mm at operating pressure range of 2.0 - 3.5 kg·cm-2
. The average spread
diameter of wetted soil was observed in the range of 75.90 - 104.70 mm. Observing the
satisfactory performance of prototype model of nitrogen applicator, a 4-row self
propelled spoke wheel nitrogen applicator prototype was conceived and developed.
Figure 1. View of prototype model of nitrogen (liquid urea) applicator
Constructional details of the machine. The spoke wheel nitrogen applicator was
developed as a rear mounted attachment to self propelled engine unit (Fig. 2). The basic
components of the machine were 4 sets of spoke wheel with fertilizer metering and cut-
off mechanism, a pump, a fertilizer tank and a pressure gauge. The function of each part
and development are as follows.
Figure 2. View of self propelled spoke wheel nitrogen applicator
Main frame. The tool bar served as a support to attach the spoke wheel assembly to
a prime mover. The tool bar assembly comprised two support arms rotation secured at

Dixit iMahal: Samohodni aplikator . . . / Polj. Tehn. (2016/2). 1 - 10 4
one end to the spoke wheel assembly and another end to a support plate. The support
plate was used for attachment of the implement to a tool bar by two U-clamps. The four
units of spoke wheel nitrogen applicator were clamped on the tool bar at uniform spacing
of 400 mm between consecutive spoke wheels. The spring biased joint used a coil spring
to keep the support arm in a downward direction to prevent skidding and permitted the
support arm to move upward if spoke wheel encountered any obstruction.
Spoke wheel. A set of four spoke wheels were mounted on the frame. The spoke
wheel assembly included a fertilizer metering and cut-off mechanism and a circular rim
that is concentric with the distribution hub. The circular rim of 640 mm diameter was
welded with trapezoidal shaped lugs on the periphery for the positive rotation under
mulch conditions. The rim served as a means for bracing and stabilizing the position of
the spokes with respect to distribution hub and controlling depth of penetration in the
soil.
Fertilizer Metering and Cut-off mechanism. It consisted of a distribution hub acting
as a reservoir in which water dissolved urea was supplied longitudinally from one side
and exit tangentially out of spokes mounted on the periphery of the distribution hub. The
distribution hub mounted on an axle with two ball bearings at both ends and acted as a
rotary valve for metering and supplying liquid urea from the main supply to the spokes
fitted on the periphery of the distribution hub. An inline mounted flow control valve was
provided to regulate the liquid urea flow between distributor and injector. Each flow
control valve fitted in spoke assembly was provided with independent cutoff lever. A
specially designed crank lever regulated the opening and closing of flow control valve.
The load arm of the lever was attached with a helical tension spring, which kept the flow
control valve in closed position. The effort arm of the crank lever was actuated by a
stationery cylindrical cam fitted tangentially on a plate with the spoke wheel. The cam
was so designed that it operated the cutoff lever for 30° of rotation of spoke wheel as an
injector touches the soil surface. With the rotation of spoke wheel, the effort arm of the
lever strikes with the cam and is pushed back; which resulted into the opening of the
flow control valve. As the lever arm passes the cam, the flow control valve comes to its
closed position by the tension of the spring.
Pump. A double cylinder piston pump was used for the supply of liquid urea at
constant pressure to the distribution hub. A control valve assembly was provided to
regulate the pressure and bypass the extra quantity of liquid fertilizer to the fertilizer
tank. The pump could develop maximum pressure up to 28 kg·cm-2
at 950 min-1
with
suction capacity of 13 l·min-1
.
Fertilizer Tank. A mild steel tank having capacity of 100 L was used to store the
liquid urea solution. The urea solution is fed to the pump from the tank by pump and at
the open end of the suction pipe a strainer was provided to prevent the flow of foreign
materials with the liquid urea solution. The open end of the bypass pipe was connected
with the tank so that the liquid urea solution which was not utilized by the spoke wheels
could go back to the tank. The fertilizer tank was sufficient for liquid urea application of
480 m2 area.
Pressure Gauge. A pressure gauge was provided to check the operating pressure at
which liquid urea solution has to be delivered to the distribution hub by the main supply.
A control valve was provided in each supply line to maintain the desired flow rate.
Prime-mover. A diesel engine of 4.48 kW was selected as prime mover for
operating the spoke wheel nitrogen applicator. It had two narrow rubber wheels which

Dixit and Mahal: Self Propelled . . . / Agr. Eng. (2016/2). 1 - 10 5
were powered from the engine through gears and chains. The ground clearance of the
machine was kept 500 mm taking in view the crop height at the time of fertilizer
application. A third wheel was provided at the rear to act as transport wheel. A provision
was made to adjust the track width from 900 to 1050 mm. A pump operating lever was
provided on the handle to operate the pump during the nitrogen (liquid urea) application
in the field. A transmission clutch lever was also provided on the handle to control the
transmission system of the machine. An accelerator lever regulated the forward speed of
the machine.
Field evaluation of the machine. The developed machine was evaluated in straw
mulched wheat crop twice during the crop season. The operating pressure of pump was
fixed at 3.0 kg·cm-2
and machine was operated at a forward speed of 2.5 km·h-1
in the
field. At this operating pressure and forward speed, the machine delivers 2095 lit·ha-1
solution of urea [2]. Accordingly, the solution of urea was prepared by mixing required
dose of urea with water. The fertilizer tank was filled with solution of urea. A hand lever
has been provided for the on/off operation of the pump. With the engagement of lever,
the pump starts the supply of urea solution to the spoke wheel. During rotation of the
spoke wheel, it carries urea solution into the distribution hub and delivers them to the
injectors through spokes. Fertilizer applicator delivers the urea solution at 250 mm
spacing along the row and 400 mm row spacing (alternate row).
An experiment was laid out in a factorial randomized block design with three
replications comprising of six treatments with two levels of rice straw mulch
concentration and three levels of methods of fertilizer application. The plots size of each
plot was 14 x 12 m2. Following were the treatments:
A. Methods of Nitrogen Application (3 methods)
M1: Application of N with developed machine (0 + ½ N after 1st irrigation + ½ N
after 2nd
irrigation)
M2: Broadcasting of N as per University package of practice (½ N during sowing
+ 1/4th
N after 1st irrigation + 1/4
th N after 2
nd irrigation)
M3: Broadcasting of N general practice followed by farmers using ‘Happy seeder’
(0 + ½ N before 1st irrigation + ½ N before 2
nd irrigation)
B. Rice Straw Mulch Concentration (2 levels)
L1: Low straw mulch concentration (4.6 t·ha-1
)
L2: High straw mulch concentration (8.0 t·ha-1
)
Constant Parameters: Wheat directly sown in combine harvested paddy field using
‘Happy seeder’.
All the experimental plots were sown uniformly using ‘Happy Seeder’ under two
rice straw mulch concentration conditions. Wheat (variety PBW-621) was sown on
November 9, 2012 and all the plots received a basal dose of 26 kg·P·ha-1
and 25
kg·K·ha-1
prior to sowing. Fertilizer nitrogen 110 kg·N·ha-1
was applied as per
treatments of methods of N application. In all M1 treatments, nitrogen fertilizer (water
dissolved urea) was point injected in two splits using spoke wheel nitrogen (liquid urea)
applicator (Fig. 3). In M2 treatment, recommended dose of urea was broadcasted in three
splits after 4-5 days of irrigation while in M3 treatment, recommended dose of urea was
broadcasted in two splits before the application of irrigation. All other practices for
growing wheat crop were followed as recommended by Punjab Agricultural University,
Ludhiana.

Dixit iMahal: Samohodni aplikator . . . / Polj. Tehn. (2016/2). 1 - 10 6
Figure 3. Real and field operational view of self propelled spoke wheel nitrogen applicator
RESULTS AND DISCUSSION
The Average operating time, field capacity and operation efficiency of the self-
propelled spoke wheel nitrogen applicator were 2.78 h·ha-1
, 0.36 ha·h-1
, 88.9%,
respectively. The fuel (High speed diesel) consumption of self propelled nitrogen (liquid
urea) applicator was 0.980 lit·h-1
.
Effect of Methods of Nitrogen Application on N Uptake and yield attributes.
Total Plant N Uptake. N-uptake is interplay of biomass production and N-
concentration. Highest total plant N uptake at maturity (121.44 kg·ha-1
) occurred in case
of M1 method of N application at high straw load while lowest N uptake (76.16 kg·ha-1
)
was observed in case of M2 method of N application at high straw mulch concentration
(Fig. 4). Total plant N uptake did not differ at different straw mulch concentration with
M1 method of N application while plant N uptake differ significantly at different straw
mulch concentration with M2 and M3 methods of N application.
Figure 4. Effect of methods of nitrogen application on plant N uptake
Nitrogen accumulation in straw mulch. Nitrogen accumulation in straw mulch
indicating nitrogen loss tended to be similar among treatments at the time of sowing. The

Dixit and Mahal: Self Propelled . . . / Agr. Eng. (2016/2). 1 - 10 7
N accumulation in straw mulch in case of broadcast (M2 & M3) methods of N application
increased or remained same during the crop growing season whereas it showed
decreasing trend in case of M1 method of N application. At 70 DAS, mean N
accumulation in mulch was significantly lower in case of M1 than M3 and M2 methods of
N application. But no significant difference of N accumulation in mulch among M2 and
M3 methods of N application was observed at this stage. At the time of crop maturity, the
N accumulation in straw mulch in case of M1 method of N application was significantly
lower than that of M2 and M3 methods (Fig. 5). The lower accumulation of N in straw
mulch indicated low nitrogen loss in M1 method of nitrogen application. This might be
due to non contact of nitrogen fertilizer with straw mulch during application which could
be coupled with the favourable effect for enhancing the crop yield.
Figure 5. Effect of methods of nitrogen application on N accumulation in straw mulch
Grain Yield and attributes. Methods of N application had significant effect on the
number of earhead per m row length (P <0.05), length of earhead (P < 0.05), grain
number per earhead (P <0.01), 1000-grain weight (P <0.05) and the grain yield (P
<0.01). Mean comparisons showed that point injected nitrogen through spoke wheel
nitrogen applicator increased all of the above yield components (Tab. 1). The highest
number of earhead per m row length, higher earhead length, higher numbers of grains
per earhead resulted for point injected nitrogen (liquid urea) applied by nitrogen
applicator (M1) at recommended dose than other broadcasting treatments (M2 and M3)
but there were no significant difference of number of grains per earhead among the
treatments M2 and M3. Similar trends were obtained for 1000 grain weight with highest
1000 grain weight in case of point injected nitrogen application (M1). The higher 1000
grain yield in case of M1 might be due to higher nitrogen concentration in plant tissue.
The researcher [6] also reported higher 1000 grain weight in case of fertilizer injection as
compared to broadcasting method. It can also be observed from the table that
significantly higher grain yield for point injected nitrogen application with nitrogen
applicator (M1) than that of broadcasting urea (M2 & M3). There were no significant
differences of grain yield between M2 and M3 treatments of N application. The
researcher [4] also observed 15.5% significant higher wheat yield by injection method in
comparison with the conventional method (broadcasting).

Dixit iMahal: Samohodni aplikator . . . / Polj. Tehn. (2016/2). 1 - 10 8
Nitrogen Use Efficiency (NUE). The NUE in case of urea solution injected with
spoke wheel nitrogen applicator (M1) was 47.1% more than that of broadcasting of urea
(M2) (Fig. 6). Lower wheat NUE in broadcasting of urea under straw mulch conditions
was due to lesser availability of N to the plant and lower grain yield and higher wheat
NUE in nitrogen application with spoke wheel nitrogen applicator may be ascribed to
more N uptake and higher grain yield. Based on the result findings, the researcher [5]
strongly recommended injection fertilization in case of minimum or zero tillage cereal
crops.
Table 1. Effect of different nitrogen application methods on Yield Components
Treatment
Yield attributes*
No of ear-heads
per m row length
Ear-head
length
[cm]
Number of grains
per ear-head
1000 grain
weight
[gm]
Grain yield
[q·ha-1]
M1 97.61a 11.00a 54.42a 42.18a 54.23a
M2 86.56b 10.10b 42.56b 39.38b 45.28b
M3 93.42c 10.33c 44.33b 39.16b 46.92b
Note: Common letter in the same column are not significantly different at P≤ 0.05 by LSD
*Average values at two straw mulch concentration
Figure 6. Effect of methods of nitrogen application on nitrogen use efficiency (NUE)
CONCLUSIONS
The developed spoke wheel nitrogen applicator was found efficient and
environmentally viable for injection of nitrogen (liquid urea) in straw mulched wheat
crop. The point injected nitrogen application in rice straw mulched wheat crop enhanced
20 % grain yield and 47 % nitrogen use efficiency over broadcasting of urea. The lower
N accumulation in straw mulch in case of point injected N application through spoke
wheel nitrogen applicator indicated the reduced N loss under this system of fertilizer
urea application particularly under straw mulched conditions. Significant higher N
uptake was observed in case of point injected N application over surface broadcast in the
presence of rice straw mulch.
Dixit and Mahal: Self Propelled . . . / Agr. Eng. (2016/2). 1 - 10 9
BIBLIOGRAPHY
[1] Bijay Singh, Shan, Y.H., Johnson-Beebout, S.E., Singh, Y., Buresh, R.J. 2008. Crop residue
management for lowland rice-based cropping systems in Asia. Advances in Agronomy,
98:201–270.
[2] Dixit, J., Mahal, J.S., Manes, G.S., Singh, M. 2015. Development and standardization of
nitrogen (liquid urea) application metering mechanism for point injection nitrogen applicator.
J. Ag. Eng. 15(4).
[3] Gangwar, K.S., Singh, K.K., Sharma, S.K., Tomar, O.K. 2006. Alternative tillage and crop
residue management in wheat after rice in sandy loam of Indo-Gangetic plains. Soil and
Tillage Res,. 88: 242-252.
[4] Kubesova, K., Balik, J., Sedlar, O., Peklova, L. 2013. The effect of injection application of
ammonium fertilizer on the yield of maize. Sci Agri Bohem,. 44(1): 1–5.
[5] Kücke, M., Gref, J.M. 2006. Experimental results and practical experiences with the fluid
fertilizers point injection fertilization in Europe and potentials to optimize fertilization and to
minimize environmental pollution. Proceeding of 18th World Congress Soil Sci. Pp 170-
22.Philadelphia, Pennsylvania, USA.
[6] Sedlar, O., Balik, J., Kozlovsky, O., Peklova, L., Kubesova, K. 2011. Impact of nitrogen
fertilizer injection on grain yield and yield formation of spring barley. Plant and Soil
Environ., 57 (12): 547–552.
[7] Sidhu, H.S., Singh, M., Humphreys, E., Singh, Y., Singh, B., Dhillon, S.S., Blackwell, J.,
Bector, V., Singh, M., Singh, S. 2007. The HS enables direct drilling of wheat into rice
stubble. Aus. J. Exp. Agri., 47: 844-854.
[8] Singh, H., Singh, K., Singh, M., Bector, V., Sharma, K. 2015. Field evaluation of tractor
mounted soil sensor for measurement of electrical conductivity and soil insertion /
compaction force. J. Agril. Engg., 15(3), 33-42.
[9] Singh, Y., Sidhu, H.S., Singh, M., Humphreys, E., Kukal, S.S., Brar, N. K. 2008. Straw
mulch, irrigation water and fertilizer N management effects on yield, water use and N use
efficiency of wheat sown after rice. Proceeding of Permanent beds and rice residue
management for rice-wheat systems in the Indo-Gangetic plain. pp 171-181 Centre for
International Agricultural Research, Canberra.
SAMOHODNI APLIKATOR ZA UBRIZGAVANJE TEČNOG AZOTA
U USEVU PŠENICE NA USITNJENIM ŽETVENIM OSTACIMA PIRINČA
Jagvir Dixit1, Jaskarn Singh Mahal
2
1Univerzitet za poljoprivredne nauke i tehnologiju Sher-E-Kashmir,
Odsek za poljoprivrednu tehniku, Shalimar, Srinagar (J&K) India 2Poljoprivredni univerzitet Punjab, Fakultet za poljoprivrednu tehniku i i tehnologiju,
Ludhiana, Punjab, India
Sažetak: Sa ciljem smanjenja gubitaka azota pri ubacivanju uree pod usitnjene
žetvene ostatke radi povećanja prinosa, konstruisan je samohodni aplikator za
ubrizgavanje tečnog azota pod površinu zemljišta. Mašina se sastoji od četiri kompleta
Dixit iMahal: Samohodni aplikator . . . / Polj. Tehn. (2016/2). 1 - 10 10
točkova sa paocima i injektorima postavljenim na haubu sa ugrađenim ventilom za
kontrolu protoka i isključenje sistema. Konstantan dotok tečne uree do distributera preko
klipne pumpe obezbeđen je odgovarajućim pritiskom za izbacivanje rastvora uree kad je
kontrolni ventil otvoren. Otvaranje i zatvaranje kontrolnog ventila je regulisano
specijalno konstruisanom ručicom. Srednji poljski kapacitet i efikasnost mašine su
iznosili 0.36 ha·h-1
i 88.9%, redom. Prinos i efikasnost iskorišćenja azota (NUE) kod
pšenice đubrene ovim aplikatorom azota bili su 20 i 47%, redom, viši nego pri
uobičajenom rasturanju azota. Niža akumulacija azota u malču i više usvajanje azota kod
pšenice ukazuju na manje gubitke azota kod tačkastog ubrizgavanja azota u odnosu na
rasturanje. Tako ovaj aplikator azota predstavlja povoljniju opciju, ne samo za povećanje
prinosa nego i za zaštitu okoline.
Ključne reči: orebreni točak za aplikaciju azota, emisija, koncentracija usitnjene
slame pirinča, efikasnost iskorišćenja azota, usvajanje azota, prinos
Prijavljen:
Submitted: 29.09.2015.
Ispravljen:
Revised:
Prihvaćen:
Accepted: 28.05.2016.

Univerzitet u Beogradu Poljoprivredni fakultet Institut za poljoprivrednu tehniku
Naučni časopis POLJOPRIVREDNA TEHNIKA
Godina XLI Broj 2, 2016. Strane: 11 – 20
University of Belgrade Faculty of Agriculture
Institute of Agricultural Engineering
Scientific Journal AGRICULTURAL ENGINEERING
Year XLI No. 2, 2016. pp: 11 – 20
UDK: 663 / 664 Originalni naučni rad
Original scientific paper
DEVELOPMENT AND EVALUATION OF
METERING MECHANISM FOR SOWING OF ONION SEED
(ALLIUM CEPA L.)
Ravinder Chhina1*
, Rohinish Khurana2
1Krishi Vigyan Kendra (KVK) at Gurdaspur,
2Punjab Agricultural University, College of Agricultural Engineering,
Department of Farm Machinery and Power Engineering, Ludhiana, India
Abstract: Onion (Allium cepa L) is one of the major vegetable crops grown
throughout the country. It is widely grown in different parts of the country mainly by
small and marginal farmers. Generally, the onion seeds are sown in nursery and
transplanted with row to row spacing of 15 cm and plant to plant spacing of 7.5 cm to
get optimum yield. The labour requirement in manual transplanting of onion seedlings is
as high as 100 - 120 man-days·ha-1
as 8.9·105 seedlings per hectare are to be
transplanted. Because of high requirement and shortage of labor, the area under onion
cultivation is low and can be increased by mechanization of this crop. An inclined plate
was developed for metering of onion seed. The plate was evaluated on the basis of
performance parameters i.e. missing index, multiple index, average seed spacing, quality
of feed index, seed rate, seed damage and degree of variation at four forward speeds
(1.0, 1.5, 2.0 and 2.5 km·h-1
) and three angles of inclination (47o, 55
o and 62
o) of seed
metering plate with horizontal for three cultivars of onion seed (Punjab Naroya (PN),
Agrifound Light Red (ALR) and Agrifound Dark Red (ADR)). The missing index
increased, whereas multiple index and seed rate decreased with increase in forward
speed for all the varieties and each angle of inclination of the inclined plate with
horizontal. Considering all the performance parameters, it was concluded that the
forward speed should be in the range of 1 – 1.5 km·h-1
and an angle of inclination of
seed plate should be 55o with horizontal.
Key words: seed metering mechanism, onion, inclined plate, direct seeding,
vegetable crops, planter, missing index, seed rate, seed spacing, multiple index
* Corresponding author. E-mail: [email protected]

Chhina i Khurana: Razvoj i ocena . . . / Polj. Tehn. (2016/2). 11 - 20 12
INTRODUCTION
Onion (Allium cepa L.) is one of the major vegetable crop grown throughout the
country. It is widely grown in different parts of the country mainly by small and
marginal farmers. In Maharashtra and Gujrat, this crop has gained the importance of
cash crop rather than a vegetable crop because of its very high export potential.
Maharashtra alone contributes 32% of the total national production. Nasik district alone
contributes 30-40% of the state’s production. In India, Maharashtra is a leading onion
whereas the productivity of onion is the highest in Gujarat (25.43 t·ha-1
) followed by
Madhya Pradesh (24.09 t·ha-1
) and Bihar (24.01 t·ha-1
) [1]
Generally, the onion seeds are sown in nursery and transplanted with row to row
spacing of 15 cm and plant to plant spacing of 7.5 cm to get optimum yield. During
onion cultivation, transplanting of seedlings, weeding and harvesting are the most labour
intensive operations that are presently done manually in India. The labour requirement in
manual transplanting of onion seedlings is as high as 100 – 120 man- days·ha-1
as 8.9
lakh seedlings per hectare are to be transplanted [5]. Because of high requirement and
shortage of labor, the area under onion cultivation is low and can be increased by
mechanization of this crop. Onion harvester being developed by the Department of Farm
Machinery and Power Engineering, PAU, Ludhiana, whereas very little effort has been
done regarding planting/transplanting of onions.
Onion can also be grown by direct seeding method which is labour saving. The
direct seeding of onion seeds is evolving technology where new techniques of soil
preparation, irrigation, fertilizer and pesticide application, seed production and seed
processing continue to interact to increase the probability that a well synchronized
population of the desired plant density is established. The seed of onion is of very small
size, having low density and irregular shape which poses problem in precision planting.
To overcome these difficulties ‘Seed Pelleting Technique’ is being used in the developed
countries. In this seed is enclosed in to small quantity of inert material just large enough
to produce a globular unit of standard size to facilitate precision planting. In India very
little effort has been done for seed pelleting and development of precision planter/drill
for sowing the small size, light weight and irregular shaped seeds.
Metering mechanism, the heart of sowing machine distributes seed uniformly at a
desired application rate with minimum damage. The commonly recommended metering
mechanisms for planters are horizontal plate, inclined plate, vertical rolls with cells etc.
[6]. The inclined plate metering system was best suited for metering soaked okra seed
[8]. In light of above facts a study was undertaken to develop a metering mechanism i.e
inclined plate for mechanical seeding of onion seed.
MATERIAL AND METHODS
Based on the linear dimensions of the onion seeds an inclined plate was developed
by adopting design procedure adopted by [2] and [7]. Five design variables shown in
(Fig.1) are defined and used to determine the exact size of the groove.
Dg - Depth of the groove. It should be slightly larger than the length of seed.
θg - The open angle of groove. It is defined as an angle between the two straight
lines connecting the starting and final points of the groove and the centre of

Chhina and Khurana: Development and Evaluation . . . / Agr. Eng. (2016/2). 11 - 20 13
the plate, respectively. It determines the loading process of the groove.
βrs - The right side angle of the groove. It determines the ease in loading process
of the groove.
βls - The left side angle of the groove. It determines the seed holding capacity.
Rc - Denotes radius of the curvature of groove bottom. Round groove bottom
prevents seeds or other substances from clinging to the bottom.
Figure 1. View of plate showing different variables
A brass plate of diameter 130 mm was used to fabricate inclined plate for metering
of onion seed. The depth of the groove was selected on the basis of maximum
dimensions of the onion seed among the three cultivars studied i.e., Punjab Naroya (PN)
Agrifound Light Red (ALR) and Agrifound Dark Red (ADR) which ranged from 2.09 to
3.28 mm. Based on these dimensions; the depth of the groove was selected as 3.5 mm,
keeping it 10 per cent more than the maximum major dimension of the seed. The
opening of the groove at the periphery of the plate was kept as 5mm, such that two to
three seeds are loaded when the groove passes through the seed mass depending upon
the orientation of seed. The right angle and the left angle of the groove were selected as
60o and 40
o such that easy loading of the groove should be done and as well as the seed
loaded in the groove should be retained upto the release point (Fig. 2) The different
values of the variables are as under: Dg - 3.5 mm, θg - 5o, βrs - 60
o, βls - 40
o, Rc - 1.5 mm
The bottom of the groove was kept round so that the seeds and foreign matter
doesn’t clings to the groove. The bottom of the grove had a radius of 1.5 mm. In addition
to that, a brush was provided, which was always in contact with the seed plate after the
point of release. The brush helps to remove any seed or foreign particle that sticks in the
groove, to ensure that the groove is empty when it moves through the seed mass again.
Laboratory evaluation of the prototype. The developed metering mechanisms was
evaluated in the laboratory for the missing index, multiple index, average seed spacing,
quality of feed index, seed rate, seed damage and degree of variation as per the planned
experiment (Tab. 1). The performance parameters were monitored and evaluated
according to the procedure described by [4],[8], [9].
Chhina i Khurana: Razvoj i ocena . . . / Polj. Tehn. (2016/2). 11 - 20 14
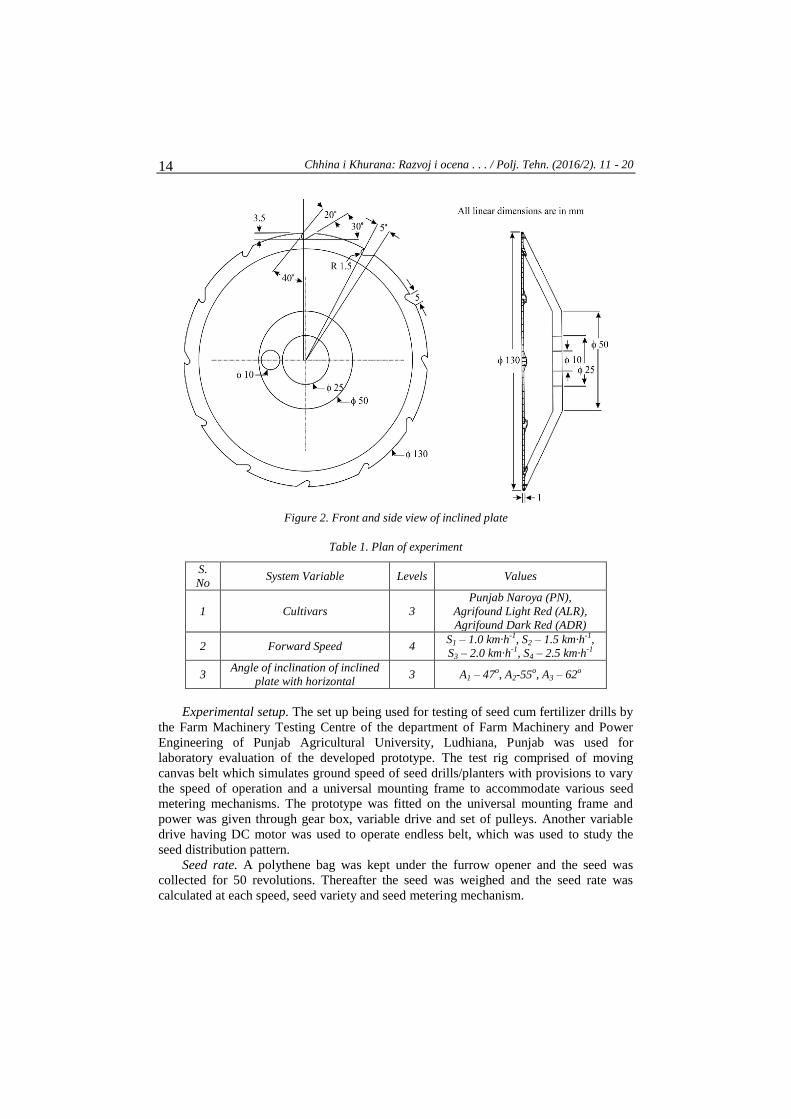
Figure 2. Front and side view of inclined plate
Table 1. Plan of experiment
S.
No System Variable Levels Values
1 Cultivars 3
Punjab Naroya (PN),
Agrifound Light Red (ALR),
Agrifound Dark Red (ADR)
2 Forward Speed 4 S1 – 1.0 km·h-1, S2 – 1.5 km·h-1,
S3 – 2.0 km·h-1, S4 – 2.5 km·h-1
3 Angle of inclination of inclined
plate with horizontal 3 A1 – 47o, A2-55o, A3 – 62o
Experimental setup. The set up being used for testing of seed cum fertilizer drills by
the Farm Machinery Testing Centre of the department of Farm Machinery and Power
Engineering of Punjab Agricultural University, Ludhiana, Punjab was used for
laboratory evaluation of the developed prototype. The test rig comprised of moving
canvas belt which simulates ground speed of seed drills/planters with provisions to vary
the speed of operation and a universal mounting frame to accommodate various seed
metering mechanisms. The prototype was fitted on the universal mounting frame and
power was given through gear box, variable drive and set of pulleys. Another variable
drive having DC motor was used to operate endless belt, which was used to study the
seed distribution pattern.
Seed rate. A polythene bag was kept under the furrow opener and the seed was
collected for 50 revolutions. Thereafter the seed was weighed and the seed rate was
calculated at each speed, seed variety and seed metering mechanism.
Chhina and Khurana: Development and Evaluation . . . / Agr. Eng. (2016/2). 11 - 20 15
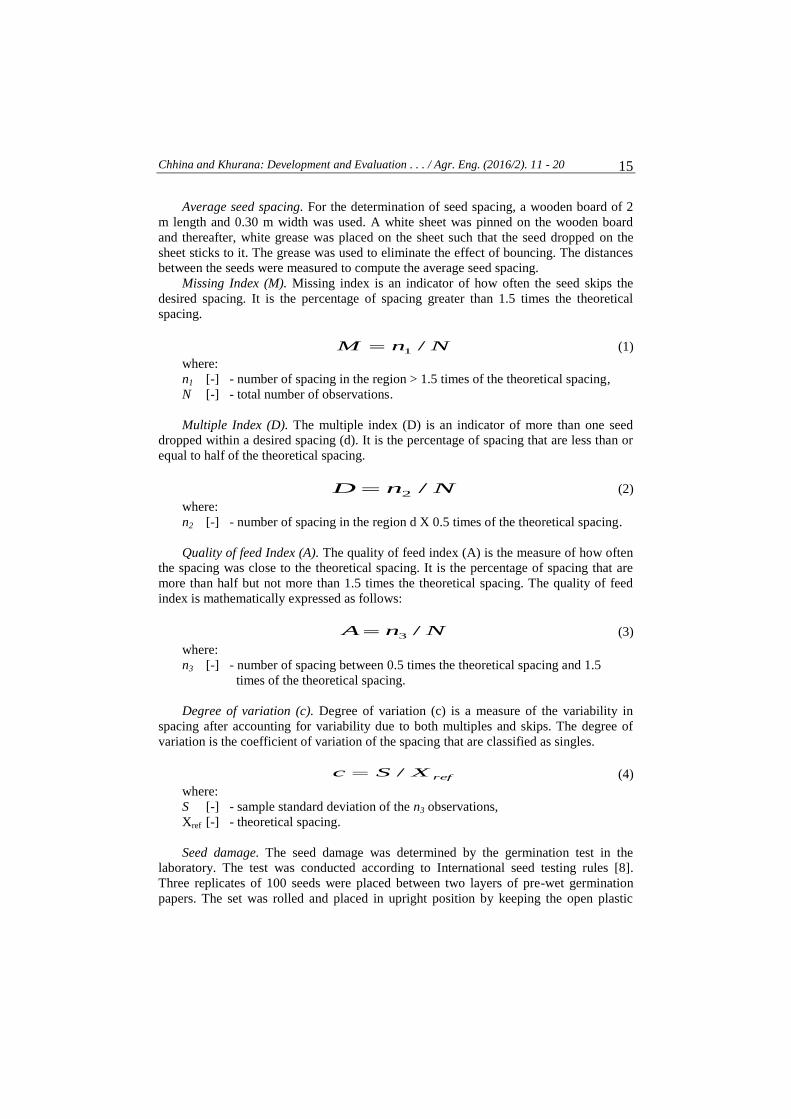
Average seed spacing. For the determination of seed spacing, a wooden board of 2
m length and 0.30 m width was used. A white sheet was pinned on the wooden board
and thereafter, white grease was placed on the sheet such that the seed dropped on the
sheet sticks to it. The grease was used to eliminate the effect of bouncing. The distances
between the seeds were measured to compute the average seed spacing.
Missing Index (M). Missing index is an indicator of how often the seed skips the
desired spacing. It is the percentage of spacing greater than 1.5 times the theoretical
spacing.
NnM /1 (1)
where:
n1 [-] - number of spacing in the region > 1.5 times of the theoretical spacing,
N [-] - total number of observations.
Multiple Index (D). The multiple index (D) is an indicator of more than one seed
dropped within a desired spacing (d). It is the percentage of spacing that are less than or
equal to half of the theoretical spacing.
NnD /2 (2)
where:
n2 [-] - number of spacing in the region d X 0.5 times of the theoretical spacing.
Quality of feed Index (A). The quality of feed index (A) is the measure of how often
the spacing was close to the theoretical spacing. It is the percentage of spacing that are
more than half but not more than 1.5 times the theoretical spacing. The quality of feed
index is mathematically expressed as follows:
NnA /3
(3)
where:
n3 [-] - number of spacing between 0.5 times the theoretical spacing and 1.5
times of the theoretical spacing.
Degree of variation (c). Degree of variation (c) is a measure of the variability in
spacing after accounting for variability due to both multiples and skips. The degree of
variation is the coefficient of variation of the spacing that are classified as singles.
refXSc / (4)
where:
S [-] - sample standard deviation of the n3 observations,
Xref [-] - theoretical spacing.
Seed damage. The seed damage was determined by the germination test in the
laboratory. The test was conducted according to International seed testing rules [8].
Three replicates of 100 seeds were placed between two layers of pre-wet germination
papers. The set was rolled and placed in upright position by keeping the open plastic

Chhina i Khurana: Razvoj i ocena . . . / Polj. Tehn. (2016/2). 11 - 20 16
bucket in germinator. The germinator was operated at 20°C and 85% relative humidity
for 15 days. After fifteen days the number of non germinated seeds was recorded and the
seed damage was computed on the basis of germination of the seeds.
RESULTS AND DISCUSSION
Missing index. Missing index is an indicator of the skips in seed metering with in a
desired spacing. The missing index was effected by all the parameters studied, i.e.
forward speed and angle of inclination of seed metering plate with horizontal for all the
three cultivars. The perusal of Fig. 4 reveals that for a particular angle, increase in
forward speed resulted in increase of missing index. At an angle of 55°, missing index
was observed to be 0.09, 0.16, 0.25 and 0.44 at corresponding forward speeds of 1.0, 1.5,
2.0 and 2.5 km·h-1
respectively for cultivar Punjab Naroya. The change in angle also
influenced the missing index. Variation in missing index was more pronounced when the
angle was changed from 47° to 55
°. At every forward speed the missing index increased
with increase in angle. Analysis of variance also indicated the significant effect of
forward speed and angle of inclination on missing index in all the three cultivars. The
increase in missing index with increase in forward speed might be due to decrease in
exposure time of cell to seed in the hopper and also the higher centrifugal force at higher
speeds may be the reason which throws the seeds from the cell prematurely.
Figure 3. Effect of forward speed and angle of inclination on missing index
for the three cultivars of onion
Multiple index. The multiple index is an indicator of more than one seed dropped
within a desired spacing. The multiple index decreased with increase in forward speed as
well as with increase in angle of inclination of inclined plate with horizontal (Fig. 5). At
an angle of 47o, 55
o, 62
o, the multiple index decreased from 0.32 to 0.27, 0.29 to 0.15
and 0.26 to 0.10 when forward speed was increased from 1.0 to 2.5 km·h-1
for a cultivar
ALR. Analysis of variance also indicated that forward speed and angle of inclination of
inclined plate with horizontal had significant effect on multiple index
Average seed spacing. The average seed spacing increased with increase in forward
speed at all the angles studied for the three cultivars. It was observed that the average
seed spacing was approximately close to the theoretical spacing (7.5 cm) at the forward

Chhina and Khurana: Development and Evaluation . . . / Agr. Eng. (2016/2). 11 - 20 17
speed of 1.0 and 1.5 km·h-1
at an angle of 55o for all the three cultivars where it deviated
at other speeds and angles (Fig. 6). The reason might be the increase in missing and
decrease in multiples with the increase in speed. Analysis of variance also indicated that
the forward speed had significant effect on average seed spacing. At an angle of 55o,
average seed spacing was observed to be 7.27, 7.50, 7.92 and 10.46 for forward speed of
1.0, 1.5, 2.0 and 2.5 km·h-1
respectively for Punjab Naroya.
Figure 4. Effect of forward speed and angle of inclination on multiple index
for the three cultivars of onion
Figure 5. Effect of forward speed and angle of inclination on average seed spacing (cm)
for the three cultivars of onion
Quality of feed index. The variation in quality of feed index for PN was observed to
be 0.50 to 0.60, 0.44 to 0.67 and 0.51 to 0.63 with the variation in forward speed for PN,
ALR and ADR respectively (Tab. 2). The higher values of feed index were observed at
slower speed levels, whereas it was lower at higher speed levels. The quality of feed
index decreased with increase in speed Analysis of variance also indicated that the
forward speed had significant on quality of feed index.
Seed rate. The seed rate decreased with increase in forward speed at all the angles
studied for all the three cultivars (Tab. 2). For an angle of 47o, seed rate was observed to
be 3.90, 3.43, 3.08 and 2.98 kg·ha-1
at forward speed of 1.0, 1.5, 2.0 and 2.5 km·h-1
for
PN. Analysis of variance also indicated that the forward speed had significant effect on
Chhina i Khurana: Razvoj i ocena . . . / Polj. Tehn. (2016/2). 11 - 20 18
seed rate. The reduction in seed rate was due to increase in missing index and decrease
in multiple index with the increase in forward speed.
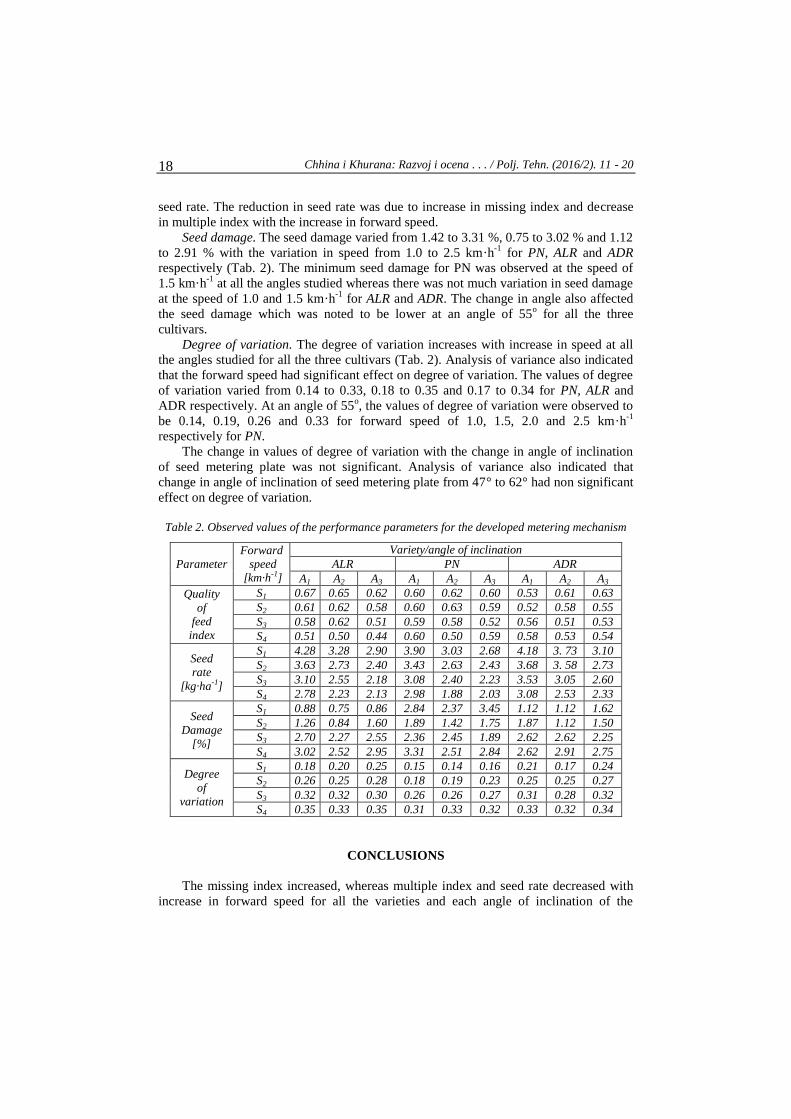
Seed damage. The seed damage varied from 1.42 to 3.31 %, 0.75 to 3.02 % and 1.12
to 2.91 % with the variation in speed from 1.0 to 2.5 km·h-1
for PN, ALR and ADR
respectively (Tab. 2). The minimum seed damage for PN was observed at the speed of
1.5 km·h-1
at all the angles studied whereas there was not much variation in seed damage
at the speed of 1.0 and 1.5 km·h-1
for ALR and ADR. The change in angle also affected
the seed damage which was noted to be lower at an angle of 55o for all the three
cultivars.
Degree of variation. The degree of variation increases with increase in speed at all
the angles studied for all the three cultivars (Tab. 2). Analysis of variance also indicated
that the forward speed had significant effect on degree of variation. The values of degree
of variation varied from 0.14 to 0.33, 0.18 to 0.35 and 0.17 to 0.34 for PN, ALR and
ADR respectively. At an angle of 55o, the values of degree of variation were observed to
be 0.14, 0.19, 0.26 and 0.33 for forward speed of 1.0, 1.5, 2.0 and 2.5 km·h-1
respectively for PN.
The change in values of degree of variation with the change in angle of inclination
of seed metering plate was not significant. Analysis of variance also indicated that
change in angle of inclination of seed metering plate from 47° to 62° had non significant
effect on degree of variation.
Table 2. Observed values of the performance parameters for the developed metering mechanism
Parameter
Forward
speed
[km·h-1]
Variety/angle of inclination
ALR PN ADR
A1 A2 A3 A1 A2 A3 A1 A2 A3
Quality
of
feed
index
S1 0.67 0.65 0.62 0.60 0.62 0.60 0.53 0.61 0.63
S2 0.61 0.62 0.58 0.60 0.63 0.59 0.52 0.58 0.55
S3 0.58 0.62 0.51 0.59 0.58 0.52 0.56 0.51 0.53
S4 0.51 0.50 0.44 0.60 0.50 0.59 0.58 0.53 0.54
Seed
rate
[kg·ha-1]
S1 4.28 3.28 2.90 3.90 3.03 2.68 4.18 3. 73 3.10
S2 3.63 2.73 2.40 3.43 2.63 2.43 3.68 3. 58 2.73
S3 3.10 2.55 2.18 3.08 2.40 2.23 3.53 3.05 2.60
S4 2.78 2.23 2.13 2.98 1.88 2.03 3.08 2.53 2.33
Seed
Damage
[%]
S1 0.88 0.75 0.86 2.84 2.37 3.45 1.12 1.12 1.62
S2 1.26 0.84 1.60 1.89 1.42 1.75 1.87 1.12 1.50
S3 2.70 2.27 2.55 2.36 2.45 1.89 2.62 2.62 2.25
S4 3.02 2.52 2.95 3.31 2.51 2.84 2.62 2.91 2.75
Degree
of
variation
S1 0.18 0.20 0.25 0.15 0.14 0.16 0.21 0.17 0.24
S2 0.26 0.25 0.28 0.18 0.19 0.23 0.25 0.25 0.27
S3 0.32 0.32 0.30 0.26 0.26 0.27 0.31 0.28 0.32
S4 0.35 0.33 0.35 0.31 0.33 0.32 0.33 0.32 0.34
CONCLUSIONS
The missing index increased, whereas multiple index and seed rate decreased with
increase in forward speed for all the varieties and each angle of inclination of the
Chhina and Khurana: Development and Evaluation . . . / Agr. Eng. (2016/2). 11 - 20 19
inclined plate with horizontal. Considering all the performance parameters, it was
concluded that the forward speed should be in the range of 1 - 1.5 km·h-1
and an angle of
inclination of seed plate should be 55o with horizontal.
BIBLIOGRAPHY
[1] Anon. 2015. Available through: http://www.dogr.res.in/ (Accessed date: 28.08.2015)
[2] Ahmadi, E., Ghassemzadeh, H.R., Moghaddam, M., Kim, K.U. 2008. Development of
precision seed drill for oilseed rape. Turk J.Agric. For. 32: 451-458
[3] ISTA. 1999. International rules for seed testing. Seed Science and Technology 27 (suppl.): 25
-30
[4] Kachman, S.D., Smith, J.A. 1995. Alternative measures of accuracy in plant spacing for
planters using single seed metering. Transactions of the ASAE. 38:379-387.
[5] Rathnakumari, A.C., Mandhar, S.C., Gowda, R.H. 2003. Development of drum seeder for
onion. Downsizing Technology for Rural Development. 1: 31 – 37
[6] RNAM. 1991. RNAM Test Codes and Procedures for Farm Machinery testing.
[7] Ryu, H.I., Kim, K.U. 1998. Design of roller type metering device for precision planting.
Transactions of the ASAE. 41: 923-930
[8] Sahoo, P.K., Srivastava, A.P. 2008. Seed pattern characteristics of different metering systems
for soaked okra seed. J. Agric. Engg.45 (1): 1-6.
[9] Singh, H.J., De, D., Sahoo, P.K. 2014. Development and evaluation of metering mechanism
for multi crop planter for hilly regions. Agricultural Engineering. 4:21-33.
RAZVOJ I OCENA RADA MERNOG MEHANIZMA ZA SETVU
SEMENA CRNOG LUKA (ALLIUM CEPA L.)
Ravinder Chhina1, Rohinish Khurana
2
1Krishi Vigyan Kendra (KVK) at Gurdaspur,
2Poljoprivredni univerzitet Punjab, Fakultet za poljoprivrednu tehniku,
Institut za poljoprivredne i pogonske mašine, Ludhiana, India
Sažetak: Crni luk (Allium cepa L) je jedna od glavnih povrtarskih kultura u zemlji.
Gaji se u različitim delovima zemlje, široko je rasprostranjena, uglavnom kod malih
farmera. Generalno, seme crnog luka se seje u rasadnik i presađuje u redove na
međurednom rastojanju od 15 cm i rastojanju u redu od 7.5 cm radi dobijanja
optimalnog prinosa. Ručni rad u presađivanju klijanaca luka je veoma mnogo zastupljen
i iznosi 100 - 120 čovek-dana·ha-1
za 8.9·105 sadnica po hektaru. Visoki zahtevi mala
raspoloživost ručnog rada doveli su do malog prostora na kome se gaju luk, a može se
povećati mehanizacijom uzgoja. Zato je razvijena ploča pod nagibom kao merni uređaj
za seme luka. Ploča je ispitivana na osnovu vrednosti parametara kao što su: indeks
nedostatka, indeks multiplikacije, srednje rastojanje, indeks kvaliteta punjenja, norma
setve, oštećenje zrna, stepen varijacije pri četiri radne brzine (1.0, 1.5, 2.0 i 2.5 km·h-1
) i

Chhina i Khurana: Razvoj i ocena . . . / Polj. Tehn. (2016/2). 11 - 20 20
tri ugla nagiba (47o, 55
o i 62
o) merne ploče sa tri sorte luka (Punjab Naroya (PN),
Agrifound Light Red (ALR) i Agrifound Dark Red (ADR)). Indeks nedostajanja se
povećao, indeks multiplikacije i norma setve su se smanjili sa povećanjem brzine za sve
tri sorte i svaki ugao nagiba merne ploče. Uzimajući u obzir sve parametre, zaključeno je
da radna brzina treba da bude u opsegu od 1 do 1.5 km·h-1
, a ugao nagiba ploče 55o u
odnosu na horizontalnu ravan. .
Ključne reči: mehanizam za merenje semena, crni luk, ploča pod nagibom, direktna
setva, povrće, sadilica, indeks nedostatka, norma setve, rastojanje semena, multipli
index
Prijavljen:
Submitted: 01.09.2015.
Ispravljen:
Revised:
Prihvaćen:
Accepted: 12.03.2016.
Univerzitet u Beogradu Poljoprivredni fakultet Institut za poljoprivrednu tehniku
Naučni časopis POLJOPRIVREDNA TEHNIKA
Godina XLI Broj 2, 2016. Strane: 21 – 30
University of Belgrade Faculty of Agriculture
Institute of Agricultural Engineering
Scientific Journal AGRICULTURAL ENGINEERING
Year XLI No. 2, 2016. pp: 21 – 30
UDK: 633.15 Originalni naučni rad
Original scientific paper
SPECTRAL ANALYSIS FOR MONITORING CROP GROWTH
USING TRACTOR MOUNTED SPECTRORADIOMETER AND
HAND HELD GREENSEEKER IN COTTON
Kothawale Anil Gautam1*
, Vishal Bector1, Varinderpal Singh
2, Manjeet Singh
1
Punjab Agricultural University,
Department of Farm Machinery and Power Engineering, Punjab, India
Punjab Agricultural University,
Department of Soil Science, Ludhiana, Punjab, India
Abstract: Remotely sensed spectral vegetation indices are widely used and have
benefited numerous disciplines interested in the assessment of biomass, water use, plant
stress, plant health and crop production. Tractor mounted Spectroradiometer and hand
held GreenSeeker were used to capture the spectral signatures of cotton crop canopy and
to calculate NDVI which indicated the temporal changes in crop canopy, nutritional
status and phenological conditions in cotton. The structural mechanism for mounting
spectroradiometer on the tractor was prepared with various options of adjustments to use
spectroradiometer infield. Spectral signatures of crop were measured using tractor
mounted spectroradiometer and GreenSeeker at different growth stages in two cultivars
of cotton. The relations between NDVI spectroradiometer (R650 and R770) and plant N,
plant biomass and plant height at p=0.05 level of significance were found as quadratic,
exponential and linear with maximum value of coefficient of determination (R2) of
0.806, 0.807 and 0.801 respectively. However, the relations between NDVI (Green-
Seeker) and plant N, plant biomass and plant height at p=0.05 level of significance were
found as quadratic, quadratic and linear with maximum R2 value of 0.828, 0.817 and
0.839 respectively. A close relationship between NDVI Spectro-radiometer (R650 and
R770) and NDVI (GreenSeeker) was observed with R2 value of 0.833 at p=0.05 level of
significance. The study suggested that NDVI at (R650 and R770) using spectroradiometer
can be used as a reliable tool for fertilizer N management in cotton.
Keywords: cotton, spectroradiometer, wavelength, greenseeker, NDVI
* Corresponding author. E-mail: [email protected]

Gautam i sar.: spektralna analiza . . . / Polj. Tehn. (2016/2). 21 - 30 22
INTRODUCTION
Cotton (Gossypium spp.) a member of Malvaceae family is a major fibre producing
crop with high commercial value and global importance. It is grown in temperate and
tropical region of more than 70 countries. In terms of botanical status and quality of the
fibre, the Indian cotton cultivation is most diverse in the world. All the four cultivated
species and their interspecific hybrids are grown only in India. Nitrogen (N) is the most
important limiting factor in cotton production. Inadequate N supply during the vegetative
period will slow or stop leaf development. For optimal N management, it is important to
understand the relationship between the morphological and physiological changes as
crop grows. Individual plant species can vary tremendously in physiological behaviour
over their life cycle and their nutrient requirements will change during various stages of
growth [2].
To optimize the profitability with a reduced environmental impact, the precision
agriculture concept was initiated for crop specific management. Precision farming is
focused on nitrogen application rate and timing for high yield, crop quality and
environmental pollution control [4]. Precision agriculture technology mainly using more
information for higher production [6]. Precision agriculture mainly involves ‘the right
dose at right place at the right time. The main components of precision agriculture are
positioning system, remote sensing, variable rate technology, crop and soil sensing and
analysis, yield mapping and information. Hence, agricultural equipments are moving
towards the high automation with the help of electronics and information technology.
All objects on the earth produces electromagnetic radiations (EMR) is depend upon
the physical properties. These are known as ‘spectral signatures’ of particular body
Remotely sensed spectral vegetation indices are widely used and have benefited
numerous disciplines interested in the assessment of biomass, water use, plant stress,
plant health and crop production. Hyperspectral remote sensing capability to detect
characteristic differences of cotton canopy under different nitrogen application rates and
different growing stage was studied [7]. Hyper spectral reflectance from cotton crop
canopy was used to find indices like Difference Vegetation Index (DVI), Ratio
Vegetation Index (RVI), Normalized Difference Vegetation Index (NDVI), and
Renormalized Difference Vegetation Index (RDVI) [8].
Spectroradiometer captures the reflectance of cotton crop canopy at different
wavelength and helps in finding the vegetative indices DVI, RVI, NDVI and RDVI
relations with plant N, plant height, above ground biomass at various growth stages of
crop. It would help growers make field management decisions such as fertilizer
application, irrigation scheduling, and plant growth regulator applications for maximum
yield and quality.
Now days, hand held portable spectroradiometers are being used to collect the
hyperspectral data of cotton crop canopy. Manually operated spectroradiometer having
problem of non-uniform height, shaking of hand and spectral probe is not uniformly
perpendicular to crop canopy. These problems cause the disturbed spectral data. To
avoid these problems there is a requirement of development structural mechanism for
mounting a spectoradiometer on tractor.
The present study has been planned with the following objectives:
1. To develop structural mechanism for mounting of spectroradiometer on the
tractor to capture hyper spectral data of cotton crop canopy.
Gautam et al.: Spectral Analysis . . . / Agr. Eng. (2016/2). 21 - 30 23
2. To develop relationships between NDVI calculated using tractor mounted
Specctroradiometer and hand held GreenSeeker with different growth
parameters.
3. To study relationship between NDVI calculated by using Spectroradiometer and
GrenSeeker.
MATERIAL AND METHODS
The field experiment was conducted during crop season kharif 2014 at the
experimental farm, Department of Soil Sciences, Punjab Agricultural University,
Ludhiana, Punjab, India at 30°56' N latitude and 75°52' E longitude with a mean height
of 247 meter above the mean sea level. The field experiment was designed in split plot
design with two cultivars (ANKUR 3028 BG- II and RCH 650) in main plots and seven N
fertilizer applications (0, 30, 60, 75, 90, 120 and 150 kgN·ha-1
] treatments in sub plots
with three replications. Total 42 plots of size 9 x 2.7 (24.3 m2) were sown at row to row
spacing of 60 cm and plant to plant spacing of 67.5 cm.
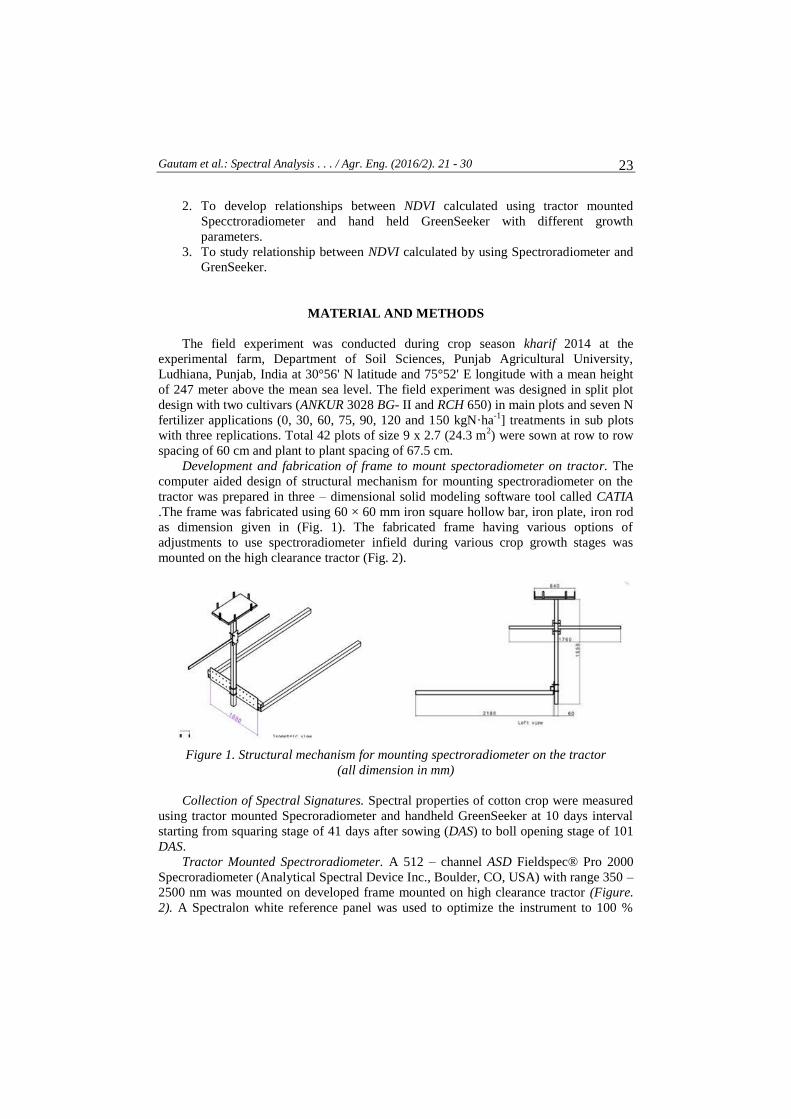
Development and fabrication of frame to mount spectoradiometer on tractor. The
computer aided design of structural mechanism for mounting spectroradiometer on the
tractor was prepared in three – dimensional solid modeling software tool called CATIA
.The frame was fabricated using 60 × 60 mm iron square hollow bar, iron plate, iron rod
as dimension given in (Fig. 1). The fabricated frame having various options of
adjustments to use spectroradiometer infield during various crop growth stages was
mounted on the high clearance tractor (Fig. 2).
Figure 1. Structural mechanism for mounting spectroradiometer on the tractor
(all dimension in mm)
Collection of Spectral Signatures. Spectral properties of cotton crop were measured
using tractor mounted Specroradiometer and handheld GreenSeeker at 10 days interval
starting from squaring stage of 41 days after sowing (DAS) to boll opening stage of 101
DAS.
Tractor Mounted Spectroradiometer. A 512 – channel ASD Fieldspec® Pro 2000
Specroradiometer (Analytical Spectral Device Inc., Boulder, CO, USA) with range 350 –
2500 nm was mounted on developed frame mounted on high clearance tractor (Figure.
2). A Spectralon white reference panel was used to optimize the instrument to 100 %
Gautam i sar.: spektralna analiza . . . / Polj. Tehn. (2016/2). 21 - 30 24
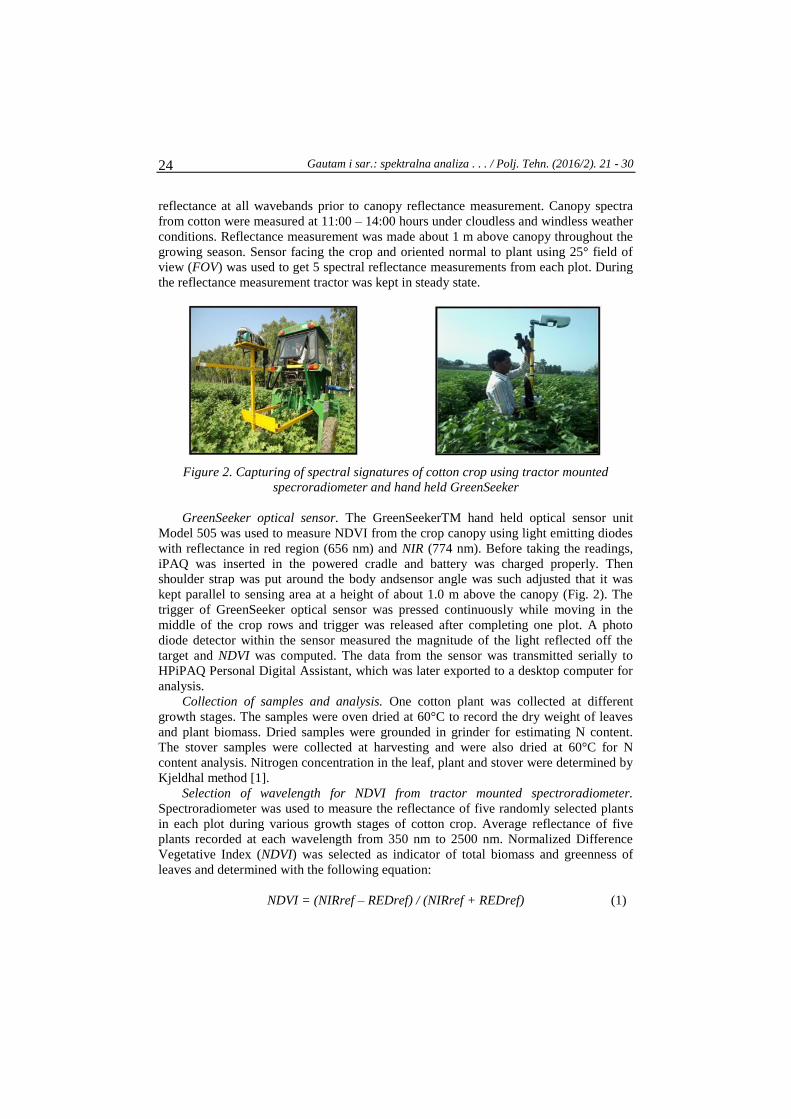
reflectance at all wavebands prior to canopy reflectance measurement. Canopy spectra
from cotton were measured at 11:00 – 14:00 hours under cloudless and windless weather
conditions. Reflectance measurement was made about 1 m above canopy throughout the
growing season. Sensor facing the crop and oriented normal to plant using 25° field of
view (FOV) was used to get 5 spectral reflectance measurements from each plot. During
the reflectance measurement tractor was kept in steady state.
Figure 2. Capturing of spectral signatures of cotton crop using tractor mounted
specroradiometer and hand held GreenSeeker
GreenSeeker optical sensor. The GreenSeekerTM hand held optical sensor unit
Model 505 was used to measure NDVI from the crop canopy using light emitting diodes
with reflectance in red region (656 nm) and NIR (774 nm). Before taking the readings,
iPAQ was inserted in the powered cradle and battery was charged properly. Then
shoulder strap was put around the body andsensor angle was such adjusted that it was
kept parallel to sensing area at a height of about 1.0 m above the canopy (Fig. 2). The
trigger of GreenSeeker optical sensor was pressed continuously while moving in the
middle of the crop rows and trigger was released after completing one plot. A photo
diode detector within the sensor measured the magnitude of the light reflected off the
target and NDVI was computed. The data from the sensor was transmitted serially to
HPiPAQ Personal Digital Assistant, which was later exported to a desktop computer for
analysis.
Collection of samples and analysis. One cotton plant was collected at different
growth stages. The samples were oven dried at 60°C to record the dry weight of leaves
and plant biomass. Dried samples were grounded in grinder for estimating N content.
The stover samples were collected at harvesting and were also dried at 60°C for N
content analysis. Nitrogen concentration in the leaf, plant and stover were determined by
Kjeldhal method [1].
Selection of wavelength for NDVI from tractor mounted spectroradiometer.
Spectroradiometer was used to measure the reflectance of five randomly selected plants
in each plot during various growth stages of cotton crop. Average reflectance of five
plants recorded at each wavelength from 350 nm to 2500 nm. Normalized Difference
Vegetative Index (NDVI) was selected as indicator of total biomass and greenness of
leaves and determined with the following equation:
NDVI = (NIRref – REDref) / (NIRref + REDref) (1)

Gautam et al.: Spectral Analysis . . . / Agr. Eng. (2016/2). 21 - 30 25
where:
NIR ref [-] - reflectance in the near infrared region,
RED ref [-] - reflectance of in the red region.
From that average value of reflectance NDVI was calculated for four selected
combinations of wavelengths using one wavelength in NIR (770 nm) which is sensitive
to N application (Brosonet al 2005) with three selected wavelengths in red region (600
nm, 650 nm and 700 nm). However fourth NDVI was calculated by using average
reflectance of wavelength in NIR region (749 nm-950 nm) and red region (620-650 nm).
Statistical Analysis. An analysis of variance (ANOVA) was performed to test N
effects on plant N, plant biomass, plant height, NDVI (R600 and R770), NDVI (R650 and
R770), NDVI (R700 and R770) NDVI (Rred and RNIR) and NDVI (GreenSeeker). Mean
separation was determined using LSD at level of significance of P = 0.05. Analyses were
performed using software Crop stat. NDVI (R600 and R770), NDVI (R650 and R770), NDVI
(R700 and R770) and NDVI (Rred and RNIR) was related to plant N, plant biomass and plant
height. The software used for all curve fittings was TableCurveTM
2D windows version
4.06 (SPSS Inc., Chicago, IL).
RESULTS AND DISCUSSION
Relations between plant height, plant N, plant biomass and NDVI using tractor
mounted spectroradiometer and hand held GreenSeeker
The reflectance around 550 or 585 nm in green region was closely correlated with
cotton leaf N content [5]. NDVI calculated from reflectance at 2 m above the cotton
canopy was positively correlated with biomass and lint yield [3]. The relation between
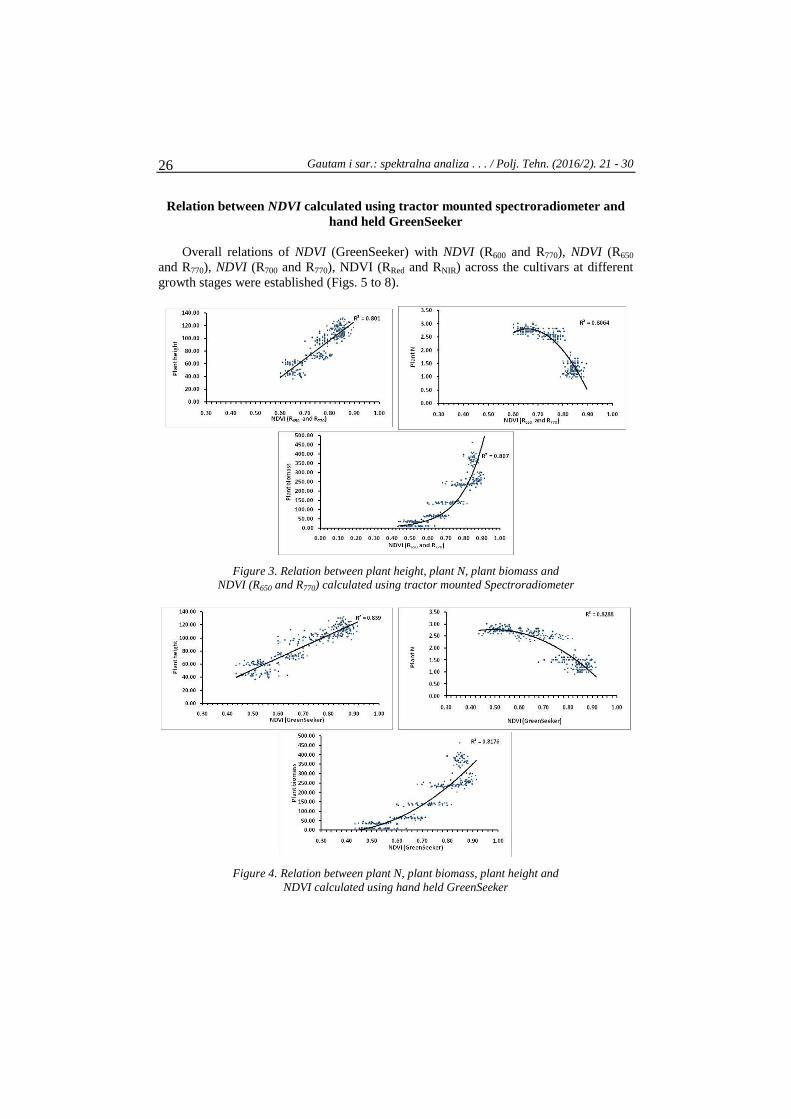
NDVI (Spectroradiomer) and plant height, plant N, plant biomass and at p=0.05 level of
significance was linear, quadratic and exponential with maximum R2 value of 0.801,
0.807 and 0.807 respectively (Tab. 1, Fig.. 3). The relation between NDVI (GreenSeeker)
plant height, plant N and plant biomass at p=0.05 level of significance was linear,
quadratic and quadratic with maximum R2 value of 0.839, 0.817 and 0.817 respectively
(Tab. 2, Fig. 4).
Table 1. Relation between plant N, plant biomass, plant height and NDVI (Spectroradiometer)
Parameter Relation Equation R2
Plant height Linear y = 293.41x – 137.22 0.801
Plant N Quadratic y = 39.757x2 + 52.229x – 14.356 0.806
Plant biomass Exponential x13.499e0.0031=y 0.807
Table 2. Relation between plant N, plant biomass, plant height and NDVI (GreenSeeker)
Parameter Relation Equation R2
Plant height Linear y = 175.33x – 36.076 0.839
Plant N Quadratic y = -11.129x2 – 10.969x + 0.0758 0.828
Plant biomass Quadratic y = 1249.8x2 – 913.91x + 160.09 0.817
Gautam i sar.: spektralna analiza . . . / Polj. Tehn. (2016/2). 21 - 30 26
Relation between NDVI calculated using tractor mounted spectroradiometer and
hand held GreenSeeker
Overall relations of NDVI (GreenSeeker) with NDVI (R600 and R770), NDVI (R650
and R770), NDVI (R700 and R770), NDVI (RRed and RNIR) across the cultivars at different
growth stages were established (Figs. 5 to 8).
Figure 3. Relation between plant height, plant N, plant biomass and
NDVI (R650 and R770) calculated using tractor mounted Spectroradiometer
Figure 4. Relation between plant N, plant biomass, plant height and
NDVI calculated using hand held GreenSeeker
Gautam et al.: Spectral Analysis . . . / Agr. Eng. (2016/2). 21 - 30 27
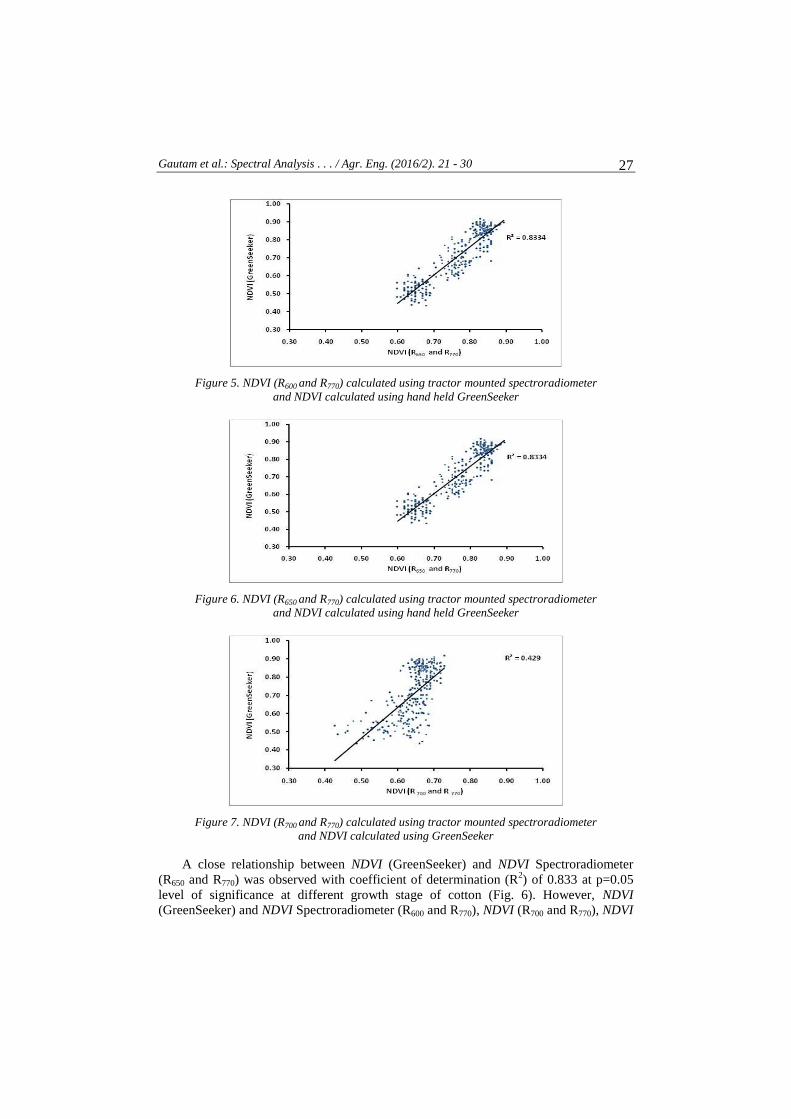
Figure 5. NDVI (R600 and R770) calculated using tractor mounted spectroradiometer
and NDVI calculated using hand held GreenSeeker
Figure 6. NDVI (R650 and R770) calculated using tractor mounted spectroradiometer
and NDVI calculated using hand held GreenSeeker
Figure 7. NDVI (R700 and R770) calculated using tractor mounted spectroradiometer
and NDVI calculated using GreenSeeker
A close relationship between NDVI (GreenSeeker) and NDVI Spectroradiometer
(R650 and R770) was observed with coefficient of determination (R2) of 0.833 at p=0.05
level of significance at different growth stage of cotton (Fig. 6). However, NDVI
(GreenSeeker) and NDVI Spectroradiometer (R600 and R770), NDVI (R700 and R770), NDVI

Gautam i sar.: spektralna analiza . . . / Polj. Tehn. (2016/2). 21 - 30 28
(RRed and RNIR) at p=0.05 level of significance at different growth stage of cotton were
not closely related (Fig. 5, 7 and 8). The data suggested that NDVI (R650 and R770) can be
used as a reliable substitute of NDVI (GreenSeeker) to guide in season fertilizer N
topdressings in cotton.
Figure 8. NDVI (RRed and RNIR) calculated using tactor mounted spectroradiometer
and NDVI calculated using GreenSeeker
CONCLUSIONS
Structural frame was developed for mounting specroradiometer on tractor for
capturing the spectral signatures of cotton crop canopy with uniform height of 1m above
the crop canopy.
- NDVI calculated using reflectance in red region at 650nm and reflectance in NIR
region at 770 nm had quadratic, exponential and linear relation with plant N
content, plant biomass and plant height respectively.
- NDVI calculated using hand held GreenSeeker had linear, quadratic and quadratic
relation with plant height, plant biomass and plant N.
- Linear relation was observed between NDVI calculated using reflectance in red
region at 650nm and in NIR region at 770 nm by spectroradiometer and NDVI
(GreenSeeker).
- It was found that NDVI at (R650 and R770) using spectroradiometer can be used as a
reliable tool for fertilizer N management in cotton.
BIBLIOGRAPHY
[1] Bremner, J.M., Mulvaney, C.S. 1982. Total nitrogen. In: Page A.L, Miller R H., Keeney D.R.
(eds) Methods of soil analysis: Part 2. Chemical and microbiological properties. pp 595-624.
[2] Jeffery, C.S., Broson, F.K., Norton, E.R., Mikkelsen, R. 2011. Nitrogen Utilization by
Western U.S. Cotton. Better Crops (95), 21-23.
[3] Li, H., Lascano, R.J., Barnes, E.M., Booker, J., Wilson, L.T., Bronson, K.F., Segarra, E.
2001. Multispectral Reflectance of Cotton Related to Plant Growth, Soil Water and Texture,
and Site Elevation. Agronomy Journal (93),1327-37.

Gautam et al.: Spectral Analysis . . . / Agr. Eng. (2016/2). 21 - 30 29
[4] Pattey, E., Strachan, I.B., Boisvert, J.B., Desjardins, R.L., McLaughlin, N. 2001. Effects of
Nitrogen Application Rate and Weather on Corn using Micrometeorological and
Hyperspectral Reflectance Measurements. Agriculture and Forest Meteorology (108), 85– 99
[5] Read, J.L., Tarpley, J.M., McKinion, Reddy, K.R. 2002. Narrow-Waveband Reflectance
Ratios for Remote Estimation of Nitrogen Status in Cotton. Journal of Environmental Quality
(3I), 1442-52.
[6] Schneider, M., Wanger, P. 2007. Prerequisites For The Adoption Of New Technologies – The
Example Of Precision Agriculture. Scientific Journal Agricultural Engineering (XXXII), 9-
14.
[7] Zhao, D., Jianlong, L.I., Jiagua, Q.I. 2004. Hyperspectral Characteristic Analysis of a
Developing Cotton Canopy under Different Nitrogen Treatments. Journal of Agronomy (24),
463-71.
[8] Zhao, D., Reddy, R.K, KakaniGopal, V., Reddy, V.R. 2005. Nitrogen Deficiency Effects on
Plant Growth, Leaf Photosynthesis and Hyperspectral Reflectance Properties of Sorghum.
European Journal of Agronomy (22), 391-403.
SPEKTRALNA ANALIZA ZA PRAĆENJE PORASTA USEVA
POMOĆU TRAKTORSKOG SPEKTRORADIOMETRA
I RUČNOG SENZORA STANJA USEVA U PAMUKU
Kothawale Anil Gautam1, Vishal Bector
1, Varinderpal Singh
2, Manjeet Singh
1.
Poljoprivredni univerzitet Punjab,
Institut za poljoprivredne i pogonske mašine, Punjab, India
Poljoprivredni univerzitet Punjab,
Institut za zemljište, Ludhiana, Punjab, India
Sažetak: Daljinska spektralna detekcija vegetacije se široko koristi u mnogim
oblastima u kojima je potrebna procena biomase, korišćenja vode, stresa kod biljaka,
zdravlja biljaka i biljne proizvodnje. Traktorski spektroradiometar i ručni sensor stanja
useva su korišćeni za snimanje spektralnih potpisa useva pamuka i proračun NDVI
indeksa, što je pokazalo povremene promene biljnog pokrivača, nutritivno stanje i
fenološke uslove u kojima se pamuk nalazi. Konstrukcija za postavljanje
pektroradiometra na traktor je izvedena sa različitim mogućnostima za podešavanje
upotrebe uređaja na parceli. Spektralni potpisi useva mereni su spektroradiometrom
postavljenim na traktoru i ručnim senzorom stanja useva u različitim fazama porasta kod
dve sorte pamuka. Odnsoi između NDVI indeksa spektroradiometra (R650 i R770) i biljnog
azota, biomase biljaka i visine biljaka na nivou značajnosti p=0.05 bili su kvadratni,
eksponencijalni i linearni, sa maksimalnim vrednostima koeficijenta determinacije (R2)
od 0.806, 0.807 i 0.801, redom. Pored ovoga, odnosi između NDVI (Green-Seeker) i
biljnog azota, biomase biljaka i visine biljaka na nivou značajnosti p=0.05 bili su
kvadratni, kvadratni i linearni, sa maksimalnom vredošću R2 od 0.828, 0.817 i 0.839,
redom. Značajna zavisnost NDVI spektroradiometra (R650 i R770) i NDVI (GreenSeeker)
bila je utvrđena sa vrednošću R2 od 0.833 na nivou značajnosti p=0.05. Istraživanje je

Gautam i sar.: spektralna analiza . . . / Polj. Tehn. (2016/2). 21 - 30 30
pokazalo da NDVI kod (R650 i R770) upotrebom spektroradiometra može da se upotrebi
kao pouzdano sredstvo za upravljanje đubrenjem azotom kod pamuka.
Ključne reči: pamuk, spektroradiometar, talasna dužina, ručni senzor stanja useva,
NDVI indeks
Prijavljen:
Submitted: 09.10.2015.
Ispravljen:
Revised: 22.06.2016.
Prihvaćen:
Accepted: 25.06.2016.
Univerzitet u Beogradu Poljoprivredni fakultet Institut za poljoprivrednu tehniku
Naučni časopis POLJOPRIVREDNA TEHNIKA
Godina XLI Broj 2, 2016. Strane: 31 – 40
University of Belgrade Faculty of Agriculture
Institute of Agricultural Engineering
Scientific Journal AGRICULTURAL ENGINEERING
Year XLI No. 2, 2016. pp: 31 – 40
UDK: 631.416 Originalni naučni rad
Original scientific paper
COMPARATIVE FIELD EVALUATION OF DIFFERENT
MECHANIZED PLANTING TECHNIQUES IN NAPIER-BAJRA
Mahesh Kumar Narang*1
, Rupinder Chandel1, Rajesh Goyal
1, Davinder Pal Singh
2,
Udham Singh Tiwana2, Surinder Singh Thakur
1
1Punjab Agricultural University,
Department of Farm Machinery and Power Engineering, Ludhiana, Punjab, India
2Punjab Agricultural University,
Department of Plant Breeding and Genetics (Forage Section), Ludhiana, Punjab, India
Abstract: The 17th
Livestock Census (2003) has placed the total livestock population
at 485 million and that of poultry birds at 489 million. Total population is expected to
grow 1.23% in the coming years. At present, the country faces a net deficit of 61.1%
green fodder, 21.9% dry crop residues and 64% feeds. Overlapping cropping systems
have been developed at the Indian Grassland and Fodder Research Institute (IGFRI),
Jhansi, to fulfill the needs of dairy farmers for green fodder throughout the year. Napier-
Bajra is perennial and once planted it gives fodder for 2-3 years. The sowing
practices/machine has a significant effect on green fodder yield of fodder crops.
Therefore, present study was conducted to evaluate the performance of three planters
namely Semi-automatic type, sugarcane cutter planter, vegetable nursery planter and
potato planter for sowing of Napier- Bajra variety PBN-233. The number of plants/ha for
sugarcane cutter planter, vegetable transplanter, potato planter and control were 23,563,
19,895, 21,442 and 20,826 respectively. Green fodder yield was highest for sugarcane
cutter planter as 279.13 t·ha-1
and for semi-automatic potato planter, vegetable nursery
transplanter and control were 262.79, 250.42 and 255.25 t·ha-1
respectively. Benefit cost
ratio for sugarcane cutter planter, vegetable nursery transplanter, potato planter and
control were 2.49:1, 2.17:1, 2.38:1 and 2.27:1 respectively. The saving in time with
semi-automatic potato planter, vegetable nursery planter and sugarcane cutter planter as
compared with manual sowing method were 77.78 %, 33.33 %, and 75.00 %
respectively.
Key words: Napier-Bajra hybrid, sugarcane cutter planter, field capacity, yields.
* Corresponding author. E-mail: [email protected]

Narang i sar.: Komparativna poljska . . . / Polj. Tehn. (2016/2). 31 - 40 32
INTRODUCTION
Fodder crops are the plant species that are cultivated and harvested for feeding the
animals in the form of forage (cut green and fed fresh), silage (preserved under
anaerobic condition) and hay (dehydrated green fodder). The total area under cultivated
fodders in India is 8.3 million ha on individual crop basis. Sorghum amongst the kharif
crops (2.6 million ha) and berseem (Egyptian clover) amongst the rabi crops (1.9 million
ha) occupy about 54% of the total cultivated fodder cropped area. The area under
permanent pastures has been declining over the years and the trend could well continue
in the future. Due to overgrazing, the productivity of the pastures has been declining too.
The area under fodder crops has almost remained static for the last 3-4 decades [1]. The
area under fodder crops in the Punjab state is approximately 0.86 million hectares (3.45
lac hectares in rabi season) and the annual production is about 67.27 million tonnes of
green fodder. At present fodder supply of 30.5 kg/animal/day is far from satisfactory. On
the basis of 40 kg green fodder per adult animal per day approximately 88.2 million tons
of fodder will be required. [2]. Napier-Bajra hybrid is a vegetatively propagated bajra
like grass. It is perennial but yields most of the fodder between March and November.
Sowing of perennial grass and forage legume components helps reduce the necessity of
repeated sowing and tillage and to economize the use of irrigation water in the system.
During 1989 and 2000, various forage breeding institutions in the world have developed
vast number of Bajra x Napier hybrids. Scientists of the Southern African Development
Community (SADC), International Crops Research Institute for the Semi-Arid Tropics
(ICRISAT), Sorghum and Millet Improvement Programme (SMIP) in Zimbabwe and
Punjab Agricultural University (PAU) and Tamil Nadu Agricultural University (TNAU)
in India were the pioneers of this effort [6].
A study was conducted to evaluate the effect of use of tractor operated seed- cum
fertilizer drill for its field performance in comparison with bullock drawn seed drill
(Tifan) for sowing sorghum crop (CSH-9) as per RNAM test codes. The field test was
conducted on medium black soil at moisture content of 33.60%. It was found that tractor
operated seed-cum-fertilizer drill works better than bullock drawn seed drill in respect of
effective field capacity, field efficiency, depth of placement of seed, yield of crop, yield
of fodder and cost of sowing per hectare. The mechanized method of sowing has resulted
in a 66.70% increase in effective field capacity, 22.36% increase in field efficiency,
20.00% increase in depth of seeding, 16.76% increase in grain yield, 19.14% increase in
fodder yield, 66.40% saving in operation of time and 44.70% saving in cost of operation.
The overall benefit of Rs.412.12/- per hectare was observed by using mechanized
method of sowing [3].
Napier-Bajra is perennial and once planted it gives fodder for 2-3 years. It can be
planted from the last week of February to May. The planting should be completed by
mid April to avoid mortality of root slips. The crop planted after May does not give
sufficient yield during Kharif season. Fourteen hybrids of Bajra Napier genotypes were
analyzed for water soluble oxalate content and yield at 40th and 80th day of harvestings.
Oxalate content decreased with delayed harvest (80th Day) compared to early harvest
(40th day); however, it ranged between 2 – 3 % in all the hybrid genotypes which is
under permissible tolerance limits. APBN-1 and PBN-91 are emerging as the promising
genotypes with respect to oxalate and biomass production than the standard checks at
40th day of harvest [4]. A comprehensive examination was done to analyse the machine

Narang et al.: Comparative Field . . . / Agr. Eng. (2016/2). 31 - 40 33
fleet formation and machine use of plant production farms that grow sweet sorghum too
by using computer aided modeling. It considers the characteristics of machines used at
the production technologies of different plants and it especially focuses on the appliance
of machines with the convenient capacity and level from the side of costs at different
farm sizes. The total production cost of sweet sorghum per hectare in case of small-scale
farm size is minimum 715 EUR. Examining the large-scale production the costs reduce,
but they cannot be reduced under the 610 EUR/hectare levels [5].
Timely sowing of Napier Bajra is very important to avoid reduction in fodder yield.
Mechanized sowing of this crop is only solution to avoid delay in sowing and reduction
in its yield and save labor cost involved in sowing operation. Therefore, present study
was conducted to see the response of Napier-Bajra hybrid crop (PBN-233) to three
different planters’ namely semi-automatic potato planter, vegetable nursery transplanter
and sugarcane cutter planter.
MATERIAL AND METHODS
The farm yard manure was applied in the field prior to cultivation and the land was
well prepared and made free from weeds. The first ploughing with a disc harrow and
subsequent two ploughings with a cultivator were given to field. Napier-Bajra can be
propagated vegetatively from root slips or stem cuttings. In the present study stem
cuttings (with two nodes) were used for planting. Approximately 27,500 slips or cuttings
are required to plant one hectare. The stem cuttings were planted like sugarcane sets in
furrows which were afterwards filled with soil. The crop was planted at 60 x 60 cm
spacing under good conditions of soil moisture. Tractor operated three row semi-
automatic revolving magazine type potato planter, two row semi-automatic revolving
magazine type vegetable transplanter and two row semi-automatic sugarcane cutter
planter were used for sowing of Napier-Bajra hybrid, PBN-233 at Departmental fodder
research farm. For control, manual sowing of Napier-Bajra was also done. The Napier-
Bajra crop was planted with these three planters and by control method and germination
data was recorded after 40 days. The observations recorded were forward speed, fuel
consumption, depth of set placement. Number of plants/ha, plant to plant spacing was
recorded for all the Napier-Bajra plots sown by three planters. The first cutting was done
after 50 days of planting and subsequent five cuttings were done when the crop was
about one meter high. The green fodder yield was recorded for Napier-Bajra crop sown
with three different planters and by control method also. The detail of three planters
studied for planting of Napier-Bajra hybrid crop is given below.
1. A three row semi-automatic revolving magazine type potato planter. A three row
semi-automatic revolving magazine type potato planter was used for sowing of Napier-
Bajra sets (Fig. 1). It consisted of four furrow openers, seed tubes, rotating plates named
as magazines, seed hopper, ground wheel and four ridger bottoms and three seats for the
labourers to fill magazines. Seed metering mechanism for metering the Napier-Bajra sets
was operated by a ground wheel. The power from ground wheels was transmitted to the
three rotating magazines through chain and sprockets. With the rotation of ground
wheels, a hub having three sprockets (10, 15 and 20 teeth) on ground wheel shaft axle
was rotated by ground wheel and power was transmitted to sprocket (having 30 teeth) of
main shaft through chain. Horizontal shaft transmitted power to vertical shaft with the

Narang i sar.: Komparativna poljska . . . / Polj. Tehn. (2016/2). 31 - 40 34
help of bevel gear assembly (1:1). As the vertical shaft was rotated, the revolving
magazine metering mechanisms were rotated. The front view of this machine is shown in
Fig. 2. Machine was operated by 45 HP tractor. The plant spacing can be varied with the
help of adjustable ground wheel. Three persons were required to feed the Napier-Bajra
sets to the feeding mechanism. This machine consisted of four ridgers mounted on the
frame for opening the furrows. As the Napier-Bajra sets were sown in these furrows by
planting mechanism, ridgers covered them with soil and in this way it makes three beds.
The drive to feeding mechanism was provided through a ground wheel.
Figure 1. View of Napier-Bajra sowing and
potato planter machine Figure 2. Front view of semi-automatic potato
planter (all dimensions in mm)
2. A two row vegetable nursery transplanter with revolving magazine type. A two
row vegetable transplanter with revolving magazine type metering mechanism was used
for sowing of Napier-Bajra crop (Fig. 3).
Figure 3. View of Napier-Bajra sowing with two row semi-automatic vegetable nursery
transplanter
A wooden board having length 169 cm and width 32 cm was attached to the four
angles and that were attached to the main frame with U clamps. A support was attached
to the seat. Two revolving magazine type metering mechanism were developed. It
consisted of two curved runners with their cutting edges on the ground and meeting at a
point. At the rear, runners were connected to common boot through which the seedling
was dropped. The length of the furrow opener was 535 mm and height 230 mm. It was
made of high carbon sheet having thickness of 6.0 mm. The furrow width made by
furrow opener was 100 mm. The four packing wheels made of mild steel sheet of
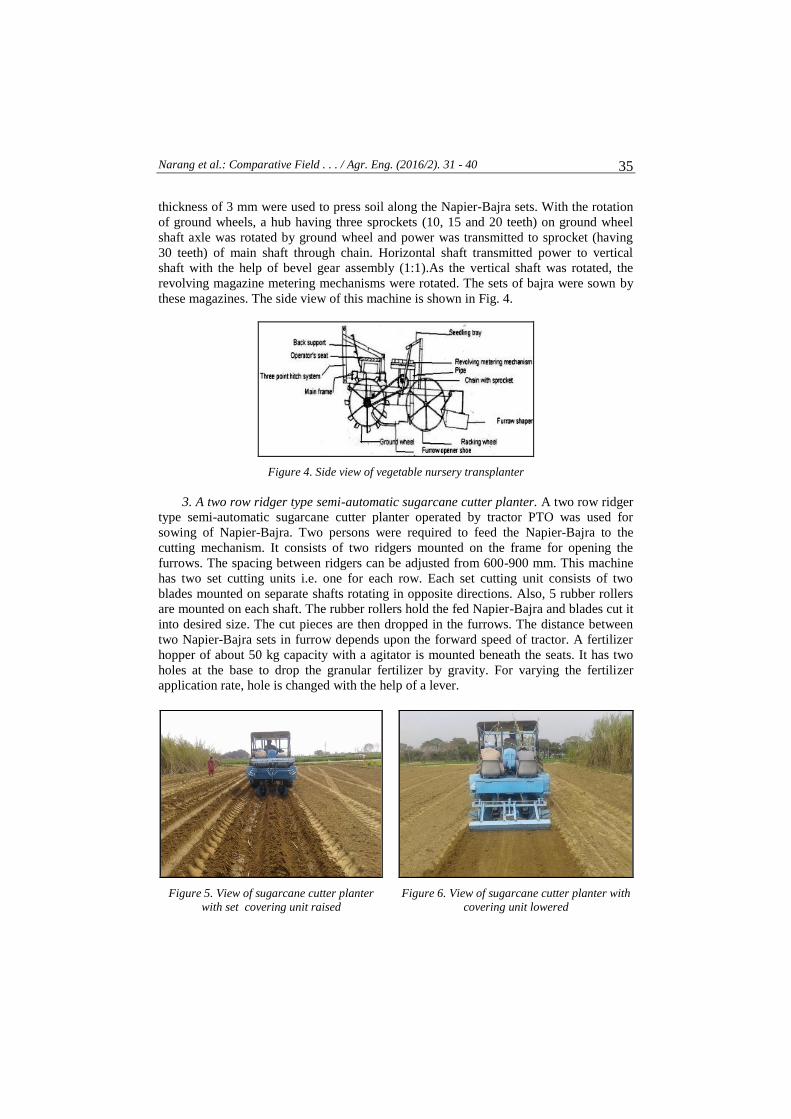
Narang et al.: Comparative Field . . . / Agr. Eng. (2016/2). 31 - 40 35
thickness of 3 mm were used to press soil along the Napier-Bajra sets. With the rotation
of ground wheels, a hub having three sprockets (10, 15 and 20 teeth) on ground wheel
shaft axle was rotated by ground wheel and power was transmitted to sprocket (having
30 teeth) of main shaft through chain. Horizontal shaft transmitted power to vertical
shaft with the help of bevel gear assembly (1:1).As the vertical shaft was rotated, the
revolving magazine metering mechanisms were rotated. The sets of bajra were sown by
these magazines. The side view of this machine is shown in Fig. 4.
Figure 4. Side view of vegetable nursery transplanter
3. A two row ridger type semi-automatic sugarcane cutter planter. A two row ridger
type semi-automatic sugarcane cutter planter operated by tractor PTO was used for
sowing of Napier-Bajra. Two persons were required to feed the Napier-Bajra to the
cutting mechanism. It consists of two ridgers mounted on the frame for opening the
furrows. The spacing between ridgers can be adjusted from 600-900 mm. This machine
has two set cutting units i.e. one for each row. Each set cutting unit consists of two
blades mounted on separate shafts rotating in opposite directions. Also, 5 rubber rollers
are mounted on each shaft. The rubber rollers hold the fed Napier-Bajra and blades cut it
into desired size. The cut pieces are then dropped in the furrows. The distance between
two Napier-Bajra sets in furrow depends upon the forward speed of tractor. A fertilizer
hopper of about 50 kg capacity with a agitator is mounted beneath the seats. It has two
holes at the base to drop the granular fertilizer by gravity. For varying the fertilizer
application rate, hole is changed with the help of a lever.
Figure 5. View of sugarcane cutter planter
with set covering unit raised
Figure 6. View of sugarcane cutter planter with
covering unit lowered

Narang i sar.: Komparativna poljska . . . / Polj. Tehn. (2016/2). 31 - 40 36
It has two tanks of capacity 35 liters each for chemical application. The solution was
sprinkled on the set through the nozzles. The flow rate of solution is adjusted by control
lever. A set covering unit is provided to cover sets after planting. It consists of a
furrower in the centre of two units and a shovel with half mould board plate behind each
row for covering the set with soil and a flat for pressing the soil lightly over the set. The
planter has two hoppers for two rows to store sufficient quantity of whole bajra feeding.
Power is transmitted through tractor PTO to the machine through telescopic shaft to
operate set cutting mechanism and fertilizer and chemical unit. The view of this machine
while sowing Napier-Bajra without placing down the set covering unit is shown in Fig. 5
and its view with set covering unit down is shown in Fig. 6.
The specifications of these three planters and various field operational parameters
are shown in Tab. 1.
Table 1. Specifications and operational parameter of different planters
Particulars
Semi-
automatic
potato planter
Semi-automatic
vegetable nursery
transplanter
Semi-automatic
sugarcane cutter
planter
Control
(Manual
sowing
method)
Tractor HP required 45 HP 35 HP 45 HP ---
Number of rows 3 2 2 ---
Ground wheel
diameter/driving Pulley
diameter, mm
390 595 140 ---
Feeding mechanism revolving
magazine type
revolving
magazine type
rubber rollers
with blades ---
Revolving magazine/roller
diameter (number of
holes/rollers)
370 mm
(9 holes)
370 mm
(9 holes)
130 mm
(5 rollers of
40 mm dia each)
---
Forward speed, km·h-1 1.50 1.00 1.55 ---
Field capacity, ha·h-1 0.18 0.06 0.16 0.04
Mean Fuel Consumption,
l.h-1 6.00 5.50 6.00 ---
Overall Speed ratio 1:1 2:1 3.7 : 1 ---
No. of labour required 5 4 4 10
Labour requirement man-
h.ha-1 33 72 30 250
No. of nodes on each set 2 2 2 2
Depth of set placement, mm 100-150 25-60 120-155 25-35
No. of stem cuttings per ha 27,500 27,500 30,250 27,500
% age eye damage -- -- 7.25 % ---
RESULTS AND DISCUSSION
The Napier-Bajra crop was planted with these three planters and germination data
was recorded after 40 days and view of crop is shown in Fig. 7. Number of plants/ha,
plant to plant spacing was recorded for all the Napier-Bajra plots sown by three planters
and control method. The first cutting was done after 50 days of planting and subsequent

Narang et al.: Comparative Field . . . / Agr. Eng. (2016/2). 31 - 40 37
five cuttings were done when the Napier-Bajra reached to one meter height. The green
fodder yield was recorded for Napier-Bajra crop sown with three different planters and
control method. All these recorded parameters are shown in Tab. 2. The crop view is
shown in Fig. 7.
Figure 7. View of Napier-Bajra hybrid crop (50 days after DOP) sown by different planters
Table 2. Field data of Napier-Bajra hybrid crop (PBN-233) sown with different planters
Machine/Technique
used for sowing
Napier Bajra
sets used
No. of
plants/ha
Mean plant to
plant spacing
( mm)
Mean green
fodder yield
(t·ha-1)
Semi-automatic potato planter sets with two
nodes 21,442 725.00 262.79
Semi-automatic Vegetable
nursery transplanter
sets with two
nodes 19,895 756.73 250.42
Semi-automatic Sugarcane
cutter planter
full length
plant 23,563 668.37 279.13
Control (Manual Sowing
method)
sets with two
nodes 20,826 742.15 255.25
CD (5 %) ------- 33.6888 7.06222 2.58948
Figure 8. Effect of three different planters and manual sowing method
on yield and net returns from Napier- Bajra hybrid crop

Narang i sar.: Komparativna poljska . . . / Polj. Tehn. (2016/2). 31 - 40 38
Table 3. Economics of different planters for sowing of Napier-Bajra hybrid crop (PBN-233 var.)
Particulars
Semi-
automatic
potato
planter
Semi-automatic
Vegetable
nursery
transplanter
Semi-
automatic
sugarcane
cutter planter
Control
(manual
sowing
method)
Field capacity, ha.h-1 0.18 0.06 0.16 0.04
Farm yard manure and
application cost, Rs.ha-1
[50t/[email protected] tone +
labour [email protected] per tonne]
75000.00 75000.00 75000.00 75000.00
Land Preparation Cost, Rs.ha-1
[Disc harrow(2) + cultivator(2)
+ planker (1)]
6116.75 6116.75 6116.75 6116.75
Sets/seed cost, Rs.ha-1 27,500.00 27,500.00 30,250 27500.00
Set cutting labour cost,
Rs.ha-1 312.50 312.50 ---- 312.50
Operational cost, Rs.ha-1
(Fixed and variable) 4593.44 12269.50 4697.63 7812.50
Weedicide and application
(labour*) cost, Rs.ha-1 2550.00 2550.00 2550.00 2550.00
Irrigation and labour cost Rs.ha-
1 (7 irrigations) 2657.81 2657.81 2657.81 2657.81
Manual harvesting cost, Rs.ha-1
(for 6 cuttings) 46,875.00 46,875.00 46,875.00 46875.00
Total cultivation cost, Rs.ha-1
(USD.ha-1)**
1,65,605.50
(USD2590)
1,73,281.56
(USD 2710)
1,68,147.19
(USD 2630)
1,68,824.56
(USD 2640)
Yield (6 cuttings), t.ha-1 262.79 250.42 279.13 255.25
Income Rs.ha-1
@Rs. 1500/tonne
(Green fodder),
(USD.ha-1)**
3,94,185.00
(USD 6165)
3,75,630.00
(USD 5875)
4,18,695.00
(USD 6548)
3,82,875.00
(USD 5988)
Net returns, Rs.ha-1
(USD.ha-1)
2,28,579.50
(USD 3575)
2,02,348.44
(USD 3165)
2,50,547.81
(USD 3918)
2,14,050.44
(USD 3348)
B:C Ratio
(Benefit:cost ratio) 2.38:1 2.17:1 2.49:1 2.27:1
% Saving in time as compared
with manual method 77.78 % 33.33 % 75.00 % ---
*Labour cost @Rs.31.25 per hour, **1 USD = 63.94 Indian rupees
The green fodder yield was found maximum for sugarcane cutter planter machine as
279.13 t·ha-1
and for semi-automatic potato planter, vegetable transplanter and control
were 262.79, 250.42 and 255.25 t·ha-1
respectively and the effect was found to be
significant at 5 % level of significance. The reason for higher plant population and better
yield for sugarcane cutter planter was placement of sets at proper depth and in good
moisture and afterwards coverage with soil properly due to which germination was
uniform and crop stand was better. Moreover plant to plant spacing was also uniform
and mean number of plants/ha were also higher for Napier-Bajra sown with sugarcane
cutter planter. The mean plant to plant spacing for sugarcane cutter planter, vegetable
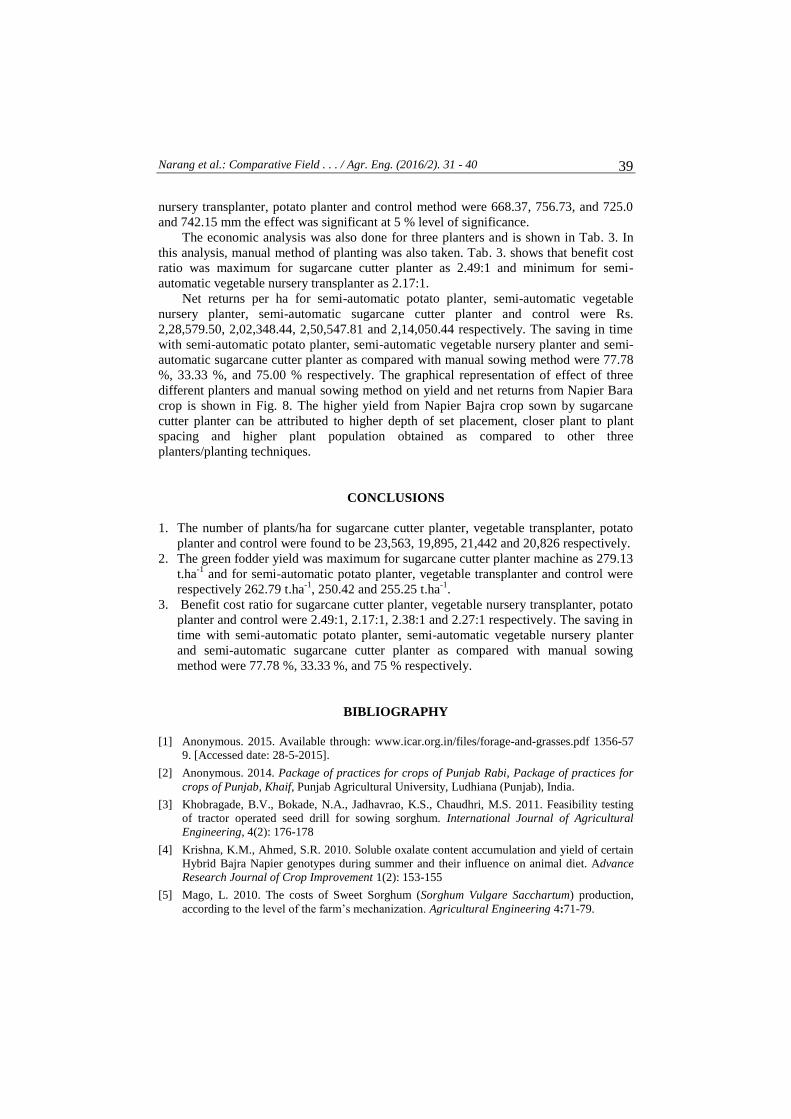
Narang et al.: Comparative Field . . . / Agr. Eng. (2016/2). 31 - 40 39
nursery transplanter, potato planter and control method were 668.37, 756.73, and 725.0
and 742.15 mm the effect was significant at 5 % level of significance.
The economic analysis was also done for three planters and is shown in Tab. 3. In
this analysis, manual method of planting was also taken. Tab. 3. shows that benefit cost
ratio was maximum for sugarcane cutter planter as 2.49:1 and minimum for semi-
automatic vegetable nursery transplanter as 2.17:1.
Net returns per ha for semi-automatic potato planter, semi-automatic vegetable
nursery planter, semi-automatic sugarcane cutter planter and control were Rs.
2,28,579.50, 2,02,348.44, 2,50,547.81 and 2,14,050.44 respectively. The saving in time
with semi-automatic potato planter, semi-automatic vegetable nursery planter and semi-
automatic sugarcane cutter planter as compared with manual sowing method were 77.78
%, 33.33 %, and 75.00 % respectively. The graphical representation of effect of three
different planters and manual sowing method on yield and net returns from Napier Bara
crop is shown in Fig. 8. The higher yield from Napier Bajra crop sown by sugarcane
cutter planter can be attributed to higher depth of set placement, closer plant to plant
spacing and higher plant population obtained as compared to other three
planters/planting techniques.
CONCLUSIONS
1. The number of plants/ha for sugarcane cutter planter, vegetable transplanter, potato
planter and control were found to be 23,563, 19,895, 21,442 and 20,826 respectively.
2. The green fodder yield was maximum for sugarcane cutter planter machine as 279.13
t.ha-1
and for semi-automatic potato planter, vegetable transplanter and control were
respectively 262.79 t.ha-1
, 250.42 and 255.25 t.ha-1
.
3. Benefit cost ratio for sugarcane cutter planter, vegetable nursery transplanter, potato
planter and control were 2.49:1, 2.17:1, 2.38:1 and 2.27:1 respectively. The saving in
time with semi-automatic potato planter, semi-automatic vegetable nursery planter
and semi-automatic sugarcane cutter planter as compared with manual sowing
method were 77.78 %, 33.33 %, and 75 % respectively.
BIBLIOGRAPHY
[1] Anonymous. 2015. Available through: www.icar.org.in/files/forage-and-grasses.pdf 1356-57
9. [Accessed date: 28-5-2015].
[2] Anonymous. 2014. Package of practices for crops of Punjab Rabi, Package of practices for
crops of Punjab, Khaif, Punjab Agricultural University, Ludhiana (Punjab), India.
[3] Khobragade, B.V., Bokade, N.A., Jadhavrao, K.S., Chaudhri, M.S. 2011. Feasibility testing
of tractor operated seed drill for sowing sorghum. International Journal of Agricultural
Engineering, 4(2): 176-178
[4] Krishna, K.M., Ahmed, S.R. 2010. Soluble oxalate content accumulation and yield of certain
Hybrid Bajra Napier genotypes during summer and their influence on animal diet. Advance
Research Journal of Crop Improvement 1(2): 153-155
[5] Mago, L. 2010. The costs of Sweet Sorghum (Sorghum Vulgare Sacchartum) production,
according to the level of the farm’s mechanization. Agricultural Engineering 4:71-79.

Narang i sar.: Komparativna poljska . . . / Polj. Tehn. (2016/2). 31 - 40 40
[6] Premaratne, S., Premalal, G.G.C. 2006. Hybrid Napier (Pennisetum perpureum x Pennisetum
americarnum) var. CO-3: A resourceful fodder grass for dairy development in Sri Lanka. The
Journal of Agricultural Sciences, 2(1): 22-33
KOMPARATIVNA POLJSKA PROCENA RAZLIČITIH MEHANIZOVANIH
TEHNIKA SADNJE NAPIER-BAJRA
Mahesh Kumar Narang1, Rupinder Chandel
1, Rajesh Goyal
1, Davinder Pal Singh
2,
Udham Singh Tiwana2, Surinder Singh Thakur
1
1Poljoprivredni univerzitet Punjab,
Institut za poljoprivredne i pogonske mašine, Ludhiana, Punjab, India
2 Poljoprivredni univerzitet Punjab,
Institut za uzgoj i genetiku bilja (Odsek za krmno bilje), Ludhiana, Punjab, India
Sažetak: Prema 17. popisu stoke (2003) ukupna stočna populacija se sastoji od 485
miliona grla, a brojno stanje živine iznosilo je 489 miliona. Očekuje se da se ukupna
populacija poveća u narednim godinama za 1.23%. Trenutno u zemlji postoji neto deficit
zelene stočne hrane od 61.1%, 21.9% suvih žetvenih ostataka i 64% hraniva. U
Indijskom istraživačkom institute za pašnjake i krmno bilje (IGFRI), Jhansi, razvijeno je
preklapanje sistema ratarenja da bi se zadovoljile potrebe farmi muznih krava za zelenim
hranivima tokom cele godine. Napier-Bajra je višegodišnja biljka i posle sadnje daje
stočnu hranu naredne 2-3 godine. Značajan uticaj na prinos ima i tehnika sadnje. Zato je
ova studija izvedena da oceni performanse tri sadilice: poluautomatske sadilice, sadilice
reznica, sadilice povrća i sadilice krompira za sadnju Napier- Bajra varieteta PBN-233.
Broj biljaka po hektaru za sadilicu reznica, povrća, krompira i kontrolu iznosio je
23.563, 19.895, 21.442 i 20.826, redom. Najveći prinos zelene stočne hrane postignut je
sadilicom reznica šećerne trske (279.13 t·ha-1
), a sa poluautomatskom sadilicom
krompira, sadilicom povrća i kontrolom prinosi su iznosili 262.79, 250.42 i 255.25 t·ha-1
,
redom. Odnos isplativosti investicije iznosio je 2.49:1, 2.17:1, 2.38:1 i 2.27:1, redom.
Ušteda vremena u poređenju sa ručnom sadnjom je bila 77.78 %, 33.33 % i 75.00 %,
redom.
Ključne reči: hybrid, Napier-Bajra, sadilica šećerne trske, poljski kapacitet, prinosi.
Prijavljen:
Submitted: 17.08.2015.
Ispravljen:
Revised:
Prihvaćen:
Accepted: 12.04.2016.
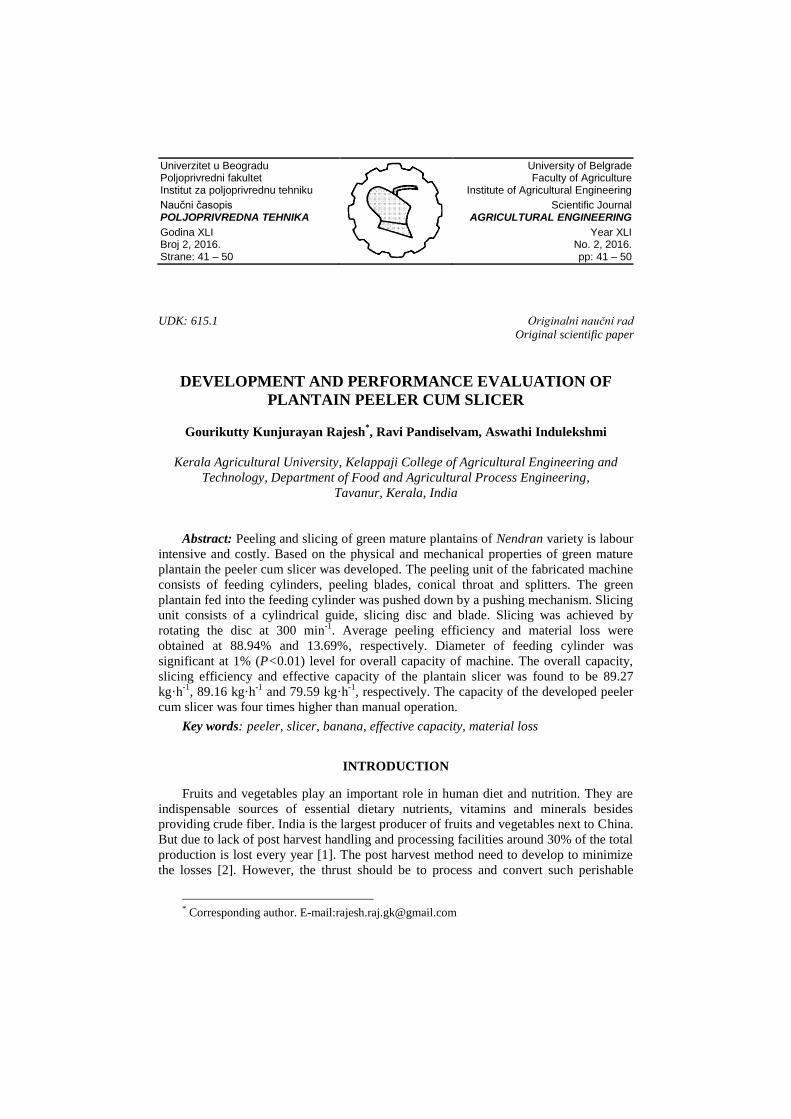
Univerzitet u Beogradu Poljoprivredni fakultet Institut za poljoprivrednu tehniku
Naučni časopis POLJOPRIVREDNA TEHNIKA
Godina XLI Broj 2, 2016. Strane: 41 – 50
University of Belgrade Faculty of Agriculture
Institute of Agricultural Engineering
Scientific Journal AGRICULTURAL ENGINEERING
Year XLI No. 2, 2016. pp: 41 – 50
UDK: 615.1 Originalni naučni rad
Original scientific paper
DEVELOPMENT AND PERFORMANCE EVALUATION OF
PLANTAIN PEELER CUM SLICER
Gourikutty Kunjurayan Rajesh*, Ravi Pandiselvam, Aswathi Indulekshmi
Kerala Agricultural University, Kelappaji College of Agricultural Engineering and
Technology, Department of Food and Agricultural Process Engineering,
Tavanur, Kerala, India
Abstract: Peeling and slicing of green mature plantains of Nendran variety is labour
intensive and costly. Based on the physical and mechanical properties of green mature
plantain the peeler cum slicer was developed. The peeling unit of the fabricated machine
consists of feeding cylinders, peeling blades, conical throat and splitters. The green
plantain fed into the feeding cylinder was pushed down by a pushing mechanism. Slicing
unit consists of a cylindrical guide, slicing disc and blade. Slicing was achieved by
rotating the disc at 300 min-1
. Average peeling efficiency and material loss were
obtained at 88.94% and 13.69%, respectively. Diameter of feeding cylinder was
significant at 1% (P<0.01) level for overall capacity of machine. The overall capacity,
slicing efficiency and effective capacity of the plantain slicer was found to be 89.27
kg·h-1
, 89.16 kg·h-1
and 79.59 kg·h-1
, respectively. The capacity of the developed peeler
cum slicer was four times higher than manual operation.
Key words: peeler, slicer, banana, effective capacity, material loss
INTRODUCTION
Fruits and vegetables play an important role in human diet and nutrition. They are
indispensable sources of essential dietary nutrients, vitamins and minerals besides
providing crude fiber. India is the largest producer of fruits and vegetables next to China.
But due to lack of post harvest handling and processing facilities around 30% of the total
production is lost every year [1]. The post harvest method need to develop to minimize
the losses [2]. However, the thrust should be to process and convert such perishable
* Corresponding author. E-mail:[email protected]

Rajesh i sar.: Razvoj i ocena . . . / Polj. Tehn. (2016/2). 41 - 50 42
commodities into value added products that can be stored for extended periods there by
reducing losses and making them available through out the year.
Banana (Musa paradisiaca) is one of the oldest tropical fruits cultivated by man
from prehistoric time in India with great socio-economic significance, interwoven in the
cultural heritage of the country. It is the fourth important food crop in terms of gross
value after paddy, wheat and milk products and forms an important crop for subsistence
farmers. In Kerala banana is cultivated in the entire state and is an integral part of
homestead farming system. It is a vegetable as well as fruit apart from being used for the
preparation of various value added products. It provides a more balanced diet than any
other fruit or vegetable. The green banana which becomes palatable after cooking is
popularly referred as plantains, and is a staple food in coastal region of the country
especially in Kerala, while the fresh fruit we consume is referred as dessert banana.
In India crop production has been steadily increasing due to advances in production
technology, but improper post harvest handling and storage results for high losses [3].
Hence, the long-term objective of our country’s economic development is a good
balance between a strong industrial sector and a resilient agricultural sector. The
development of micro, small and medium scale rural agro industry is seen as a strategic
step towards achieving this goal. There are large numbers of micro and small scale food
processing enterprises run by farmers, which produce a wide variety of processed foods.
Processed foods or snack foods may be described as mini meals in between main meals.
Snacks like banana chips light to eat and serve a variety of useful purposes in our day to
day life. Banana chips making has already developed into a cottage and small scale
industry in Kerala and the product is in high demand in India as well as abroad,
especially in Middle East countries. The quality of the products can be monitored by
online system with FT-NIR Spectroscopy [4]. There is great potential for this to be
developed further, exploiting the domestic and fast increasing export demand.
Peeling and slicing of the well matured unripe plantain is a difficult operation for an
unskilled person and also time consuming. Peeling is the removal of skin from green
mature plantain. Slicing is carried out to reduce the size of product so as to enable it to
suit the processing and consumer requirements. At present, peeling and slicing of
plantain is done manually by stainless steel knives. This conventional method poses
danger to operator’s finger by inflicting injury. Frying quality of chips depends greatly
on the uniformity of the wafers. The existing conventional method does not produce
chips of uniform size. The output capacity of the system is less and the whole process is
time consuming and labor intensive.
The knowledge of some important physical and mechanical properties of fruits is
necessary for the design of various food processing equipments [5, 6]. In order to
eliminate the drudgery involved in manual peeling, avoid injury to workers, increase
efficiency and maintain high quality standards and hygiene to the prepared chips, an
attempt was made at Kelappaji College of Agricultural Engineering and Technology,
Tavanur to develop a plantain peeler cum slicer in terms of capacity, peeling efficiency
and material loss.
Rajesh et al.: Development and Performance . . . / Agr. Eng. (2016/2). 41 - 50 43
MATERIAL AND METHODS
The plantain peeler cum slicer consists of feeding unit, peeling unit, pushing unit,
collection unit, slicing unit and frame assembly as shown in Fig.1.
Feeding unit. The feeding unit consists of three cylindrical guides of different
diameters placed 120° apart fixed to a sleeve using three equal length mild steel flats of
28×3.15×750 mm. A cylindrical sleeve of 48×34 mm (diameter × length) was mounted
on 500 mm vertical pillar. The rotation of the cylindrical guide is possible by rotating the
sleeve. Three stainless steel pipes of diameters 42, 47 and 54 mm, height 200 mm each
and thickness 2 mm were used for the fabrication of cylindrical guide.
Peeling unit. It is the main unit of the peeler which separates the peel from the pulp.
Three high carbon steel blades of width 25 mm were bent to form circular type openings
of diameters 28, 32 and 37 mm for respective cylindrical guides through which plantain
passes during the peeling operation. Each cylindrical guide was connected to a conical
throat of 50 mm height and 60 mm base diameter using splitter blades. The peeling
blades were welded over these conical throats. Three splitting blades of medium carbon
steel with length 140 mm and thickness 1 mm was welded over each throat of the
peeling unit to split the peel after the peeling operation.
Pushing unit. The main parts of pushing unit are piston, rack and pinion and ratchet
and pawl. The lowering and lifting of the piston is done by this unit. Ratchet and pawl is
a device consisting of a toothed wheel engaged with a pivoting, spring loaded finger
called a pawl that permits it to move in one direction and preventing motion in opposite
direction. The teeth are uniform, having a moderate slope on one edge and a much
steeper slope on the other edge. When the wheel rotates in one direction, the pawl slides
over the teeth, and in opposite rotation, it catches in the teeth. The rack is a flat, toothed
part of 3 mm pitch and 300 mm long. The pinion was fitted with 18 teeth. It converts the
applied rotary motion to linear motion. The upward and down ward motion of the piston
inside the cylindrical guide was performed by these two mechanisms.
Collection unit. The collection unit consists of outlet chute and a collecting tray. The
outlet chute was made of 16 gauge Galvanized Iron sheet with 45° inclination towards
the horizontal to facilitate easy discharge. Collecting tray of 300x300x300 mm was
made from Aluminium sheet of 1 mm thickness. The peeled plantain slides downward
through the outlet chute into the collecting tray.
Slicing unit. Slicing unit consists of a cylindrical guide, slicing disc and blade.
Peeled plantain was fed to the slicing unit through the cylindrical guide of 37 mm
diameter and 150 mm length. About 40 x 15 mm stainless steel blade was mounted over
110 mm diameter disc of 1.8 mm thickness. Slicing was achieved by rotating the
disc at 300 min-1
. The slicing unit was powered with 10 A, 12 VDC motor with 32
kg·cm-1
torque.
Frame assembly. The frame supports the entire machine component to perform its
operation satisfactorily. It was fabricated using ISA 31x6.3 mm MS section. On the
frame assembly, units like pushing unit, feeding unit, peeling unit, peeled plantain outlet
and slicing unit were mounted.
Performance evaluation of peeling unit. Matured Nendran procured from the local
market were used for conducting the experiment. The plantains were graded into three
sets according to their size. The two ends of the matured plantain of Nendran variety
were chopped off and then fed through the respective cylindrical guides of diameters 42,

Rajesh i sar.: Razvoj i ocena . . . / Polj. Tehn. (2016/2). 41 - 50 44
47 and 54 mm. Peeling was achieved by the cutting action of the circular blade followed
by splitting of the peels by the splitter. The peeled plantains falls down through the inner
throat and collected in the collecting tray. The split peels slides through the outer conical
throat were placed in the discard tray. The time required for operation was noted and the
capacity was calculated. All the experiments were replicated five times and the average
value was recorded. A comparison between manual and mechanical peeling was also
carried out.
Figure 1. Plantain peeler cum slicer
Capacity. The capacity of the peeler which is the kilogram of peeled plantain
produced by the machine in one hour was calculated by noting the weight of the peeled
plantain produced and the time taken for the same. It was expressed in kg·h-1
.
Peeling Efficiency. The initial weights of the different samples of plantain were
taken. Then each sample was subjected to peeling action. After peeling, the weight of the
peeled product and the peel obtained were noted. The peel remaining on the plantain was
removed manually for each of the samples and the weights were noted. Peeling
efficiency was then calculated using the formula [7].
Peeling efficiency = (X-Y) × 100 / X (1)
where:
X [g] - weight of the total peel,
Y [g] - weight of peel remaining on plantain to be removed manually after
mechanical peeling.
Material loss. Material loss for each sample was calculated based on the following
formula:
Material loss (%) = Z / (W+Z) (2)

Rajesh et al.: Development and Performance . . . / Agr. Eng. (2016/2). 41 - 50 45
where:
Z [g] - weight of flesh obtained from the peel,
W [g] - total weight of plantain after mechanical peeling.
Performance evaluation of slicing unit. The peeled samples were fed to the
cylindrical guide of the slicing unit to achieve slicing operation. The slices were
collected in a tray and kept below the blade set. The time required for the operation was
noted and operating capacity, percentage damage and slicing efficiency was evaluated.
Overall Capacity. The operating capacity of the fabricated slicer was calculated by
weighing all the cut slices irrespective of damage per unit time.
Slicing Efficiency. The efficiency of slicer was evaluated by weighing the damaged
and round slices separately and using the expression [8].
100 slicesall of Weight
slicesdamaged of Weight - slicesall of Weight( Efficiency Slicing
(3)
Percentage damage. The percentage damage of the slicer was evaluated using the
following expression:
100slices all ofWeight
slices damaged ofWeight % damage, Percentage
(4)
Effective capacity. The effective capacity found by using the expression [9].
Effective capacity = Overall capacity x η/100 (5)
Statistical analysis. Data were analyzed using AGRES software. Data of experiment
were analyzed by a randomized block design using factorial arrangements of treatments
[10].
RESULTS AND DISCUSSION
Capacity. The capacity of the peeler for 42, 47 and 54 mm diameter feeding cylinder
are presented in Tab 1. The over all capacity was found to be 34.21, 49.74 and 68.48
kg·h-1
for 42, 47 and 54 mm diameter cylindrical guides, respectively.
From the table, it was observed that the capacity of the machine increased with the
diameter of feeding cylinder. Maximum capacity was obtained using 54 mm diameter
cylindrical guide and minimum for 42 mm. This may be due to the size of the plantain
increases with weight. But there is no significant change in time taken for peeling
plantains through a single cylindrical guide.
The overall capacity were statistically analyzed and presented in Table 2. From the
table, it was observed that the feeding cylinder diameter was significant at 1% (P<0.01)
level.
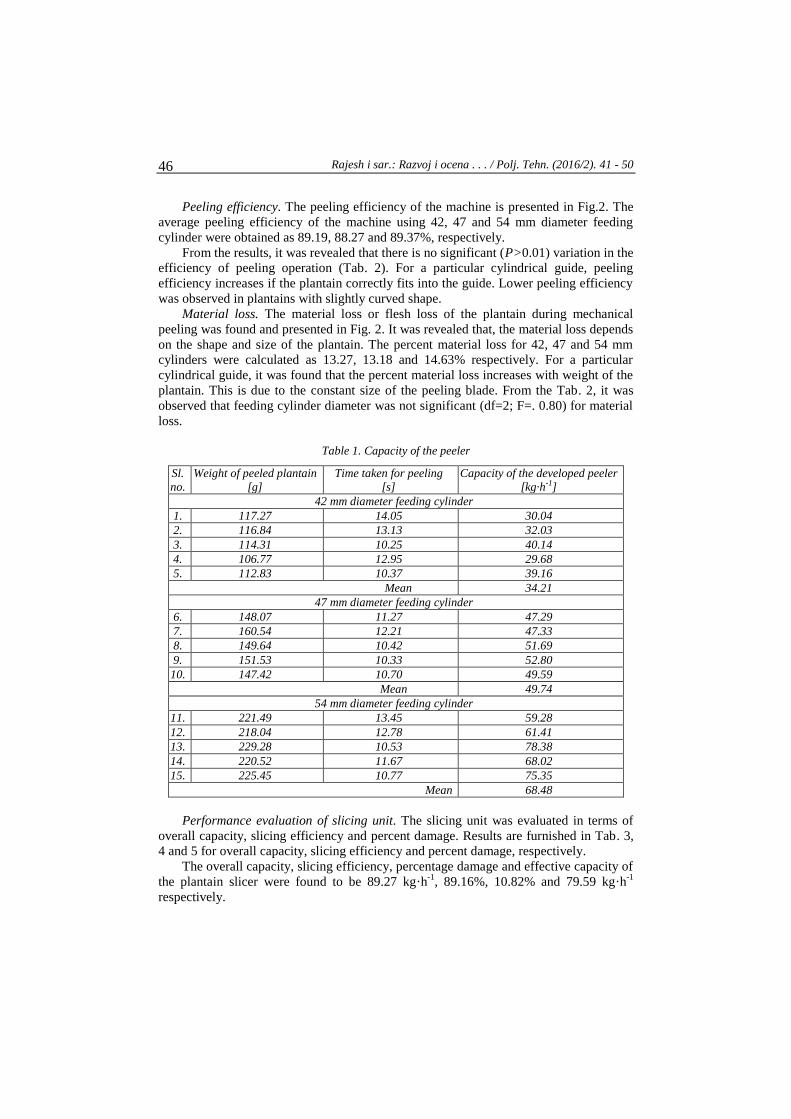
Rajesh i sar.: Razvoj i ocena . . . / Polj. Tehn. (2016/2). 41 - 50 46
Peeling efficiency. The peeling efficiency of the machine is presented in Fig.2. The
average peeling efficiency of the machine using 42, 47 and 54 mm diameter feeding
cylinder were obtained as 89.19, 88.27 and 89.37%, respectively.
From the results, it was revealed that there is no significant (P>0.01) variation in the
efficiency of peeling operation (Tab. 2). For a particular cylindrical guide, peeling
efficiency increases if the plantain correctly fits into the guide. Lower peeling efficiency
was observed in plantains with slightly curved shape.
Material loss. The material loss or flesh loss of the plantain during mechanical
peeling was found and presented in Fig. 2. It was revealed that, the material loss depends
on the shape and size of the plantain. The percent material loss for 42, 47 and 54 mm
cylinders were calculated as 13.27, 13.18 and 14.63% respectively. For a particular
cylindrical guide, it was found that the percent material loss increases with weight of the
plantain. This is due to the constant size of the peeling blade. From the Tab. 2, it was
observed that feeding cylinder diameter was not significant (df=2; F=. 0.80) for material
loss.
Table 1. Capacity of the peeler
Sl.
no.
Weight of peeled plantain
[g]
Time taken for peeling
[s]
Capacity of the developed peeler
[kg·h-1]
42 mm diameter feeding cylinder
1. 117.27 14.05 30.04
2. 116.84 13.13 32.03
3. 114.31 10.25 40.14
4. 106.77 12.95 29.68
5. 112.83 10.37 39.16
Mean 34.21
47 mm diameter feeding cylinder
6. 148.07 11.27 47.29
7. 160.54 12.21 47.33
8. 149.64 10.42 51.69
9. 151.53 10.33 52.80
10. 147.42 10.70 49.59
Mean 49.74
54 mm diameter feeding cylinder
11. 221.49 13.45 59.28
12. 218.04 12.78 61.41
13. 229.28 10.53 78.38
14. 220.52 11.67 68.02
15. 225.45 10.77 75.35
Mean 68.48
Performance evaluation of slicing unit. The slicing unit was evaluated in terms of
overall capacity, slicing efficiency and percent damage. Results are furnished in Tab. 3,
4 and 5 for overall capacity, slicing efficiency and percent damage, respectively.
The overall capacity, slicing efficiency, percentage damage and effective capacity of
the plantain slicer were found to be 89.27 kg·h-1
, 89.16%, 10.82% and 79.59 kg·h-1
respectively.

Rajesh et al.: Development and Performance . . . / Agr. Eng. (2016/2). 41 - 50 47
Table 2. Analysis of variance for overall capacity, peeling efficiency and material loss
Variable Capacity Peeling efficiency Material loss
df F df F df F
Cylinder diameter 2 177.53** 2 0.1871NS 2 0.8020NS
Error 5.05 4.08 2.01
Total 244.67 2.42 1.40
SEd 1.83 1.65 1.15
CV, % 4.46 2.26 10.25
Table 3. Overall capacity of slicer
Sl.
No.
Weight of peeled plantain
[g]
Time taken for slicing
[s]
Over all capacity
[kg·h-1]
1. 54.08 6.38 88.20
2. 51.34 5.47 89.34
3. 52.85 6.29 88.09
4. 45.94 4.8 89.55
5. 45.2 3.99 91.17
Mean 89.27
87.5
88
88.5
89
89.5
90
40 45 50 55
Feeding cylinder diameter, mm
Peelin
g e
ffic
ien
cy, %
13
13.4
13.8
14.2
14.6
15
Mate
rial lo
ss, %
Peeling eff icincy, % Material loss, %
Figure 2. Effect of feeding cylinder diameter on peeling efficiency and material loss
Table 4. Efficiency of slicer
Sl.
No.
Weight of all slices
[g]
Weight of damaged slices
[g]
Efficiency
[%]
1. 323.03 29.47 90.87
2. 260.45 28.61 89.01
3. 340.65 37.55 88.97
4. 345.79 39.41 88.60
5. 350.95 40.74 88.39
Mean 89.16
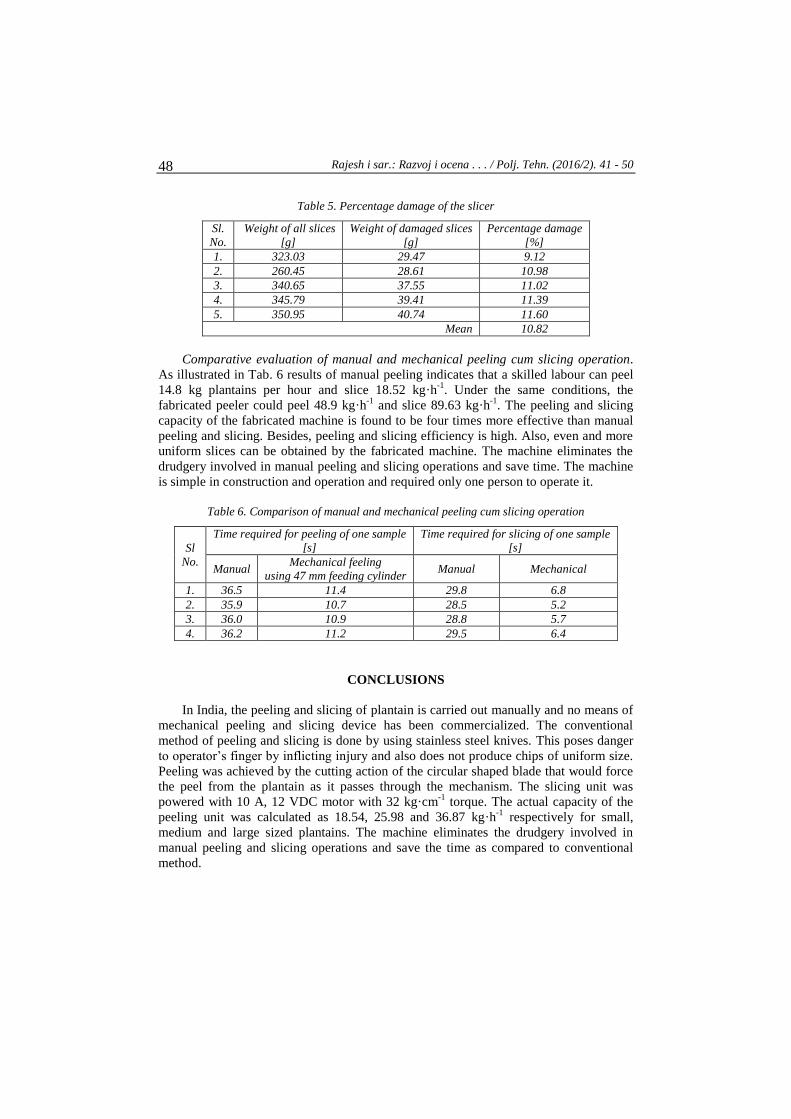
Rajesh i sar.: Razvoj i ocena . . . / Polj. Tehn. (2016/2). 41 - 50 48
Table 5. Percentage damage of the slicer
Sl.
No.
Weight of all slices
[g]
Weight of damaged slices
[g]
Percentage damage
[%]
1. 323.03 29.47 9.12
2. 260.45 28.61 10.98
3. 340.65 37.55 11.02
4. 345.79 39.41 11.39
5. 350.95 40.74 11.60
Mean 10.82
Comparative evaluation of manual and mechanical peeling cum slicing operation.
As illustrated in Tab. 6 results of manual peeling indicates that a skilled labour can peel
14.8 kg plantains per hour and slice 18.52 kg·h-1
. Under the same conditions, the
fabricated peeler could peel 48.9 kg·h-1
and slice 89.63 kg·h-1
. The peeling and slicing
capacity of the fabricated machine is found to be four times more effective than manual
peeling and slicing. Besides, peeling and slicing efficiency is high. Also, even and more
uniform slices can be obtained by the fabricated machine. The machine eliminates the
drudgery involved in manual peeling and slicing operations and save time. The machine
is simple in construction and operation and required only one person to operate it.
Table 6. Comparison of manual and mechanical peeling cum slicing operation
Sl
No.
Time required for peeling of one sample
[s]
Time required for slicing of one sample
[s]
Manual Mechanical feeling
using 47 mm feeding cylinder Manual Mechanical
1. 36.5 11.4 29.8 6.8
2. 35.9 10.7 28.5 5.2
3. 36.0 10.9 28.8 5.7
4. 36.2 11.2 29.5 6.4
CONCLUSIONS
In India, the peeling and slicing of plantain is carried out manually and no means of
mechanical peeling and slicing device has been commercialized. The conventional
method of peeling and slicing is done by using stainless steel knives. This poses danger
to operator’s finger by inflicting injury and also does not produce chips of uniform size.
Peeling was achieved by the cutting action of the circular shaped blade that would force
the peel from the plantain as it passes through the mechanism. The slicing unit was
powered with 10 A, 12 VDC motor with 32 kg·cm-1
torque. The actual capacity of the
peeling unit was calculated as 18.54, 25.98 and 36.87 kg·h-1
respectively for small,
medium and large sized plantains. The machine eliminates the drudgery involved in
manual peeling and slicing operations and save the time as compared to conventional
method.
Rajesh et al.: Development and Performance . . . / Agr. Eng. (2016/2). 41 - 50 49
BIBLIOGRAPHY
[1] Sudheer, K.P., Indira,V. 2007. Post Harvest Technology of Horticultural Crops. New India
Publishing Agency, New Delhi. pp. 2.
[2] Ravi, P., Venkatachalam, T., Rajamani, M. 2015. Decay Rate kinetics of Ozone Gas in Rice
Grains. Ozone: Science & Engineering, (Accepted). DOI: 10.1080/01919512.2015.1040912.
[3] Pandiselvam, R., Thirupathi, V. 2015. Reaction kinetics of Ozone gas in Green gram (Vigna
radiate). Ozone: Science & Engineering, 37, 1-7. DOI: 10.1080/01919512.2014.984158.
[4] Ravi, P., Venkatachalam, T., Palanisamy, V. 2014. Fourier transform near-infrared
spectroscopy for nondestructive and rapid measurement of moisture content of
paddy. Poljoprivredna tehnika, 39(3), 31-40.
[5] Ravi, P., Venkatachalam, T. 2014. Important engineering properties of paddy. Poljoprivredna
tehnika, 39(4), 73-83.
[6] Rangaraju, V., Vijayaram, E.N., Sulthan, S., Veerapandian, C. 2015. Modeling the Mass of
Banana Fruit by Geometrical Attributes. Poljoprivredna tehnika, 2, 91-99.
[7] Radhakrishnan Setty, Vijayalakhmi, M.R., Usha Devi, A. 1993. Methods for peeling fruits
and vegetables; A critical evaluation. Journal of Food Science and Technology, 300(3), 155-
162.
[8] Kacharu, P.P., Balsubramanian, D., Kotwaliwale, N. 1996. Design, Development and
Evaluation of Rotary slicer for Raw banana chips. Agricultural mechanization in Asia, Africa
and South America, 27(4), 6-12.
[9] Balasubramanian, V.M., Viswanathn, R., Sreenarayanan, V.V. 1993. Design, Development
and Evaluation of a Cassava chipper. Agricultural mechanization in Asia, Africa and South
America, 24, 60-64.
[10] Pandiselvam, R., Amreena, J.N.J., Parthasarathi, G., Rajesh, K., Kaveri, G. 2014.
Development and performance evaluation of mobile irrigator for dry land
agriculture. Poljoprivredna tehnika, 39(3), 53-62.
RAZVOJ I OCENA KARAKTERISTIKA
MAŠINE ZA LJUŠTENJE I REZANJE
Gourikutty Kunjurayan Rajesh, Ravi Pandiselvam, Aswathi Indulekshmi
Poljoprivredni univerzitet Kerala, Fakultet za poljoprivrednu tehniku i tehnologiju
Kelappaji, Institut za hranu i poljoprivredu,
Tavanur, Kerala, India
Sažetak: Ljuštenje i rezanje zelenih zrelih banana varijeteta Nendran je veoma
intenzivan i skup postupak, Na osnovu fizičkih i mehaničkih osobina zelenih zrelih
banana razvijena je mašina za ljuštenje i rezanje. Jedinica za ljuštenje ove mašine se
sastoji od dostavljačkih cilindara, noževa za ljuštenje, konusnog grla i razdeljivača.
Zelene banana se ubacuju u privodni cilindar i guračem potiskuju dole. Rezni uređaj se
sastoji od cilindrične vođice, režućeg diska i noža. Rezanje se postiže rotacijom diska sa
300 min-1
. Srednja efikasnost ljuštenja i gubici materijala su iznosili 88.94% i 13.69%,

Rajesh i sar.: Razvoj i ocena . . . / Polj. Tehn. (2016/2). 41 - 50 50
redom. Uticaj prečnika privodnog cilindra bio je značajan na nivou 1% (P<0.01) za
ukupni kapacitet mašine. Ukupni kapacitet, efikasnost sečenja i efektivni kapacitet
sekača iznosili su 89.27 kg·h-1
, 89.16 kg·h-1
i 79.59 kg·h-1
, redom.
Ključne reči: ljuštenje, rezanje, banana, efektivni kapacitet, gubici
Prijavljen:
Submitted: 22.08.2015.
Ispravljen:
Revised:
Prihvaćen:
Accepted: 12.04.2016.

Univerzitet u Beogradu Poljoprivredni fakultet Institut za poljoprivrednu tehniku
Naučni časopis POLJOPRIVREDNA TEHNIKA
Godina XLI Broj 2, 2016. Strane: 51 – 60
University of Belgrade Faculty of Agriculture
Institute of Agricultural Engineering
Scientific Journal AGRICULTURAL ENGINEERING
Year XLI No. 2, 2016. pp: 51 – 60
UDK: 631.348 Originalni naučni rad
Original scientific paper
THE DEVELOPMENT OF VERTICAL PATTERNATOR TO
EVALUATE THE HYDRAULIC SPRAYERS
El-Sayed Sehsah*
Kafr EL Sheikh University, Faculty of Agriculture,
Department of Agricultural Engineering, Egypt.
Abstract: In Egypt, it could be not able to test the vertical distribution for agriculture
sprayer machines this may be due to the poor measuring instruments such as vertical
patternator. The aim of the current research is develop and evaluate an inexpensive
vertical patternator for hydraulic sprayers. The current research study carried out in
laboratory of agricultural engineering dept., faculty of agriculture, kafr El-Sheikh
University. The vertical patternator manufactured and made from the local material
under laboratory and work station in kafr El Sheikh University. The tests and the
evaluation of the patternator included two main parameters. The first treatment was
evaluation the three vertical sprayers under laboratory conditions. As well as, the second
treatment was evaluation two different measured methods to determine the efficiency of
the sprayer by using the CV %. The results indicated that, the Tee-jet XR 110-3 VP
nozzles gave the highest percentage value of spray liquid captured compared to
Hardi110-02 LS and LU110-04 nozzles. The development patternator captured more
spray liquid due to increase of the operating pressure of spray liquid. The t-test value for
LU 110-04 nozzle was -1.48 with standard error (SE) 0.23 and probability P-value 0.89.
It could be used the automatic method to estimate the CV % and it's easy to apply. As
well as, there are no different effect between manual and automatic method at the
volume application rate 475 l·ha -1
, 960 l·ha -1
and 1150 l·ha -1
for determination of the
spray uniformity or CV %.
Key words: spray distribution, patternator
* Corresponding author. E-mail: [email protected]

Sehsah: Razvoj vertikalnog . . . / Polj. Tehn. (2016/2). 51 - 60 52
INTRODUCTION
The use of patternator relates principally to achieving a uniform volume distribution
pattern at a horizontal surface, and therefore may only be relevant for flat fan hydraulic
pressure nozzles designed to achieve this. Vertical and horizontal movements of boom
sprayers represent one of the elements affecting the quality of pesticide distribution and
the effectiveness of the treatments. Vertical movements produce variations of the height
of the nozzles, determining, as a consequence, areas over-sprayed by contiguous nozzles
and areas under-sprayed or unsprayed: in any case the quantity of product distributed at
ground differs from the optimum value. The assumption that biological efficacy,
particularly for foliar and insect targets, can be predicted by patternator measurements
made in a static laboratory situation is highly questionable [7]. Measurements of spray
distribution by a patternator do not relate directly to deposition on the actual biological
target which will vary greatly with the application. The actual biological target area
ranges from the soil to the ear or stem of a cereal plant with insects, fungi and weeds
presenting vastly differing type of target [1]. Also the target area for deposition against a
particular pest can vary even with the particular chemical used depending on its mode of
action. For example, to optimally control an insect living on an under-leaf surface,
contact, systemic and vapour acting chemicals would need to be applied to different
specific target areas for maximum efficiency. Different nozzles have been shown to give
different types of overall deposit pattern. The deposit ratio between horizontal and
vertical targets differs significantly between flat fan and air induction nozzles. It has long
been known that air assisted sprayers also change these deposit ratios and the effect will
vary differently with different dynamic factors [3] and [8]. Thus a simple two-
dimensional measurement of the horizontal deposition profile may well be very
misleading regarding predicting deposition on (complex) three-dimensional targets. [2]
specifically suggests that biological efficacy of various nozzles used for band spraying
was not related to the measured horizontal spray distribution pattern. [2] studied the
effects of spray boom deflection, wind velocity, and wind direction on spray pattern
displacement (SPD) of extended range of 110-0 fan nozzles by using patternator. Tests
were conducted at four nozzle pressures of 139, 208, 313 and 383 kPa . At each pressure,
tests were conducted at four winds conditions and including combinations of both cross
and head wind However, coefficient of variation (C.V., %) values of 8.5% to 13.5%
obtained from these tests indicated uniform or acceptable coverage. [5] and [6] indicated
that the spray distribution is improved by increasing nozzle size, pressure and reduces
the nozzle height. The type of nozzles is very important parameters which affect the
distribution of pattern (C.V.%). The selection of nozzles may be reduced the losses of
spray dose and gives good distribution of pattern. Static indoor patternator measurements
ignore the dynamic effects of boom and air movement on spray distribution with air
movements and micro-climatic conditions greatly influencing deposition patterns
(particularly with more biologically efficient smaller droplets where turbulent transport
is often a very significant factor in spray distribution and deposition). The importance of
dynamic factors and states: ‘Spray distribution, measured under static conditions on a
patternator, does not represent the pattern achieved in routine dynamic applications.
Each specific sprayer configuration defined by nozzle type, spraying height, pressure
and speed yields in a specific horizontal dynamic distribution pattern which is
unpredictable and shows longitudinal strips of distinct deposit levels on targets within
Sehsah: The Development of Vertical . . . / Agr. Eng. (2016/2). 51 - 60 53
the sprayed area. A number of factors affect the deposition and retention of pesticide on
the plants. The examples of such factors are canopy structure of the target crop, spray
application factors and properties of the sprayed liquid and air-assistance to hydraulic
boom of the sprayers. Leaf morphological features such as shape, leaf orientation and
leaf age may also affect retention. A part of the spray can be lost during the application
before the droplets are deposited on plants or soil. Droplets can be transported out of the
sprayed field by spray drift [4].
Objectives. The main objectives are developed and evaluated of an inexpensive
vertical patternator that researchers or growers can construct at their farm workshop
under Egyptian conditions. As well as, increase the efficiency of application by
improving the technical condition of sprayers. Reduce pesticide application costs for
growers by correct targeting. Also, decrease environmental pollution.
MATERIAL AND METHODS
The vertical patternator: The developed vertical patternator was constructed and
manufactured in the laboratory of agricultural engineering department, faculty of
agriculture, Kafr El-Sheikh University. Nine 35 cm x 100 cm wide fly screens were
connected via hooks to two 35 cm high, 3 x 1.5 cm aluminum U-section. A small gutter
was attached, at an angle, to the bottom edge of each screen. The gutter sloped to one
end where a plastic hose was connected which ran down to a box containing through the
flexible polyethylene 10 mm tube diameter to the 700 mm length and 80 mm diameter
cylinders. The frame was constructed in two halves for ease of assembly. The collecting
cylinders fixed in aluminum frame and the polyethylene 10 mm tubes were fixed at the
top of the collecting cylinders. As well as, the mechanical valve was fixed in the bottom
of each collecting cylinders. The mobile unit which driven by the driver pulley that
mounted with the stepper motor. The stepper motor was data logger was constructed
upon the top of collecting cylinders. As well as, it was moved upon the top of center of
the collecting cylinders. The Kimo software program was used to control of the steps for
mobile unit. LASER distance instrument was used and fixed in vertical position on the
mobile unit to measure the height of the collecting liquid sprayed as shown in figure 1.
Miscellaneous Transmission Systems: The belt drive is effective in applications
where a small payload is moved at high linear velocities with a high acceleration rate
over a relatively short distance with a relatively low accuracy. The linear velocity for the
x-axis is calculated with Eq. 1. A cylinder diameter of 80 mm was specified in the
patternator system design constraints.
The angular velocity for the pointing mechanism must be proportional to the
velocity and acceleration of the x, axis since the Laser may be cropped if the linear
velocity of the x axis is faster than the rotational velocity of the pointing mechanism.
From Eq. 1, the linear velocities were 2.25 m·s-1
, 1.5 m·s-1
and 1.15 m·s-1
at operating
time 60 s , 90 s and 120 s, respectively. The optimum linear velocity was 1.5 m·s-1
which
gave a good number of operating pulses. The number of operating pulses is expressed as
the number of pulse signals that adds up to the angle that the motor must move to get the
work from point A to point B. The motor speed limitations may occur due to setting of
Kimo software program.

Sehsah: Razvoj vertikalnog . . . / Polj. Tehn. (2016/2). 51 - 60 54
t
1dDnv
).( (1)
where:
n [-] - number of collecting cylinders to be inspected,
D [mm] - cylinder diameter,
d [mm] - distance between the cylinders,
t [s] - inspection time.
Ultrasonic sensor: The measured distance range for the above mentioned Atrium
Ultrasonic sensor is 40 mm to 27000 mm. To simplify the sensor procedure, the sensor
could be advantageous in a variety of applications, including distance measuring in tight
spaces and liquid level control for tubs in patternator.
Spray liquid measurement level setup: The Atrium Ultrasonic sensor was mounted
on the belt which driven by steeper motor. The electric steeper motor was moved from
the end of the lift side to the right side in the patternator. In addition, the eclectic motor
controlled by the Kimo software program and it was programmed to move over every
tube in the patternator as shown in figure 1. The Laser sensor was moved over the top of
every tube in the patternator and measured the distance that indicated the spray liquid
levels for each tube. These distances of the spray levels for each tube recorded to
calculate the spray volume for each tube, flow rate, and coefficient of variation CV %.
The Voltcraft DL-120th data logger was used to measure the relative humidity and the
temperature. As well as the flow-rate and coefficient of variation percentages (CV %)
were determined. By computer analysis, from the levels recorded in the patternator tubes
for the single candidate nozzle, calculate the distribution for a 1.8 meter width (i.e. 9
columns) excluding the ends where there is no overlap. The manometer pressure was
monitored using a 0-1500 kPa, class 3A pressure gauge.
Procedures: The current research investigates to evaluate the distribution for the
development vertical patternator. The vertical patternator comprises a vertical mast
which travels through the spray cloud. Droplets are intercepted by a collection device,
the resultant liquid then passes through pipes to graduated collection tubes. The collected
liquid shows a pattern, it shows how the spray is distributed within the tree, and how
much spray goes over the top of the canopy as drift. The sprayer operator can adjust
nozzle orientation to improve deposition on the target e.g to the fruit zone rather than
wasting spray over the canopy. The spray cloud hit the fly screen, the air passing through
and the liquid ran down the front of the screen, into the gutter and then, via the plastic
hose into the collecting PVC cylinders. The duration of spraying experiments are
controlled for each treatment operated at 180 second. Operating spray pressures of 125
kPa, 175 kPa and 250 kPa are applied for three vertical nozzle sprayers to obtain 475
l·ha -1
, 960 l·ha -1
and 1150 l·ha -1
application volume rate. The control unit for liquid
pressure and flow-rate adjusted before the vertical nozzle used to obtain the operating
pressure nozzles for every treatment. All measurements were made spraying water at a
temperature of approximately 24° C. Environmental conditions were kept constant at a
temperature of 24° C and a relative humidity between 74 and 86 %. A series of
experiments were conducted to test the development patternator with manual and
automatic measured to see if the new designs would be as accurate as the “standard”
manual measured method. The vertical boom sprayer with three different nozzles were

Sehsah: The Development of Vertical . . . / Agr. Eng. (2016/2). 51 - 60 55
tested, Hardi 110-02 LS, Tee jet XR 110-3 VP nozzles and Lechler LU110-04. The
above vertical boom sprayer with three different nozzles were simulated as an air ballast
sprayer. All sprayers were equipped to spray the above volume rate and three repetitions
were carried out for each trial. As well as there are not found any standard vertical
patternator under Egyptian conditions to use in the current research. The main treatment
was the two different type methods to measure the vertical spray distribution for three
different nozzles. Arrangement and statistical analysis of the experiments was according
to randomized design.
Figure 1. Diagram of developed vertical patternator to measure the vertical uniformity for
hydraulic sprayers
Coefficients of Variation (CV, %): The Excel software program was used and with
VB programming programmed the coefficient of variation. The coefficients of variation
as the percentage of spray pattern for all nozzles treatment were programmed by using
the standard equation and excluding the ends where there is no overlap. The data for
every treatment were collected for every treatment conditions. The values of spray
volume in every cylinder were used to re-calculate the coefficients of variation
percentage. The CV % values were recalculated by using the Eq. 2, 3, and 4 as follows
to obtain a good accuracy for the CV % [6].
n
XX
i (2)

Sehsah: Razvoj vertikalnog . . . / Polj. Tehn. (2016/2). 51 - 60 56
1n
xxs
2
i
)( (3)
100x
sCV *
(4)
where:
CV [%] - coefficients of variation,
xi [cm] - height of liquid in the tube,
n [-] - number of patternator columns tubes.
Figure 2. Development vertical patternator to measure the vertical uniformity
for hydraulic sprayers
RESULTS AND DISCUSSION
An experiment was conducted to measure the amount recovered by each of the
patternator compared to the output of each of the sprayers. Fig. 3 and Tab. 1 show that
the development patternator captured the most, averaging 83.25 % of the applied spray.
The highest amount recovered was with the Tee-jet XR 110-3 VP nozzles sprayer when
88.3 % was recovered. Tab. 1 presented the percentage of spray captured volume for
different nozzles at three operating pressure. It is noticed that, the Tee-jet XR 110-3 VP
nozzles gave the highest percentage value of spray liquid captured compared to
Hardi110-02 LS and LU110-04 nozzles. Fig. 4 indicated the collected volume for
different operating pressure 125 kPa, 175 kPa and 250 kPa. It is clearly that, the
development patternator captured more spray liquid due to increase of the operating
pressure of spray liquid as shown in Tab. 1.

Sehsah: The Development of Vertical . . . / Agr. Eng. (2016/2). 51 - 60 57
Figure 3: Display the spray volume collected by development patternator
under different volume rate and operating pressure
Table 1. The percentage volumes captured in the development patternator
at three different operating pressure for different spray type of nozzles
Volume captured
[ %]
Flow rate
[l·min-1]
Pressure
[kPa] Nozzles
75.6 0.39 125 Hardi110-02 LS
83.4 1.06 Tee-jet XR 110-3 VP
81.3 0.79 Lechler LU110-04
83.0 0.44 175 Hardi110-02 LS
84.1 1.14 Tee-jet XR 110-3 VP
83.2 0.91 Lechler LU110-04
82.3 0.59 275 Hardi110-02 LS
88.3 1.45 Tee-jet XR 110-3 VP
84.6 1.36 Lechler LU110-04
Table 2. Statistical analysis of two different measured methods
for coefficient of variation percent CV % values in the patternator
Nozzles Mean SD SE t-test P-value Significant
LU-manual 12.76 1.01 0.58 -1.48 0.894 Non
LU-automatic 13.7 0 0.40 0.23 0.92 0.769 Non
XR-manual 13.63 1.40 0.81 -1.24 0.723 Non
XR-automatic 14.30 1.32 0.76 0.79 0.824 Non
Hardi-manual 15.30 1.90 1.10 -1.67 0.889 Non
Hardi-autmatic 15.73 2.02 1.16 1.12 0.966 Non

Sehsah: Razvoj vertikalnog . . . / Polj. Tehn. (2016/2). 51 - 60 58
Table 3. The coefficient of variation CV % values for different nozzles
at two different measured methods and three application volume rate
Hardi
110-02 LS
Tee-jet
XR 110-3 VP
Lechler
LU110-04
Application volume
[l·ha-1]
Measuring
method
12.0 13.0 15.5 475 Manual
13.3 13.3 15.9 Automatic
13.4 15.5 17.1 960 Manual
14.1 15.8 17.4 Automatic
12.3 13.1 15.3 1150 Manual
13.7 13.8 15.9 Automatic
Figure 4. Indicate the CV percent for different nozzles
by using development patternator at different volume rate
Coefficient of variation percentage (CV,%): To compare between manual and
automatic measured methods for CV percentage, Tab. 2 indicates that the coefficient of
variation percent CV % values for different two measured methods in the patternator. It
is found that there are no significant different between the automatic and manual
measured methods for coefficient of variation percentage. The Origin program version 7
was used to analysis the data. The t-test was used to compare between two measured
values of CV %. The t-test indicated that no significant different between two methods
for all treatment condition. The t-test value for LU 110-04 nozzle was -1.48 with
standard error (SE) 0.23 and probability P-value 0.89. The mean values of CV % for
LU110-04 were 12.7 % and 13.7 % at manual and automatic measured respectively. As
well as the mean values of CV% for XR nozzle were 13.6 % and 14.3 % at manual and
automatic method respectively. The SE value and P-value for XR nozzle were 0.76 and
0.824 respectively. Also, the mean values of CV % for Hardi nozzle were 15.3 % and
15.7 % at manual and automatic method respectively. The above result indicated that, it
may able to use the automatic method to estimate the CV % and it's easy to apply. In
addition to, the duration time to measure the values in automatic method by using the
Sehsah: The Development of Vertical . . . / Agr. Eng. (2016/2). 51 - 60 59
LASER sensor may be taking a few seconds compared to the manual measured method.
Fig. 4 indicated that the CV percent for different nozzles by using development
patternator at different volume rate. It is clearly that the increasing of volume application
rate tends to increase the CV % for all nozzles. As well as, it found that there no
different effect between manual and automatic method under three volume application
rate.
CONCLUSIONS
The result indicated that the development patternator captured more spray liquid due
to increase of the operating pressure of spray liquid. After checking both sets of
calibration values, it was concluded that the calibrations were performed according to
the guidelines issued by the manufacturers of both measuring devices. It is clearly that
the influence of different two measured methods of CV % is rather small. This applies
for both measuring systems. Although these preliminary tests did produce sufficient
results to make some well grounded conclusions. It may be able to put forward some
tendencies: firstly, both manual and automatic system are capable of producing stable
spray distribution of the pattern and this for each tested nozzle type and size and
secondly, the apparatus based on operating pressure is more sensitive of the measuring
device. The development patternator may be able to manufacture and use under Egyptian
conditions. It will be able to build the own patternator and adjust the sprayers for specific
blocks on the farms under local conditions. As well as it will be able to reduce pesticide
drift. Also, apply pesticides more effectively leading to better control of insects/diseases
as more spray is hitting the target.
BIBLIOGRAPHY
[1] Herbst, A., Wolf, P. 2000. Spray deposit distribution from agricultural boom sprayers in
dynamic conditions. ASAE Meeting Paper 01 – 1054.
[2] Lund, I., Jensen, P.K. 2002. Application technology for band spraying: Correlation between
liquid band distribution and biological efficacy. Aspects of Applied Biology, 66. pp 107 – 114.
[3] Richardson, B., Schou, W. C., Kimberley, M.O. 2000. Defining acceptable levels of spray
deposit variation from aerial herbicide applications. ASAE Meeting Paper
[4] Saha, K.P., Singh, D., Agrawal, K., Bhushanababu, V. 2015. Reduction of Spray Losses to
Soil in Soybean. Agricultural Engineering. (2015/2), 19 - 28
[5] Sehsah, E.E. .2007. Study effect of forward speed and the spray nozzles types on the spray
characteristics of air assistance hydraulic sprayer. M.J.Agric.Eng Vol.24.Nr.1 75-87.
[6] Sehsah, E.E., Kleisinger, S. 2009 Study of some parameters affecting spray distribution
uniformity pattern. M. J. Agric Eng. Vol. 26.No. (1) .69-92.
[7] Sehsah, E.E., Kleisinger, S. 2007. Low pressure liquid atomizer for biological pest control.
Misr Journal of Agric. Eng. Vol. 24.No. 1. 62-74.,
[8] Urošević, M., Živković, M. 2012. Technical Parameters and Fan Sprayer Quality of
Vineyards. Agricultural Engineering, 37 (2), 61-69.

Sehsah: Razvoj vertikalnog . . . / Polj. Tehn. (2016/2). 51 - 60 60
RAZVOJ VERTIKALNOG RAZDELJIVAČA ZA ISPITIVANJE
HIDRAULIČNIH PRSKALICA
El-Sayed Sehsah
Univerzitet Kafr EL Sheikh, Poljoprivredni fakultet,
Institut za poljoprivrednu tehniku, Egipat
Sažetak: U Egiptu nije moguće ispitivati vertikalnu raspodelu poljoprivrednih
prskalica zbog nedostatka mernih instrumenata kao što su vertikalni razdeljivači. Cilj
ovog istraživanja je da razvije i ispita jevtin vertikalni razdeljivač za hidraulične
prskalice. Istraživanje je izvedeno u laboratoriji Instiuta za poljoprivrednu tehniku
poljoprivrednog fakulteta Univerziteta Kafr El-Sheikh. Vertikalni razdeljivač je
napravljen od priručnih materijala u laboratoriji i radionici Univerziteta. Testirana su i
ispitivana dva glavna parametra. Prvi ogled bila je ocena tri vertikalne prskalice u
laboratorijskim uslovima. Drugi ogled bila je ocena dva različita merna metoda za
određivanje efikasnosti prskalice preko CV %. Rezultati su pokazali da su mlaznice Tee-
jet XR 110-3 VP dale najveći procenat uhvaćene isprskane tečnosti u poređenju sa
mlaznicama Hardi110-02 LS i LU110-04. Razvijeni razdeljivač je uhvatio više tečnosti
zbog povećanja radnog pritiska tečnosti u spreju. Vrednost t-testa za LU 110-04
mlaznice bio je -1.48 sa standardnom devijacijom (SE) 0.23, a verovatnoća P-vrednosti
0.89. Može se upotrebiti automatski metod da se oceni CV % i lako se primenjuje.
Takođe, nema različitih efekata između ručnog i automatskog metoda zapreminske
norme prskanja od 475 l·ha -1
, 960 l·ha -1
i 1150 l·ha -1
za određivanje ujednačenosti
spreja ili CV %.
Ključne reči: distribucija u spreju, razdeljivač
Prijavljen:
Submitted: 07.10.2015.
Ispravljen:
Revised:
Prihvaćen:
Accepted: 04.04.2016.

Univerzitet u Beogradu Poljoprivredni fakultet Institut za poljoprivrednu tehniku
Naučni časopis POLJOPRIVREDNA TEHNIKA
Godina XLI Broj 2, 2016. Strane: 61 – 70
University of Belgrade Faculty of Agriculture
Institute of Agricultural Engineering
Scientific Journal AGRICULTURAL ENGINEERING
Year XLI No. 2, 2016. pp: 61 – 70
UDK: 502/504 Originalni naučni rad
Original scientific paper
DEVELOPMENT OF MULTIVARIATE REGRESSION MODEL
FOR QUANTIFICATION OF PROXIMATE CONTENT
IN VIGNA RADIATA
USING FOURIER TRANSFORM –NIR SPECTROSCOPY
Ravi Pandiselvam*1
, S. Sunoj2, D. Uma
3
1ICAR –Central Plantation Crops Research Institute,
Physiology, Biochemistry and Post Harvest Technology Division, Kerala, India 2North Dakota State University ,
Department of Agricultural and Biosystems Engineering, Fargo, ND-58102, USA 3Tamil Nadu Agricultural University,
Department of Biochemistry, Coimbatore . India
Abstract: The Fourier Transform Near Infrared (FT-NIR) absorbance spectra
(12800-3600 cm-1
) of 222 green gram samples was used to build calibration models for
the determination of the content of protein, fat and carbohydrate. The samples that
comprised the dataset had an average composition of 22.18% of protein, 1.30% fat, and
50.72% carbohydrate. Multivariate regression was used to develop the quantitative
models for protein, fat and carbohydrate compounds. The root mean square error of
cross validation (RMSECV) was 0.191 (R2 = 91.52) for protein, 0.0271 (R
2 = 88.54) for
fat and 0.765 (R2 = 93.62) for carbohydrate. A fast, simple and accurate method to
quantify the proximate content of green gram was developed by using FT-NIR
spectroscopy. The results showed that FT-NIR spectroscopy could support chemical
analysis methods.
Key words: FT-NIR Spectroscopy, green gram, protein, first derivative, calibration
* Corresponding author. E-mail: [email protected]
The authors would like to acknowledge Shri.S.Kumaravel, Assistant professor and Bannu
Priya, Research Scholar, Indian Institute of Crop Processing Technology, Thanjavur, for
providing chemicals and support during analysis. The special thanks to Dr.V.Thirupathi,
Professor and V.Arun Prasath, Research Scholar for his valuable support.

Pandiselvam i sar.: Razvoj multivarijantnog . . . / Polj. Tehn. (2016/2). 61 - 70 62
INTRODUCTION
Green gram (Vigna radiata) is one of the important pulse crops in India. It is a
protein rich staple food [1]. It contains about 24 percent protein, which is almost three
times that of cereals. It supplies protein requirement of vegetarian population of the
country. It is consumed in the form of split pulse as well as whole pulse, which is an
essential supplement of cereal based diet. The biological value improves greatly, when
wheat or rice is combined with green gram because of the complementary relationship of
the essential amino acids. The biochemical composition changes the structure of the
grains. It influences the engineering properties of grains reported by [2-4]. Most
common methods reported for the determination of protein content are kjeldahl and
lowery method. But these methods are tedious, time-consuming, destructive, not
economically viable and as they require highly skilled operators.
Fourier transform near-infrared (FT-NIR) spectroscopy is an analytical technique
that has gained popularity in recent years for analyzing a wide variety of samples used in
used in nutritional, pharmaceutical, petrochemical, textile and agricultural industries.
The major strength of FT-NIR spectroscopy is a rapid technique, nondestructive,
accurate and that can be employed as a replacement for time-consuming chemical
methods. It is a non-invasive method for the characterization of fat, nitrogen and
moisture content in cocoa powder [5] and protein and moisture in fishmeal [6].
Indistinctly, many authors have used different ranges of wavelengths, which extend from
the visible spectrum to the NIR in order to estimate multiple properties and they have
established different wavelengths ranges. But until now there is not consent between
researchers which is the best wavelengths range to study each grain parameters due to
different grain nature, type, characteristic and influence of grain grow environments [7].
[5] conclude that the second derivative of NIR is the recommended procedure to quantify
fat, nitrogen, and moisture content in cocoa powders by infrared spectroscopy and also
showed that no single wavelengths were strongly correlated with the protein, fat and
carbohydrate content of cocoa powder, which indicates the difficulty of using selected
wavelengths or bans to accurately predict the protein, fat and carbohydrate content of the
selected product.
On the other hand, India still lags behind the countries with a well-developed of
grain sector, especially in processing technology, quality and taste improvement, variety
improvement and storage techniques. The grain chemical composition also changes
during ozone fumigation [20, 21]. The aim of the present study was to evaluate the
potential of NIR-Spectroscopy, as a rapid and non-destructive method to predict the
protein, fat and carbohydrate content of the green gram. On the other hand, NIR models
were developed based on partial least square (PLS) technique.
MATERIAL AND METHODS
Raw material. Green gram was procured from Department of Pulses, Tamil Nadu
Agricultural University, Coimbatore of Tamil Nadu, India and used for the study. The
green gram was cleaned manually to remove all foreign materials.
Sample preparation. The initial moisture content of the samples was determined by
hot air oven drying at 103 ±2°C for 5 hours [8]. The initial moisture content of green

Pandiselvam et al.: Development of Multivariate . . . / Agr. Eng. (2016/2). 61 - 70 63
gram was found to be 11.18% (db). In order to maintain the moisture content of green
gram for this study, the samples were kept in a refrigerator at 4±2°C. The required
quantity of green gram sample was withdrawn and equilibrated at room temperature
(29±3°C) before conducting different tests [9].
Protein, Fat and Carbohydrate determination. Protein content was estimated using
Kjeldahl method. The fat content of the green gram was estimated by the method
described by [10]. Soxhlet extraction with petroleum ether was used for determination of
the fat content. The percentage of carbohydrate content in the green gram sample was
determined by the method reported by [11].
FT-NIR spectroscopy. The FT-NIR spectra were collected on multipurpose analyzer
(MPA) (Bruker Optics, Ettlingen, Germany) equipped with an integrated Michelson
interferometer combined with OPUS software (v. 7.2 Bruker Optics, Ettlingen,
Germany). It was used for spectral acquisition and instrumental control. For the current
study spectra’s were recorded in diffuse reflectance mode on the green gram sample with
sphere macro sample integrating sphere measurement channel over the range 12800–
3600 cm-1
at room temperature. For each calibration standard, the spectrum was attained
by averaging three spectral scans. Each spectrum was the average spectrum of 64 scans.
Chemometrics. Multivariate analysis was used for quantitative and qualitative
analysis. In the present study the in built software (OPUS/Quant 7.2) with the instrument
was used for multivariate calibration which exclusively uses the PLS algorithm for the
calibration and is designed for the quantitative analysis of spectra consisting of bands
showing considerable overlap. It correlates more spectral information using larger
spectral range with reference value of calibration set. This leads to a higher degree of
precision with reduced chance error [12]. Partial Least Square algorithm (PLS), which
was proven to be effective in many quantitative applications [13], was used in the
present study. The OPUS 7.2 software was used for PLS analysis. The samples (222)
were divided in the two sets, viz., calibration sample and validation sample set
randomly, each set containing 111 samples. The quality of the calibration models for
prediction of protein, fat and carbohydrate content was checked by cross validation of
the models. It has been reported that the number of samples to develop the calibration
model should cover the desired quantification range for the specific analyses, with a
minimum of 20–50 samples depending on the complexity of the problem [14].
Data analysis. The spectral data were analyzed using PLS regression with various
preprocessing techniques. In this study three spectral preprocessing methods were
applied comparatively; it includes first derivative, vector normalization and first
derivative plus vector normalization. Vector normalization normalizes a spectrum by
first calculating the average intensity value and subsequent subtraction of this value from
the spectrum. This method is used to account for different samples thickness [15].
Model accuracy. The performance of final PLS model was evaluated in terms of
coefficient of determination (R2) and root mean square error of cross validation
(RMSECV). The accuracy of the validation models is obtained according to the highest
values of R2 and RPD and lowest RMSECV.
2
Re sidualSSE (1)
where:
Residual [-] - experimental value-Predicted value

Pandiselvam i sar.: Razvoj multivarijantnog . . . / Polj. Tehn. (2016/2). 61 - 70 64
The coefficient of determination (R2) gives the proportion of variability of the
property that is described by the model.
10012
2
mi yy
SSER
(2)
where:
yi = iih
[-] - observation of experimental value,
ym [-] - mean of the reference results for all samples.
n
yyRMSECV
n
i ii
1
2
(3)
where:
n [-] - number of samples in the validation set
yi , iy [-] - measured and predicted value of the i
th observation in the test set.
The number of PLS factors included in the model is chosen according to the lowest
RMSECV.
RESULTS AND DISCUSSION
Distribution of data sets. The 222 samples of green gram that comprised the dataset
under study had an average composition of 22.18% of protein, 1.30% of fat and 50.72%
of carbohydrate. The protein content in the dataset ranged from 20.5 to 23.4%, the fat
from 1.16 to 1.48% and carbohydrate from 45.1 to 55.5%. The samples can be split into
three groups according to their protein content. The group with high protein content
included 98 samples and had an average protein content of 22.8%, ranging from 22.4 to
23.4%; the intermediate protein content group included 104 samples and had an average
protein content of 21.8%, ranging from 21.2 to 22.3% and the group with lower protein
content included 20 samples and had an average protein content of 21%, ranging from
20.5 to 21.1%. The uneven distribution of the data leads to better prediction by the
model and can be used for wide range of samples [16].
Spectra analyzes. Fig. 1 shows the FT-NIR spectra of green gram samples which
have major peaks at absorbance units (wave numbers) of 4721.1, 5168.5, 5662.2, 6780.8,
8346.8 and 10028.6 cm-1
. The peak and depression in the spectra showed the strong and
weak absorbance characteristics of green gram within the region of study. Almost
spectra of all samples are parallel (Fig. 1), which means the response of the detector for
the sample is linear within the range of study and thus may give better results [17].
Major peaks at wave numbers of 4721.1 and 5168.5 cm-1
may be due to the
stretching vibrations of NH and 2×C=O (esters) bonds of protein. Peaks at 5662.2 and
6780.8 cm-1
may be due to first overtone of -CH and ArNH2 bonds of amine (NH2)
groups. Peaks at 8346.8 and 10028.6 cm-1
may be due to second overtone of symmetric
stretching of –CH3 bonds of methyl groups and second overtone of ArNH2 bonds of
amine (NH2) groups. The vibration of the NH, -CH, ArNH2 and –CH3 molecules are
caused by ingredients such as protein, fat and carbohydrate.
The NIR region contains several bands that often overlap, making it difficult to
extract spectral parameters of the individual bands [13]. Multivariate analysis with
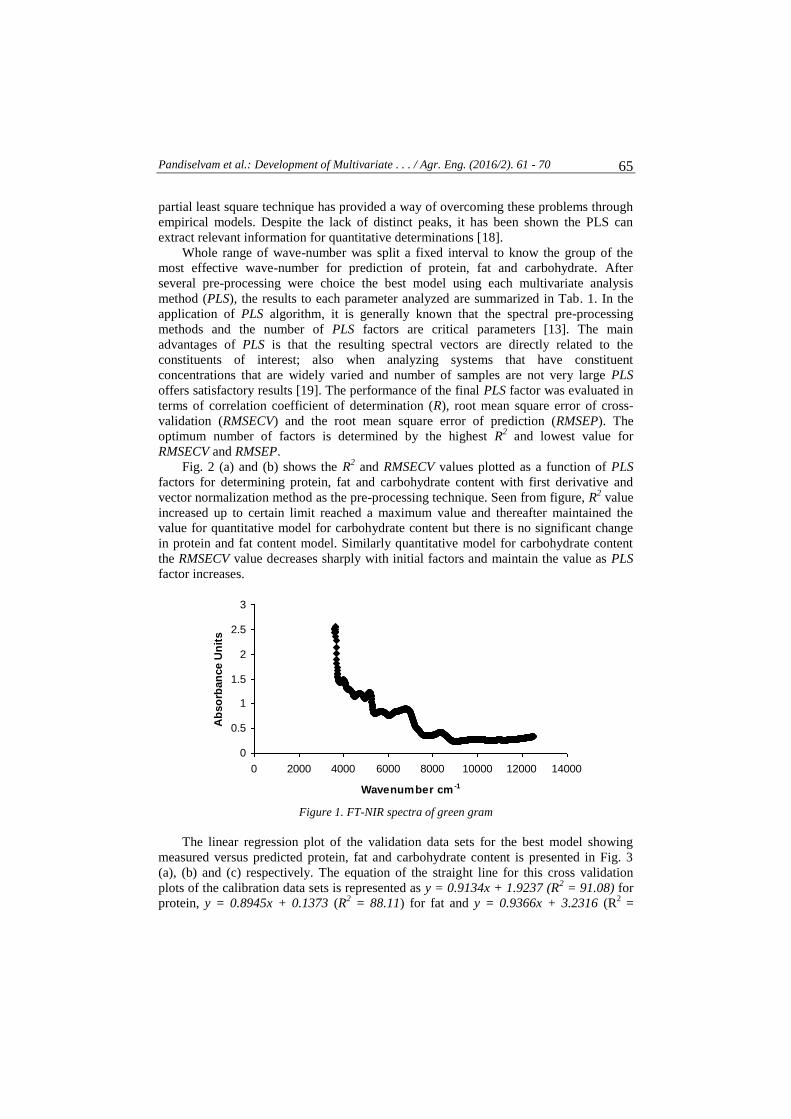
Pandiselvam et al.: Development of Multivariate . . . / Agr. Eng. (2016/2). 61 - 70 65
partial least square technique has provided a way of overcoming these problems through
empirical models. Despite the lack of distinct peaks, it has been shown the PLS can
extract relevant information for quantitative determinations [18].
Whole range of wave-number was split a fixed interval to know the group of the
most effective wave-number for prediction of protein, fat and carbohydrate. After
several pre-processing were choice the best model using each multivariate analysis
method (PLS), the results to each parameter analyzed are summarized in Tab. 1. In the
application of PLS algorithm, it is generally known that the spectral pre-processing
methods and the number of PLS factors are critical parameters [13]. The main
advantages of PLS is that the resulting spectral vectors are directly related to the
constituents of interest; also when analyzing systems that have constituent
concentrations that are widely varied and number of samples are not very large PLS
offers satisfactory results [19]. The performance of the final PLS factor was evaluated in
terms of correlation coefficient of determination (R), root mean square error of cross-
validation (RMSECV) and the root mean square error of prediction (RMSEP). The
optimum number of factors is determined by the highest R2 and lowest value for
RMSECV and RMSEP.
Fig. 2 (a) and (b) shows the R2 and RMSECV values plotted as a function of PLS
factors for determining protein, fat and carbohydrate content with first derivative and
vector normalization method as the pre-processing technique. Seen from figure, R2 value
increased up to certain limit reached a maximum value and thereafter maintained the
value for quantitative model for carbohydrate content but there is no significant change
in protein and fat content model. Similarly quantitative model for carbohydrate content
the RMSECV value decreases sharply with initial factors and maintain the value as PLS
factor increases.
0
0.5
1
1.5
2
2.5
3
0 2000 4000 6000 8000 10000 12000 14000
Wavenumber cm -1
Ab
so
rban
ce U
nit
s
Figure 1. FT-NIR spectra of green gram
The linear regression plot of the validation data sets for the best model showing
measured versus predicted protein, fat and carbohydrate content is presented in Fig. 3
(a), (b) and (c) respectively. The equation of the straight line for this cross validation
plots of the calibration data sets is represented as y = 0.9134x + 1.9237 (R2 = 91.08) for
protein, y = 0.8945x + 0.1373 (R2 = 88.11) for fat and y = 0.9366x + 3.2316 (R
2 =

Pandiselvam i sar.: Razvoj multivarijantnog . . . / Polj. Tehn. (2016/2). 61 - 70 66
93.18) for carbohydrate showing good performance by this model in predicting protein,
fat and carbohydrate content of the green gram samples. The best model was selected
based on high value of correlation coefficient and low RMSECV values (Tab. 1). The
offset and the slope for the equation of the regression line for this set were 1.916 and
0.914, 0.137 and 0.895, 3.234 and 0.937 for protein, fat and carbohydrate respectively.
The results of this study clearly demonstrated the efficiency of FT-NIR for this
application.
(a)
0
20
40
60
80
100
0 2 4 6 8 10 12
PLS factor
Co
eff
icie
nt
of
dete
rmin
ati
on
(R
2)
Carbohydrate Protein Fat
(b)
0
0.5
1
1.5
2
2.5
3
3.5
0 2 4 6 8 10 12
PLS factor
RM
SE
CV
Carbohydrate Fat Protein
Figure 2. Effects of number of PLS factors on
R2 (a) and RMSECV (b) for the validation model
Table 1. R2, RMSECV and RMSEP values corresponding to PLS factor for determining protein,
fat and carbohydrate content with different spectral pre-processing methods
Protein
Pre-processing
technique
PLS
factors
R2
(Validation) RMSECV
R2
(Calibration) RMSEP
No pre-processing 7 91.24 0.350 92.34 0.185

Pandiselvam et al.: Development of Multivariate . . . / Agr. Eng. (2016/2). 61 - 70 67
Vector normalization 3 90.54 0.202 91.21 0.196
First derivative 5 91.52 0.191 92.46 0.183
First derivative plus Vector
normalization 3 91.01 0.196 91.72 0.191
Fat
Pre-processing
technique
PLS
factors
R2
(Validation) RMSECV
R2
(Calibration) RMSEP
No pre-processing 7 86.88 0.029 88.23 0.028
Vector normalization 8 87.85 0.0279 89.95 0.0259
First derivative 9 88.54 0.0271 91.06 0.0245
First derivative plus Vector
normalization 8 88.09 0.0276 90.54 0.0251
Carbohydrate
Pre-processing
technique
PLS
factors
R2
(Validation) RMSECV
R2
(Calibration) RMSEP
No pre-processing 6 93.29 0.785 94.27 0.737
Vector normalization 7 93.62 0.765 94.18 0.745
First derivative 6 93.37 0.780 94.09 0.749
First derivative plus Vector
normalization 5 93.47 0.774 93.96 0.755
(a)
20.5
21
21.5
22
22.5
23
23.5
20 20.5 21 21.5 22 22.5 23 23.5 24
True value
Pre
dic
ted
valu
e
(b)
1
1.1
1.2
1.3
1.4
1.5
1 1.1 1.2 1.3 1.4 1.5 1.6
True value
Pre
dic
ted
valu
e

Pandiselvam i sar.: Razvoj multivarijantnog . . . / Polj. Tehn. (2016/2). 61 - 70 68
(c)
40
42
44
46
48
50
52
54
56
40 45 50 55 60
True value
Pre
dic
ted
valu
e
Figure 3. Scatter plot of the experimental Vs NIR predicted protein (a),
fat (b) and carbohydrate (c) content of the validation data set
CONCLUSIONS
A rapid and simple FT-NIR procedure to estimate protein, fat and carbohydrate
content in green gram was developed using a calibration model. The model was
developed using the spectral region 3600 – 12800 cm-1
. Lower values of RMSECV and
relatively higher values of R2 showed that NIR spectroscopy has potential to predict the
quality of green gram nondestructively with almost same accuracy as that of laboratory
method. The results presented in this work show that FT-NIR can be used as quick,
simple, specific and easy automatic tool to predict the content of protein, fat and
carbohydrate in green gram samples. It might be an application for green gram quality
monitoring in the grain processing industry and various green gram research stations
using FT-NIR spectroscopy.
BIBLIOGRAPHY
[1] Pandiselvam, R., Thirupathi, V. 2015. Reaction kinetics of Ozone gas in Green gram (Vigna
radiate). Ozone: Science & Engineering, 37, 1-7.
[2] Ravi, P., Venkatachalam, T. 2014. Important engineering properties of paddy. Poljoprivredna
tehnika, 39(4), 73-83.
[3] Pandiselvam, R., Kailappan, R., Pragalyaashree, M. M., Smith, D. 2013. Frictional,
Mechanical and Aerodynamic Properties of Onion Seeds. In International Journal of
Engineering Research and Technology (ESRSA Publications), 2(10), 2647-2657.
[4] Pandiselvam, R., Thirupathi, V., Mohan, S. 2015. Engineering properties of rice.
Poljoprivredna tehnika, 40(3), pp.69-78.
[5] Vesela, A., Antonio, S., Barrosb, A., Synytsyaa, I., Delgadillob, J., Copikova, M.A.,
Coimbrab. 2007. Infrared spectroscopy and outer product analysis for quantification of fat,
nitrogen, and moisture of cocoa powder, Analytica chimica acta, 601, 77–86.
Pandiselvam et al.: Development of Multivariate . . . / Agr. Eng. (2016/2). 61 - 70 69
[6] Masoum, S., Alishahi, A., Farahmand, H., shekarchi, M., Prieto, N. 2012. Determination of
Protein and Moisture in Fishmeal by Near-Infrared Reflectance Spectroscopy and
Multivariate Regression Based on Partial Least Squares, Iran. J. Chem. Chem. Eng., 31(3),
51-59.
[7] Gomez, A.H., He, Y., Pereira, A.G. 2006. Non-destructive measurement of acidity, soluble
solids and firmness of Satsuma mandarin using Vis/NIR-spectroscopy techniques. J. of Food
Eng., 77, 313–319.
[8] Official Methods of Analysis. 2002. Association of Official Analytical Che., Washington DC,
USA.
[9] Pandiselvam, R., Pragalyaashree, M.M., Kailappan, R., Thirupathi, V., Krishnakumar, P.
2014. Moisture Dependent Engineering Properties of Onion Seeds, Journal of Agricultural
Engineering, 51 (2), 36-43.
[10] Cohen, E. H. 1917. Association of Official Analytical Chemists, 54, 212.
[11] Onyeike, E.N., Olungwe, T., Uwakwe, A.A. 1995. Effect of heat treatment and defatting on
the proximate composition of some Nigerian local soup thickeners, Food Che., 53, 173-175.
[12] Tripathi, S., Patel, K.G., Bafna, A.M. 2010. Nondestructive determination of curcuminoids
from turmeric powder using FT-NIR, J. Food Science Tec., 47(6), 678–681.
[13] Sinija, V.R., Mishra, H.N. 2009. FT-NIR spectroscopy for caffeine estimation in instant green
tea powder and granules, LWT - Food Science and Tec., 42, 998–1002.
[14] Chen, C., Cai, W., Shao, X. 2007. An Adaptive for selecting representative calibration
samples in the continuous wavelet domain for near-infrared spectral analysis, Analytical and
Bio analytical Che., 387, 1041–1048.
[15] Ravi, P., Venkatachalam, T., Palanisamy, V. 2014. Fourier transform near-infrared
spectroscopy for nondestructive and rapid measurement of moisture content of
paddy. Poljoprivredna tehnika, 39(3), 31-40.
[16] Tripathi, S., Mishra, H.N. 2009. Rapid FT-NIR method for estimation of aflatoxin B1 in red
chili powder, Food Control, 20, 840–846.
[17] Jha, S. N. 2007. Nondestructive Determination of Sweetness of Orange Juice using Portable
Near Infrared Spectroscopy, J. of Agricultural Eng., 44(3), 10-14.
[18] Mcshane, M. J., Cote, G. L. 1998. Near-infrared spectroscopy for determination of glucose
lactate, and ammonia in cell culture media, Applied Spectroscopy, 52, 1073–1078.
[19] Cramer, R. D. 1993. Partial least squares (PLS): Its strengths and limitations”, Perspectives in
Drug Discovery and Design, 1(2), 269–278.
[20] Ravi, P., Venkatachalam, T., Rajamani, M. 2015. Decay Rate Kinetics of Ozone Gas in Rice
Grains. Ozone: Science & Engineering, 37(5), pp.450-455.
[21] Pandiselvam, R., Thirupathi, V., Anandakumar, S. 2015. Reaction Kinetics of Ozone Gas in
Paddy Grains. Journal of Food Process Engineering, 38(6), pp.594-600.
Pandiselvam i sar.: Razvoj multivarijantnog . . . / Polj. Tehn. (2016/2). 61 - 70 70
RAZVOJ MULTIVARIJANTNOG MODELA REGRESIJE ZA
APROKSIMATIVNU PROCENU SADRŽAJA VIGNA RADIATA
KORIŠĆENJEM FURIJEOVE TRANSFORMACIJE – NIR SPEKTROSKOPIJE
Ravi Pandiselvam1, Shajahan Sunoj
1, Doraiswamy Uma
3
1ICAR –Centralni institut za istraživanje plantažnih kultura,
Odsek za fiziologiju, biohemiju i postžetvenu tehnologiju, Kerala, India 2Državni univerzitet Severne Dakote,
Institut za poljoprivrednu tehniku i biosisteme, Fargo, ND-58102, USA 3 Poljoprivredni univerzitet Tamil Nadu,
Institut za biohemiju, Coimbatore. India
Sažetak: Furijeova transformacija blizu infracrvenog (FT-NIR) absorbovanog
spektra (12800-3600 cm-1
) kod 222 uzorka zelenog pasulja korišćena je da se izrade
kalibracioni modeli za određivanje sadržaja proteina, masti i ugljenih hidrata. Uzorci
koji su činili skup podataka imali su srednji sadržaj od 22.18% proteina, 1.30% masti i
50.72% ugljenih hidrata. Multivarijantnom regresijom su razvijeni kvantitativni modeli
proteina, masti i ugljenih hidrata. Srednje kvadratno odstupanje unakrsne procene
(RMSECV) bilo je 0.191 (R2 = 91.52) za proteine, 0.0271 (R
2 = 88.54) za masti i 0.765
(R2 = 93.62) za ugljene hidrate. Tako je razvijen brz, jednostavan i precizan metod za
kvantitativnu procenu sastava zelenog pasulja upotrebom FT-NIR spektroskopiju.
Rezultati su pokazali da FT-NIR spektroskopija može da podrži metode hemijske
analize.
Ključne reči: FT-NIR spektroskopija, zeleno zrno, protein, pasulj, prvi derivat,
kalibracija
Prijavljen:
Submitted: 04.09.2015.
Ispravljen:
Revised:
Prihvaćen:
Accepted: 11.04.2016.

Univerzitet u Beogradu Poljoprivredni fakultet Institut za poljoprivrednu tehniku
Naučni časopis POLJOPRIVREDNA TEHNIKA
Godina XLI Broj 2, 2016. Strane: 71 – 80
University of Belgrade Faculty of Agriculture
Institute of Agricultural Engineering
Scientific Journal AGRICULTURAL ENGINEERING
Year XLI No. 2, 2016. pp: 71 – 80
UDK: 635.21 Originalni naučni rad
Original scientific paper
DESIGN AND DEVELOPMENT OF PULVERIZING
ATTACHMENT TO CULTIVATOR
Raghuvirsinh Pravinsinh Parmar*, Ram Avtar Gupta
Junagadh Agricultural University, Department of Farm Machinery and Power,
Junagadh, India
Abstract: In tillage, active and passive tillage tools used in India faces problem like,
poor soil-tire interface, clod formation, compaction due to heavy traffic and timeliness in
operation. Hence, it was planned to fabricate a pulverizing attachment to cultivator and
to study its performance. Major components of machine developed are frame, cultivator
tines, pulverizing roller attachment, power transmission system and protecting cover. A
frame is for holding different components. Cultivator tines were hold with help of
adjustable clamps which are mounted on frame. Behind cultivator tine PTO operated
pulverizing roller was attached which is operated at 225 min-1
. The average field
efficiency, fuel consumption and cost of operation was 78.89%, 12.94 l·ha-1
and 2157.42
Rs·ha-1
respectively.
Key words: combination tillage tool, performance, active-passive tillage tool, design
INTRODUCTION
Tillage is the mechanical manipulation of the soil and plant residue to prepare a
seedbed where seeds are planted to produce grain for our consumption. Also tillage
breaks soil, enhances the release of soil nutrients for crop growth, destroys weeds and
enhances the circulation of water and air within the soil [6]. Nearly all tillage tools
utilize passive tillage elements in India. A draft force is applied to the tool, which causes
the elements to move through the soil. The power required is developed by the tractor
engine and is transmitted through the soil-tire interface and the tractor drawbar. Because
of the poor efficiency of power transmission at the soil-tire interface, tillage energy
* Corresponding author. E-mail: [email protected]

Parmar i Gupta: Konstrukcija i razvoj . . . / Polj. Tehn. (2016/2). 71 - 80 72
efficiencies are low. Also, because tractors require considerable weight to provide
necessary traction, soil compaction may occur and increased power is required to
overcome the wheel slip and rolling resistance of the tractor tires. According to the
previous researches, about 60% of total energy required for preparing the soil is used for
tillage and preparing a good seedbed. In addition, the high cost of energy, makes the
farmers to find alternative economic tillage methods [1].
There is way to bypass the inefficient soil-tire interface is through active powered
tillage elements. These active elements are usually powered by the tractor PTO drive.
Due to repeated use of primary, secondary and active tillage implements soil layers
become compacted. Machines for tillage operation usually pass the farm four times or
more which causes soil compaction, increases cost of labor and energy [2]. Tillage
implements works on the basis of two working motion sliding type and rotating type.
The implements like M.B. plough, cultivator cut the soil by sliding action. Disc plough,
disc harrow, rotavator, clod crusher or roller cut and pulverize the soil by working in
rotary action. Clod formation subsequent to ploughing or disking is a major problem in
arid and semi-arid zones of India. Clods create obstruction to penetration of furrow
openers of seed drill and do not allow intimate contact between seeds and soil.
Pulverization of clods is necessary to avoid the above problems.
However, the combination of implements that enables the task to be completed in
the shortest time with minimum operating cost and energy requirement is usually
selected. Among these types of implements, sliding type implements consume more
draft than rotating type implements due to soil frictional force and contact area of
implement. While the rotary type of implements produce negative draft. That’s why the
idea behind the combining these sliding and rotary type implements saves more power,
time, cost very efficiently.
A few researchers have also conducted studies on development and performance
evaluation of 2WD tractor drawn active–passive combination tillage implements have
also been conducted in India and confirmed the same results as obtained in western
countries. The combination tillage tool mounted on a tractor does the primary and
secondary tillage operations simultaneously in a single pass and added that combination
tillage tool reduced bigger size clods in the soil and improves aeration and moisture
holding capacity and medium uniformity of soil and finer pulverization modulus
obtained by using combination tillage. And also added that maximum loosening of the
soil was obtained by the combination tool as reflected by the low soil bulk density range
of 1.15±0.05 g·cm-3
as against the normal 1.4±0.20 g·cm-3
encountered in the
conventional implements operated field. Savings of 44 to 55 per cent in cost and 50 to
55% in time are possible by the use of combination tillage tool for seed bed preparation
[4]. Using cultivator with spiked tooth roller the soil parameters measured in the range of
12 to14 mm, 1.21 to 1.36 g/cc and 0.568 to 1.5 kg·cm-2
in case of clod MWD, dry bulk
density, and clod index of soil respectively [5].
MATERIAL AND METHODS
Conceptual design of pulverizing attachment to cultivator. A pulverizing attachment
to cultivator was designed and developed to combine primary and secondary tillage
operations in single pass to ensure timeliness in seed bed preparation. The pulverizing

Parmar and Gupta: Design and Development . . . / Agr. Eng. (2016/2). 71 - 80 73
attachment to cultivator consist of a frame with cultivator tines, pulverizing attachment
having helical blade, power transmission system to provides power to pulverizing
attachment, framework to mount roller and three-point linkage unit. The working
principle behind the pulverizing attachment to cultivator which is having pulverizing
roller as active unit behind implement and in front cultivator tines are attached as passive
unit. Cultivator tines open furrow and in the rear PTO operated roller cut and pulverize
the soil at optimum condition for tillage.
Design considerations: The components of pulverizing attachment to cultivator
were designed and fabricated based on the parameters like functional requirements,
engineering and general considerations. The assumptions made in the design of
pulverizing attachment to cultivator are as follow [3]:
1. No draft was included for pulverizing attachment because it is rotating unit and
has negative draft.
2. Speed of Power Take Off shaft was taken as 540±10 min-1
.
3. Average speed of operation of tractor in the field was kept as 3 km·h-1
.
4. Maximum soil resistance was considered as 0.75 kg·cm-2
.
5. A seven tine cultivator having spacing 20 cm and working depth 15 cm was
considered.
6. Coefficient of friction in un-ploughed soil was taken 0.85.
Assessment of draft and power requirement. The draft requirement of the tractor
operated pulverizing attachment to cultivator would be estimated using factors related to
implement and the type of soil. The specific soil resistance of medium black soil of the
area was considered as 0.75 kg·cm-2
.
Total working width of cultivator = No. of tine × tine spacing = 7 × 20 = 140cm = 1.4m
Cross section area of 7 furrows = 140 × 15 = 2100 cm2
Maximum draft = 2100 × 0.75 = 1575 kg
Speed of travel = 3 km·h-1
= 3000 m·h-1
=0.833 m·s-1
The power required for the designed draft was estimated using following formula.
1000
SDP
(1)
where:
P [kW] - power required,
D [N] - maximum draft,
S [m·s-1
] - forward speed.
P = (1575 × 9.8 × 0.833)/1000 = 12.857 kW = 17.24 HP
Horse power required to operate the implement in un-ploughed soil;
= (Total power required)/ (Coefficient of friction)
= 17.24/0.85 = 20.28 HP
(2)
Hence, this implement can easily be hitched and operated by most of the Indian
makes tractors of 35 HP capacity.
Design of functional components of pulverizing attachment to cultivator. The
detailed design of the functional components and different mechanisms were carried out.
The machine consists of frame, cultivator tines, pulverizing roller and power
transmission system. The design of (1) Helical blade of pulverizing roller (2) Bevel gear
mechanism (3) Chain sprocket mechanism was taken up:

Parmar i Gupta: Konstrukcija i razvoj . . . / Polj. Tehn. (2016/2). 71 - 80 74
1. Design of helical blade: The pulverizing members which are helical blades were
fabricated similarly to lawn mower blades and are inserted in disc at 900 with tangent in
such a way that it forms helical shape and progressively come in contact with soil. Five
numbers of helical blades were fabricated and designed as follows [3].
Total area of helical blade striking on soil = Inclined length × thickness
= 135 cm × 0.5 cm = 67.5 cm2
The maximum soil resistance = 67.5cm2 × 0.75 kg/cm
2 = 50.625 kg
Maximum bending moment in the blade,
Mb = Soil resistance × radial distance = 50.625 kg × 22.5 cm = 1139.0625 kg-cm
Maximum bending stress for mild steel is 700 MPa. Calculating actual bending
stress as per following formula [3].
)(I
yM bb
(3)
700 = (1139.0625 ×12 × w × 2) / (2 ×0.5 × w3)
W = 6.395 cm ≈ 64 mm
Hence design is safe. Selecting 75 mm width and 1350 mm length and 5 mm thick
for helical blade.
2. Bevel gear mechanism: The power was transmitted to shaft through bevel gear
mechanism. The size selection of bevel gear was carried out using standard formula.
T
T
N
N
1
2
2
1
(4)
where:
N1 [min-1
] - No. of revolution of driving wheel (540),
N2 [min-1
] - No. of revolution of driven wheel,
T1 [-] - No. of teeth on driving sprocket (10),
T2 [-] - No. of teeth on driven Sprocket (18).
Substituting the values as above the number of revolution of driven wheel comes out
as:
N2 = 540×10/18 = 300 min-1
To get required number of min-1
standard bevel gears of 10 and 18 teeth were used.
3. Chain and sprocket mechanism: The power was transmitted to shafts of pulverizing
roller through chain and sprocket mechanism. The selection of size was carried out using
standard formula. Dimension of the chain i.e. thickness, width and length of chain were
25, 38.1 and 3500 mm respectively.
T
T
N
N
1
2
2
1
(5)
N2 = (300x15)/20 so, N2= 225 min-1
Standard sprockets of 15 and 20 teeth were used.
Fabrication of pulverizing attachment to cultivator. Ease of assembling and
dismantling for repairs and inspection were duly considered. Major components of
machine developed are as follow:
- Frame: The frame is meant for holding different components of pulverizing
attachment to cultivator. It is subjected to bending, tension, and vibrations. The frame
was fabricated using double L section having size 65 mm × 65 mm × 6 mm for
accommodating cultivator tines as well as power transmission system and cultivator
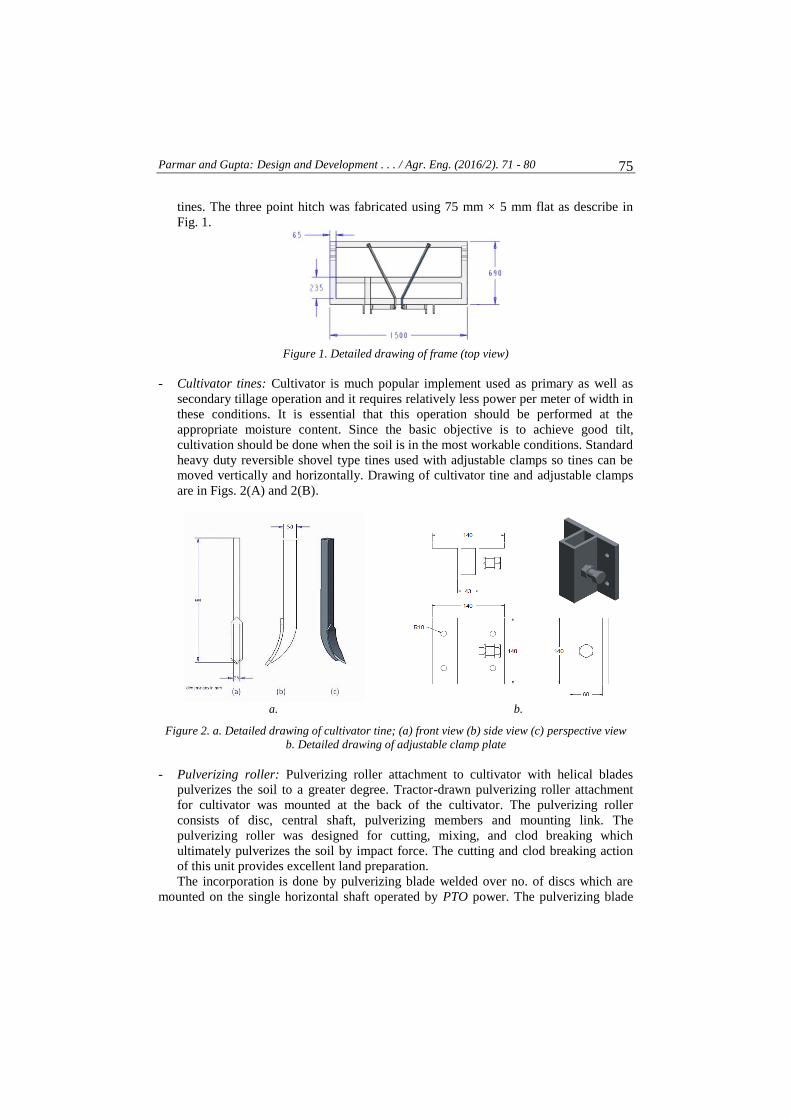
Parmar and Gupta: Design and Development . . . / Agr. Eng. (2016/2). 71 - 80 75
tines. The three point hitch was fabricated using 75 mm × 5 mm flat as describe in
Fig. 1.
Figure 1. Detailed drawing of frame (top view)
- Cultivator tines: Cultivator is much popular implement used as primary as well as
secondary tillage operation and it requires relatively less power per meter of width in
these conditions. It is essential that this operation should be performed at the
appropriate moisture content. Since the basic objective is to achieve good tilt,
cultivation should be done when the soil is in the most workable conditions. Standard
heavy duty reversible shovel type tines used with adjustable clamps so tines can be
moved vertically and horizontally. Drawing of cultivator tine and adjustable clamps
are in Figs. 2(A) and 2(B).
a. b.
Figure 2. a. Detailed drawing of cultivator tine; (a) front view (b) side view (c) perspective view
b. Detailed drawing of adjustable clamp plate
- Pulverizing roller: Pulverizing roller attachment to cultivator with helical blades
pulverizes the soil to a greater degree. Tractor-drawn pulverizing roller attachment
for cultivator was mounted at the back of the cultivator. The pulverizing roller
consists of disc, central shaft, pulverizing members and mounting link. The
pulverizing roller was designed for cutting, mixing, and clod breaking which
ultimately pulverizes the soil by impact force. The cutting and clod breaking action
of this unit provides excellent land preparation.
The incorporation is done by pulverizing blade welded over no. of discs which are
mounted on the single horizontal shaft operated by PTO power. The pulverizing blade

Parmar i Gupta: Konstrukcija i razvoj . . . / Polj. Tehn. (2016/2). 71 - 80 76
run in helix pattern from one disc to another in such a way that not more than one
portion of a particular blade is in contact with ground at a time. Hence medium speed
was usually selected as it is adequate for both the wet or dry soil conditions. Based on
review collected, speed of the roller was selected as 225 min-1
. Design of pulverizing
roller is shown in Fig. 3.
Figure 3. Detailed front view drawing of pulverizing roller
- Power transmission system: Power transmitted from PTO to Hub which is having 1:
1.8 bevel gear ratio. So that shaft-I transmits 540 min-1
to shaft-II at 300 min-1
. Shaft-
II is connected to chain and sprocket transmission system which transmits 225 min-1
at 1:1.33 velocity ratios of sprockets. Following are design specifications of whole
power transmission unit. As a general principle fine tilts are produced by a
combination of slow tractor speeds, fast rotor speeds. Schematic diagram of power
transmission is shown in Fig. 4.
Figure 4. Schematic diagram of power transmission system
Experimental procedure: As such there was no standard test code for rotary
implement testing i.e. rotavator and developed pulverizing attachment to cultivator
which is having pulverizing roller, all laboratory and field tests were carried out
indirectly as per the recommendation of the Regional Network for Agricultural
Machinery (RNAM, 1983) and other related test code.
The instruments and equipment used for the field test were tractor, measuring tape,
developed pulverizing attachment to cultivator, digital dynamometer, stop watch, etc.
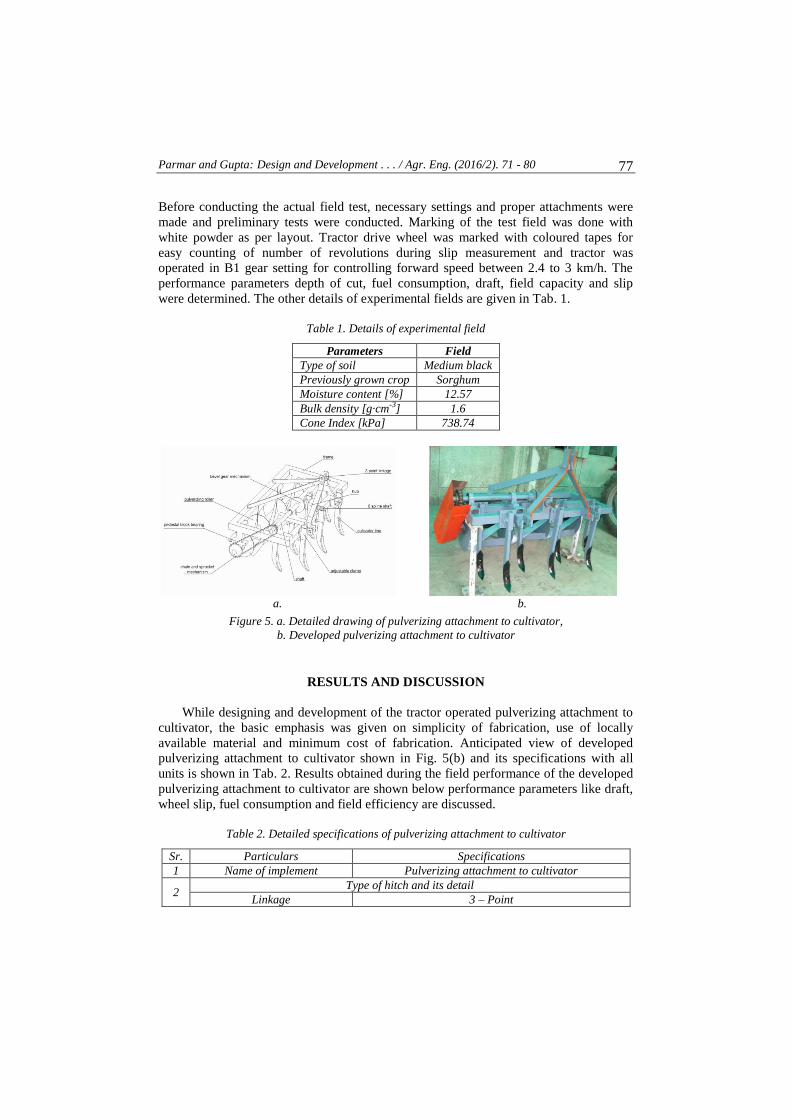
Parmar and Gupta: Design and Development . . . / Agr. Eng. (2016/2). 71 - 80 77
Before conducting the actual field test, necessary settings and proper attachments were
made and preliminary tests were conducted. Marking of the test field was done with
white powder as per layout. Tractor drive wheel was marked with coloured tapes for
easy counting of number of revolutions during slip measurement and tractor was
operated in B1 gear setting for controlling forward speed between 2.4 to 3 km/h. The
performance parameters depth of cut, fuel consumption, draft, field capacity and slip
were determined. The other details of experimental fields are given in Tab. 1.
Table 1. Details of experimental field
Parameters Field
Type of soil Medium black
Previously grown crop Sorghum
Moisture content [%] 12.57
Bulk density [g·cm-3] 1.6
Cone Index [kPa] 738.74
a. b.
Figure 5. a. Detailed drawing of pulverizing attachment to cultivator,
b. Developed pulverizing attachment to cultivator
RESULTS AND DISCUSSION
While designing and development of the tractor operated pulverizing attachment to
cultivator, the basic emphasis was given on simplicity of fabrication, use of locally
available material and minimum cost of fabrication. Anticipated view of developed
pulverizing attachment to cultivator shown in Fig. 5(b) and its specifications with all
units is shown in Tab. 2. Results obtained during the field performance of the developed
pulverizing attachment to cultivator are shown below performance parameters like draft,
wheel slip, fuel consumption and field efficiency are discussed.
Table 2. Detailed specifications of pulverizing attachment to cultivator
Sr. Particulars Specifications
1 Name of implement Pulverizing attachment to cultivator
2 Type of hitch and its detail
Linkage 3 – Point
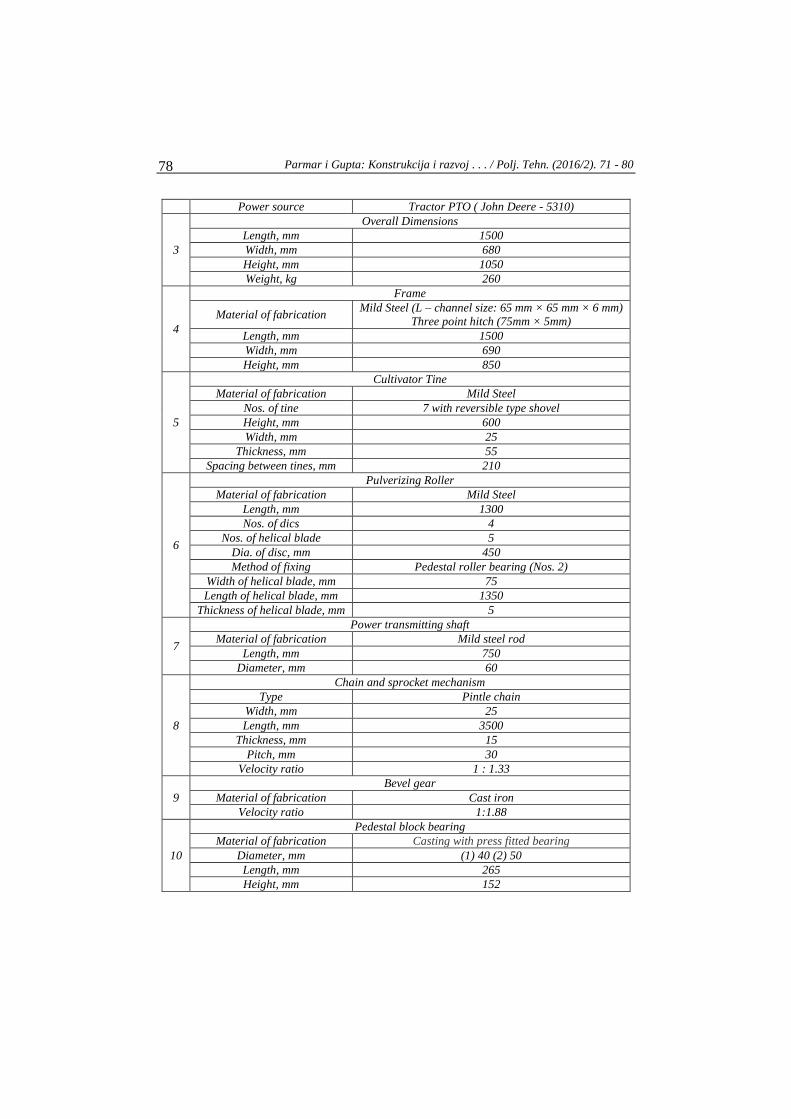
Parmar i Gupta: Konstrukcija i razvoj . . . / Polj. Tehn. (2016/2). 71 - 80 78
Power source Tractor PTO ( John Deere - 5310)
3
Overall Dimensions
Length, mm 1500
Width, mm 680
Height, mm 1050
Weight, kg 260
4
Frame
Material of fabrication Mild Steel (L – channel size: 65 mm × 65 mm × 6 mm)
Three point hitch (75mm × 5mm)
Length, mm 1500
Width, mm 690
Height, mm 850
5
Cultivator Tine
Material of fabrication Mild Steel
Nos. of tine 7 with reversible type shovel
Height, mm 600
Width, mm 25
Thickness, mm 55
Spacing between tines, mm 210
6
Pulverizing Roller
Material of fabrication Mild Steel
Length, mm 1300
Nos. of dics 4
Nos. of helical blade 5
Dia. of disc, mm 450
Method of fixing Pedestal roller bearing (Nos. 2)
Width of helical blade, mm 75
Length of helical blade, mm 1350
Thickness of helical blade, mm 5
7
Power transmitting shaft
Material of fabrication Mild steel rod
Length, mm 750
Diameter, mm 60
8
Chain and sprocket mechanism
Type Pintle chain
Width, mm 25
Length, mm 3500
Thickness, mm 15
Pitch, mm 30
Velocity ratio 1 : 1.33
9
Bevel gear
Material of fabrication Cast iron
Velocity ratio 1:1.88
10
Pedestal block bearing
Material of fabrication Casting with press fitted bearing
Diameter, mm (1) 40 (2) 50
Length, mm 265
Height, mm 152
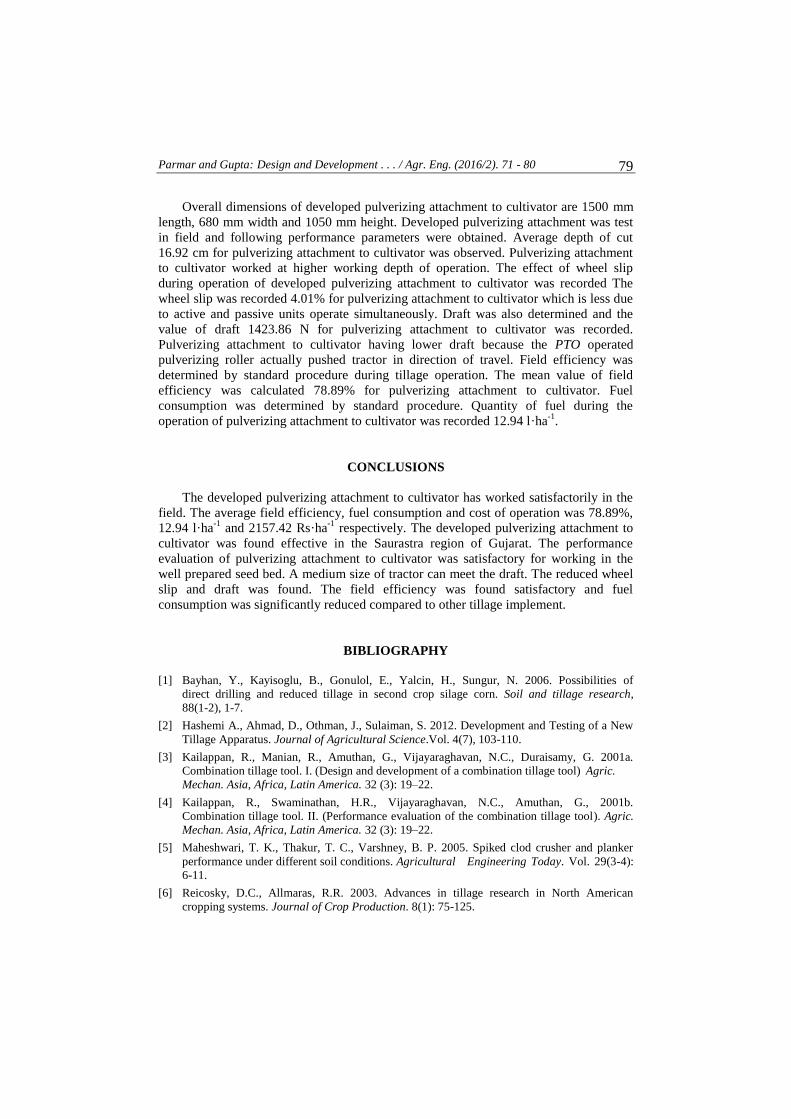
Parmar and Gupta: Design and Development . . . / Agr. Eng. (2016/2). 71 - 80 79
Overall dimensions of developed pulverizing attachment to cultivator are 1500 mm
length, 680 mm width and 1050 mm height. Developed pulverizing attachment was test
in field and following performance parameters were obtained. Average depth of cut
16.92 cm for pulverizing attachment to cultivator was observed. Pulverizing attachment
to cultivator worked at higher working depth of operation. The effect of wheel slip
during operation of developed pulverizing attachment to cultivator was recorded The
wheel slip was recorded 4.01% for pulverizing attachment to cultivator which is less due
to active and passive units operate simultaneously. Draft was also determined and the
value of draft 1423.86 N for pulverizing attachment to cultivator was recorded.
Pulverizing attachment to cultivator having lower draft because the PTO operated
pulverizing roller actually pushed tractor in direction of travel. Field efficiency was
determined by standard procedure during tillage operation. The mean value of field
efficiency was calculated 78.89% for pulverizing attachment to cultivator. Fuel
consumption was determined by standard procedure. Quantity of fuel during the
operation of pulverizing attachment to cultivator was recorded 12.94 l·ha-1
.
CONCLUSIONS
The developed pulverizing attachment to cultivator has worked satisfactorily in the
field. The average field efficiency, fuel consumption and cost of operation was 78.89%,
12.94 l·ha-1
and 2157.42 Rs·ha-1
respectively. The developed pulverizing attachment to
cultivator was found effective in the Saurastra region of Gujarat. The performance
evaluation of pulverizing attachment to cultivator was satisfactory for working in the
well prepared seed bed. A medium size of tractor can meet the draft. The reduced wheel
slip and draft was found. The field efficiency was found satisfactory and fuel
consumption was significantly reduced compared to other tillage implement.
BIBLIOGRAPHY
[1] Bayhan, Y., Kayisoglu, B., Gonulol, E., Yalcin, H., Sungur, N. 2006. Possibilities of
direct drilling and reduced tillage in second crop silage corn. Soil and tillage research,
88(1-2), 1-7.
[2] Hashemi A., Ahmad, D., Othman, J., Sulaiman, S. 2012. Development and Testing of a New
Tillage Apparatus. Journal of Agricultural Science.Vol. 4(7), 103-110.
[3] Kailappan, R., Manian, R., Amuthan, G., Vijayaraghavan, N.C., Duraisamy, G. 2001a.
Combination tillage tool. I. (Design and development of a combination tillage tool) Agric.
Mechan. Asia, Africa, Latin America. 32 (3): 19–22.
[4] Kailappan, R., Swaminathan, H.R., Vijayaraghavan, N.C., Amuthan, G., 2001b.
Combination tillage tool. II. (Performance evaluation of the combination tillage tool). Agric.
Mechan. Asia, Africa, Latin America. 32 (3): 19–22.
[5] Maheshwari, T. K., Thakur, T. C., Varshney, B. P. 2005. Spiked clod crusher and planker
performance under different soil conditions. Agricultural Engineering Today. Vol. 29(3-4):
6-11.
[6] Reicosky, D.C., Allmaras, R.R. 2003. Advances in tillage research in North American
cropping systems. Journal of Crop Production. 8(1): 75-125.

Parmar i Gupta: Konstrukcija i razvoj . . . / Polj. Tehn. (2016/2). 71 - 80 80
KONSTRUKCIJA I RAZVOJ PRIKLJUČKA ZA USITNJAVANJE NA
KULTIVATORU
Raghuvirsinh Pravinsinh Parmar, Ram Avtar Gupta
Poljoprivredni univerzitet Junagadh, Institut za poljoprivredne i pogonske mašine,
Junagadh, India
Sažetak: Pri obradi zemljišta aktivnim i pasivnim oruđima u Indiji postoje problemi
kao što su: slabo trenje podloge i pneumatika, formiranje grudvi, sabijanje zbog kretanja
teških mašina i trajanja operacija. Zato je planirana izrada prikjučka za usitnjavanje na
kultivatoru i ispitivanje njegovih performansi. Glavne komponente mašine su ram,
kultivatorki prsti, valjak za usitnjavanje, sistem prenosa pogona i zaštitna hauba. Ram
nosi sve delove. Prsti su pričvršćeni podesivim sponama na ramu. Iza prstiju je
postavljen valjak za usitnjavanje sa pogonom od PV, koji rotira brzinom od 225 min-1
.
Srednja efikasnost, potrošnja goriva i troškovi rada su iznosili: 78.89%, 12.94 l·ha-1
i
2157.42 Rs·ha-1
, redom.
Ključne reči: oruđe za kombinovanu obradu, performanse, oruđe za aktivnu-
pasivnu obradu, konstrukcija
Prijavljen:
Submitted: 28.09.2015.
Ispravljen:
Revised:
Prihvaćen:
Accepted: 12.05.2016.
Univerzitet u Beogradu Poljoprivredni fakultet Institut za poljoprivrednu tehniku
Naučni časopis POLJOPRIVREDNA TEHNIKA
Godina XLI Broj 2, 2016. Strane: 81 – 92
University of Belgrade Faculty of Agriculture
Institute of Agricultural Engineering
Scientific Journal AGRICULTURAL ENGINEERING
Year XLI No. 2, 2016. pp: 81 – 92
UDK: 636.085 Originalni naučni rad
Original scientific paper
IRRIGATION MANAGEMENT FOR NON-MONSOON CROPS IN A MAJOR CANAL COMMAND IN EASTERN INDIA UNDER
WATER LIMITING ENVIRONMENT
Sanjay K. Raul*1
, Tanaya A. Shinde2, Sudhindra N. Panda
2
1Orissa University of Agriculture and Technology,
Regional Research and Technology Transfer Station, Keonjhar, Odisha, India 2Indian Institute of Technology, Department of Agricultural & Food Engineering,
Kharagpur, West Bengal, India
Abstract: Acute irrigation water deficit during the non-monsoon (rabi) season in the Hirakud canal command in Eastern India demands efficient irrigation management strategies (IMSs) to sustain the irrigated agriculture. The study was undertaken to analyse the impact of different IMSs – namely full and deficit irrigation, on water use efficiency of different rabi crops and evolve the most efficient IMSs. Various water balance parameters were estimated on daily basis and stage wise crop production function was applied to compute the actual crop yields of five major rabi crops. The best IMSs for wheat, maize, rice, green gram and mustard were found to be 30% deficit irrigation at 14 days interval, 30% deficit irrigation at 7 days interval, 20% deficit irrigation at 4 days interval, 60 mm of irrigation per application at 21 days interval, and 20% deficit irrigation at 7 days interval, respectively. Realizing the scarce water resources and ever rising population, it is highly essential to implement the generated IMSs with a view to bring more area under cultivation and enhance the production potential of the command area.
Key words: deficit irrigation, fixed depth application, soil moisture balance, water use efficiency
INTRODUCTION
Rapid environmental alteration has adversely affected the agriculture sector [16] owing to limited water availability. Irrigated agriculture is the largest water user at global level, which consumes nearly 80% of the world's developed water resources [27]. On the other hand, ever-increasing urban and industrial sectors place greater pressures
* Corresponding author. E-mail: [email protected]

Raul i sar.: Upravljanje navodnjavanjem . . . / Polj. Tehn. (2016/2). 81 - 92 82
on agricultural water use. Hence, its effective management through improved irrigation management practices is of topmost importance to the agricultural scientists and researchers. It has been proven that almost 50% potential water saving can be resulted from better irrigation management practices [22].
Agricultural water management needs proper understanding of the crop irrigation scheduling. If water supply is adequate, irrigation can be given at times, to bring the root zone soil moisture to field capacity. However, deficit irrigation (DI) practices need to be followed under water limiting conditions, realizing the critical growth stages of crops. Deficit irrigation practices differ from traditional water supplying practices, on the way of scientifically under-irrigating crops in a controlled way [25,10]. Though under-irrigation results in stress and subsequent reduction in crop yield, still it has greater potential for increasing the water use efficiency (WUE) under water scarce environment [13] as the saved water can be diverted to irrigate other crops, for which amount of water would normally be insufficient under traditional irrigation practices. Deficit irrigation strategy in many crops has frequently proved to be an efficient tool to enhance WUE [20,12,9,24].
Similarly, in a field experiment with different levels of DI it was observed that 30% DI to sweet corn could be a water-saving treatment without a significant decrease in yield. In addition, highest protein content and sugar amount was also observed at the same DI level [11]. In another field experiment on two genotypes of maize it was found that the water deficit stress significantly increased glucose, fructose, and sucrose contents. The highest WUE was found at 50% DI [2]. Deficit irrigation can also be used as a cost-effective tool for attaining water for environmental purposes. Application of non-linear optimization model on DI involving crop production and profit functions achieved environmental flows and maximized net returns [18]. Simulation of an onion crop under optimized regulated DI conditions increased the crop yield by 3–7%, where as the gross margin raised up to 30% compared with an irrigation strategy, where the stress levels remain constant during the whole growth cycle [6]. Application of DI strategies on tomato crop allowed up to 48% of water saving and improved quality of fruits under a semi-arid climate in south Italy [19].
Previous studies have indicated that water-saving irrigation not only contributes to water saving but also to the reduction of greenhouse gas emissions, which can alleviate the negative impact of climate change on agricultural production [28,17]. Growing rice under DI in arsenic contaminated areas of West Bengal, India reduced the arsenic load. Crop water productivity was also reported to be increased by 11% under DI [21]. Now-a-days, use of saline water for irrigation and practicing DI are among the most frequently used methods for overcoming water shortages. However, since both salinity and drought reduce the availability of soil water for crops, yield reduction needs to be predicted accurately [5]. Therefore, before implementing a DI program it is imperative to know the crop yield response to water stress, either during defined growth stages or throughout the growing season.
The canal command of the Hirakud irrigation project, Odisha (eastern India) is one of the major surface irrigation projects and is highly heterogeneous in nature. Hence, irrigation management in such a case is a very complex process. Spatio-temporal variation in water supply has resulted in much lower crop yield as compared to the national average. Rice being the major crop in all the seasons, its diversification to non-rice crops (vz. wheat, maize, pulses, oilseeds, vegetables etc.), specifically during rabi season has, therefore, become necessary for optimal utilization of land and water resources of the command area. It is also inevitable to adopt alternate irrigation

Raul et al.: Irrigation Management . . . / Agr. Eng. (2016/2). 81 - 92 83
management strategies. In this study, a regional daily soil moisture balance model was developed for estimation of crop yield and water requirement with a view to evaluate the net benefit per unit area of each crop under different irrigation management strategies.
MATERIAL AND METHODS
Area description. The Hirakud canal command area lies between latitude 20°53’ to 21°36’ N and longitude 83°25’ to 84°10’ E covering an area of about 2,540 km
2 (Fig. 1).
Topography of the area varies from plain to undulating and comprises mostly terrace lands with average slopes between 1 to 6%. The elevation of the land surface varies from 120 to 180 m above the mean sea level. The soils of the study area have been developed mostly from granite rocks. The command area is characterized by sub-humid climate with extremely hot summer, cold winter and uneven distribution of rainfall. During summer (March-May), day temperature varies from 35 to 45°C and May is the hottest month of the year. In winter (November-February), temperature varies from 10 to 20°C and December is the coldest month of the year. The relative humidity is high (more than 75%) during monsoon (mid June-mid October) and it is rather low (30 to 40%) in summer. The average annual rainfall of the command is around 1200 mm, out of which about 90% is received during monsoon. The southwest monsoon is the principal source of rainfall.
The study region prevails two principal crop seasons, viz. kharif (June to October) and rabi (November to May). Rice is the major crop in both the seasons. It is cultivated in more than 90% of the culturable command area (CCA) during monsoon and during non-monsoon season rice area exceeds 40% of CCA (1,590 km
2). Other crops like wheat,
sugarcane, pulses, millets, oilseeds, vegetables, and condiments etc. are also cultivated in the command area in both the crop seasons.
Irrigation strategies. The applied depth of irrigation may vary between different crops grown on different types of soils and climatic zones. However, this heterogeneity is often not considered and allocation plans are based on a fixed depth of water. When water is scarce, using DI may be beneficial compared to full irrigation [14]. As the degree of deficit for different crops during different growing periods are different, DI results in variable depth of irrigation. Based on these findings, the following three IMSs were considered for obtaining the irrigation management plans. The heterogeneity in the irrigation scheme in terms of soil, crop, system efficiency, irrigation interval and other parameters influencing the water demand is not considered in this strategy.
(1) Full irrigation strategy: Full irrigation is the depth of application needed at the time of irrigation to bring the root zone soil moisture to field capacity. When the irrigation interval is large, full irrigation may still cause stress to the crop and reduce the crop yield. Crop yields were estimated for different irrigation intervals with full irrigation at each event.
(2) Fixed depth irrigation strategy: Fixed depth irrigation is the application of a fixed quantity of water to a crop per irrigation. In this strategy, three different fixed depths (6, 8 and 10 cm) for non-rice crops and three different fixed depths (9, 12 and 15 cm) for rice crop were considered. The effects of those different fixed depths along with different irrigation intervals (7, 14, 21 and 28 days for non-rice crops and 4, 8 and 12 days for rice) on crop yield and WUE were studied by using the concept of daily soil
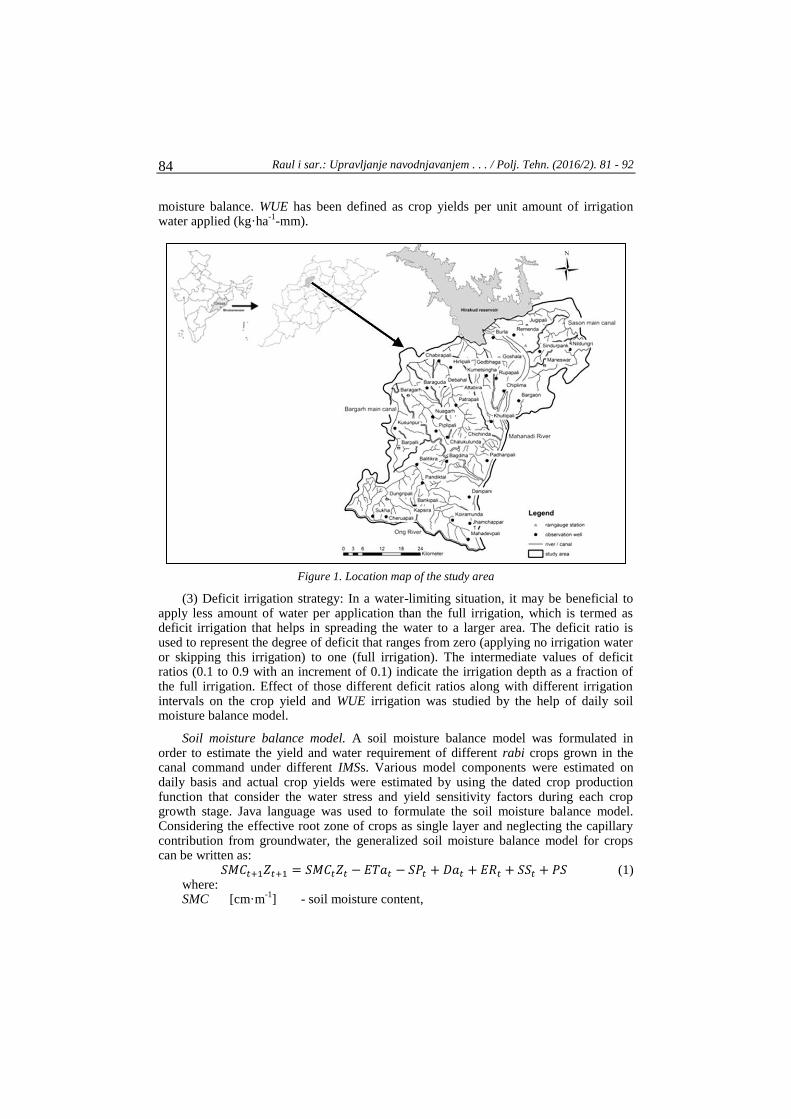
Raul i sar.: Upravljanje navodnjavanjem . . . / Polj. Tehn. (2016/2). 81 - 92 84
moisture balance. WUE has been defined as crop yields per unit amount of irrigation water applied (kg·ha
-1-mm).
Figure 1. Location map of the study area
(3) Deficit irrigation strategy: In a water-limiting situation, it may be beneficial to apply less amount of water per application than the full irrigation, which is termed as deficit irrigation that helps in spreading the water to a larger area. The deficit ratio is used to represent the degree of deficit that ranges from zero (applying no irrigation water or skipping this irrigation) to one (full irrigation). The intermediate values of deficit ratios (0.1 to 0.9 with an increment of 0.1) indicate the irrigation depth as a fraction of the full irrigation. Effect of those different deficit ratios along with different irrigation intervals on the crop yield and WUE irrigation was studied by the help of daily soil moisture balance model.
Soil moisture balance model. A soil moisture balance model was formulated in order to estimate the yield and water requirement of different rabi crops grown in the canal command under different IMSs. Various model components were estimated on daily basis and actual crop yields were estimated by using the dated crop production function that consider the water stress and yield sensitivity factors during each crop growth stage. Java language was used to formulate the soil moisture balance model. Considering the effective root zone of crops as single layer and neglecting the capillary contribution from groundwater, the generalized soil moisture balance model for crops can be written as:
(1) where: SMC [cm·m
-1] - soil moisture content,
Raul et al.: Irrigation Management . . . / Agr. Eng. (2016/2). 81 - 92 85
Eta [cm] - actual evapotranspiration on tth
day, Da [cm] - depth of irrigation applied, SP [cm] - seepage and deep percolation, ER [cm] - effective rainfall, Z [m] - root zone depth, SS [cm] - surface storage or ponding depth, PS [cm] - pre-sowing irrigation, t [days] - time index.
During rabi season, the water requirement for nursery raising and transplanting of rice was taken as 250 mm and for non-rice crops, a pre-sowing irrigation of 40 mm was considered for land preparation [23].
In the soil moisture balance model, the effective root zone of rice (45 cm) and the ponding depth was together considered as a single layered reservoir. A ponding depth of 5 cm was allowed throughout the growing period, except last 15 days before harvesting [26]. Seepage and percolation loss components were together considered as 6 mm/day [4]. For non-rice crops, seepage and percolation loss and surface storage components are zero. Details of the different model components are described below.
Estimation of Model Parameters. Various methods are available to estimate the reference crop evapotranspiration (ET0) [8,1]. However, based on the availability of meteorological data of the study area, the Hargreaves method [15] of estimating ET0 was selected, which is as given below:
(2)
where: ET0 [mm·day
-1] - reference evapotranspiration,
Ra [mm·day-1
] - extraterrestrial radiation, Tmax [°C] - maximum air temperature for a given day, Tmin [°C] - minimum air temperature for a given day, Tmean [°C] - mean air temperature for a given day.
Crop Evapotranspiration. The crop evapotranspiration (ETc) was calculated using the following equation.
(3)
where: ETc [mm·day
-1] - crop evapotranspiration,
Kc [-] - crop coefficient. Kc values of different field crops at the different growing stages were taken from [1],
[7] and [8].
Root Zone Depth. Root depth was modelled using the algorithm developed by [3]. This model describes root depth by a sigmoid development of the roots from planting date until maturity. The empirical model is given by:
(4)
where: Zt [cm] - root depth on t
th day after sowing,
Zmax [cm] - maximum possible root depth, t [days] - day after planting, tm [days] - time for the full development of the root zone. Maximum root depth of different field crops has been reported by [8].
Raul i sar.: Upravljanje navodnjavanjem . . . / Polj. Tehn. (2016/2). 81 - 92 86
Soil Water Depletion Factor. The soil water depletion factor (pt) was computed by the numerical approximation of adjusting p for maximum Etc [1], which is as given below.
(5)
where: ptable [-] - table value of soil water depletion factor of crops.
Effective Rainfall. Several methods of estimating effective rainfall for irrigation scheduling are widely used. Those are based on long experiences and have been found to work quite satisfactorily in specific conditions under which they were developed [1]. For the study area, the effective rainfall for crops other than rice was considered as 70% of the average seasonal rainfall. For rice crop, 50 to 80% of total rainfall was assumed effective [1].
Actual Evapotranspiration. The actual evapotranspiration was estimated by using the linear model as developed by [7].
(6)
Otherwise,
(7)
where: ETat [cm·day
-1] - actual evapotranspiration,
SMCfc [cm·m-1
] - soil moisture content at field capacity, SMCw [cm·m
-1] - soil moisture content at wilting point.
The SMCfc component in Eqs. 6 and 7 has to be replaced by SMCsat (saturated SMC) and the component ETct in both the equations has to be replaced by ETmt (maximum evapotranspiration) for rice crop.
Soil Moisture Depth. Soil moisture depth was calculated as below.
(8)
where: [-] - deficit ratio (fraction). For rice crop, the term SMCfc in Eq. 8 should be replaced by SMCsat and for non-rice
crops, surface storage (SS) equals zero.
Depth of Irrigation and Water Delivery Depth. Further, the depth of irrigation (ID) and the water delivery depth (WD) were calculated by using the equations as given below.
(9)
(10)
where: Ea [-] - application efficiency (fraction), Ec [-] - conveyance efficiency (fraction), Ed [-] - distribution efficiency (fraction). The conveyance, distribution, and application efficiency were assumed to be 70, 70
and 80%, respectively [8].
Actual Crop Yield. The actual crop yield (Ya) was calculated by using the additive approach of the dated water-production function [7].
Raul et al.: Irrigation Management . . . / Agr. Eng. (2016/2). 81 - 92 87
(11)
where: Ym [kg·ha
-1] - potential crop yield,
r [-] - no. of yield stages, Kyr [-] - yield response factor. Ky values of different field crops were taken from [8]. While the Ky values for rice
were considered as 1.1 in initial stage, 1.1 in crop development stage, 2.4 in flowering stage, 2.4 in grain formation stage, and 0.33 in ripening stage [23].
RESULTS AND DISCUSSION
In the present study, five major rabi crops, such as rice, wheat, maize, greengram and mustard, are considered for the development of their corresponding IMSs. Water use efficiency was used as an indicator to compare the performances of different IMSs under consideration.
Deficit Irrigation Strategy. Under the DI strategy, the deficit ratios were considered to range from 0.1 to 1.0 with an increment of 0.1. Deficit ratio of 1.0 indicates that the irrigation is applied to bring the moisture in the root zone to field capacity, whereas deficit ratio of 0.1 indicates 90% reduction in irrigation or the degree of deficit as 90%. The developed ISM was run for the irrigation intervals of 7, 14, 21 and 28 days for non-rice crops and 4, 8 and 12 days for rice crop. The WUE of wheat was found to increase with increase in deficit ratio up to 0.7 for both 7 and 14 days irrigation intervals (Fig. 3a). Beyond this level the WUE was reduced for both the irrigation intervals. There was always increasing trend in WUE for 21 and 28 days irrigation intervals. Maximum WUE was attained at the deficit ratio of 0.7 (30% deficit) and irrigation interval of 14 days. Hence, 30% DI to wheat at an interval of 14 days can be the best IMS under DI strategy.
For maize, the WUE was found to increase with increase in deficit ratio up to 0.7 and 7 days irrigation interval, which then reduced with further increase in deficit ratios (Fig. 3b). At 14 days irrigation interval the WUE was found to increase up to deficit ratio of 0.8 and then reduced. But the WUE of maize at both 21 and 28 days irrigation intervals went on increasing up to the deficit ratio of 0.9. Comparison of WUEs for all the irrigation intervals and deficit ratios showed that 30% DI to maize at an interval of 7 days may be the best IMS under DI strategy. The trend of WUE in case of rice was increasing up to the deficit ratio of 0.8 and 4 days irrigation interval, which was then altered, whereas the trend of WUE was found increasing up to the deficit ratio of 0.9 at both 8 and 12 days irrigation intervals (Fig. 3c). Among all the deficit ratios and irrigation intervals considered, the WUE was highest for 20% DI at 4 days interval that could be taken as the best IMS for rice under DI strategy.
The WUE of greengram was found to increase with increase in deficit ratio up to 0.7 and at 7 days irrigation interval, which then decreased with increase in deficit ratios (Fig. 3d). At 14 days irrigation interval the WUE of greengram was found to increase up to deficit ratio of 0.8 and then reduced. But at both 21 and 28 days irrigation intervals, the WUE followed the increasing trend up to the deficit ratio of 0.9 and then decreased. Comparison of WUEs at various deficit ratios and irrigation intervals revealed highest WUE for 20% DI at 14 days interval. Hence, it may be considered as the best IMS for
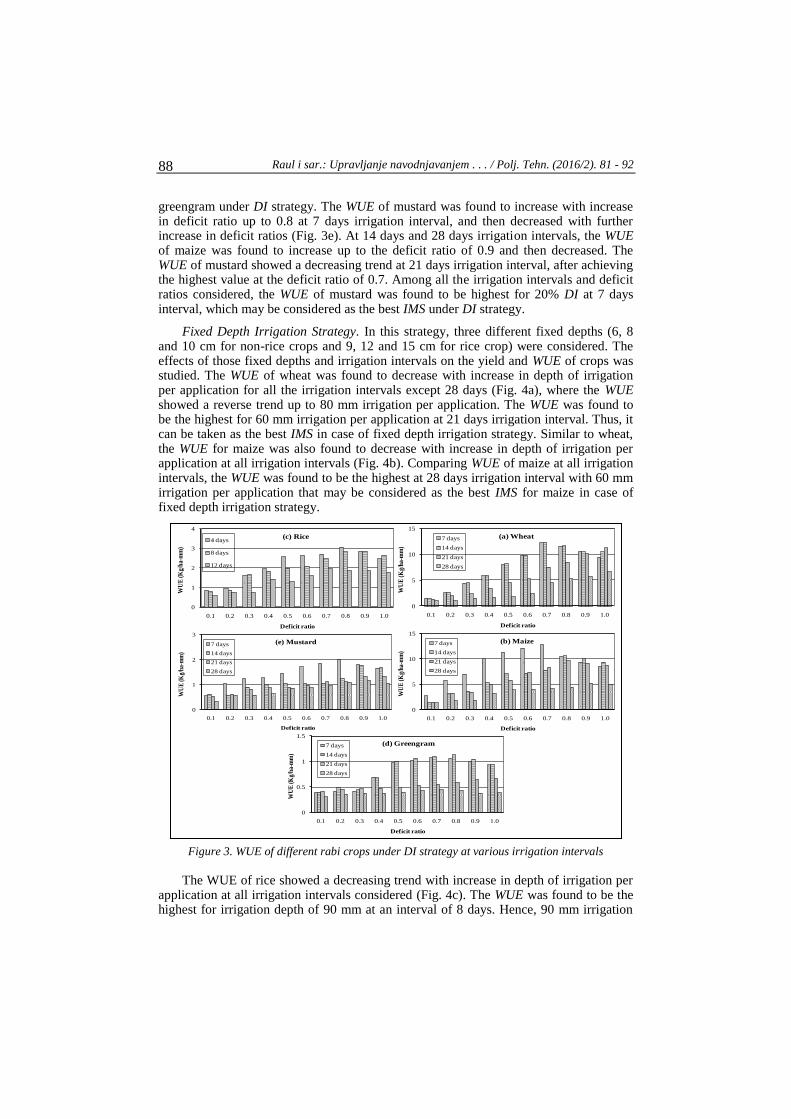
Raul i sar.: Upravljanje navodnjavanjem . . . / Polj. Tehn. (2016/2). 81 - 92 88
greengram under DI strategy. The WUE of mustard was found to increase with increase in deficit ratio up to 0.8 at 7 days irrigation interval, and then decreased with further increase in deficit ratios (Fig. 3e). At 14 days and 28 days irrigation intervals, the WUE of maize was found to increase up to the deficit ratio of 0.9 and then decreased. The WUE of mustard showed a decreasing trend at 21 days irrigation interval, after achieving the highest value at the deficit ratio of 0.7. Among all the irrigation intervals and deficit ratios considered, the WUE of mustard was found to be highest for 20% DI at 7 days interval, which may be considered as the best IMS under DI strategy.
Fixed Depth Irrigation Strategy. In this strategy, three different fixed depths (6, 8 and 10 cm for non-rice crops and 9, 12 and 15 cm for rice crop) were considered. The effects of those fixed depths and irrigation intervals on the yield and WUE of crops was studied. The WUE of wheat was found to decrease with increase in depth of irrigation per application for all the irrigation intervals except 28 days (Fig. 4a), where the WUE showed a reverse trend up to 80 mm irrigation per application. The WUE was found to be the highest for 60 mm irrigation per application at 21 days irrigation interval. Thus, it can be taken as the best IMS in case of fixed depth irrigation strategy. Similar to wheat, the WUE for maize was also found to decrease with increase in depth of irrigation per application at all irrigation intervals (Fig. 4b). Comparing WUE of maize at all irrigation intervals, the WUE was found to be the highest at 28 days irrigation interval with 60 mm irrigation per application that may be considered as the best IMS for maize in case of fixed depth irrigation strategy.
Figure 3. WUE of different rabi crops under DI strategy at various irrigation intervals
The WUE of rice showed a decreasing trend with increase in depth of irrigation per
application at all irrigation intervals considered (Fig. 4c). The WUE was found to be the highest for irrigation depth of 90 mm at an interval of 8 days. Hence, 90 mm irrigation
0
1
2
3
4
0.1 0.2 0.3 0.4 0.5 0.6 0.7 0.8 0.9 1.0
WU
E (K
g/h
a-m
m)
Deficit ratio
(c) Rice4 days
8 days
12 days
0
5
10
15
0.1 0.2 0.3 0.4 0.5 0.6 0.7 0.8 0.9 1.0
WU
E (K
g/h
a-m
m)
Deficit ratio
(a) Wheat7 days
14 days
21 days
28 days
0
1
2
3
0.1 0.2 0.3 0.4 0.5 0.6 0.7 0.8 0.9 1.0
WU
E (K
g/h
a-m
m)
Deficit ratio
(e) Mustard7 days
14 days
21 days
28 days
0
5
10
15
0.1 0.2 0.3 0.4 0.5 0.6 0.7 0.8 0.9 1.0
WU
E (K
g/h
a-m
m)
Deficit ratio
(b) Maize7 days
14 days
21 days
28 days
0
0.5
1
1.5
0.1 0.2 0.3 0.4 0.5 0.6 0.7 0.8 0.9 1.0
WU
E (K
g/h
a-m
m)
Deficit ratio
(d) Greengram7 days
14 days
21 days
28 days

Raul et al.: Irrigation Management . . . / Agr. Eng. (2016/2). 81 - 92 89
per application to rice at an interval of 8 days can be followed as the best IMS for rice under the fixed depth irrigation strategy. The WUE for greengram decreased with increase in depth of irrigation per application at all irrigation intervals except 28 days (Fig. 4d), where the WUE first increased and then decreased. Comparing WUE of greengram at all irrigation intervals, it was found that the WUE was highest for 60 mm irrigation per application at 21 days interval. Thus, 60 mm irrigation per application at 21 days interval can be the best IMS for greengram in case of fixed depth irrigation strategy. At all irrigation intervals, the WUE of mustard was found to decrease with increase in depth of irrigation per application (Fig. 4e). However, the WUE was highest under 60 mm irrigation per application at 28 days interval, which may be taken as the best IMS for mustard in case of fixed depth irrigation strategy.
Figure 4. WUE of different rabi crops under fixed depth IMS at various irrigation intervals
CONCLUSIONS
In the above section, best IMSs of various crops separately under fixed depth application and deficit irrigation at different intervals are presented. However, it is essential to compare the crop-wise IMSs for both DI and fixed depth application strategy so as to evolve the best IMSs of crops giving highest WUE. Optimum IMS of each crop was found out by comparing the best IMSs under full irrigation, deficit irrigation and fixed depth application. It was found that 30% DI to wheat at an interval of 14 days is the most efficient IMS and the best IMS for maize is to irrigate with 30% DI at an interval of 7 days. Irrigating rice with 20% DI at an interval of 4 days is the efficient IMS and the most effective IMS for greengram is to apply 60 mm of water per irrigation at an
0
5
10
15
20
60 80 100
WU
E (
Kg/h
a-m
m)
Depth of irrigation per application (mm)
(a) Wheat7 days 14 days 21 days 28 days
0
1
2
3
4
90 120 150
WU
E (
Kg/h
a-m
m)
Depth of irrigation per application (mm)
(c) Rice4 days 8 days 12 days
0
5
10
15
60 80 100
WU
E (K
g/h
a-m
m)
Depth of irrigation per application (mm)
(b) Maize7 days 14 days 21 days 28 days
0
1
2
3
60 80 100
WU
E (K
g/h
a-m
m)
Depth of irrigation per application (mm)
(e) Mustard7 days 14 days 21 days 28 days
0.0
0.5
1.0
1.5
2.0
60 80 100
WU
E (K
g/h
a-m
m)
Depth of irrigation per application (mm)
(d) Greengram7 days 14 days 21 days 28 days
Raul i sar.: Upravljanje navodnjavanjem . . . / Polj. Tehn. (2016/2). 81 - 92 90
interval of 21 days. Mustard gives maximum WUE when it is irrigated with 20% DI at an interval of 7 days.
Since agricultural area is diminishing day by day due to ever increasing population and rapid industrialization, hence, it is inevitable to grow more to earn more from the limited land and water resources. It can be seen from the above results that deficit irrigation practice can be a viable option to achieve better WUE under water limiting environments. Hence, the crop-wise irrigation management strategies as presented above may be adopted by the beneficiaries of the selected canal command area during rabi season so as to bring more area under crops, which in turn will enhance the production potential of the command area.
BIBLIOGRAPHY
[1] Allen, R.G., Pereira, L.S., Raes, D., Smith, M. 1998. Crop evapotranspiration: Guidelines for
predicting crop water requirements. Irrigation and Drainage paper, No. 56, FAO, United
Nations, Rome, Italy.
[2] Aydinsakir, K., Erdal, S., Buyuktas, D., Bastug, R., Toker, R. 2013. The influence of regular
deficit irrigation applications on water use, yield and quality components of two corn (Zea
Mays L.) genotypes. Agricultural Water Management, 128: 65–71.
[3] Borg, H., Grimes, D.W. 1986. Depth development of roots with time: An empirical
description. Transactions of the ASAE, 29(1): 194–197.
[4] CGWB. 1998. Studies on conjunctive use of surface and groundwater resources in Hirakud
irrigation project, Orissa. Central Ground Water Board, Ministry of Water Resources, Govt.
of India.
[5] Domínguez, A., Jiménez, M., Tarjuelo, J.M., de Juan, J.A., Martínez-Romero, A., Leite, K.N.
2012. Simulation of onion crop behavior under optimized regulated deficit irrigation using
MOPECO model in a semi-arid environment. Agricultural Water Management, 113: 64–75.
[6] Domínguez, A., Tarjuelo, J.M., de Juan, J.A., López-Mata, E., Breidy, J., Karam, F. 2011.
Deficit irrigation under water stress and salinity conditions: the MOPECO-salt model.
Agricultural Water Management, 98(9): 1451–1461.
[7] Doorenbos, J., Kassam, A. H. 1979. Yield response to water. Irrigation and Drainage paper,
No. 33, FAO, United Nations, Rome, Italy.
[8] Doorenbos, J., Pruitt, W. O. 1977. Crop water requirements. Irrigation and Drainage paper,
No. 24, FAO, United Nations, Rome, Italy.
[9] Du, T., Kang, S., Sun, J., Zhang, X., Zhang, J. 2010. An improved water use efficiency of
cereals under temporal and spatial deficit irrigation in north China. Agricultural Water
Management, 97(1): 66–74.
[10] English, M., Nuss, G. S. 1982. Designing for deficit irrigation. Journal of Irrigation and
Drainage Division, 108(2): 91–106.
[11] Ertek, A., Kara, B. 2013. Yield and quality of sweet corn under deficit irrigation. Agricultural
Water Management, 129: 138–144.
[12] Fang, Q., Ma, L., Yu, Q., Ahuja, L.R., Malone, R.W., Hoogenboom, G. 2010. Irrigation
strategies to improve the water use efficiency of wheat–maize double cropping systems in
north China plain. Agricultural Water Management, 97(8): 1165–1174.

Raul et al.: Irrigation Management . . . / Agr. Eng. (2016/2). 81 - 92 91
[13] Gorantiwar, S.D., Smout, I.K. 2006. Productivity and equity of different irrigation schedules
under limited water supply. Journal of Irrigation and Drainage Engineering, ASCE, 132(4):
349–358.
[14] Hargreaves, G.H., Samani, Z.A. 1984. Economic considerations of deficit irrigation. Journal
of Irrigation and Drainage Engineering, ASCE, 110(4): 343–358.
[15] Hargreaves, G.H., Samani, Z.A. 1985. Reference crop evapotranspiration from temperature.
Applied Engineering in Agriculture, 1: 96–99.
[16] IPCC. 2007. Climate change: Impacts, adaptation and vulnerability. Fourth Assessment
Report of IPCC Working Group II. Cambridge, UK.
[17] Karimi, P., Qureshi, A.S., Bahramloo, R., Molden, D. 2012. Reducing carbon emissions
through improved irrigation and groundwater management: A case study from Iran.
Agricultural Water Management, 108: 52–60.
[18] Mushtaq, S., Moghaddasi, M. 2011. Evaluating the potentials of deficit irrigation as an
adaptive response to climate change and environmental demand. Environmental Science
Policy, 14(8): 1139–1150.
[19] Patanè, B., Tringali, S., Sortino, O. 2011. Effects of deficit irrigation on biomass, yield, water
productivity and fruit quality of processing tomato under semi-arid mediterranean climate
conditions. Scientia Horticulture, 129(4): 590–596.
[20] Quanqi, L., Xunbo, Z., Yuhai, C., Songlie, Y. 2012. Water consumption characteristics of
winter wheat grown using different planting patterns and deficit irrigation regime.
Agricultural Water Management, 105: 8–12.
[21] Sarkar, S., Basu, B., Kundu, C.K., Patra, P.K. 2012. Deficit irrigation: an option to mitigate
arsenic load of rice grain in West Bengal, India. Agriculture, Ecosystem and Environment,
146(1): 147–152.
[22] Shangguan, Z., Shao, M., Horton, R., Lei, T., Qin, L., Ma, J. 2002. A model for regional
optimal allocation of irrigation water resources under deficit irrigation and its applications.
Agricultural Water Management, 52(2): 139–154.
[23] Srinivasa, A.P., Umamahesh, N.V., Viswanath, G.K. 2006. Optimal irrigation planning under
water scarcity. Journal of Irrigation and Drainage Engineering, ASCE, 132(3): 228–237.
[24] Tejero, I.G., Zuazo, V.H.D., Bocanegra, J.A.J., Fernández, J.L.M. 2011. Improved water-use
efficiency by deficit-irrigation programmes: implications for saving water in citrus orchards.
Scientia Horticulture, 128(3): 274–282.
[25] Trimmer, W.L. 1990. Applying Partial Irrigation in Pakistan. Journal of Irrigation and
Drainage Engineering, ASCE, 116(3): 342–353.
[26] Tyagi, N.K., Singh, O.P., Dhruvanarayana, V.V. 1979. Evaluation of water management
systems in a tubewell irrigated farm. Agricultural Water Management, 2(1): 67–78.
[27] Wolff, P., Stein, T.-M., 1999. Efficient and economic use of water in agriculture-possibilities
and limits. Natural Resources Development, 49/50: 151–159.
[28] Zou, X., Li, Y., Gao, Q., Wan, Y. 2012. How water saving irrigation contributes to climate
change resilience – a case study of practices in China. Mitigation and Adaptation Strategies
for Global Change, 17(2): 111–132.
Raul i sar.: Upravljanje navodnjavanjem . . . / Polj. Tehn. (2016/2). 81 - 92 92
UPRAVLJANJE NAVODNJAVANJEM NE-MONSUNSKIH USEVA U OBLASTI GLAVNOG KANALA U ISTOČNOJ INDIJI, U USLOVIMA OGRANIČENOG
SNABDEVANJA VODOM
Sanjay K. Raul1, Tanaya A. Shinde
2, Sudhindra N. Panda
2
1Poljoprivredni univerzitet Anand, Fakultet za poljoprivrednu tehniku i tehnologiju,
Institut za zemljište i vodu, Godhra, Gujarat, India 2Indijski institute za tehnologiju, Odsek za poljoprivrednu tehniku, Kharagpur,
West Bengal, India
Sažetak: Izražen nedostatak vode u ne-monsunskom periodu (rabi) u oblasti Hirakud kanala i istočnoj Indiji zahteva efikasne strategije upravljanja navodnjavanjem (IMSs). Ovo istraživanje je sprovedeno radi analize uticaja različitih IMS – punog i defcictarnog navodnjavanja i različitih rabi useva na efikasnost upotrebe vode i razvoja najefikasnije IMS. Različiti parametri bilansa vode su ocenjivani na dnevnoj bazi i izračunati su stvarni prinosi za pet glavnih rabi useva. Najbolje IMS za pšenicu, kukuruz, pirinač, zlatni pasulj i slačica imale su 30% deficita navodnjavanja u periodima od 14 dana, 30% deficita navodnjavanja u periodima od 7 dana, 20% deficita navodnjavanja u periodima od 4 dana, 60 mm vode po aplikaciji i u periodima od 21 dan i 20% deficita navodnjavanja u periodima od 7 dana, redom. Imajući u vidu siromašne izvore vode i stalno rastuću populaciju, veoma je neophodno primeniti ove strategije sa ciljem dobijanja veće obradive površine i unapređenja proizvodnog potencijala ove oblasti.
Ključne reči: deficit navodnjavanja, primena na stalnu dubinu, balans zemljišne vlage, efikasnost upotrebe vode
Prijavljen: Submitted:
04.08.2015.
Ispravljen: Revised:
08.08.2015.
Prihvaćen: Accepted:
12.04.2016.

Univerzitet u Beogradu Poljoprivredni fakultet Institut za poljoprivrednu tehniku
Naučni časopis POLJOPRIVREDNA TEHNIKA
Godina XLI Broj 2, 2016. Strane: 93 – 100
University of Belgrade Faculty of Agriculture
Institute of Agricultural Engineering
Scientific Journal AGRICULTURAL ENGINEERING
Year XLI No. 2, 2016. pp: 93 – 100
UDK: 637.52 Originalni naučni rad
Original scientific paper
FOURIER TRANSFORM – NEAR INFRARED SPECTROSCOPY FOR RAPID AND NONDESTRUCTIVE MEASUREMENT OF
AMYLOSE CONTENT OF PADDY
Ravi Pandiselvam1*
, Venkatachalam Thirupathi2, Palanisamy Vennila
3
1ICAR –Central Plantation Crops Research Institute,
Physiology, Biochemistry and Post Harvest Technology Division, Kerala, India 2Tamil Nadu Agricultural University,
Dryland Agricultural Research Station, Chettinad – 630 102, India 3Tamil Nadu Agricultural University,
Post Harvest Technology Centre, Coimbatore , India
Abstract: The quality and quantity of amylose are two important factors that determine the quality of paddy. The feasibility of developing a technique for rapid monitoring of paddy quality by using Fourier Transform - Near Infrared (FT-NIR) Spectroscopy combined with chemometrics was investigated. Spectra of 250 paddy samples were collected by using an integrating sphere accessory. The amylose content was analyzed by reference method. It ranged from 13.24 to 27.93%. The spectral data was analyzed by partial least squares (PLS) algorithm and calibration model generated. Correlation coefficient (R
2) for the calibration model was >0.78 with root mean square
error of estimation (RMSEE) < 1.8. The validation model had R2> 0.72 and root mean
square error of cross-validation (RMSECV) < 2. FT-NIR spectroscopy identified samples containing amylose at 5184 and 6834 cm
-1 wave number. A fast, simple and accurate
method to quantify the amylose of paddy was developed by using FT-NIR spectroscopy.
Key words: paddy, amylose, chemometrics, FT-NIR spectroscopy, calibration
INTRODUCTION
Paddy is one of the staple food crops in India. ADT 43 is the most popular paddy variety grown in all the parts of Tamil Nadu, the reason behind that of ADT 43 are resistant to stem borer and gall midge, high tillering and fine rice [1,2]. About 70% of the paddy produced in India is stored at farm level. A small proportion of paddy is used as an ingredient in processed foods and as feed but the bulk is consumed as cooked rice.
* Corresponding author. E-mail: [email protected]
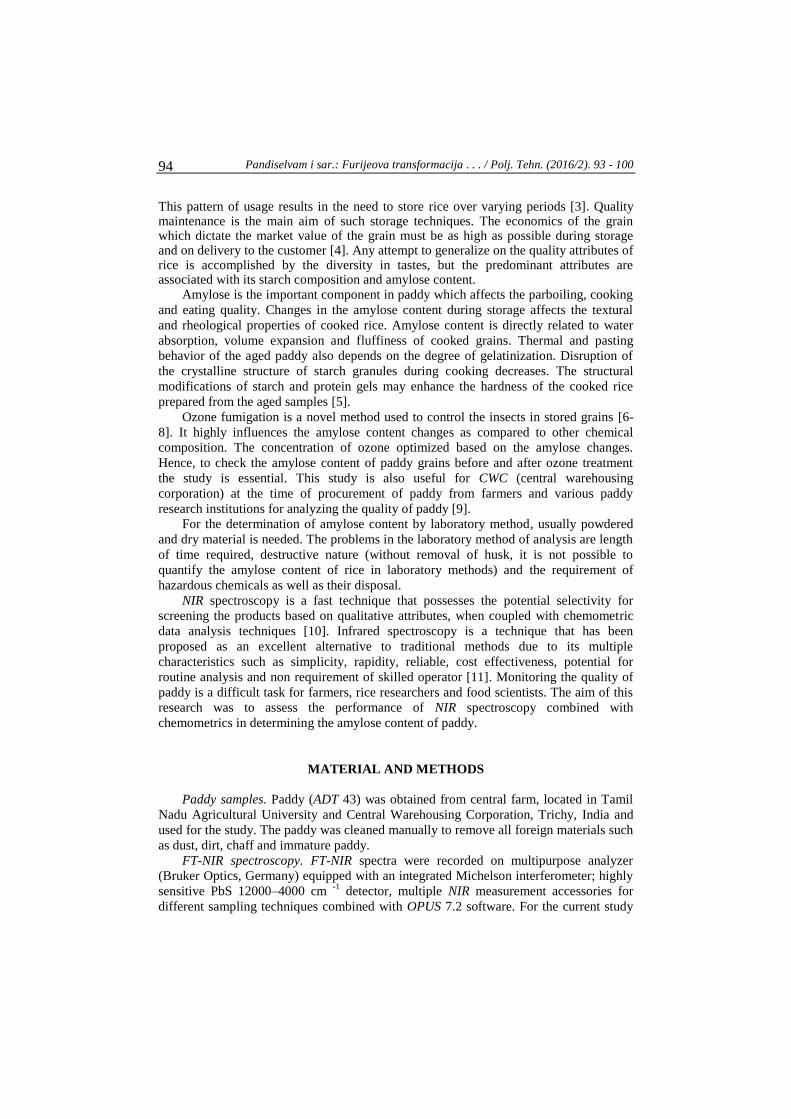
Pandiselvam i sar.: Furijeova transformacija . . . / Polj. Tehn. (2016/2). 93 - 100 94
This pattern of usage results in the need to store rice over varying periods [3]. Quality maintenance is the main aim of such storage techniques. The economics of the grain which dictate the market value of the grain must be as high as possible during storage and on delivery to the customer [4]. Any attempt to generalize on the quality attributes of rice is accomplished by the diversity in tastes, but the predominant attributes are associated with its starch composition and amylose content.
Amylose is the important component in paddy which affects the parboiling, cooking
and eating quality. Changes in the amylose content during storage affects the textural
and rheological properties of cooked rice. Amylose content is directly related to water
absorption, volume expansion and fluffiness of cooked grains. Thermal and pasting
behavior of the aged paddy also depends on the degree of gelatinization. Disruption of
the crystalline structure of starch granules during cooking decreases. The structural
modifications of starch and protein gels may enhance the hardness of the cooked rice
prepared from the aged samples [5].
Ozone fumigation is a novel method used to control the insects in stored grains [6-
8]. It highly influences the amylose content changes as compared to other chemical
composition. The concentration of ozone optimized based on the amylose changes.
Hence, to check the amylose content of paddy grains before and after ozone treatment
the study is essential. This study is also useful for CWC (central warehousing
corporation) at the time of procurement of paddy from farmers and various paddy
research institutions for analyzing the quality of paddy [9].
For the determination of amylose content by laboratory method, usually powdered
and dry material is needed. The problems in the laboratory method of analysis are length
of time required, destructive nature (without removal of husk, it is not possible to
quantify the amylose content of rice in laboratory methods) and the requirement of
hazardous chemicals as well as their disposal.
NIR spectroscopy is a fast technique that possesses the potential selectivity for
screening the products based on qualitative attributes, when coupled with chemometric
data analysis techniques [10]. Infrared spectroscopy is a technique that has been
proposed as an excellent alternative to traditional methods due to its multiple
characteristics such as simplicity, rapidity, reliable, cost effectiveness, potential for
routine analysis and non requirement of skilled operator [11]. Monitoring the quality of
paddy is a difficult task for farmers, rice researchers and food scientists. The aim of this
research was to assess the performance of NIR spectroscopy combined with
chemometrics in determining the amylose content of paddy.
MATERIAL AND METHODS
Paddy samples. Paddy (ADT 43) was obtained from central farm, located in Tamil
Nadu Agricultural University and Central Warehousing Corporation, Trichy, India and
used for the study. The paddy was cleaned manually to remove all foreign materials such
as dust, dirt, chaff and immature paddy.
FT-NIR spectroscopy. FT-NIR spectra were recorded on multipurpose analyzer
(Bruker Optics, Germany) equipped with an integrated Michelson interferometer; highly
sensitive PbS 12000–4000 cm -1
detector, multiple NIR measurement accessories for
different sampling techniques combined with OPUS 7.2 software. For the current study

Pandiselvam et al.: Fourier Transform . . . / Agr. Eng. (2016/2). 93 - 100 95
spectra’s were collected in diffuse reflectance mode with sphere macro sample
integrating sphere measurement channel. The spectra were acquired in reflectance mode
directly on the paddy, over the range 12000–4000 cm-1
. Spectra of 250 paddy samples
were collected for calibration by using an integrating sphere accessory. For each
sampling, 5 g of paddy were analyzed at room temperature and the average spectra were
used for further evaluations [9].
Destructive method of estimation of amylose content in paddy. The amylose contents
(% w/w) from grains were determined by the spectrophotometric standard method [12].
A total of 100 mg of granules was homogenized with 1 ml of 95% ethanol and 9 ml of 1
M NaOH. The sample was heated for 10 min. in a boiling-water bath to gelatinize the
starch. After cooling, it was transferred into a volumetric flask and the volume was made
up to 100 ml with water. Then 1 ml of 1 M acetic acid and 2 ml of iodine solution (0.2%
I2, 2% KI) were added to a 5-ml aliquot. The solution was made up to 100 ml with water
and allowed to stand for 10 min. Spectrophotometric quantification was performed at
620 nm, with a spectrophotometer, using the multipoint working curve method with two
repetitions and quartz cells of 10 mm path length. Two determinations were made on
separate test portions taken from the same sample in each of the replicates. The apparent
amylose content was calculated using an equation obtained from the standard curve.
Preprocessing methods. In this study, three data preprocessing methods were
applied comparatively; these were vector normalization, first derivative and first
derivative plus vector normalization. Each spectrum is corrected individually by first
centering the spectral value. Then, the centered spectrum is scaled by the standard
deviation calculated from the individual spectral values. Vector normalization
normalizes a spectrum by first calculating the average intensity value and subsequent
subtraction of this value from the spectrum. First derivative eliminate baseline drifts and
small spectral differences are enhanced [9].
Data analysis. The OPUS software 7.2 was used for processing the data and FT-NIR
models were developed with the full calibration data set. The spectral data were analyzed
using PLS regression with various preprocessing techniques.
The performance of final PLS model was evaluated in terms of coefficient
of determination (R2) and root mean square error of cross validation (RMSECV).
The accuracy of the calibration models is obtained according to the highest values of R2
and lowest RMSECV and RMSEP values.
2
Re sidualSSE
(1)
where:
Residual [-] - experimental value / predicted value.
The coefficient of determination (R2) gives the proportion of variability of the
property that is described by the model.
10012
2
mi yy
SSER
(2)
where:
yi = iih
[-] - observation of experimental value,
ym [-] - mean of the reference results for all samples.
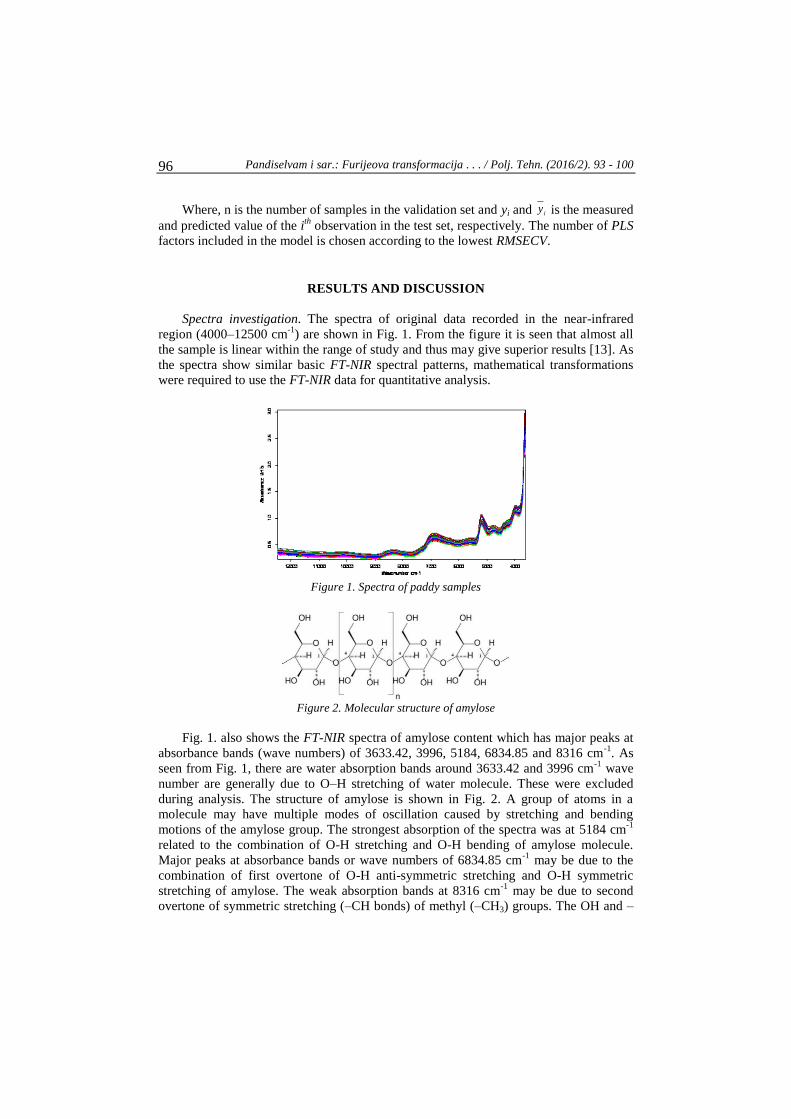
Pandiselvam i sar.: Furijeova transformacija . . . / Polj. Tehn. (2016/2). 93 - 100 96
Where, n is the number of samples in the validation set and yi and iy is the measured
and predicted value of the ith
observation in the test set, respectively. The number of PLS
factors included in the model is chosen according to the lowest RMSECV.
RESULTS AND DISCUSSION
Spectra investigation. The spectra of original data recorded in the near-infrared
region (4000–12500 cm-1
) are shown in Fig. 1. From the figure it is seen that almost all
the sample is linear within the range of study and thus may give superior results [13]. As
the spectra show similar basic FT-NIR spectral patterns, mathematical transformations
were required to use the FT-NIR data for quantitative analysis.
Figure 1. Spectra of paddy samples
Figure 2. Molecular structure of amylose
Fig. 1. also shows the FT-NIR spectra of amylose content which has major peaks at
absorbance bands (wave numbers) of 3633.42, 3996, 5184, 6834.85 and 8316 cm-1
. As
seen from Fig. 1, there are water absorption bands around 3633.42 and 3996 cm-1
wave
number are generally due to O–H stretching of water molecule. These were excluded
during analysis. The structure of amylose is shown in Fig. 2. A group of atoms in a
molecule may have multiple modes of oscillation caused by stretching and bending
motions of the amylose group. The strongest absorption of the spectra was at 5184 cm-1
related to the combination of O-H stretching and O-H bending of amylose molecule.
Major peaks at absorbance bands or wave numbers of 6834.85 cm-1
may be due to the
combination of first overtone of O-H anti-symmetric stretching and O-H symmetric
stretching of amylose. The weak absorption bands at 8316 cm-1
may be due to second
overtone of symmetric stretching (–CH bonds) of methyl (–CH3) groups. The OH and –

Pandiselvam et al.: Fourier Transform . . . / Agr. Eng. (2016/2). 93 - 100 97
CH bond vibrations are caused by ingredients such as amylose, protein and water
compounds. The frequency that characterizes the stretching vibration of a given bond is
proportional to the bond dissociation energy.
Chemometric analysis. The NIR spectra were transformed to its first-derivative
using PLS function. The transformed spectra were cross-validated to generate calibration
models. Cross validation was also done to check the calibrated values are shown in Fig.
3 and 4. It has been reported that the number of samples to develop the calibration model
should cover the desired quantitation range for the specific analyses, with a minimum of
20–50 samples depending on the complexity of the problem [14]. Generally large
calibration data sets are preferable, because they will provide more accuracy about the
variability expected in validation samples. However large number of samples implies
that it will take more time and chemical to create the model. Typically open calibration
curves are developed, meaning that there is always the possibility to add more data
points into the calibration curve to make it more robust [10].
Figure 3. Calibration model of amylose
Fig.4. Validation model of amylose
Models were evaluated in terms of correlation coefficient (R2), root mean square
error of estimation (RMSEE) and root mean square error of cross validation (RMSECV).
Figs. 5, 6 and 7 shows the R2, RMSECV and RMSEE values plotted as a function of PLS
factors for determining amylose content of paddy with first derivative and vector
normalization method as the pre-processing technique. Seen from Fig. 5, R2 value
increased and reached an optimum value at PLS factor 10. RMSECV value decreases
sharply up to the PLS recording rank of 8 and increased slightly as PLS factor increases

Pandiselvam i sar.: Furijeova transformacija . . . / Polj. Tehn. (2016/2). 93 - 100 98
from 8 to 10 (Fig. 6). Fig. 7 shows the RMSEE value decreases sharply, if PLS factor
increased from 1 to 10 and reached a minimum value at PLS factor 10. If PLS factor
increases it increase the R2 value and decrease the RMSECV and RMSEE values. The
optimum number of factors is determined by the lowest RMSECV and RMSEE values
and highest values for R2. From the Figs. 5, 6 and 7, conform that initial PLS factor had
high impact on R2, RMSECV and RMSEE values.
Figure 5. R2 value as a function of PLS factor
Figure 6. RMSECV value as a function of PLS factor
Figure 7. RMSEE value as a function of PLS factor
PLS regression method gave R2 and RMSECV values of 78.6 and 1.99, respectively.
Correlation coefficient (R2) indicates the strength and direction of the linear relationship
between predicted values and reference values [15]. Ratio of standard deviation to
standard error of prediction gives RPD (residual predictive deviation) value. RPD value

Pandiselvam et al.: Fourier Transform . . . / Agr. Eng. (2016/2). 93 - 100 99
was more than 1.8. If RPD value lower than 1.5 is considered insufficient for most
applications while NIR cross validation models with values greater than two is
considered excellent [16]. The results of this study clearly indicate the efficiency of FT-
NIR for this application.
CONCLUSIONS
An ozone treated paddy grains (ADT 43) amylose content was tested using FT-
NIRS. NIR spectroscopy technique has potential to quantify the amylose from paddy. A fast, simple and accurate method for determination of amylose was demonstrated by using NIR spectroscopy at a low cost. It allowed for faster sample preparation and ease of use as compared to laboratory method. The total time required for sample preparation and analysis was less than 2 minutes, compared to 16 h required for amylose content determination by reference method. The overall results demonstrate that FT-NIR spectroscopy with PLS factor calibration could be successfully applied as a rapid method for quantification of amylose of paddy. It might be an application for paddy quality monitoring in the Central Warehousing Corporation, Food Corporation of India and various rice research stations by using FT-NIR spectroscopy.
BIBLIOGRAPHY
[1] Ravi, P., Venkatachalam, T. 2014. Important engineering properties of paddy. Poljoprivredna
tehnika, 39(4), 73-83.
[2] Pandiselvam, R., Thirupathi, V., Mohan, S. 2015. Engineering properties of
rice. Poljoprivredna tehnika, 2015/3, p.p. 69–78.
[3] Zhou, K., Robards, S., Helliwell, Blanchard, C. 2001. Ageing of Stored Rice: Changes in
Chemical and Physical Attributes. J. Cereal Sci., 33, 1-15.
[4] Wrigley, C.W., Gras, P.W., Bason, M.L. 1994. Maintenance of grain quality during storage –
prediction of the conditions and period of safe storage. Proceedings of the 6 th international
working conference on stored product protection, 2, 666-670.
[5] Tananuwong, K., Malila, Y. 2011. Changes in physicochemical properties of organic hulled
rice during storage under different conditions. Food Che., 125, 179–185.
[6] Pandiselvam, R., Thirupathi, V. 2015. Reaction kinetics of Ozone gas in Green gram (Vigna
radiate). Ozone: Science & Engineering, 37, 1-7.
[7] Ravi, P., Venkatachalam, T., Rajamani, M. 2015. Decay Rate kinetics of Ozone Gas in Rice
Grains. Ozone: Science & Engineering, Vol. 37, Issue 5, 2015.
[8] Pandiselvam, R., Thirupathi, V., Anandakumar, S. 2015. Reaction Kinetics of Ozone Gas in
Paddy Grains. Journal of Food Process Engineering. Vol. 38/6, p.p. 594–600.
[9] Ravi, P., Venkatachalam, T., Palanisamy, V. 2014. Fourier transform near-infrared
spectroscopy for nondestructive and rapid measurement of moisture content of
paddy. Poljoprivredna tehnika, 39(3), 31-40.
[10] Shiroma, C., Rodriguez-Saona, L. 2009. Application of NIR and MIR spectroscopy in quality
control of potato chips. J. Food Composition and Analysis, 22, 596–605.
[11] Karoui, R., Mounem, A., Dufour, E., Pillonel, L., Shcaller, E., Picque, D. 2006. A
comparison and joint use of NIR and MIR spectroscopic methods for the determination of

Pandiselvam i sar.: Furijeova transformacija . . . / Polj. Tehn. (2016/2). 93 - 100 100
some parameters in European Emmental cheese. European Food Research and Tech., 223,
44–50.
[12] ISO. 1987. International Organization for Standardization (ISO) 6647. International
Organization for Standardization, Geneva
[13] Jha, S.N. 2007. Nondestructive Determination Sweetness of Orange Juice using Portable Near
Infrared Spectroscopy. J. Agr. Eng., 44(3), 10-14.
[14] Chen, C., Cai, W., Shao, X. 2007. An Adaptive for selecting representative calibration
samples in the continuous wavelet domain for near-infrared spectral analysis. Analytical and
Bio analytical Che., 387, 1041–1048.
[15] Segtnan, V.H., Isaksson, T. 2000. Evaluating near infrared techniques for quantitative
analysis of carbohydrates in fruit juice model systems. J. Near Infrared Spect., 8, 109–116.
[16] Chang, C.W., Laird, D.A., Mausbach, M..J., Hurburgh, C.R. 2001. Near infrared reflectance
spectroscopy-principal component analysis of soil properties. Soil Sci. Soc. Am., 65, 480–490.
FURIJEOVA TRANSFORMACIJA - SPEKTROSKOPIJA U BLISKOJ
INFRACRVENOJ OBLASTI ZA BRZO I NEDESTRUKTIVNO MERENJE
SADRŽAJA AMILOZE U ZRNU PIRINČA
Ravi Pandiselvam1, Venkatachalam Thirupathi, Palanisamy Vennila
2
1ICAR –Centralni institut za istraživanje plantažnih kultura,
Odsek za fiziologiju, biohemiju i postžetvenu tehnologiju, Kerala, India 2 Poljoprivredni Univerzitet Tamil Nadu,
Istraživačka stanica za sušna zemljišta, Chettinad – 630 102, India 3 Poljoprivredni Univerzitet Tamil Nadu,
Centar za postžetvenu tehnologiju, Coimbatore , India
Sažetak: Kvalitet i kvantitet amiloze su dva značajna faktora koja određuju kvalitet
pirinča. Ovede je razvijena tehnika brzog merenja kvaliteta pirinča upotrebom Furijeove
transformacije – spektroskopije u bliskoj IR oblasti kombinovane sa hemometrijom.
Analiziran je spektar 250 uzoraka pirinča integrisanim svernim uređajem. Sadržaj
amiloze iznosio je 13.24 do 27.93%. Spektralni podaci su analizirani algoritmom
parcijalnih najmanjijh kvadrata i generisan je kalibracioni model. Koeficijent korelacije
bio je >0.78 sa srednjim kvadratom odstupanja < 1.8. Validacioni model imao je R2>
0.72 i srednji kvadrat odstupanja unakrsne procene < 2. FT-NIR spektroskopijom su
identifikovani uzorci koji sadrže amilozu sa talasnim brojevima 5184 i 6834 cm-1
. Tako
je razvijen brz, jednostavan i pouzdan metod određivanja sadržaja amiloze.
Ključne reči: pirinač, amiloza, hemometrija, FT-NIR spektroskopija, kalibracija
Prijavljen:
Submitted: 03.09.2015.
Ispravljen:
Revised:
Prihvaćen:
Accepted: 19.03.2016.
CIP – Каталогизација у публикацији Народна библиотека Cрбије, Београд
631(059)
ПОЉОПРИВРЕДНА техника : научни часопис = Agricultural engineering : scientific journal / главни и одговорни уредник Горан Тописировић. – Год. 1, бр. 1 (1963)- . - Београд; Земун : Институт за пољопривредну технику, 1963- (Београд : Штампарија ”Академска издања”) . – 25 cm Тромесечно. – Прекид у излажењу од 1987-1997. године ISSN 0554-5587 = Пољопривредна техника COBISS.SR-ID 16398594